
The automotive industry in Sweden - Vinnova · The automotive industry in Sweden A ... overall...
54
Göteborg Malmö Mölndal Skövde Köping Stockholm Södertälje VINNOVA ANALYSIS VA 2017:04 The automotive industry in Sweden A cluster study hans pohl - rise viktoria ab
Transcript of The automotive industry in Sweden - Vinnova · The automotive industry in Sweden A ... overall...

Göteborg
Malmö
Mölndal
Skövde
Köping
Stockholm
Södertälje
VINNOVA ANALYSISVA 2017:04
The automotive industry in Sweden A cluster study
hans pohl - rise viktoria ab

Vinnova´s publications are published at www.vinnova.se
Title: The automative industry in Sweden - A cluster studyAuthor: Hans Pohl - RISE Viktoria ABSeries: Vinnova Analysis VA 2017:04ISBN: 978-91-87537-64-6ISSN: 1651-355XPublished: October 2017Publisher: Vinnova - Swedish Governmental Agency for Innovation Systems/Verket för Innovationssystem
Vinnova - develops Sweden s innovation capacity for sustainable growth
Vinnova is Sweden’s innovation agency. Our mission is to promote sustainable growth by improving the conditions for innovation, as well as funding needs-driven research.
Vinnova’s vision is for Sweden to be a world-leading country in research and innovation, an attractive place in which to invest and conduct business. We promote collaborations between companies, universities, research institutes and the public sector. We do this by stimulating a greater use of research, by making long-term investment in strong research and innovation milieus and by developing catalytic meeting places. Vinnova’s activities also focus on strengthening international cooperation. In order to increase our impact, we are also dedicated to interacting with other research financiers and innovation-promoting organisations. Every year Vinnova invests about SEK 3 billion in various initiatives.
Vinnova is a Swedish government agency working under the Ministry of Enterprise and Innovation and acts as the national contact agency for the EU Framework Programme for R&D. We are also the Swedish government’s expert agency within the field of innovation policy. Vinnova was founded in January 2001. About 200 people work here and we have offices in Stockholm and Brussels. Our Director General is Charlotte Brogren.
The Vinnova Analysis series includes publications of studies, analyses, official reports and evaluations that have been produced or commissioned by Vinnova´s Operational Development Division.

The automotive industry in Sweden A cluster study
AUTHOR: HANS POHL – RISE VIKTORIA AB

Title: The automotive industry in Sweden - A cluster study
Author: Hans Pohl – RISE Viktoria AB
Series: Vinnova Analysis VA 2017:04
ISSN: 1651-355X
ISBN: 978-91-87537-64-6
Published: October 2017
Publisher: Vinnova - Verket för Innovationssystem/Swedish Governmental Agency for Innovation Systems
Production & layout: Vinnova´s Communications
3
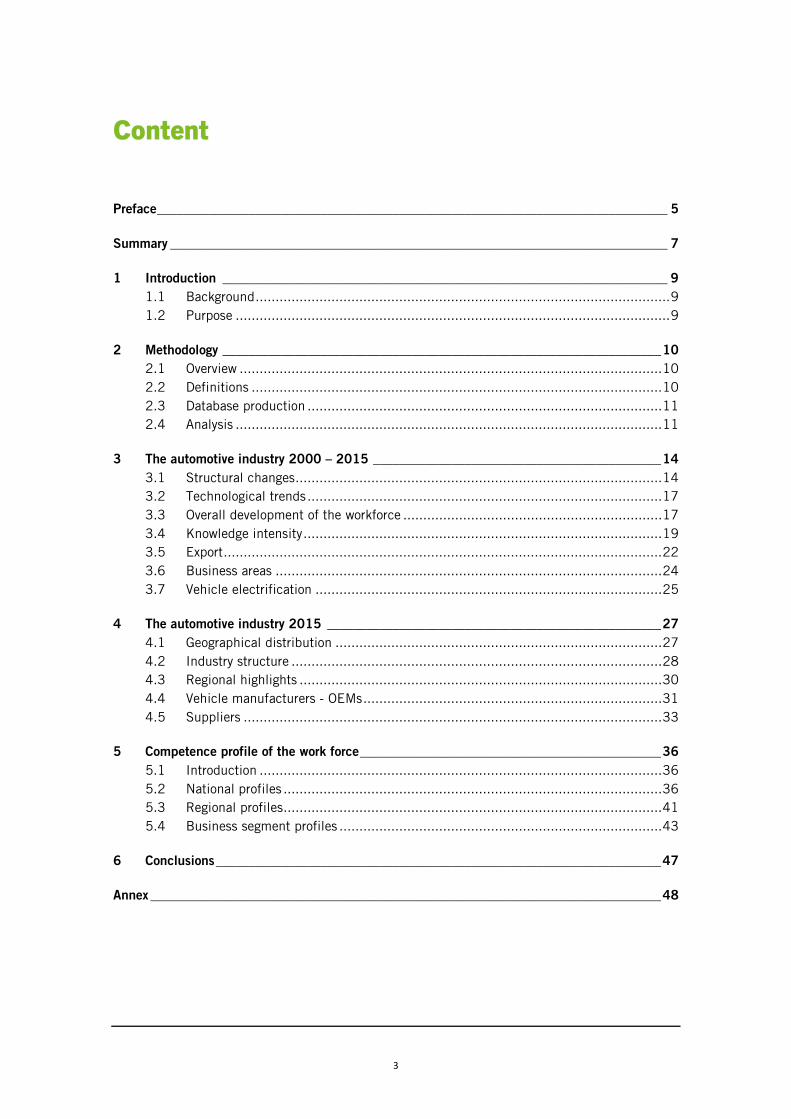
Content
Preface ______________________________________________________________________________ 5
Summary ____________________________________________________________________________ 7
1 Introduction ____________________________________________________________________ 91.1 Background ........................................................................................................ 91.2 Purpose ............................................................................................................. 9
2 Methodology ___________________________________________________________________ 102.1 Overview .......................................................................................................... 102.2 Definitions ....................................................................................................... 102.3 Database production ......................................................................................... 112.4 Analysis ........................................................................................................... 11
3 The automotive industry 2000 – 2015 ____________________________________________ 143.1 Structural changes ............................................................................................ 143.2 Technological trends ......................................................................................... 173.3 Overall development of the workforce ................................................................. 173.4 Knowledge intensity .......................................................................................... 193.5 Export .............................................................................................................. 223.6 Business areas ................................................................................................. 243.7 Vehicle electrification ....................................................................................... 25
4 The automotive industry 2015 ___________________________________________________ 274.1 Geographical distribution .................................................................................. 274.2 Industry structure ............................................................................................. 284.3 Regional highlights ........................................................................................... 304.4 Vehicle manufacturers - OEMs ........................................................................... 314.5 Suppliers ......................................................................................................... 33
5 Competence profile of the work force ______________________________________________ 365.1 Introduction ..................................................................................................... 365.2 National profiles ............................................................................................... 365.3 Regional profiles ............................................................................................... 415.4 Business segment profiles ................................................................................. 43
6 Conclusions ____________________________________________________________________ 47
Annex ______________________________________________________________________________ 48

4

5
Preface
In order to identify strategies and measures aimed at developing industrial sectors, it is important to have good knowledge of how the innovation system looks and functions. This report gives an overview of the structural development of the automotive industry in Sweden until the year 2015, highlighting some important industry features and discusses the structure of the automotive industry. It also provides a basis for analyzes and strategies regarding how the competitiveness of the Swedish automotive industry can be increased by identifying national, sectoral and regional knowledge concentrations. The aim is to serve as a basis for discussion as well as give insights and ideas for further studies of the automotive industry in Sweden including other parts of the innovation system connected to it. This provides an update of an earlier report, “Företag inom fordonsindustrin 2006 – 2010” (Vinnova Analys VA 2012:06), but with the addition of data for competence analysis.
The Swedish automotive industry has built up knowledge and skills for several decades. Strong brands, overall vision and thinking based on the complete vehicle are characteristic. The automotive industry in Sweden has mainly built on four vehicle manufacturers with a supplier network, largely based on orders and collaborations with these vehicle manufacturers. Globalization requires that new forms of knowledge-based partnerships and innovation processes are developed to maintain and strengthen companies in Sweden, while developing in international markets. The automotive industry consists of customer and product segments driven by different forces. It is therefore important to separate strategies for light vehicles, heavy vehicles and work vehicles, but also on vehicle manufacturers and component manufacturers. It is also important where the company today has its focus on knowledge development. For these reasons, these conditions are reported separately. There are several factors to consider when players in Sweden are to develop strategies to secure and develop their position as one of the world's leading automotive nations. It is for example about the existing structures in the automotive industry, research and education initiatives at universities, colleges and institutes, development trends, technological innovations, environmental and safety aspects. This study provides opportunities for different players in Sweden to relate to the existing competence structure and forms of cooperation in the automotive industry. It is from this structure that the future automotive industry is developing. This can be done in cooperation between companies, research, education and politics.
Vinnova in October 2017
Inger Gustafsson Göran Andersson Head of department Programme Manager Societal Development Division Societal Development Division

6

7
Summary
This is the third cluster study of the automotive industry following a similar methodology. Still, some changes have been implemented and now there is not least an opportunity to compare with other industries. However, such comparison is not part of the scope for this project, which had as main objective to develop a solid database with data for all organisations constituting the automotive industry in Sweden. This report gives some examples of how this database can be used.
One new part of this project compared to previous automotive studies was the production of an additional database based on a similar set of organisation numbers. This database from SCB comprises among others education level, gender, and national or international background for all people.
The main database confirms the important role of the automotive industry for all Sweden. There are automotive firms almost everywhere. The strongest concentration is in Västra Götaland with approximately one third of the industry, followed by the Stockholm and Jönköping regions. One surprising fact is the stability and slow rate of change in the industry when it comes to the number of employees. Almost independent of how the data is analysed, the main message is often that the business continues steadily. Even for an insider, it appears as if there have been several dramatic changes in the automotive industry with new owners, bankruptcies and financial crises. Also on the technological side, important changes are taking place such as vehicle electrification and automation, and connected vehicles. On a national level, these challenges are visible but only as relatively small changes and the recovery of the industry since the financial crisis in 2008 has been completed. However, in some parts of Sweden, a closing of one establishment, or the opening of another, might have large impacts on the local economy.
The analysis of the new dataset from SCB indicates that the education level, as expected, increases, and it highlights differences between business segments over time and geographical areas. One potentially important finding is that the female employees in the ages up to 49 have a higher education level, and the difference between the sexes is higher in 2015 than in 2007.
Vehicle electrification was introduced as a new strategic competence area in the data classification. The analysis shows that the number of firms has increased within this area but not dramatically.
Whereas the trend towards more organisations and employees in the upper part of the bubble diagram with in-house research and development is not clear, the trend towards higher educa-tion level among the employees is obvious. With a more educated workforce, the opportunities to carry out more research and development, in-house or in collaboration with such actors, increase, and this is important for the future of the automotive industry.

8

9
1 Introduction
1.1 Background The automotive industry is of major importance for Sweden. It employs many people and it continuously develops new products and services for the market. The export share is large and Sweden has a very special position on the global market with two large manufacturers of heavy vehicles.
Some highlights based on Statistics Sweden (SCB) data:
• In 2016, the automotive industry was Sweden’s largest export industry with a share of approximately14 per cent of Swedish goods export.
• Its share of Swedish industry investments was 21 per cent.
• The total industry working with vehicles and vessels in Sweden, which is somewhat larger than theautomotive industry, made 21 per cent of all Swedish investments in research and development (datafor 2015).
The volumes of road transportation of goods and people are closely linked to the economic development. Given a global positive economic development, the market for road vehicles expands. But there is a high degree of competition as new manufacturers of vehicles still emerge on this relative mature market.
Another motive to further develop products and services is the environment. With increasing volumes of road transportation, the need for more sustainable solutions is accentuated. Sweden has high ambitions in environmental matters and its industry is also expected to lead the development in this regard.
Two cluster studies have already been made covering the automotive industry (Vinnova Analys VA 2007:05 and Vinnova Analys VA 2012:06) and with this report, a time period from 2000 until 2015 is covered.
1.2 Purpose The main purpose of this report is to provide some highlights from the rich database that constitutes the core of the project. With these highlights, inspiration for further specific studies of the data are hopefully triggered. Other purposes are to explain how the data has been produced and to give some national perspectives on the development of the automotive industry.
In dialogue with the reference group consisting of automotive experts from Vinnova, BIL Sweden and the Vehicle Component Group, one trend was selected for a closer study; electrification.
The main purpose of the project is to develop a high-quality database to be used by experts and others for decisions regarding the development of the automotive industry in Sweden.

10
2 Methodology
2.1 Overview In principle, it is a simple project. First, a gross list consisting of potential automotive firms is made using different approaches. Thereafter all firms are scrutinised to remove non-automotive firms. As a next step, the remaining firms are classified in several dimensions. And finally, the database is linked to a visualisation tool to facilitate analyses.
In practice, there are several small decisions to make, among them to make definitions of what is considered the automotive industry in Sweden and all classifications that are made. Even though the ambition is to make very clean and sharp definitions, there remains cases that are difficult to land in the database.
2.2 Definitions The main decision to be made is how to define ‘automotive industry’. As the definition in the previous works was not explicit, the definition used by the Vehicle Component Group (FKG) was used for this project. It says something like:
“The automotive industry consists of firms, which with a considerable turnover add to the value of the final product (heavy or light vehicles, and construction equipment).”
The full definition in Swedish is enclosed in Annex.
Moreover, business segments are defined in line with previous work.
Complete vehicles . Development and production of complete vehicles including R&D, product planning, assembly, testing, sales, delivery and more. Production units in other places than the main site are treated separately.
Body and chassis . Includes body, doors, windows, tank, wheels, brakes, hydraulics and more.
Propulsion. Systems and components in the drivetrain, among them engine, engine control, transmission, exhaust system, tractionary battery system, electric machine and more.
Furnishing . Seats, upholstery, panels, safety belts, airbags, foams and other materials for furnishing and more.
Elektronics/IT . Electric systems, communication systems, lamps, batteries, instrumentation, climate control systems, telematics and more.
Details and materials . Components and materials possible for use in several of the other technology areas, such as metal sheets, casted details, fasteners, threads and materials such as steel, aluminium, plastics, composites and more.
Technology consultants . Includes consultants supporting the automotive industry.

11
2.3 Database production In Table 1 follows a summary of the steps leading to the database.
Table 1. Methodology
1 Four lists of organisation numbers were collected: • A number of SNI codes were selected based on previous studies and a dialogue with the reference
group. Based on these codes VINNOVA extracted all organisations numbers that were matching (1,065 entities).
• A database was received from the Vehicle Component Group, which was the result of a similar approach, including a manual scrutiny of the organisation numbers that matched their selection of SNI codes (1,021 entities). This list used the same definition of automotive firms as this study.
• Vinnova listed all organisations that has participated in FFI (90 entities). • The final database from the previous cluster project ending 2010 (558 entities).
2 These four lists were merged into one list and duplicates were removed (2,072 entities remained). A manual scrutiny of this list was made using publicly available sources to determine if the firm is active and if it is matching the definition of ‘automotive’. Surprisingly often firms provide very limited information about their customers and if no such information was obtainable, pictures of product samples and the firms location were used to assess if it is automotive or not. To enable longer time series, firms included in the previous cluster study were typically not removed even if they were inactive. Large firms or groups with many customer segments were studied in detail to understand the share of automotive activities in Sweden. This manual scrutiny resulted in 1,151 organisation numbers probably belonging to the automotive industry.
3 Based on the organisation numbers a new list with all establishments was made, resulting in a gross database comprising 1,843 entities. This list was scrutinised and all establishments that did not belong to the automotive industry were removed. In addition, all establishments with less than 10 people were removed (in previous study, 20 was the limit). In parallel, BIL Sweden delivered separate data for the automakers. This resulting list was manually classified in all the dimensions that the database comprises. In the end, 781 entities remained.
4 Finally, an interface was added to facilitate the use of the database and the production of figures.
To allow for comparisons with previous studies the same principle was used to include firms with a low share of their activities in the automotive industry. Basically, all firms with a clear part of their business in the automotive industry were included, but only with the percentage that this part represented. For example, a firm with 1,000 employees, whereof 200 are employed in the automotive division, is included to 20 per cent.
Studies of other industries typically use a binary approach, if more than 50 per cent of the employees are within the industry, it is counted to 100 per cent, otherwise 0 per cent.
A quick study of this reduction approach showed that approximately 100 establishments in the database were included with percentages lower than 50 per cent and 80 with percentages between 50 and 99 percent. Moreover, most of these work places in the database had relatively low numbers of employees. Therefore, this approach does probably not influence the total num-bers very much.
One difference compared to previous studies is that work places with 10 people and up were included instead of the previous limit of 20 people. When looking at the data for 2015, approximately 140 work places were thereby included, totalling about 2,500 people.
2.4 Analysis The cluster analysis is heavily based on two elements; the bubble diagram and the maps. As there are several cluster studies of different industry sectors using the same approach, there are limited possibilities to adapt these elements. When comparing with the previous cluster studies

12
of the automotive industry, the categories in the bubble diagram have changed in the x and y dimensions. However, the changes are minor and it is still easy to compare.
Figure 1. Example of bubble diagram
The bubble diagram uses three dimensions and colours to give a rich information to the reader, compare Figure 1.
The x axis divides the establishments in three groups; no, some (less than 50 percent of the turnover) or significant export.
The y axis captures the knowledge intensity of the establishment with five different categories of activity;
• In-house R&D
• Collaboration with R&D actors
• In-house development of products, processes and/or services
• Manufacturing
• Others.
In-house development differs from R&D as it mainly relates to the refinement of existing solutions. Others comprises among others logistics and sales.
The third dimension is the size of the bubble, which represents the number of people at the establishment, see Figure 2.

13
Figure 2. Bubble size corresponds to the number of employees at the establishment
Finally, the colours in the bubble diagram as well as the maps represent the business segments, as defined in sub-section 2.2.

14
3 The automotive industry 2000 – 2015
3.1 Structural changes Volvo was founded in 1927 and it was initially as a truck producer that the company was successful. In 1975 Volvo established a plant for truck production in Belgium, which was the first step towards a global group. Volvo divested the car division in 1999, Volvo Cars was sold to Ford Motor Company.
The remaining part of Volvo developed further and in 2015, the group comprised the following brands: Volvo, Volvo Penta, UD, Terex Trucks, Renault Trucks, Prevost, Nova Bus and Mack plus alliances and joint ventures with the Sunwin, SDLG, Eicher and Dongfeng brands (ÅR2015). Trucks represented 68%, construction equipment 16% and buses 7% of the sales. The majority of the shareholders in AB Volvo are Swedish.
Volvo Cars was acquired from Ford by Geely Holding in 2010. In 2015 a total of half a million vehicles were sold, whereof a small share with an electric or hybrid-electric powertrain.
Scania or rather Vabis was founded in 1891 and already in 1957, a subsidiary in Brazil was established. In 1969, a merge with Saab, the maker of cars and aircrafts took place. Scania became an independent firm again in 1995 and in 2000, Volvo’s acquisition of Scania was not accepted by the competition agency in the European Union and Volkswagen became the largest shareholder. In 2014, Volkswagen became the only owner of Scania.
Saab was founded in 1937 and a few years later it was decided to add car production to the production of airplanes. After the merge with Scania, the turbo found its way to the cars and in 1977 Saab 99 turbo was launched. General Motors acquired 50% of Saab from Investor in 1990 and the remaining 50% in 2000. After a turbulent year, Spyker Cars acquired Saab Automobile from GM in 2010, and in the end of 2011, bankruptcy occurred. A couple of months later, the new owner National Electric Vehicles Sweden (NEVS) appeared and in 2013 – 2015 Saab cars were produced again in small volumes. However, development of electric vehicles was and is the main ambition and business idea for NEVS.
In Figure 3 to Figure 5, the annual production volume of vehicles from above mentioned automakers is presented, including production abroad (BIL Sweden, 2015).

15
Figure 3. Annual and accumulated car production volumes
Figure 4. Annual and accumulated truck production volumes
16
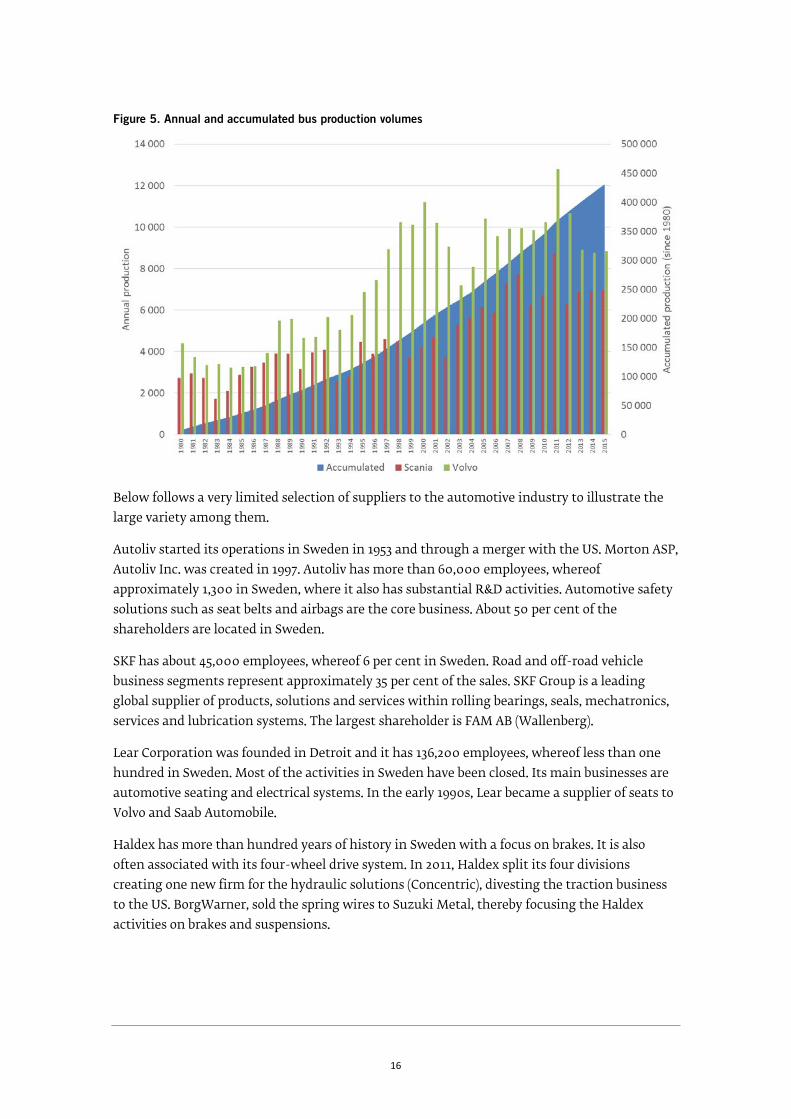
Figure 5. Annual and accumulated bus production volumes
Below follows a very limited selection of suppliers to the automotive industry to illustrate the large variety among them.
Autoliv started its operations in Sweden in 1953 and through a merger with the US. Morton ASP, Autoliv Inc. was created in 1997. Autoliv has more than 60,000 employees, whereof approximately 1,300 in Sweden, where it also has substantial R&D activities. Automotive safety solutions such as seat belts and airbags are the core business. About 50 per cent of the shareholders are located in Sweden.
SKF has about 45,000 employees, whereof 6 per cent in Sweden. Road and off-road vehicle business segments represent approximately 35 per cent of the sales. SKF Group is a leading global supplier of products, solutions and services within rolling bearings, seals, mechatronics, services and lubrication systems. The largest shareholder is FAM AB (Wallenberg).
Lear Corporation was founded in Detroit and it has 136,200 employees, whereof less than one hundred in Sweden. Most of the activities in Sweden have been closed. Its main businesses are automotive seating and electrical systems. In the early 1990s, Lear became a supplier of seats to Volvo and Saab Automobile.
Haldex has more than hundred years of history in Sweden with a focus on brakes. It is also often associated with its four-wheel drive system. In 2011, Haldex split its four divisions creating one new firm for the hydraulic solutions (Concentric), divesting the traction business to the US. BorgWarner, sold the spring wires to Suzuki Metal, thereby focusing the Haldex activities on brakes and suspensions.

17
3.2 Technological trends In 2000, the battery electric vehicle was considered irrelevant except of very small specific niches. Fuel cell electric vehicles were forwarded as the sustainable solution. The Japanese automakers sold hybrid-electric vehicles and other automakers were sceptical to this solution, but initiated some development. In Sweden, alternative fuels became the main focus to reduce the greenhouse gas emissions. Ethanol mixed with petrol in various proportions became the main alternative fuel but bio-methane was also used, in particular for city buses.
Slowly most automakers introduced various types of hybrid-electric solutions, initially mainly start-stop solutions with very small tractionary batteries. In 2008, the all-electric battery vehicle returned as an alternative and Volvo Cars declared that plug-in hybrids would be its main focus. AB Volvo announced that it would introduce hybrid trucks and buses. Nissan was the forerunner among battery-electric vehicle producers with its Leaf and when Tesla introduced its sporty and expensive roadster in 2008, it caused a lot of attention, as the successors also have done, the Model S for example, which reached the market in 2012.
Volvo presented a hybrid concept car in 1992 and 20 years later hybrid electric Volvo cars were sold. The heavy vehicle part of Volvo sold its first hybrid electric vehicles in 2008 (city buses and refuse collection trucks). In 2016, Scania started to deliver hybrid-electric buses and trucks.
Traffic safety has moved from a focus on passive solutions to more active ones, thereby not only reducing the consequences of a collision but also trying to mitigate it. Automakers in Sweden have been successful in advancing traffic safety and they have several times introduced innovations in this area.
In the longer term, active traffic safety solutions point towards full automation of the vehicles and in 2013, driverless vehicles started to gain a lot of attention. Among the advantages of driv-erless vehicles is that they remove the main cause of accidents – the human factor – and they deliberate time for the ‘driver’ to carry out other activities while traveling in her or his vehicle. It is also possible to reduce the impact on the environment, as driverless vehicles need less infrastructure and can be used more efficiently.
Another solution that is linked to electrification as well as automation is car pools and other concepts reducing the needs to own a car. Such concepts may reduce the number of cars, which especially in larger cities is an advantage.
3.3 Overall development of the workforce In Figure 6, the development of the total number of employees is indicated. Apart from the dip between 2008 and 2009, the total numbers have been surprisingly stable. Also, most of the business segments have maintained a similar share over the whole period, apart from furnishing, which has decreased its size steadily.

18
Figure 6. Development of the total number of employees
When studying the number of employees working with light and/or heavy vehicles or construction equipment, a bit more variation over the years is indicated, see Figure 7. Obviously, suppliers to light and heavy vehicles recovered very quickly after the difficult period, whereas the light vehicle firms only slowly started to grow again.
Figure 7. Distribution of employees per vehicle type
The number of organisations has also remained relatively stable at around 600 entities. When comparing the organisations active in 2007 with those in 2015, 35 had ceased their operations whereas 45 had started. The 35 organisations that had zero or at least less than 10 employees in 2015 had in 2007 almost 4,000 employees. On the other hand, the 45 new organisations in 2015 had over 7,000 employees, compare Figure 8.

19
Figure 8. Development of new organisations since 2007
3.4 Knowledge intensity Knowledge intensity is linked to value creation. With high knowledge intensity, high value is typically created. Therefore, it is of interest to increase the number of organisations in the upper parts of the bubble diagram. Even more important, the number of people employed in these organisations should preferably increase.
In Figure 9 to Figure 13, the development in each level of the y axis in the bubble diagram is presented. As Figure 9 shows, the makers of complete vehicles employ the large majority of people in the In-house research and development category.
Figure 9. Employees in In-house research and development
For some reason, the number of employees in the next level, Collaboration with R&D actors, declines steadily over the period. Almost all business segments except Body and chassis exhibit decreasing numbers, see Figure 10.

20
Figure 10. Employees in Collaboration with R&D actors
In the category In-house development of products, the changes are minimal since 2009, see Figure 11. In these organisations, a large part of the people in Body and chassis are employed.
Figure 11. Employees in In-house development of products processes and services
Manufacturing is a very large category and the total employment has been quite stable after the recovery from the crisis 2008, see Figure 12. In this category a large part of the people in the Details and materials are employed.
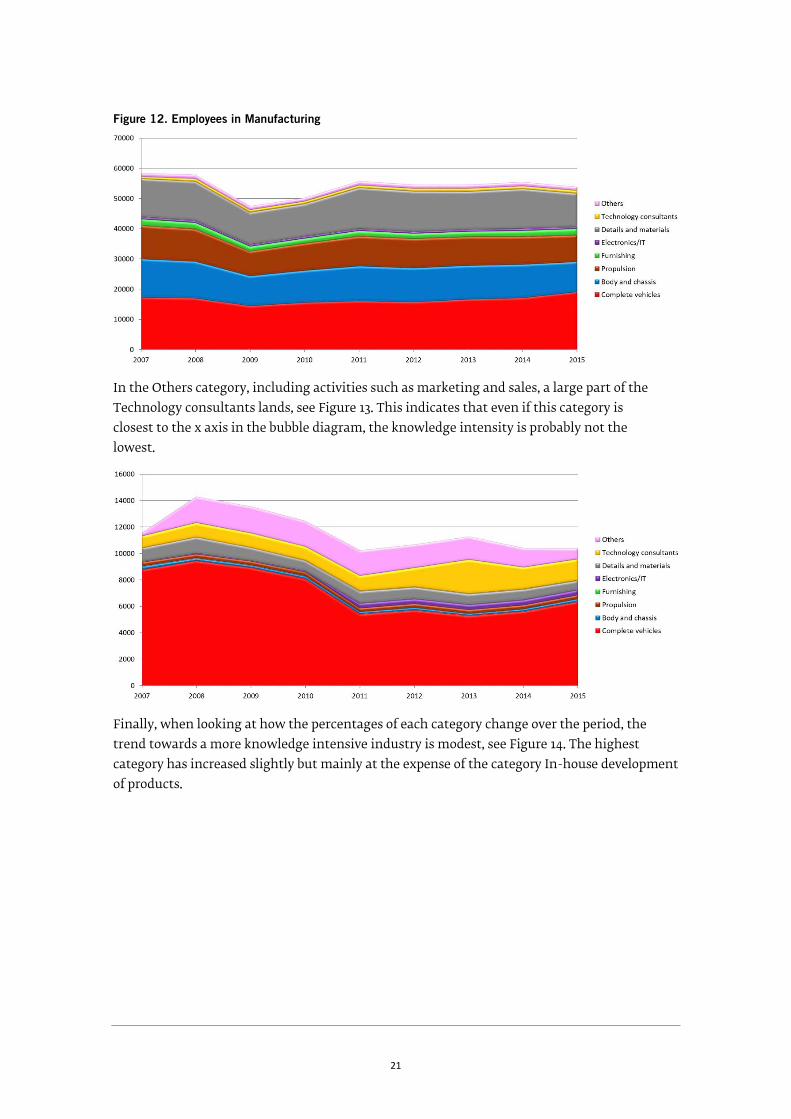
21
Figure 12. Employees in Manufacturing
In the Others category, including activities such as marketing and sales, a large part of the Technology consultants lands, see Figure 13. This indicates that even if this category is closest to the x axis in the bubble diagram, the knowledge intensity is probably not the lowest.
Figure 13. Employees in Others
Finally, when looking at how the percentages of each category change over the period, the trend towards a more knowledge intensive industry is modest, see Figure 14. The highest category has increased slightly but mainly at the expense of the category In-house development of products.

22
Figure 14. Shares of each category over time
3.5 Export The automotive industry is and has been export intensive over a long time period and therefore large changes are not to be expected. In Figure 15, the development of the number of employees in organisations with significant export is exhibited. A large part of the Complete vehicles business segment has significant export.
Figure 15. Employees in Significant export organisations
Organisations with some exports constitute the second largest employers with approximately 20 per cent of the employees, see Figure 16. The trend is towards lower numbers of employees.

23
Figure 16. Employees in some export organisations
The number of people in the organisations with no export increased until 2013 and decreased thereafter, see Figure 17. A large share of the Technology consultants is employed in organisations with no exports.
Figure 17. Employees in No export organisations
As a percentage of the total workforce, the share of people in organisations with significant export has increased slowly since the crisis 2008, see Figure 18. At the same time the share of people working at organisations with no export has remained constant.

24
Figure 18. Export trends
3.6 Business areas The business areas Complete vehicles and Body and Chassis employ almost 60 per cent of the total automotive workforce, compare Figure 19. Changes over the period are not dramatical but a slight growth in Complete vehicles is indicated.
Figure 19. Distribution of employees per business area

25
A closer look at the smaller business segments shows that Furnishing has halved over the period, whereas Technology consultants and Electronics/IT have grown, compare Figure 20.
Figure 20. Shares of employees in the smaller business areas
3.7 Vehicle electrification The number of organisations addressing vehicle electrification has increased over the period but only slightly, see Figure 21. Seven new organisations have started since 2007 and two have closed. As the OEMs work with this area and no data exists for how many persons at each OEM that is involved in electrification, good data for the number people working with vehicle electrification does not exist.

26
Figure 21. Total number of Vehicle electrification organisations

27
4 The automotive industry 2015
4.1 Geographical distribution The automotive industry is omnipresent in Sweden. As Figure 22 shows, there are groups of firms in almost any city. Västra Götaland and Stockholm have the two largest clusters of automotive businesses, followed by the Jönköping region. The latter region is packed with small firms.
Figure 22. The automotive industry in Sweden 2015

28
4.2 Industry structure In Figure 23, all establishments are plotted. The dominance of the red colour, Complete vehicles, in the upper and right-hand part of the diagram shows the importance of the OEMs in the automotive industry as well as for the Swedish foreign trade balance. The bubbles are large even though the activities of the OEMs have been divided according to their location in Sweden. Basically, almost all firms in the left-hand column sell to the OEMs in Sweden, either directly or through a higher-level supplier. There is a relationship between knowledge intensity and exports.
Figure 23. The automotive industry in Sweden 2015
In Figure 24, the distribution of employees for each vehicle type is exhibited.

29
Figure 24. Share of employees per vehicle type 2015
Total number of employees 2015: 101,596.
In Figure 25, the share of the number of organisations per vehicle type is presented. When comparing Figure 24 and Figure 25, it becomes clear that there are several small firms supplying components or other products to several OEMs. This is positive for Sweden, as the firms thereby are slightly less vulnerable.
Figure 25. Share of organisations per vehicle type
Total number of organisations 2015: 593.

30
4.3 Regional highlights As indicated in Figure 26, Västra Götaland dominates automotive Sweden with more than one third of the total employment. However, all counties except Gotland have some kind of automotive business.
Figure 26. Employees per county
To make it easier to understand some regional differences, the four largest counties were selected. In Figure 27, the average firm size is indicated. The already in the geodiagram indicated wealth of small businesses in the Jönköping area is clearly confirmed. In the other extreme, Västra Götaland has on average 225 employees per organisation.
Figure 27. Organisation size for selected counties and Sweden
The same geographical areas specialise in different business segments, compare Figure 28. In Jönköping, the majority of the employees are occupied with Body and chassis, closely followed

31
by Details and materials. In Sweden, and in the other regions, Complete vehicles dominates. It could also be noted that Electronics/IT appears to be more prominent in Stockholm than in the other regions.
Figure 28. Business segment per county (2015)
4.4 Vehicle manufacturers - OEMs In the map in Figure 29, the distribution of the OEMs is presented. Even though the number of firms is limited, they have establishments in a dozen different locations.

32
Figure 29. Automaker/OEM establishments 2015
As expected, most of the bubbles for the OEMs are large, red, and in the right-hand column, see Figure 30.

33
Figure 30. Automakers/OEMs in Sweden 2015
4.5 Suppliers When looking at the distribution of the suppliers, the question of proximity to the next level in the supply chain comes into mind. But the OEMs are also distributed over Sweden and as the roads are seldom congested, a bit longer distance transports are probably acceptable for most businesses, compare Figure 31.

34
Figure 31. Automotive suppliers 2015
In the bubble diagram, see Figure 32, it could be noted that Sweden appears to lack suppliers with large establishments. Obviously, economies of scale are not so important. Alternative explanation is that most of the suppliers are very specialised and thus able to reach economies of scale even with a relatively modest number of employees per establishment.

35
Figure 32. Automotive suppliers 2015

36
5 Competence profile of the work force
5.1 Introduction Based on the population of organisation numbers a special study was commissioned at SCB to obtain data about the education level in the automotive industry. The underlying data set differs slightly from previous sections as the organisations included here are only those with more than 50 per cent of their employees directly involved in the automotive industry. On the other hand, these organisations are counted as if they are 100 per cent automotive. Other aspects such as the removal of establishments with less than 10 employees might also contribute to the differences. The total number of people in this dataset is 91,933.
The database includes not only education level but also gender, regional distribution, business segment distribution and if the person has a Swedish or a foreign background. The latter is defined as having two parents with foreign nationality or born abroad. Data covers the years 2007 – 2015.
Below follow some examples of how this data can be used to increase the understanding of how the automotive industry develops. A lot more is possible to obtain from this data set. Västra Götalandsregionen and Business region Gothenburg have conducted a separate study based on the same data.
5.2 National profiles On a national level, the data shows that the people in the automotive industry are older in 2015 than in 2007, see Figure 33. This trend is not unique for the automotive industry but still it is interesting and a bit worrying that a large part of the employees are in the older age groups. One positive explanation is that people tend to study longer, as we will see below. A more problematic potential explanation is the cyclic development of the industry, with some very challenging periods when typically the younger employees have to leave the organisations. Average age in 2015 was approximately 43 years.

37
Figure 33. Age profiles 2007 and 2015
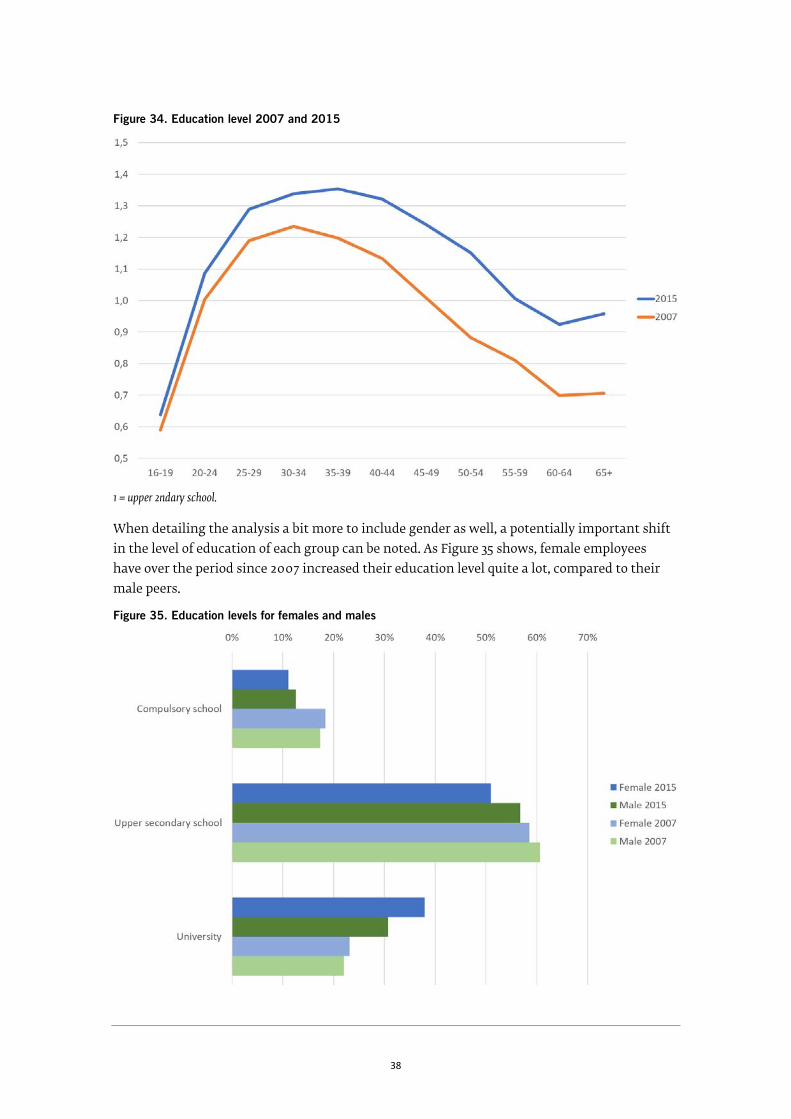
Overall the education level increases and the automotive industry is no exception. Below in Figure 34, it is obvious that over the short period from 2007 till 2015, the education level has risen significantly. Here, and in some of the following figures, the education level has been calculated from the data according to the following:
(University * 2 + Secondary upper school * 1)/(all people in the group)
As the SCB data consists of three categories; Compulsory school (grundskola), Upper secondary school (gymnasium) and post Upper secondary school (universitet och högskola), this indicator equals one if all people have upper secondary school education. If higher than one, the share of people with university education is larger than the share of people with compulsory school only.
For obvious reasons, the education level in the younger age groups is lower, as these people have not had time to complete a higher education. It appears also quite probable that the increase for the oldest age group partly depends on the fact that people with higher education are more likely to continue to work as their work is less physically demanding.
Assuming that most people stay in the automotive industry, it is quite easy to predict how the education level will be in the future.
38
Figure 34. Education level 2007 and 2015
1 = upper 2ndary school.
When detailing the analysis a bit more to include gender as well, a potentially important shift in the level of education of each group can be noted. As Figure 35 shows, female employees have over the period since 2007 increased their education level quite a lot, compared to their male peers.
Figure 35. Education levels for females and males

39
An even more detailed look at the education levels for different age groups and genders shows that female employees in 2015 have a higher education in all age groups up to and including 45 – 49 years, see Figure 36. In 2007, the male employees had a higher education level from 40 - 44.
Figure 36. Education level per age group and gender
1 = upper 2ndary school.
In Figure 37, the share of women in the automotive industry is indicated as well as the share of people with a foreign background. A comparison of the data for the female share in 2007 and 2015 indicates that several of the older female employees have left the automotive industry. On the other hand, the line for 2015 shows that among the more recently employed, the share of women is up to 25 per cent.
The share of employees with a foreign background does not indicate such a clear trend. In 2015, the age group with the highest share was 30 – 34 reaching above 25 per cent. For male employ-ees between 40 and 55, the share of people with a foreign background was higher in 2007 than in 2015.

40
Figure 37. Shares of minority groups
With only one exception, the education level is slightly higher for people with a Swedish background, compare Figure 38. This difference is valid for 2015 as well as for 2007 and it is, even though both groups exhibit higher education levels in 2015, approximately of the same magnitude. The exception is the oldest age group above 65, which in 2007 had a higher education level for people with a foreign background.
Figure 38. Education level per age group and national/international background
1 = upper 2ndary school.
41
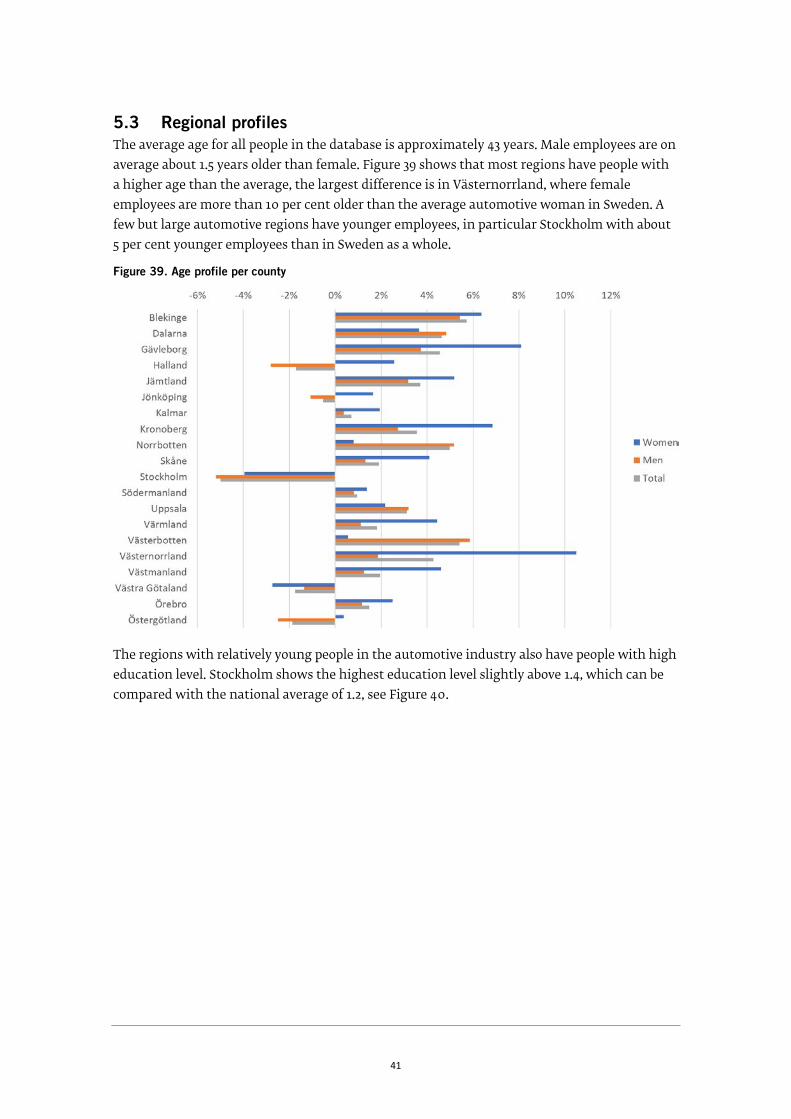
5.3 Regional profiles The average age for all people in the database is approximately 43 years. Male employees are on average about 1.5 years older than female. Figure 39 shows that most regions have people with a higher age than the average, the largest difference is in Västernorrland, where female employees are more than 10 per cent older than the average automotive woman in Sweden. A few but large automotive regions have younger employees, in particular Stockholm with about 5 per cent younger employees than in Sweden as a whole.
Figure 39. Age profile per county
The regions with relatively young people in the automotive industry also have people with high education level. Stockholm shows the highest education level slightly above 1.4, which can be compared with the national average of 1.2, see Figure 40.

42
Figure 40. Education level per county 2015
1 = upper 2ndary school.
When looking at the gender balance in the regions, Uppsala exhibits the largest change from 2007 till 2015, see Figure 41. The highest share of female employees is in Västernorrland, even though the change since 2007 indicates that other regions might reach a better balance within a few years. The largest region Västra Götaland indicates no change whereas Stockholm improves the balance over the period of study to reach a very similar share as Västra Götaland.

43
Figure 41. Share of female employees per county 2007 & 2015
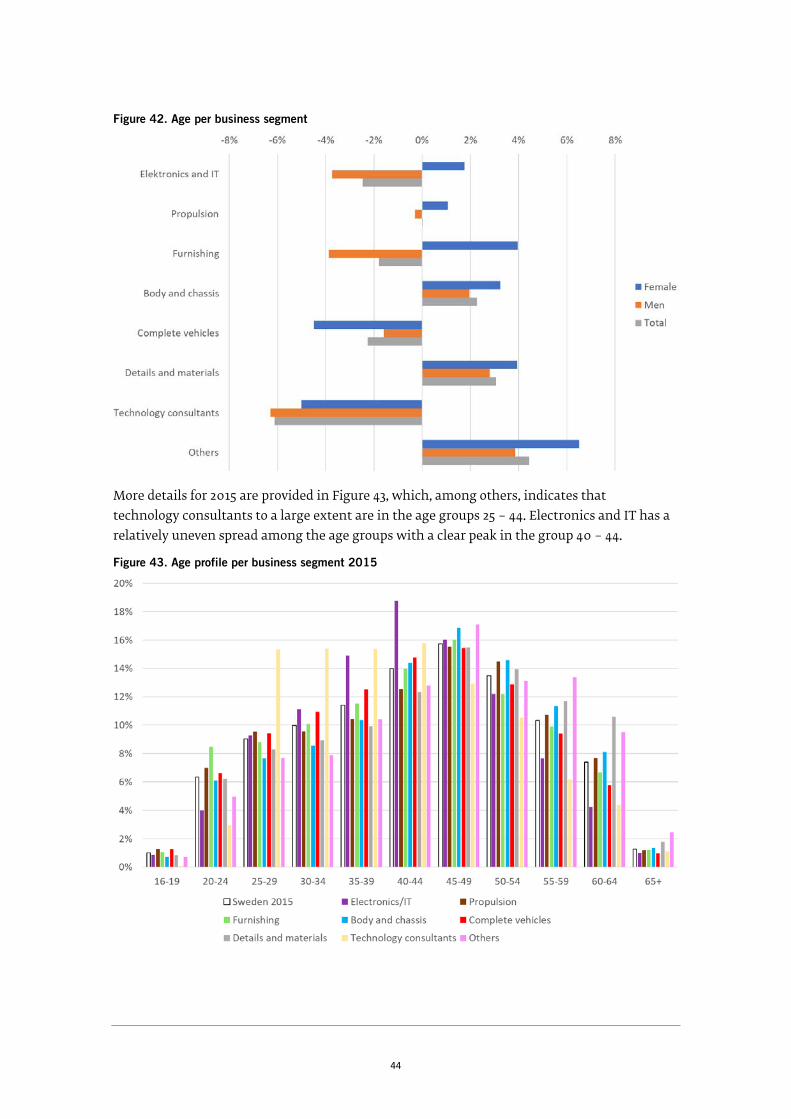
5.4 Business segment profiles One part of the explanation behind the regional differences highlighted in previous sub-section is that the regions are active in different business segments. In Figure 42, the age profile of each business segment is compared to all employees in the automotive industry 2015. Technology consultants are about 6 per cent younger than the average whereas people in the group Others are more than 4 per cent older. In the upper three cases, the age profiles of men and women differ in different directions. The largest age difference between the sexes is in furnishing, where female employees are approximately 8 per cent older than the male ones.
44
Figure 42. Age per business segment
More details for 2015 are provided in Figure 43, which, among others, indicates that technology consultants to a large extent are in the age groups 25 – 44. Electronics and IT has a relatively uneven spread among the age groups with a clear peak in the group 40 – 44.
Figure 43. Age profile per business segment 2015

45
Three business segments have higher education level than the Swedish average (1.2) and the clearly highest education level is for technology consultants, followed by electronics and IT, compare Figure 44.
Figure 44. Education level per business segment 2015
1 = upper 2ndary school.
Another illustration of the education level per business segment is given in Figure 45. Here data for Sweden shows that 55 per cent have upper secondary education and 32 per cent have some kind of university level education. The remaining 13 per cent have compulsory school.

46
Figure 45. Education shares per business segment 2015

47
6 Conclusions
When GM and Ford announced that they wanted to divest Saab Automobile and Volvo Cars, and in the following and to some extent still on-going turbulence, the future of the automotive industry in Sweden was sometimes questioned. This study shows that the worries did, at least in the medium term, not become a reality. The consequences of the financial crisis are very visible, but it is also clear that a recovery has taken place.
One surprising fact is the stability and slow rate of change in the industry, when it comes to the number of employees, in spite of dramatic changes in ownership structures and rapidly developing technologies. Almost independent of how the data is analysed, the main message is often that the business continues steadily. However, in some parts of Sweden, a closing of one establishment, or the opening of another, might have large impacts on the local economy.
Methodologically, this type of study has now been repeated several times for several industries. Still it requires a significant investment of time and expertise. The main and most important part of the work is to extract a population of organisations and establishments and classify them. Less time consuming was the initial analysis presented in this report. But given the purpose of the analysis to provide inspiration for further studies rather than trying to give a complete picture, this part can obviously be extended a lot.
Vehicle electrification was introduced as a new strategic competence area in the data classification. The analysis shows that the number of firms has increased within this area but not dramatically. Probably the main increase in the number of people working with vehicle electrification is within the large firms. The methodology chosen for this study does not allow for a quantification of these changes.
One new part of the study was the production of a separate database based on a similar set of organisation numbers. This database comprises among others education level, gender, and national or international background for all people. The analysis indicates that the education level, as expected, increases, and it highlights differences between business segments over time and geographical areas.
When comparing the results of the knowledge intensity development in the bubble diagram and the knowledge development on individual level, the results are not the same. Whereas the knowledge level of the establishments only shows a minor development, the individual level has developed significantly. As the establishment level is less precise, the difference is not problematic from a methodological standpoint. However, with a more educated workforce the opportunities to carry out more research and development, in-house or in collaboration with such actors, increase, and this is important for the future of the automotive industry.

48
Annex
Definition of the automotive industry according to FKG, The Scandinavian Automotive Supplier Association.
Kortversion: Som leverantörsföretag till fordonsindustrin räknar FKG företag med fler än 5 anställda, som med en avsevärd omsättning bidrar till förädlingsvärdet av slutprodukten (tunga och lätta fordon, inklusive arbetsfordon).
Mer detaljerad version:
Databasen innehåller:
• Leverantörer som levererar produkter och tjänster till
o Personbilar
o Lastvagnar
o Arbetsfordon (t ex VCC, Atlas Copco, Sandvik, BT, Atlet, militärfordon etc)
o Påbyggnads- och eftermarknadsprodukter ingår OM de enbart kan användas på fordon (t ex takboxar, husvagnar och GPS för bruk i fordon, men inte t ex brandsläckare)
• Samtliga leverantörsled t o m råmaterialleverantör ska vara med, i de fall de bidrar till förädlingsvärdet av slutprodukten (som är en pv, lv eller arbetsfordon)
• Råmaterialleverantörer
• Stora företag med ner till 10% av omsättningen till fordonsindustrin OM det finns en avsevärd omsättning och tydlig koppling till fordonsindustrin
• Alla bolag med en uttalad del av omsättningen till fordonsindustrin eller produkter direkt relaterade till fordonsindustrin (enligt kriterierna ovan)
• Teknikkonsulter
• Verktygstillverkare (notera att det rör sig om verktyg specifika för en del av slutprodukten så som pressverktyg och formsprutningsverktyg, dvs inte slipskär etc)
I databasen ingår EJ:
• Leverantörer av produktionssystem (maskiner och komponenter som ingår i produktionsutrustningen för att tillverka fordon).
• Managementkonsulter, redovisningskonsulter och andra tjänsteleverantörer som ej bidrar direkt till slutprodukterna
• Logistiktjänster, bensinstationer, serviceverkstäder
• Svenska företag som saknar tillverkning i Sverige men har tillverkning till fordonsindustrin utomlands

Vinnova AnalysisVA 2017:
01 The Energy Industry in Sweden continues to grow - Analysis of companies in the energy industry 2007-2014 - business segments, age structures, gender equality and competence. (For Swedish version see VA 2016:05)
02 Hårdare, lättare och snabbare - Effektanalys av ett urval av Vinnovas materialrelaterade satsningar
03 Årsbok 2016 - Svenskt deltagande i europeiska program för forskning och innovation
04 The automotive industry in Sweden - A cluster study
VA 2016:01 Vinnväxt - Ett innovativt program
i takt med tiden02 Årsbok 2015 - Svenskt deltagande
i europeiska program för forskning & innovation
03 Effektanalys av Vinnväxt-programmet - Analys av effekter och nytta
04 Chemical Industry Companies in Sweden - Update including data for competence analysis
05 Energibranschen i Sverige fortsätter växa - Analys av företag i energibranschen 2007-204 - branschdelar, åldersstrukturer, jämställdhet och kompetens. (For English version see VA 2017:01)
06 Omvandling och fasta tillstånd – Materialvetenskapens etablering vid svenska universitet
07 Svensk konsultsektor i ny belysning - Utvecklingstrender och dynamik
VA 2015:01 Årsbok 2014 - Svenskt deltagande
i europeiska program för forskning & innovation
02 Samverkansuppgiften i ett historiskt och institutionellt perspektiv
03 Långsiktig utveckling av svenska lärosätens samverkan med det omgivande samhället - Effekter av forsknings- och innovationsfinansiärers insatser
04 Företag i Tåg- och järnvägsbranschen i Sverige - 2007-2013
05 FoU-program för Små och Medelstora Företag - Metodologiskt ramverk för effektanalyser
06 Small and beautiful - The ICT success of Finland & Sweden
07 National Research and Innovation Councils as an Instrument of Innovation Governance - Characteristics and challenges
08 Kartläggning och behovsinventering av test- & demonstrationsinfrastruktur
VA 2014:01 Resultat från 18 VINN Excellence
Center redovisade 2012 - Sammanställning av enkätresultaten. (For English version see VA 2014:02)
02 Results from 18 VINN Excellence Centres reported in 2012 - Compilation of the survey results. (For Swedish version see VA 2014:01)
03 Global trends with local effects - The Swedish Life Science Industry 1998-2012
04 Årsbok 2013 - Svenskt deltagande i europeiska program för forskning och innovation.
05 Innovations and new technology - what is the role of research? Implications for public policy. (For Swedish version see VA 2013:13)
06 Hälsoekonomisk effektanalys - av forskning inom programmet Innovationer för framtidens hälsa.
07 Sino-Swedish Eco-Innovation Collaboration - Towards a new pathway for shared green growth opportunity.
08 Företag inom svensk massa- och pappersindustri - 2007-2012
09 Universitets och högskolors samverkansmönster och dess effekter
Vinnova InformationVI 2017:
01 Forskning inom gruv- och mineralområdet - En studie av styrkor och samverkan
02 Projektkatalog 2016 Utmaningsdriven innovation Steg 1 - Initieringsprojekt
03 Projektkatalog 2016 Utmaningsdriven innovation Steg 2 - Samverkansprojekt
04 Projektkatalog 2016 Utmaningsdriven innovation Steg 3 - Följdinvesteringsprojekt
05 Årsredovisning 201606 Challenge-Driven Innovation -
Societal challenges as opportunities for growth (for Swedish version see VI 2016:07)
07 FFI Årsrapport 2016 - Samverkan för stark svensk fordonsindustri och miljöanpassade samt säkra transporte
VI 2016:01 Projektkatalog Utmaningsdriven
innovation Steg 1-2015 - Initieringsprojekt
02 Projektkatalog Utmaningsdriven innovation Steg 2-2015 - Samverkansprojekt
03 Projektkatalog Utmaningsdriven innovation Steg 3-2015 - Följdinvesteringsprojekt
04 Årsredovisning 201505 FFI Årsrapport 2015 - Samverkan
för stark svensk fordonsindustri och miljöanpassade samt säkra transporter
06 Innovation för ett attraktivare Sverige - Sammanfattning
07 Utmaningsdriven innovation - Samhällsutmaningar som tillväxtmöjligheter (for English version see VI 2017:06)
08 Vinnväxt - A programme renewing and moving Sweden ahead
VI 2015:01 Insatser för innovationer
inomHälsa 02 FFI Årsrapport 2014 - Samverkan
för stark svensk fordonsindustri och miljöanpassade samt säkra transporter
03 Social innovation - Exempel04 Social innovation05 Årsredovisning 201406 Sweden needs FFI (for Swedish version
see VI 2015:10)07 Innovation för ett attraktivare
Sverige - Underlag till regeringens politik för forskning, innovation och högre utbildning 2017-2020 - Huvudrapport
Vinnova´s publicationsOctober 2017
See vinnova.se for more information
08 Förutsättningar för innovationspolitik i Sverige - Underlag till regeringens politik för forskning, innovation och högre utbildning 2017-2027 - Analysrapport
09 Replaced by VI 2016:0710 Sverige behöver FFI (for English
version see VI 2015:06)11 Replaced by VI 2017:06
VI 2014:01 Tjänsteinnovationer 200702 Innovationer som gör skillnad - en
tidning om innovationer inom offentliga verksamheter
03 Årsredovisning 201304 Replaced by VI 2016:0805 Replaced by VI 2015:0106 Din kontakt i EU:s forsknings- och
innovationsprogram07 VINNOVA - Sveriges
innovationsmyndighet. (For English version see VI 2014:10)
08 Visualisering - inom akademi, näringsliv och offentlig sektor
09 Projektkatalog Visualisering - inom akademi, näringsliv och offentlig sektor
10 VINNOVA - Sweden´s Innovation Agency (For Swedish version see VI 2014:07)
Vinnova ReportVR 2017:
01 Att skapa förutsättningar för innovation - Erfarenheter från ”Idéslussar i kommuner - förstudie 2015”
02 Testbäddar inom hälso- och sjukvård och äldreomsorg - Portföljutvärdering av Vinnovas program
03 Samband mellan immateriella tillgångar, innovation och ekonomisk tillväxt - Två kunskapsöversikter
VR 2016:01 Third Evaluation of VINN
Excellence Centres - AFC, BiMaC Innovation, BIOMATCELL, CESC, CHASE, ECO2, Faste, FUNMAT, GHz, HELIX, Hero-m, iPack, Mobile Life, ProNova, SAMOT, SuMo & WINGQUIST
02 Third Evaluation of Berzelii Centres - Exselent, UPSC & Uppsala Berzelii
03 NOVA - Verktyg och metoder för normkreativ innovation (for English version see VR 2016:06)
04 Forskning och utveckling för ökad jämställdhet - Följeforskning om Vinnovas regeringsuppdrag avseende behovsmotiverad forskning för ökad jämställdhet 2013-2015
05 This is about Change - Ten years as an on-going evaluator of the Triple Steelix initiative (For Swedish version see VR 2015:05)
06 NOVA – tools and methods for norm-creative innovation (for Swedish version see VR 2016:03)
07 Flaggskeppsfabriken - Styrkor i svensk produktion
08 Flaggskeppsmetodiken - En arbetsmetod för industriellt erfarenhetsutbyte
09 Evaluating the Role of HEIs´Interaction with Surrounding Society - Development Pilot in Sweden 2013-2016
10 Utvärdering strategiska innovationsprogram - Första utvärderingen av Processindustriell IT och automation, Produktion 2030, Gruv- och metallutvinning, Lättvikt och Metalliska material
11 Shaping the Future now - Good Start! International evaluation of Geo Life Region, Smart Housing Småland and The Paper Province 2.0
VR 2015:01 Bumpy flying at high altitude? -
International evaluation of Smart Textiles, The Biorefinery of the Future and Peak Innovation
02 From green forest to green commodity chemicals - Evaluating the potential for large-scale production in Sweden for three value chains
03 Innovationstävlingar i Sverige - insikter och lärdomar
04 Future Smart Industry - perspektiv på industriomvandling
05 Det handlar om förändring - Tio år som följeforskare i Triple Steelix (For English version see VR 2016:05)
06 Evaluation of the Programme Multidisciplinary BIO - The strategic Japanese-Swedish cooperation programme 2005 - 2014
07 Nätverksstyrning av transportinnovation
08 Ersättningssystem för innovation i vård och omsorg – En studie av åtta projekt som utvecklar nya ersättningsmodeller
VR 2014:01 Vägar till välfärdsinnovation - Hur
ersättningsmodeller och impact bonds kan stimulera nytänkande och innovation i offentlig verksamhet
02 Jämställdhet på köpet? - Marknadsfeminism, innovation och normkritik
03 Googlemodellen - Företagsledning för kontinuerlig innovation i en föränderlig värld
04 Öppna data 2014 - Nulägesanalys05 Institute Excellence Centres - IEC
-En utvärdering av programmet06 The many Faces of Implementation07 Slututvärdering Innovationsslussar
inom hälso- och sjukvården

Production: Vinnova´s CommunicationsOctober 2017

Post: Vinnova, SE-101 58 Stockholm, Sweden Office: Mäster Samuelsgatan 56+46 8 473 30 00 [email protected] vinnova.se
Vinnova - strengthening Sweden´s innovativeness


