The automobile industry by Sumit Jaiswal
37
-
Upload
sumeet-jayswaal -
Category
Documents
-
view
169 -
download
0
Transcript of The automobile industry by Sumit Jaiswal

The Automobile Industry
Presented By:-
Sumit Jaiswal
Sushil Powar
Sabir Siddhique
Kunal Sarkar
Mayur Avhad Presented By:- batch
29

Top To Bottom Approach

Global Economy Overview
Global economic growth is still weak, its underlying dynamics are changing, and the
risks to the forecast remain to the downside. As a result, new policy challenges are
arising and policy spillovers may pose greater concern. In particular, markets are
increasingly convinced that U.S. monetary policy is reaching a turning point, and
this has led to an unexpectedly large increase in long-term yields in the United States
and many other economies. Also, growth in China is slowing, which will affect many
other economies, notably the commodity exporters among the emerging market and
developing economies. The major economies must urgently adopt policies that improve
their prospects; otherwise the global economy may well settle into a subdued medium
term growth trajectory. The United States and Japan must develop and implement
strong plans with concrete measures for medium-term fiscal adjustment and entitlement
reform, and the euro area must develop a stronger currency union and clean up its
financial systems. China should provide a permanent boost to private consumption
spending to rebalance the growth of demand away from exports and investment.
In Many emerging market economies need a new round of structural reforms.
Indian Economic Overview
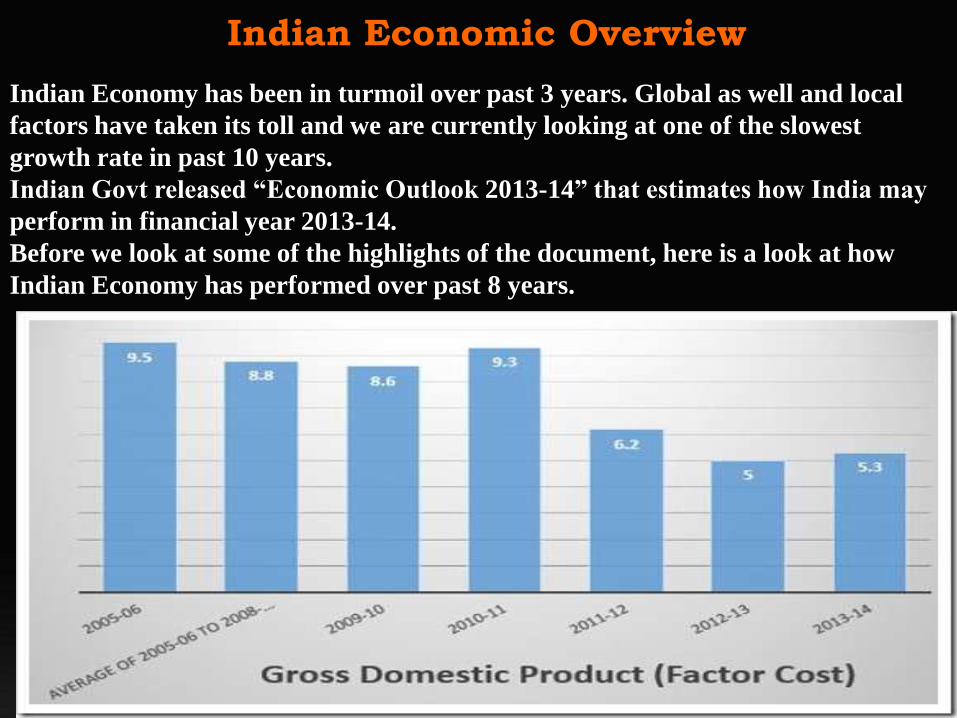
Indian Economy has been in turmoil over past 3 years. Global as well and local
factors have taken its toll and we are currently looking at one of the slowest
growth rate in past 10 years.
Indian Govt released “Economic Outlook 2013-14” that estimates how India may
perform in financial year 2013-14.
Before we look at some of the highlights of the document, here is a look at how
Indian Economy has performed over past 8 years.


Indian Economic Overview-Current Standing
Investment rate projected at 34.7% of GDP in 2013-14 as against the estimated 35% in
2012-13.
Domestic savings rate projected at 31% of GDP as against the estimated 30.2 % of GDP
2012-13.
Inflation by end March 2014 is expected to be around 5.5 percent as against the average of
7.4% in 2012-13 and 5.7% at end March 2013.
Current Account Deficit is expected to reduce to USD 70 billion (3.8% of GDP) in 2013-14
against an USD 88.2 billion (4.8% of GDP) in 2012-13. The center also expects that The
Current Account Deficit may go even below USD 70 billion, if the recent trends in exports
and imports are maintained through the year.
Net FDI inflows in 2013-14 projected at $21.7 billion against an estimated $19.8 billion in
2012-13.
FII inflows are estimated to reduce drastically to USD 2.7 billion in 2013-14, as against USD
17 billion in 2011-12 and USD 27 billion in 2012-13.
Net Capital flows projected at $ 61.4 billion (3.4% of GDP) in 2013-14 against an estimated
$ 89.4 billion in 2012-13, the second highest level to date.
Budgeted fiscal deficit is estimated at 4.8% of GDP in 2013-14, as against an estimated
4.9% in 2012-13.
In the whole, Indian economy is expected to do better than last year, but it is still much
lower than average growth rate of previous 5 years.

Automobile Industry-Growth Avenue
In terms of the Auto industry, India is the sixth largest market after China, US, Germany,
Japan and Brazil.
Overall the market includes cars, two wheelers, trucks & auto parts and India is expected
to become #3 in the automobile market by 2015 as defined by sales volume growth.
The auto sector reported a robust growth rate of 26% in the last two years (2010-2012)
although this year the growth has slowed down significantly.
The BSE AUTO Index outperformed the benchmark Nifty by 79%, 12% and 19% in FY10,
FY11 and FY12, respectively.
The world standings for the Indian automobile sector, as per the Confederation of Indian
Industry in FY 2012, was as follows:
Largest three-wheeler market
Second largest two-wheeler market
Tenth largest passenger car market
Fourth largest tractor market
Fifth largest commercial vehicle market
Fifth largest bus and truck segment
Since the de-licensing of the sector in 1991 and the subsequent opening up of 100% FDI
through the automatic route, the industry is one of the key drivers of economic growth of
the nation.

Government Support To The Automobile Industry
The Industrial Policy of 1991 de-licensed the Automobile Industry in India, but passenger
cars were de-licensed in 1993.
Now, no license is required for setting up any unit for manufacturing of Automobiles except
in some special cases. Further, 100% Foreign Direct Investment (FDI) is permissible.
Removal of Quantitative Restrictions (QRs) from April 1, 2001 has allowed the import of
vehicles, including in the passenger car segment where one can freely import subject to
certain conditions notified by Directorate General of Foreign Trade (DGFT).
To protect India from becoming a dumping ground for old and used vehicles produced
abroad, the custom duty on the import of second hand vehicles including passenger cars
has been raised to 111%.
Custom duty on Completely Built Units (CBU‟s) of large cars/ MUV‟s/ SUV‟s permitted for
import without any type approval (value exceeding US$40,000 and Engine Capacity
exceeding 3000 cc of Petrol and 2500 cc for Diesel) is being increased from 60% to 75%,
which might force foreign brands to set up manufacturing facilities in India.

Automobile Industry-Future Prospects
“By 2016, India will emerge as the destination of choice in Asia for the design &
manufacturing of automobiles and automotive components.
The output of the India‟s automotive sector will be $145bn by 2016,(from $34bn
in 2006) contributing to 10% of India‟s Gross Domestic Product and providing
employment to 25 mm people.
According to Draft Automotive Mission Plan 2006-2016 by the Ministry of Heavy
Industries & Public Enterprises.
Vision 2016
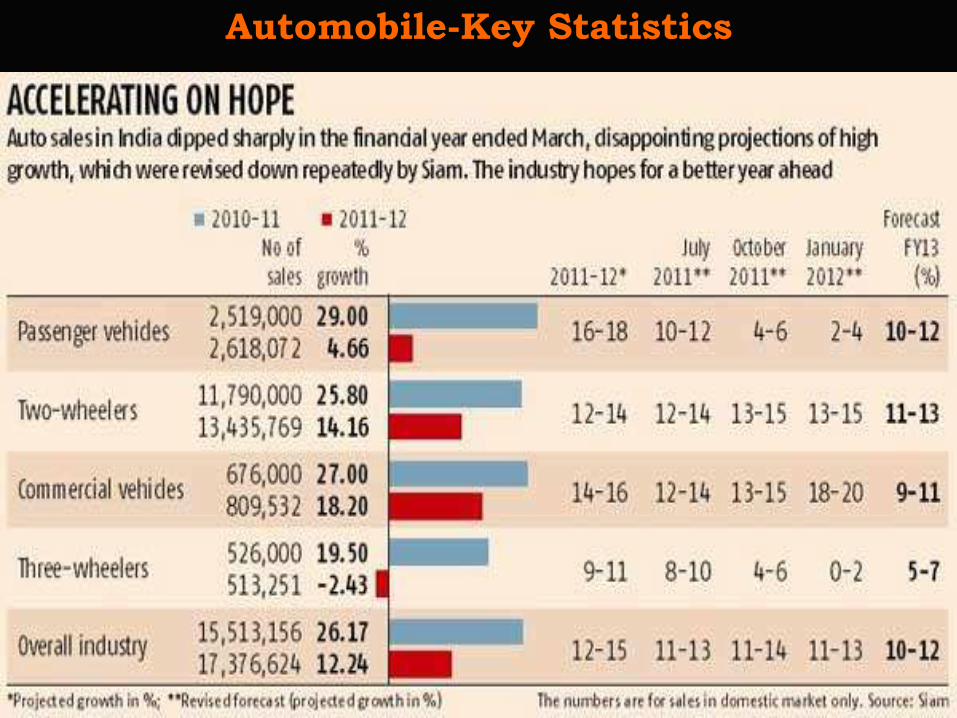
Automobile-Key Statistics

Structure Of The Auto Industry In India
• Automobiles

Passenger Vehicles

The Indian Passenger vehicle market is the 7th largest market in Asia and 10th largest
market in the world in terms of volume.
As per SIAM, passenger vehicles held a 15.07% domestic market share in the year
2012-12.
India sold 2.6mm passenger vehicles in the domestic market and exported 0.5mm
passenger vehicles in the year 2012-13 and grew at a 7 year CAGR of 14%.
The passenger Vehicle industry is likely to grow at a CAGR of 10-11% till FY 2017.
Small car segment to grow at a CAGR of 6-7% in next five years.
Mid size segment to record a rise of 17-18% by FY 2017.
Asian markets are expected to fuel the growth in the short term as demand drops in the
European markets, and growing demand for mid-size cars and preference for diesel
variants to further boost the realization over the medium term.
Automobile production in India is expected to grow by a modest 9% in 2013-14 as per
current industry forecasts.
Indian Passenger Vehicle Industry

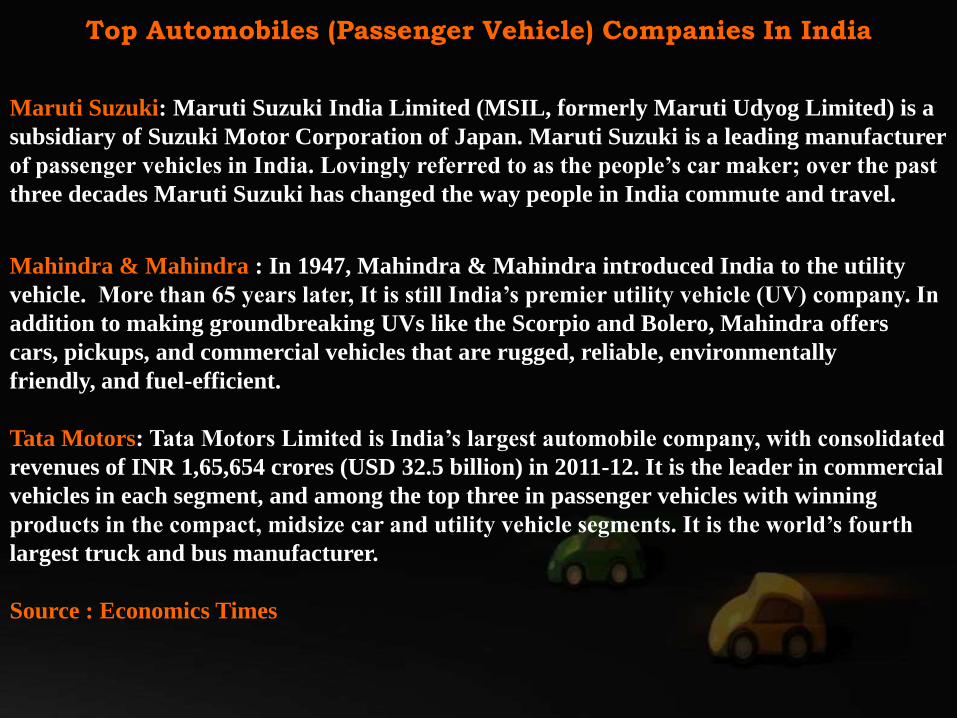
Top Automobiles (Passenger Vehicle) Companies In India
Maruti Suzuki: Maruti Suzuki India Limited (MSIL, formerly Maruti Udyog Limited) is a
subsidiary of Suzuki Motor Corporation of Japan. Maruti Suzuki is a leading manufacturer
of passenger vehicles in India. Lovingly referred to as the people‟s car maker; over the past
three decades Maruti Suzuki has changed the way people in India commute and travel.
Mahindra & Mahindra : In 1947, Mahindra & Mahindra introduced India to the utility
vehicle. More than 65 years later, It is still India‟s premier utility vehicle (UV) company. In
addition to making groundbreaking UVs like the Scorpio and Bolero, Mahindra offers
cars, pickups, and commercial vehicles that are rugged, reliable, environmentally
friendly, and fuel-efficient.
Tata Motors: Tata Motors Limited is India‟s largest automobile company, with consolidated
revenues of INR 1,65,654 crores (USD 32.5 billion) in 2011-12. It is the leader in commercial
vehicles in each segment, and among the top three in passenger vehicles with winning
products in the compact, midsize car and utility vehicle segments. It is the world‟s fourth
largest truck and bus manufacturer.
Source : Economics Times

Company Overview
Maruti Suzuki India Limited has been the leading manufacturer of passenger vehicles in
India over the past 3 decades.
It accounts for 60% of the total Indian passenger car market with respect to Volumes.
It has 15 brands and over 150 variants in all the vehicle segments.
The company has service centers in 1,400 in cities and over 200 driving schools across the
country, which make it one of the most well recognized brands in the country.
The Tragedy that happened at their Manesar plant as a result of labor unrest in
July 2012 has shaken up the auto industry & the entire Manesar belt.

Maruti Suzuki India Limited
Scrip Details
ISIN INE585B01010
Industry Cars & Utility Vehicles
Impact Cost 0.07%
BC/RD BC 16/08/2013-27/08/2013
Market lot 1
Listing Date 9/7/2003
Management
Name Designation
R C Bhargava Chairman
S Ravi Aiyar Company Secretary & Compliance Officer & Chief Legal Officer
Kenichi Ayukawa Managing Director & Chief Executive Officer
Toshihiro Suzuki Director
Kazuhiko Ayabe Director & Managing Executive Officer ( Marketing & Sales)
Masayuki Kamiya Director (Production)
Toshiaki Hasuike Joint Managing Director

Income Statement
(in Cr.) 2013 2012 2011 2010 2009
Income Statement
Revenue 43,587.93 35,587.09 37,040.09 29,623.01 20,852.52
Other Income 812.37 826.86 482.31 496.76 601.34
Total Income 44,400.30 36,413.95 37,522.40 30,119.77 21,453.86
Expenditure -39,358.25 -33,074.20 -33,375.74 -25,668.72 -19,020.46
Interest -189.82 -55.21 -24.41 -33.5 -50.98
PBDT 4,852.23 3,284.54 4,122.25 4,417.55 2,382.42
Depreciation -1,861.17 -1,138.35 -1,013.50 -825.02 -706.54
PBT 2,991.06 2,146.19 3,108.75 3,592.53 1,675.88
Tax -598.93 -511.05 -820.11 -1,094.91 -457.14
Net Profit 2,392.13 1,635.14 2,288.64 2,497.62 1,218.74
Equity 151.04 144.46 144.46 144.46 144.46
EPS 79.19 56.6 79.22 86.45 42.18
CEPS 140.8 96 114.29 115 66.64
OPM % 11.57 9.38 11.2 15.03 11.67
NPM % 5.49 4.59 6.18 8.43 5.84

Dec-13 Sep-13 Jun-13 Mar-13 Dec-12
Promoter and
Promoter Group 56.21% 56.21% 56.21% 56.21% 54.21%
Indian -- -- -- -- --
Foreign 56.21% 56.21% 56.21% 56.21% 54.21%
Public 43.79% 43.79% 43.79% 43.79% 45.79%
Institutions 35.45% 35.01% 35.10% 34.96% 37.48%
FII 21.47% 19.66% 22.03% 22.36% 23.13%
DII 13.98% 15.35% 13.07% 12.60% 14.35%
Non Institutions 8.34% 8.78% 8.69% 8.83% 8.31%
Bodies Corporate 6.08% 6.38% 6.43% 6.31% 5.88%
Custodians -- -- -- -- --
Total 30,20,80,060 30,20,80,060 30,20,80,060 30,20,80,060 28,89,10,060
Shareholding Pattern As On

Mahindra & Mahindra: In 1947, Mahindra & Mahindra introduced India to
the utility vehicle. More than 65 years later, It is still India‟s premier utility
vehicle (UV) company. In addition to making groundbreaking UVs like the
Scorpio and Bolero, Mahindra offers cars, pickups, and commercial vehicles
that are rugged, reliable, environmentally friendly, and fuel-efficient.
Company Overview
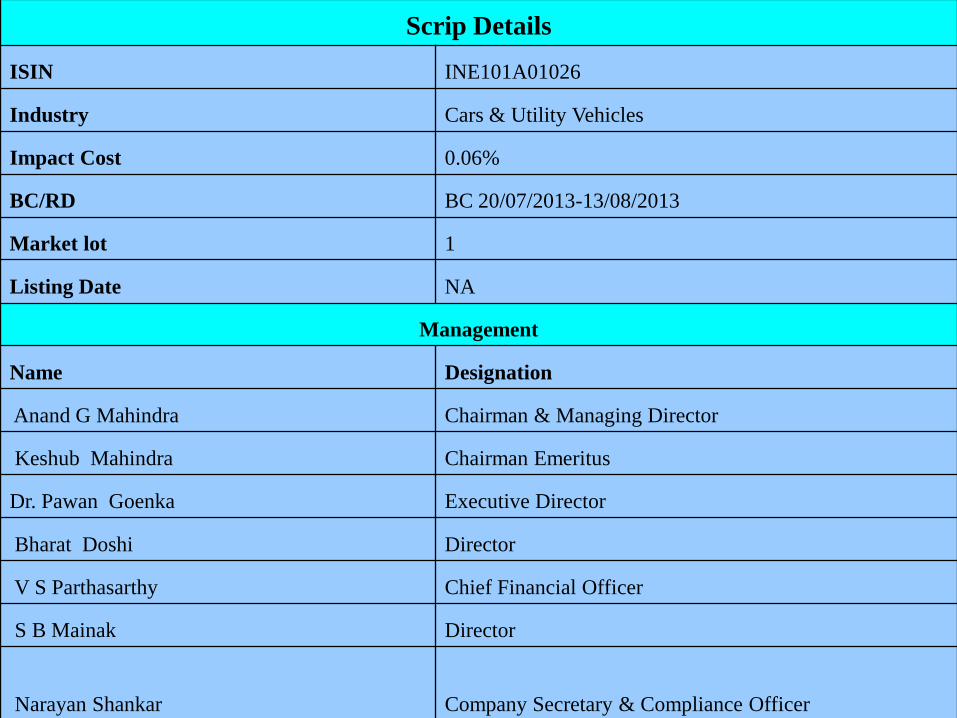
Scrip Details
ISIN INE101A01026
Industry Cars & Utility Vehicles
Impact Cost 0.06%
BC/RD BC 20/07/2013-13/08/2013
Market lot 1
Listing Date NA
Management
Name Designation
Anand G Mahindra Chairman & Managing Director
Keshub Mahindra Chairman Emeritus
Dr. Pawan Goenka Executive Director
Bharat Doshi Director
V S Parthasarthy Chief Financial Officer
S B Mainak Director
Narayan Shankar Company Secretary & Compliance Officer
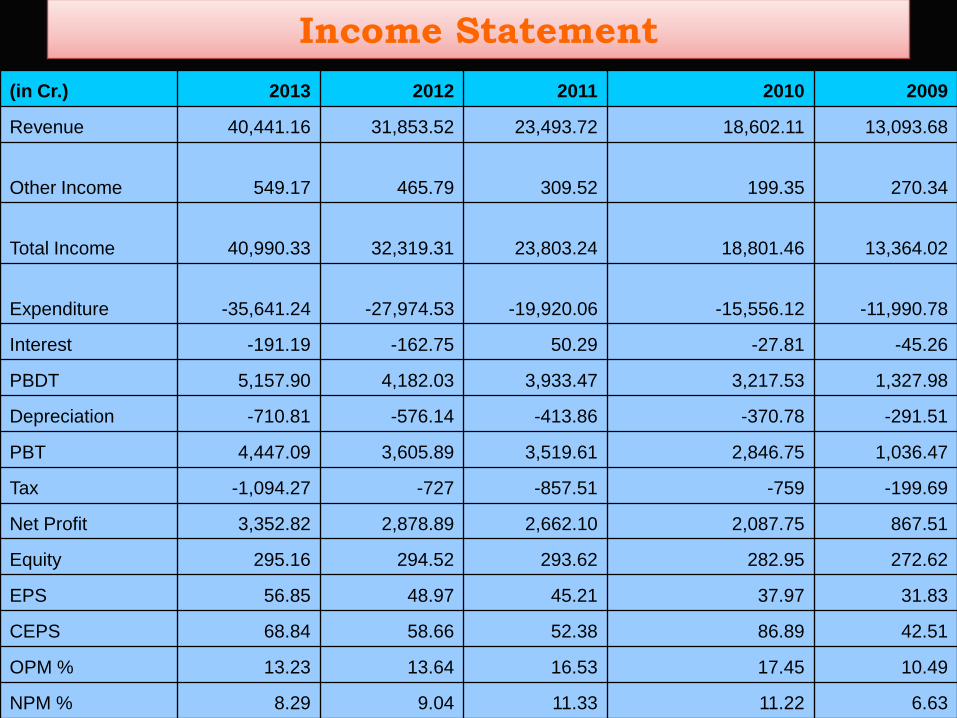
Income Statement
(in Cr.) 2013 2012 2011 2010 2009
Revenue 40,441.16 31,853.52 23,493.72 18,602.11 13,093.68
Other Income 549.17 465.79 309.52 199.35 270.34
Total Income 40,990.33 32,319.31 23,803.24 18,801.46 13,364.02
Expenditure -35,641.24 -27,974.53 -19,920.06 -15,556.12 -11,990.78
Interest -191.19 -162.75 50.29 -27.81 -45.26
PBDT 5,157.90 4,182.03 3,933.47 3,217.53 1,327.98
Depreciation -710.81 -576.14 -413.86 -370.78 -291.51
PBT 4,447.09 3,605.89 3,519.61 2,846.75 1,036.47
Tax -1,094.27 -727 -857.51 -759 -199.69
Net Profit 3,352.82 2,878.89 2,662.10 2,087.75 867.51
Equity 295.16 294.52 293.62 282.95 272.62
EPS 56.85 48.97 45.21 37.97 31.83
CEPS 68.84 58.66 52.38 86.89 42.51
OPM % 13.23 13.64 16.53 17.45 10.49
NPM % 8.29 9.04 11.33 11.22 6.63
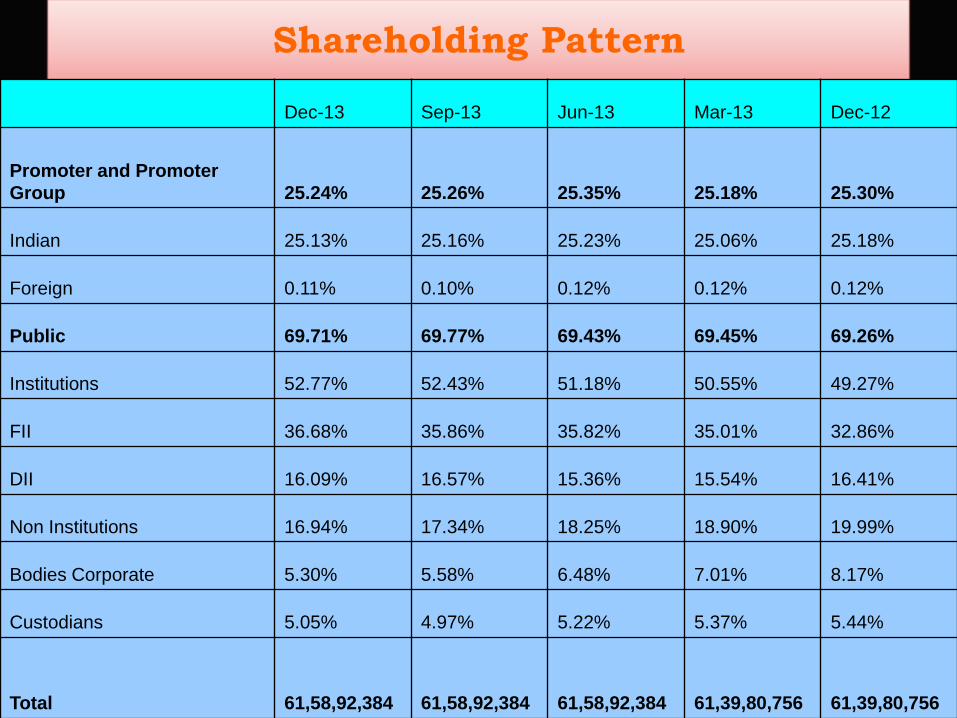
Shareholding Pattern
Dec-13 Sep-13 Jun-13 Mar-13 Dec-12
Promoter and Promoter
Group 25.24% 25.26% 25.35% 25.18% 25.30%
Indian 25.13% 25.16% 25.23% 25.06% 25.18%
Foreign 0.11% 0.10% 0.12% 0.12% 0.12%
Public 69.71% 69.77% 69.43% 69.45% 69.26%
Institutions 52.77% 52.43% 51.18% 50.55% 49.27%
FII 36.68% 35.86% 35.82% 35.01% 32.86%
DII 16.09% 16.57% 15.36% 15.54% 16.41%
Non Institutions 16.94% 17.34% 18.25% 18.90% 19.99%
Bodies Corporate 5.30% 5.58% 6.48% 7.01% 8.17%
Custodians 5.05% 4.97% 5.22% 5.37% 5.44%
Total 61,58,92,384 61,58,92,384 61,58,92,384 61,39,80,756 61,39,80,756
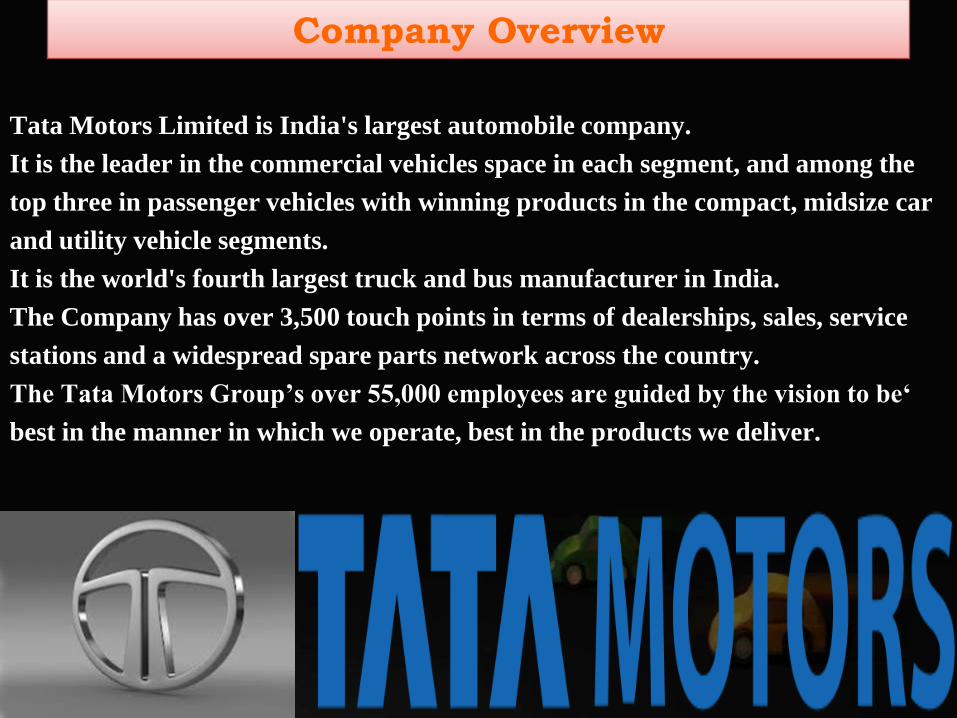
Tata Motors Limited is India's largest automobile company.
It is the leader in the commercial vehicles space in each segment, and among the
top three in passenger vehicles with winning products in the compact, midsize car
and utility vehicle segments.
It is the world's fourth largest truck and bus manufacturer in India.
The Company has over 3,500 touch points in terms of dealerships, sales, service
stations and a widespread spare parts network across the country.
The Tata Motors Group‟s over 55,000 employees are guided by the vision to be„
best in the manner in which we operate, best in the products we deliver.
Company Overview
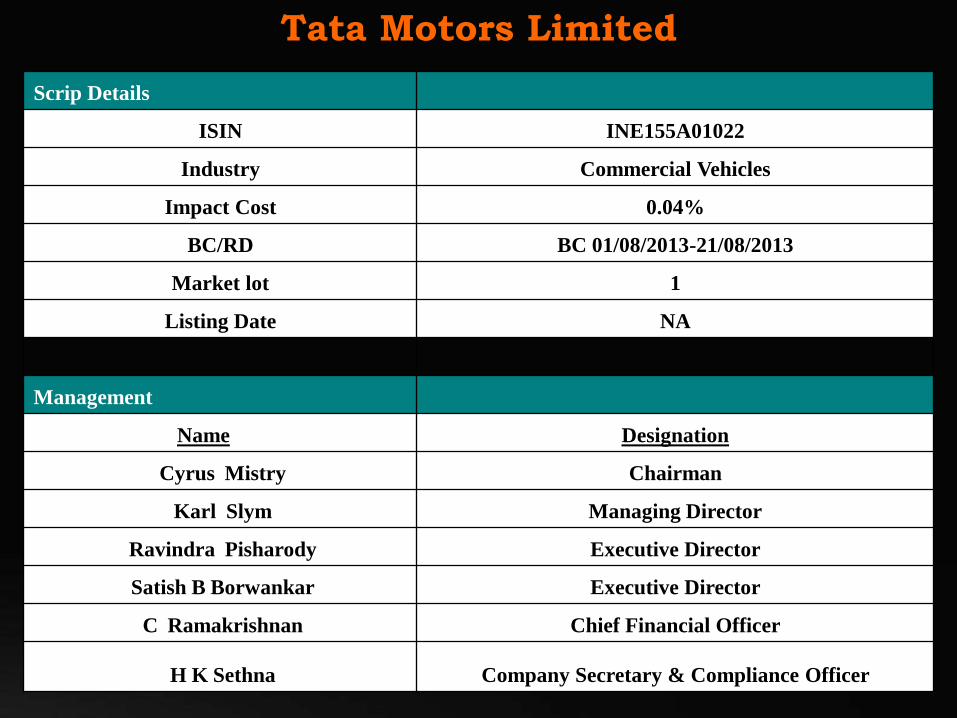
Tata Motors Limited
Scrip Details
ISIN INE155A01022
Industry Commercial Vehicles
Impact Cost 0.04%
BC/RD BC 01/08/2013-21/08/2013
Market lot 1
Listing Date NA
Management
Name Designation
Cyrus Mistry Chairman
Karl Slym Managing Director
Ravindra Pisharody Executive Director
Satish B Borwankar Executive Director
C Ramakrishnan Chief Financial Officer
H K Sethna Company Secretary & Compliance Officer

Income Statement
(in Cr.) 2013 2012 2011 2010 2009
Revenue 44,765.72 54,306.56 48,040.46 35,593.05 25,660.79
Other Income 2,088.20 574.08 183.26 1,853.45 925.97
Total Income 46,853.92 54,880.64 48,223.72 37,446.50 26,586.76
Expenditure -43,473.61 -50,714.25 -43,522.44 -32,479.25 -24,024.78
Interest -1,387.76 -1,218.62 -1,143.99 -1,103.84 -673.68
PBDT 1,992.55 2,947.77 3,557.29 3,863.41 1,888.30
Depreciation -1,817.62 -1,606.74 -1,360.77 -1,033.87 -874.54
PBT 174.93 1,341.03 2,196.52 2,829.54 1,013.76
Tax 126.88 -98.8 -384.7 -589.46 -12.5
Net Profit 301.81 1,242.23 1,811.82 2,240.08 1,001.26
Equity 638.07 634.75 637.71 570.6 514.05
EPS 0.93 3.9 30.28 42.37 22.7
CEPS 6.64 8.98 49.75 57.38 36.49
OPM % 7.55 7.67 9.79 13.96 9.98
NPM % 0.67 2.29 3.77 6.29 3.9
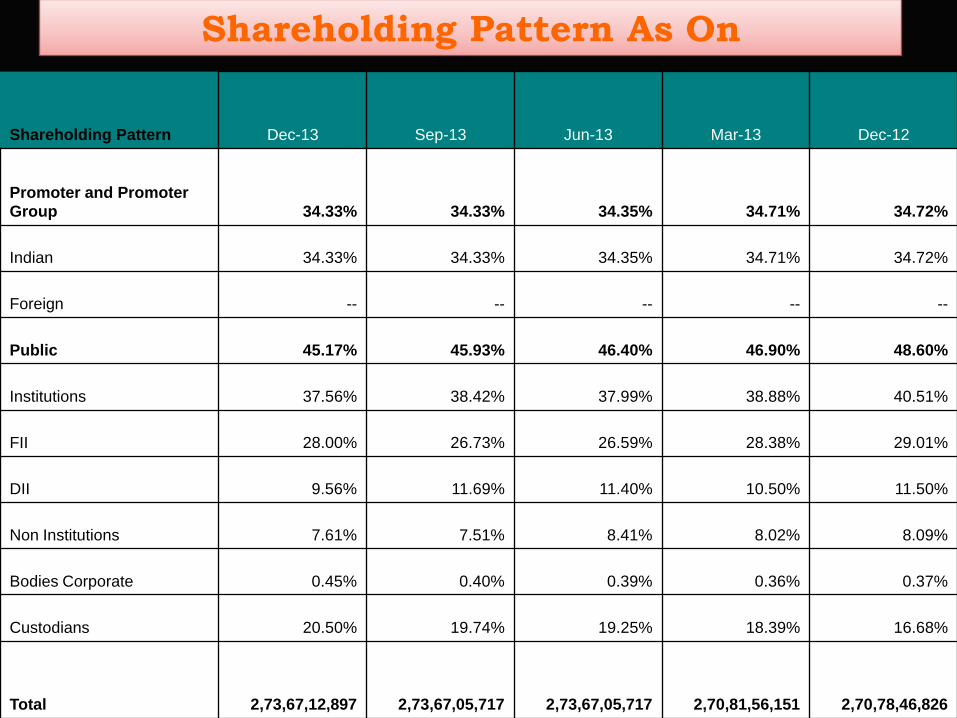
Shareholding Pattern As On
Shareholding Pattern Dec-13 Sep-13 Jun-13 Mar-13 Dec-12
Promoter and Promoter
Group 34.33% 34.33% 34.35% 34.71% 34.72%
Indian 34.33% 34.33% 34.35% 34.71% 34.72%
Foreign -- -- -- -- --
Public 45.17% 45.93% 46.40% 46.90% 48.60%
Institutions 37.56% 38.42% 37.99% 38.88% 40.51%
FII 28.00% 26.73% 26.59% 28.38% 29.01%
DII 9.56% 11.69% 11.40% 10.50% 11.50%
Non Institutions 7.61% 7.51% 8.41% 8.02% 8.09%
Bodies Corporate 0.45% 0.40% 0.39% 0.36% 0.37%
Custodians 20.50% 19.74% 19.25% 18.39% 16.68%
Total 2,73,67,12,897 2,73,67,05,717 2,73,67,05,717 2,70,81,56,151 2,70,78,46,826

Key Ratio
I. ACTIVITY RATIO M & M TATAMOT Maruti
1) Inventory Turnover 9.50% 9.88% 26.78%
2) Receivables Turnover 14.29 Times 17,25 Times 33.50 Times
3) Payable Turnover 2.76 Times 2.16 Times 6.04 Times
II.PROFITABILITY RATIO M & M TATAMOT Maruti
1) Gross Profit Margin 11.00% 11.22% 11.19%
2) Operating Profit Margin 14.00% 13.11% 10.30%
3) Pre - Tax Margin 8.12% 7.22% 6.15%
4) Return on Assets 7.18% 5.77% 1.47%
5) Return on Capital Employed 14.78% 17.93% 16.00%
6) Return on Equity 18.26% 26.04% 15.02%
III. SOLVENCY RATIO M & M TATAMOT Maruti
1) Debt to Asset 0.74 0.59 o.79
2) Debt to Equity 1.43 1.43 0.09
3) Debt to Capital 1.44 1.4 8.24
4) Interest Coverage 3.43 4.84 14.55
IV. LIQUIDITY RATIO M & M TATAMOT Maruti
1) Current Ratio 1.21 0.82 0.85
2) Quick Ratio 1.56 0.7 0.73
V. VALUATION RATIO M & M TATAMOT Maruti
1) Earning Per Share 67.87 30.66 80.4
2) Dividend Payout 19.15 6.58 9.55
3) Retention 18.15 5.58 8.55
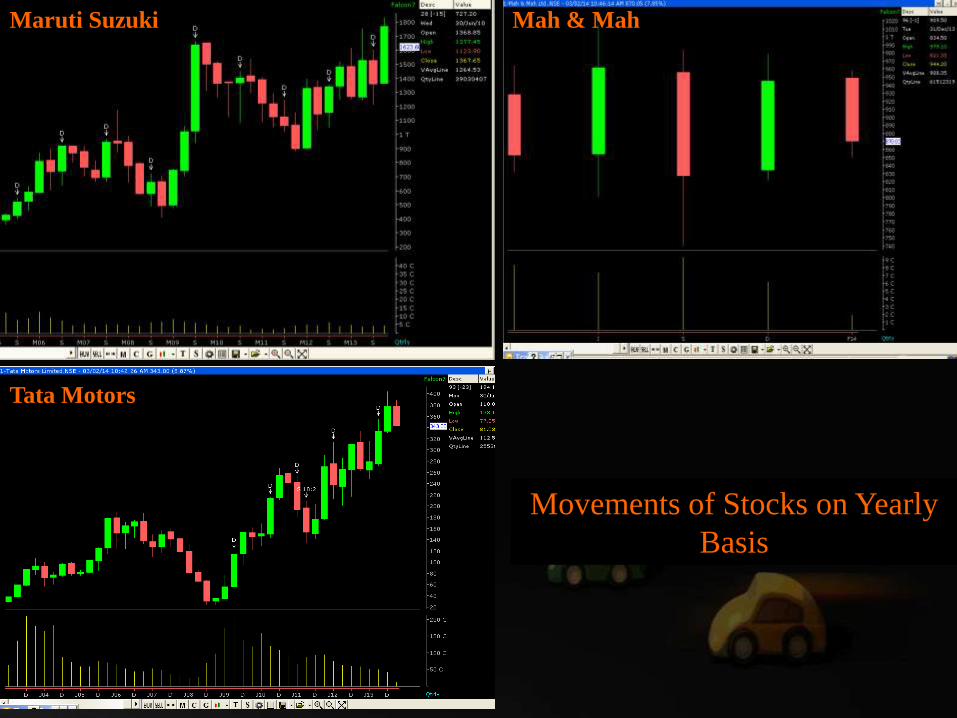
Maruti Suzuki Mah & Mah
Tata Motors
Movements of Stocks on Yearly
Basis
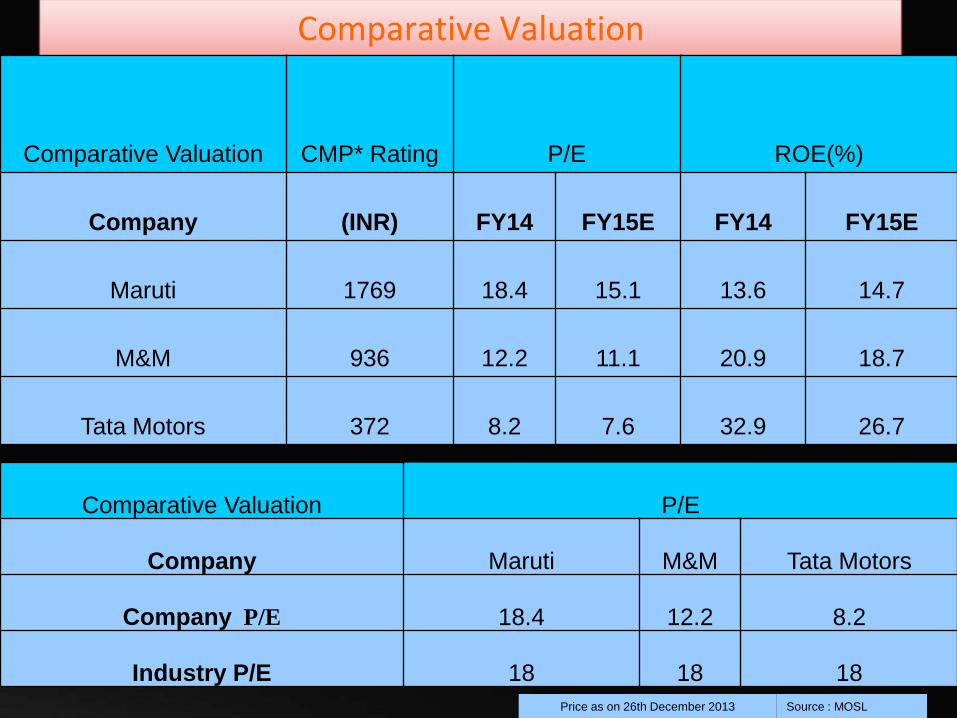
Comparative Valuation
Comparative Valuation CMP* Rating P/E ROE(%)
Company (INR) FY14 FY15E FY14 FY15E
Maruti 1769 18.4 15.1 13.6 14.7
M&M 936 12.2 11.1 20.9 18.7
Tata Motors 372 8.2 7.6 32.9 26.7
Price as on 26th December 2013 Source : MOSL
Comparative Valuation P/E
Company Maruti M&M Tata Motors
Company P/E 18.4 12.2 8.2
Industry P/E 18 18 18

Key Financial Indicators
Key Financial Indicators
EBITDA Margins
(%) EPS (INR) EPS Growth(%)
Company FY14 FY15E FY14 FY15E FY14 FY15E
Maruti Suzuki 12.1 12.8 96.4 117.3 20 23.4
M&M 14.5 14.5 76.5 84.7 25.6 10.6
Tata Motors 16.2 15.5 45.3 48.7 41.2 7.6
Source : BSE

Peer Group Comparison
Quarterly Trends
Mahindra &
Mahindra Maruti Suzuki Tata Motors
LTP 885 1,620.70 336.6
Change % -0.61 -0.9 -3.79
52 W H/L 1,026.45/741.50 1,864.00/1,217.00 405.00/252.10
Results (in Cr.) View in
(Million) 13-Sep 13-Dec 13-Sep
Sales 8,929.57 10,893.84 8,868.45
PAT 989.5 681.15 -803.53
Equity 295.16 151.04 643.78
Face Value 5 5 2
Source : BSE

Peer Group Comparison
Annual TrendsMahindra &
Mahindra Maruti Suzuki Tata Motors
LTP 885 1,620.70 336.6
Change % -0.61 -0.9 -3.79
52 W H/L 1,026.45/741.50 1,864.00/1,217.00 405.00/252.10
Results (in Cr.) View in (Million) 13-Mar 13-Mar 13-Mar
Sales 40,441.16 43,587.93 44,765.72
PAT 3,352.82 2,392.13 301.81
Equity 295.16 151.04 638.07
Face Value 5 5 2
Source : BSE


Maruti Suzuki : We believe the Gujarat facility arrangement through Suzuki 100%
subsidiary is beneficial to MSIL.
MSIL would benefit from similar free cash flows but without any capex for 1st phase of
investment, thus improving overall profits (with treasury income) and return ratios.
Suzuki, Japan intention is not to profit from this investment directly but through MSIL
(given its 56% stake). Moreover, with contract manufacturing through Suzuki, MSIL
can channelize its energy towards more value added activities like marketing/R&D.
Impact on financials of the Gujarat facility though would be seen only in FY17.
Mahindra & Mahindra Ltd.: said, We have achieved a cumulative domestic growth till
January 2014 of 23%. We expect the good run to continue for the rest of the quarter
Tatamotors Car sales stood at 8,663 units (est 8,000 units), a decline of 25% YoY
(+30% MoM). UV sales were at 2,635 units (est 2,900 units), a decline of 36% YoY (-
6% MoM). We have built-in de-growth of 37% for the PV segment for FY14.
The stock trades at 7.2x/5.8x FY15E/16E consol. EPS of INR48.7/60.5 respectively. So
we suggest to buy TATAMOTORS with Target price of % 500/-
Summary