
The Australian economy in 2009 -...
23
The Australian economy in 2009 Presentation to ANZ Management Board Melbourne 19 th January 2009 Saul Eslake Chief Economist, ANZ
Transcript of The Australian economy in 2009 -...

The Australian economy in 2009
Presentation to ANZ Management Board
Melbourne19th January 2009
Saul EslakeChief Economist, ANZ
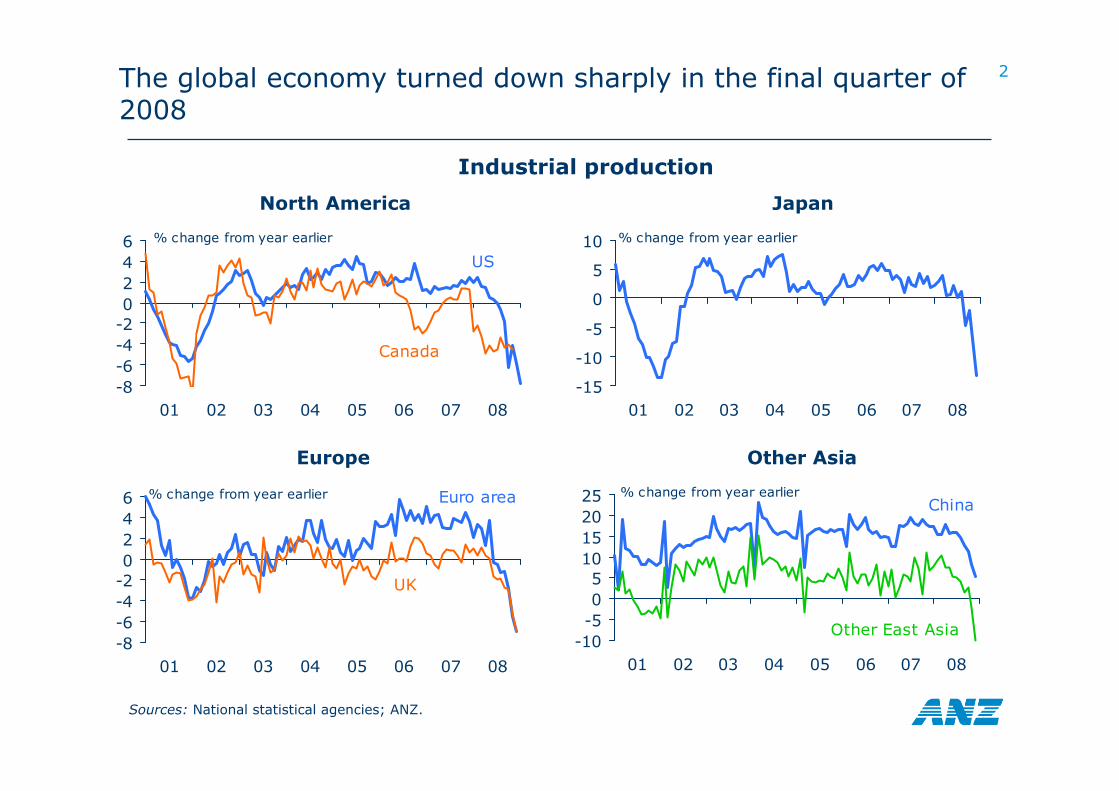
2The global economy turned down sharply in the final quarter of 2008
Industrial production
North America
Europe
Sources: National statistical agencies; ANZ.
Other Asia
Japan
-8-6-4-20246
01 02 03 04 05 06 07 08
% change from year earlier
US
Canada
-8-6-4-20246
01 02 03 04 05 06 07 08
% change from year earlier Euro area
UK
-15
-10
-5
0
5
10
01 02 03 04 05 06 07 08
% change from year earlier
-10-505
10152025
01 02 03 04 05 06 07 08
% change from year earlierChina
Other East Asia
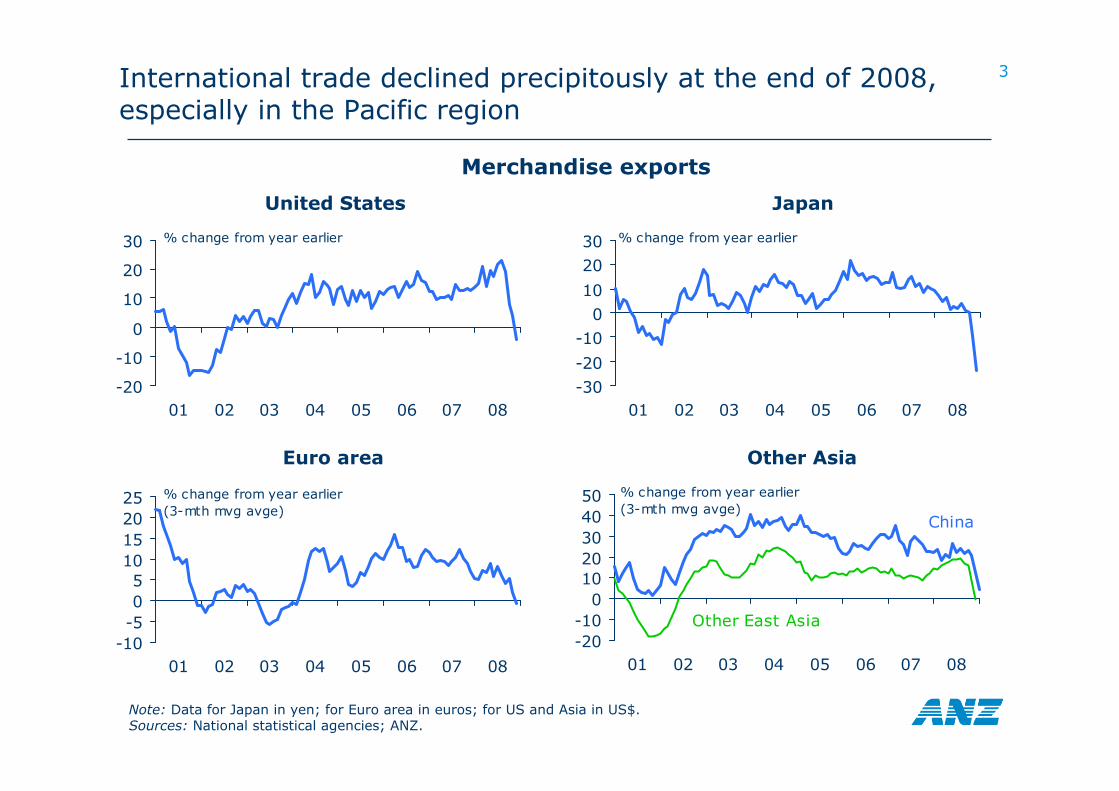
3International trade declined precipitously at the end of 2008, especially in the Pacific region
Merchandise exports
United States
Euro area
Note: Data for Japan in yen; for Euro area in euros; for US and Asia in US$.Sources: National statistical agencies; ANZ.
Other Asia
Japan
-20
-10
0
10
20
30
01 02 03 04 05 06 07 08
% change from year earlier
-30-20
-100
10
2030
01 02 03 04 05 06 07 08
% change from year earlier
-20-10
01020304050
01 02 03 04 05 06 07 08
% change from year earlier(3-mth mvg avge)
China
Other East Asia-10-505
10152025
01 02 03 04 05 06 07 08
% change from year earlier(3-mth mvg avge)
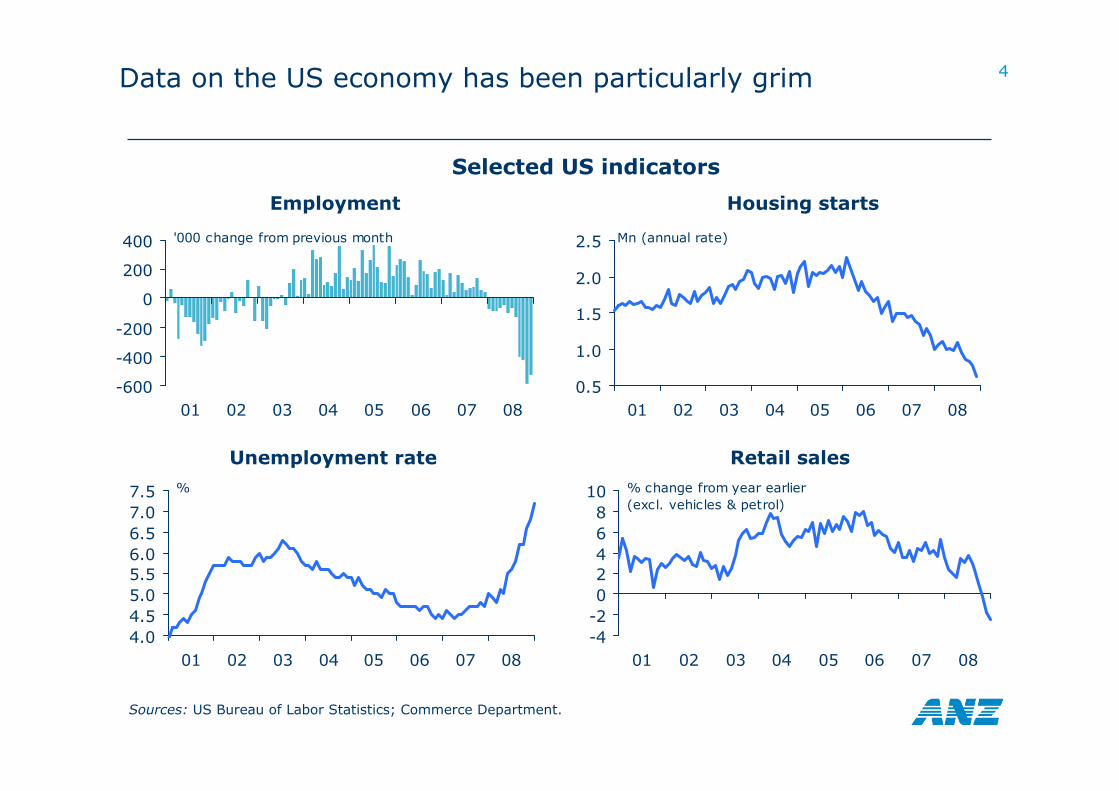
4Data on the US economy has been particularly grim
Selected US indicators
Employment
Unemployment rate
Sources: US Bureau of Labor Statistics; Commerce Department.
Housing starts
-600
-400
-200
0
200
400
01 02 03 04 05 06 07 08
'000 change from previous month
0.5
1.0
1.5
2.0
2.5
01 02 03 04 05 06 07 08
Mn (annual rate)
4.04.55.05.56.06.57.07.5
01 02 03 04 05 06 07 08
%
Retail sales
-4-202468
10
01 02 03 04 05 06 07 08
% change from year earlier(excl. vehicles & petrol)
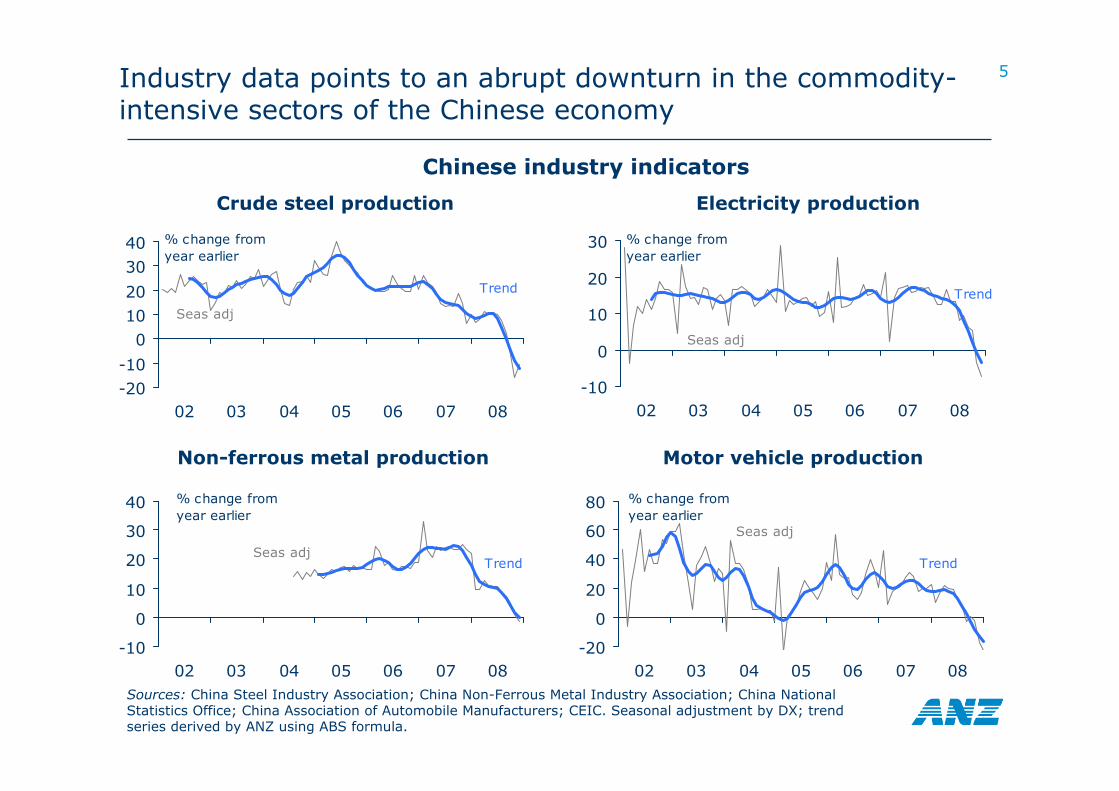
5Industry data points to an abrupt downturn in the commodity-intensive sectors of the Chinese economy
Chinese industry indicators
Crude steel production
Non-ferrous metal production
Sources: China Steel Industry Association; China Non-Ferrous Metal Industry Association; China National Statistics Office; China Association of Automobile Manufacturers; CEIC. Seasonal adjustment by DX; trend series derived by ANZ using ABS formula.
-20-10
01020
3040
02 03 04 05 06 07 08
% change from year earlier
Seas adj
Trend
-10
0
10
20
30
40
02 03 04 05 06 07 08
% change fromyear earlier
Seas adjTrend
Electricity production
-10
0
10
20
30
02 03 04 05 06 07 08
% change from year earlier
Seas adj
Trend
Motor vehicle production
-20
0
20
40
60
80
02 03 04 05 06 07 08
% change fromyear earlier
Seas adj
Trend
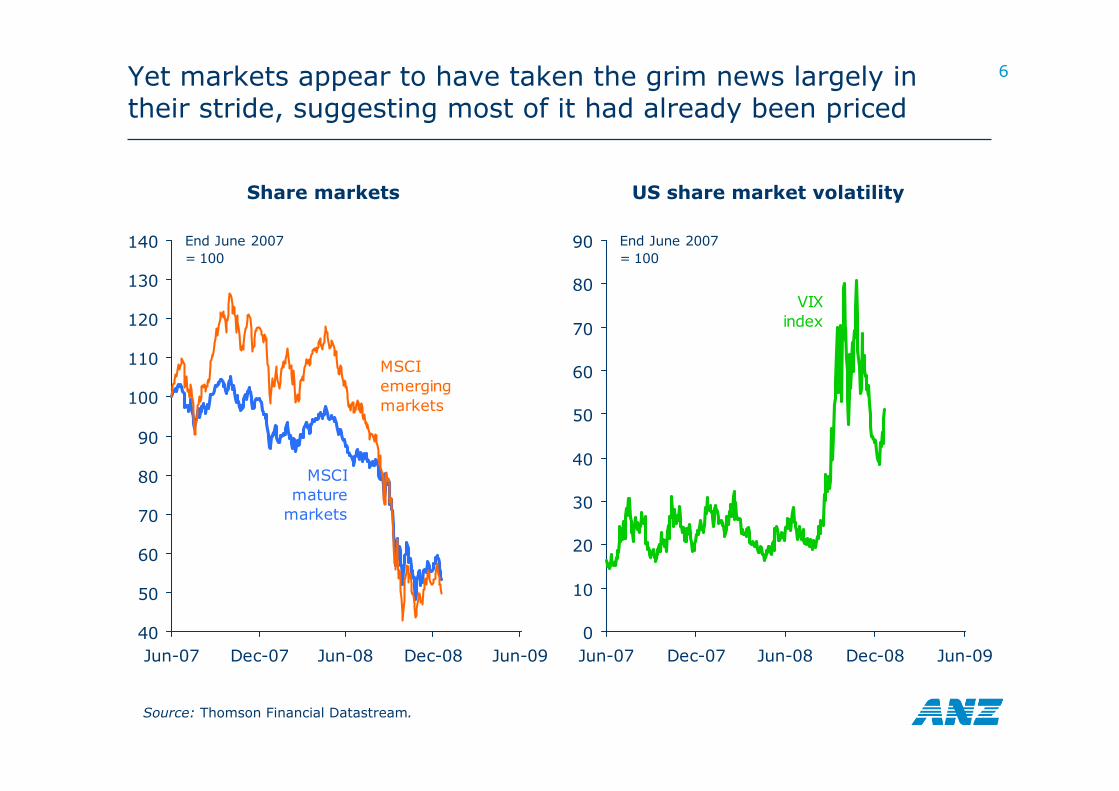
6Yet markets appear to have taken the grim news largely in their stride, suggesting most of it had already been priced
Source: Thomson Financial Datastream.
40
50
60
70
80
90
100
110
120
130
140
Jun-07 Dec-07 Jun-08 Dec-08 Jun-09
End June 2007= 100
MSCIemergingmarkets
MSCImature
markets
Share markets
0
10
20
30
40
50
60
70
80
90
Jun-07 Dec-07 Jun-08 Dec-08 Jun-09
End June 2007= 100
VIXindex
US share market volatility
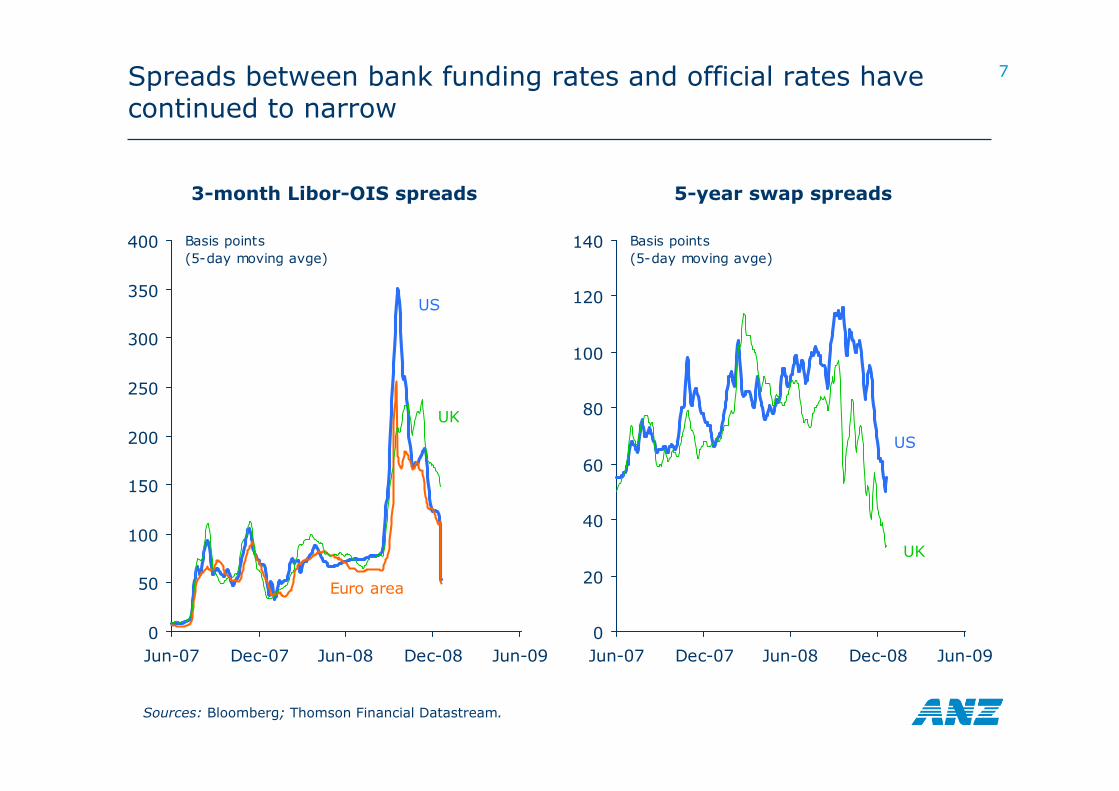
7Spreads between bank funding rates and official rates have continued to narrow
Sources: Bloomberg; Thomson Financial Datastream.
0
50
100
150
200
250
300
350
400
Jun-07 Dec-07 Jun-08 Dec-08 Jun-09
Basis points(5-day moving avge)
Euro area
US
UK
3-month Libor-OIS spreads 5-year swap spreads
0
20
40
60
80
100
120
140
Jun-07 Dec-07 Jun-08 Dec-08 Jun-09
Basis points(5-day moving avge)
US
UK
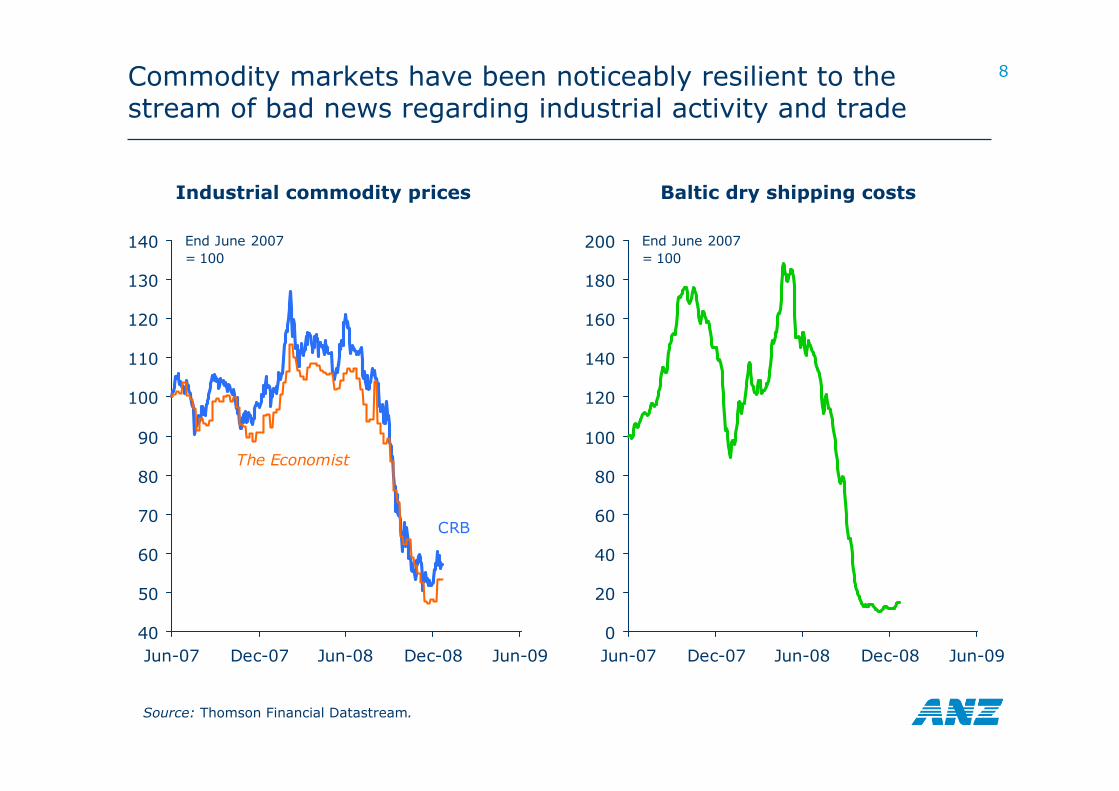
8Commodity markets have been noticeably resilient to the stream of bad news regarding industrial activity and trade
Source: Thomson Financial Datastream.
40
50
60
70
80
90
100
110
120
130
140
Jun-07 Dec-07 Jun-08 Dec-08 Jun-09
End June 2007= 100
The Economist
CRB
Industrial commodity prices Baltic dry shipping costs
0
20
40
60
80
100
120
140
160
180
200
Jun-07 Dec-07 Jun-08 Dec-08 Jun-09
End June 2007= 100
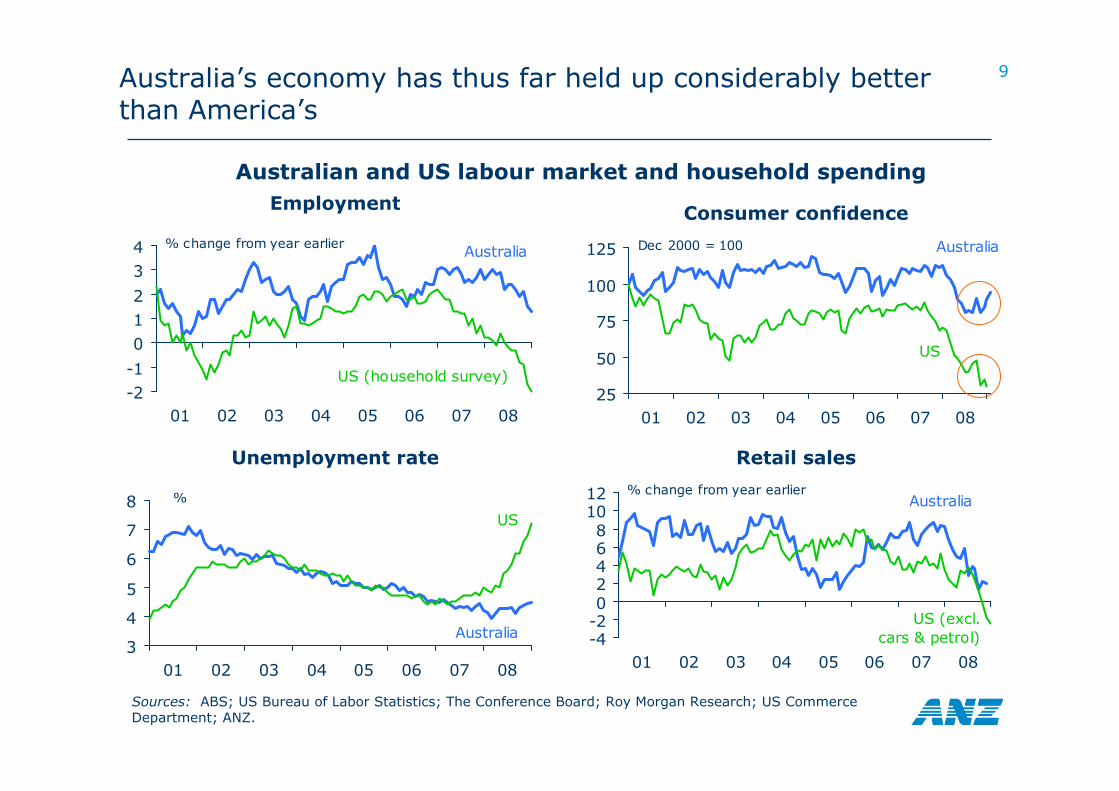
9Australia’s economy has thus far held up considerably better than America’s
Australian and US labour market and household spendingEmployment
Sources: ABS; US Bureau of Labor Statistics; The Conference Board; Roy Morgan Research; US Commerce Department; ANZ.
-2-1
012
34
01 02 03 04 05 06 07 08
% change from year earlier
US (household survey)
Australia
Retail sales
-4-202468
1012
01 02 03 04 05 06 07 08
% change from year earlier
US (excl.cars & petrol)
Australia
Unemployment rate
3
4
5
6
7
8
01 02 03 04 05 06 07 08
%
US
Australia
Consumer confidence
25
50
75
100
125
01 02 03 04 05 06 07 08
Dec 2000 = 100
US
Australia
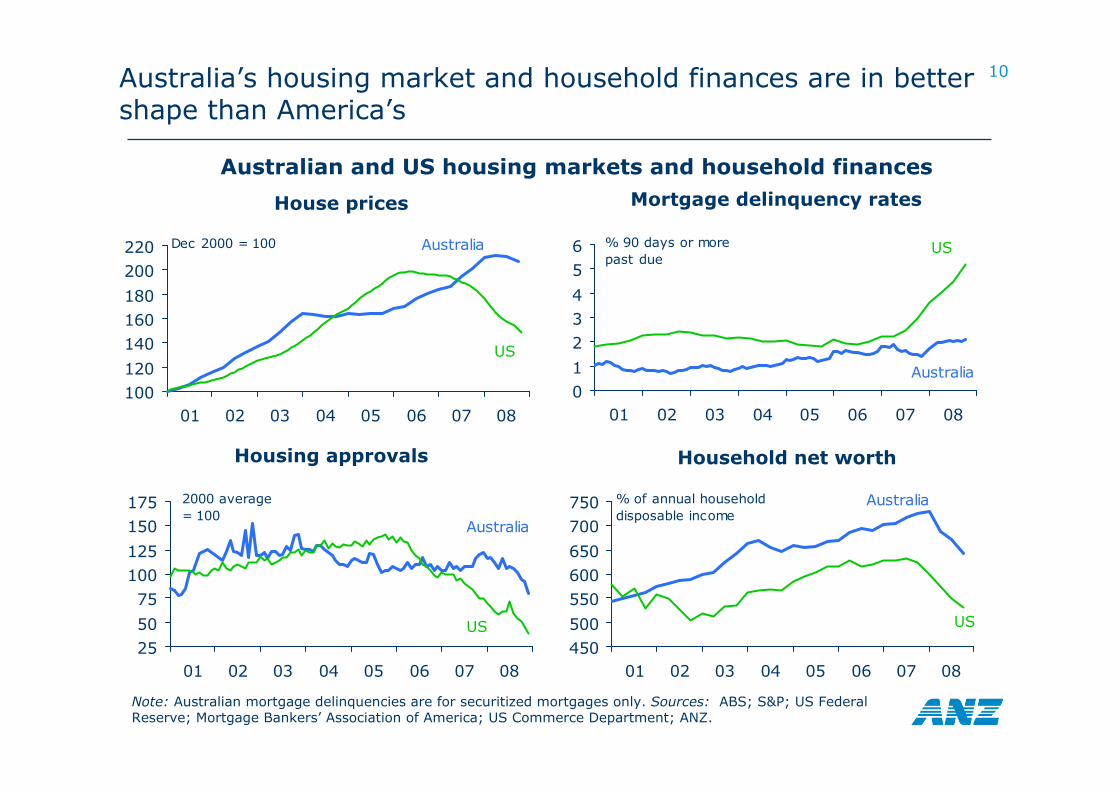
10Australia’s housing market and household finances are in better shape than America’s
Australian and US housing markets and household finances
Note: Australian mortgage delinquencies are for securitized mortgages only. Sources: ABS; S&P; US Federal Reserve; Mortgage Bankers’ Association of America; US Commerce Department; ANZ.
Household net worth
450500
550600650
700750
01 02 03 04 05 06 07 08
% of annual householddisposable income
US
Australia
Housing approvals
2550
75100125
150175
01 02 03 04 05 06 07 08
2000 average= 100
US
Australia
House prices
100120
140160180
200220
01 02 03 04 05 06 07 08
Dec 2000 = 100
US
Australia
Mortgage delinquency rates
01
234
56
01 02 03 04 05 06 07 08
% 90 days or more past due
US
Australia
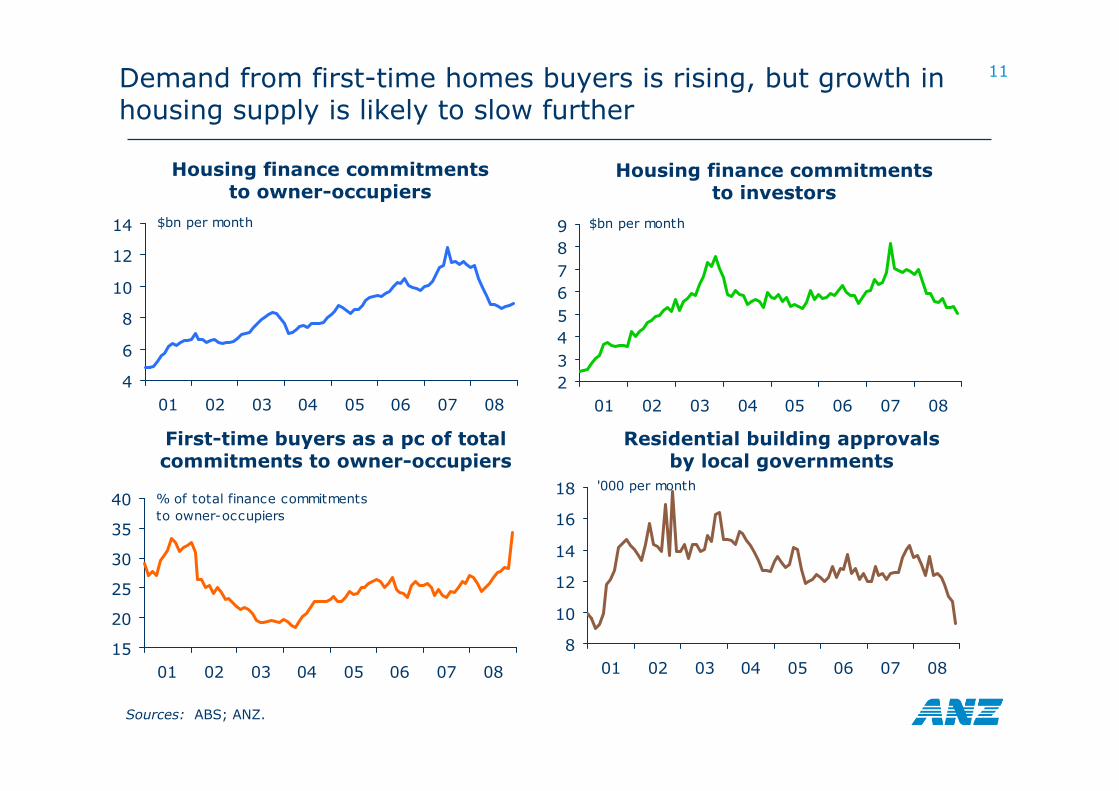
11Demand from first-time homes buyers is rising, but growth in housing supply is likely to slow further
Sources: ABS; ANZ.
Housing finance commitmentsto owner-occupiers
4
6
8
10
12
14
01 02 03 04 05 06 07 08
$bn per month
15
20
25
30
35
40
01 02 03 04 05 06 07 08
% of total finance commitmentsto owner-occupiers
Housing finance commitmentsto investors
First-time buyers as a pc of totalcommitments to owner-occupiers
23456789
01 02 03 04 05 06 07 08
$bn per month
8
10
12
14
16
18
01 02 03 04 05 06 07 08
'000 per month
Residential building approvalsby local governments
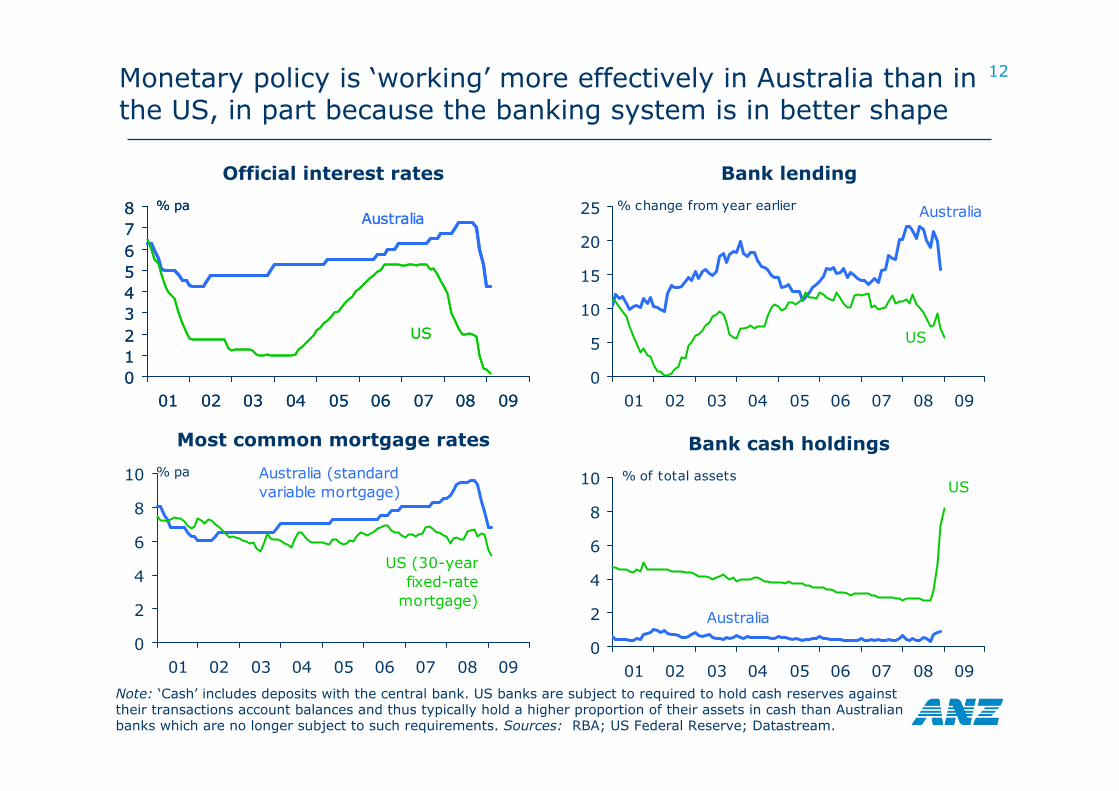
12Monetary policy is ‘working’ more effectively in Australia than in the US, in part because the banking system is in better shape
Official interest rates
Note: ‘Cash’ includes deposits with the central bank. US banks are subject to required to hold cash reserves against their transactions account balances and thus typically hold a higher proportion of their assets in cash than Australian banks which are no longer subject to such requirements. Sources: RBA; US Federal Reserve; Datastream.
012345678
01 02 03 04 05 06 07 08 09
% pa
US
Australia
012345678
01 02 03 04 05 06 07 08 09
% pa
US
Australia
Most common mortgage rates
0
2
4
6
8
10
01 02 03 04 05 06 07 08 09
% pa
US (30-yearfixed-rate
mortgage)
Australia (standardvariable mortgage)
Bank lending
0
5
10
15
20
25
01 02 03 04 05 06 07 08 09
% change from year earlier
US
Australia
Bank cash holdings
0
2
4
6
8
10
01 02 03 04 05 06 07 08 09
% of total assetsUS
Australia
13Is Australia just lagging the United States, or are there some more fundamental differences?
Australia’s economy is yet to feel the full effects of the downturn in the US, European and north Asian economies
– in particular, the impact of the 11% decline in (US$-denominated) export commodity prices has yet to be felt, let alone the further ~32% expected over the first three quarters of 2009 (as contract prices are renegotiated downwards)
– most businesses have been taking a ‘wait and see’ approach to their headcount
There are nonetheless some fundamental differences between Australia and other overseas economies -
– Australia has not had a banking crisis in the same sense as the US and Europe– Australia’s housing market has thus far proved to be more resilient than those of the
US & Europe – for good reasons (shortage of stock relative to underlying demand, relatively low number of ‘forced sellers’) – and should remain so provided unemployment does not rise sharply
Policy responses have been more effective than in other countries─ the RBA has cut rates more quickly than most other central banks (partly but not only
because it had more room to)─ more importantly, cuts in official interest rates have for the most part been reflected in
lower rates paid by end-borrowers (unlike the US and UK in particular)─ fiscal policy has responded more quickly and in a more targeted fashion
The sharp fall in the A$ (with more to come in 2009) has provided an additional ‘buffer’ against contractionary external forces ─ for example commodity prices have actually risen in A$ terms since last July
Australia’s population growth rate is 0.6pc pa above that of the US, 1pc pa above Europe’s and 1½pc pa above Japan’s
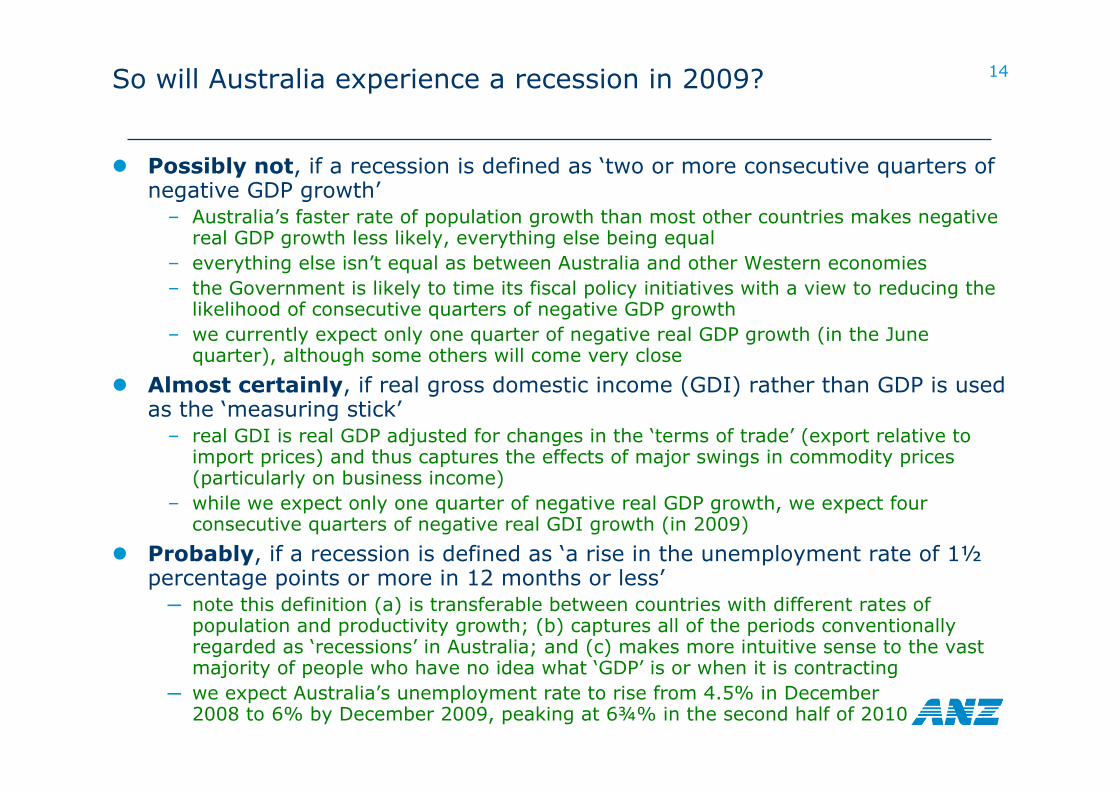
14So will Australia experience a recession in 2009?
Possibly not, if a recession is defined as ‘two or more consecutive quarters of negative GDP growth’
– Australia’s faster rate of population growth than most other countries makes negative real GDP growth less likely, everything else being equal
– everything else isn’t equal as between Australia and other Western economies– the Government is likely to time its fiscal policy initiatives with a view to reducing the
likelihood of consecutive quarters of negative GDP growth– we currently expect only one quarter of negative real GDP growth (in the June
quarter), although some others will come very close
Almost certainly, if real gross domestic income (GDI) rather than GDP is used as the ‘measuring stick’
– real GDI is real GDP adjusted for changes in the ‘terms of trade’ (export relative to import prices) and thus captures the effects of major swings in commodity prices (particularly on business income)
– while we expect only one quarter of negative real GDP growth, we expect four consecutive quarters of negative real GDI growth (in 2009)
Probably, if a recession is defined as ‘a rise in the unemployment rate of 1½percentage points or more in 12 months or less’─ note this definition (a) is transferable between countries with different rates of
population and productivity growth; (b) captures all of the periods conventionally regarded as ‘recessions’ in Australia; and (c) makes more intuitive sense to the vast majority of people who have no idea what ‘GDP’ is or when it is contracting
─ we expect Australia’s unemployment rate to rise from 4.5% in December 2008 to 6% by December 2009, peaking at 6¾% in the second half of 2010
15
3.54.04.55.05.56.06.57.0
07 08 09 10
% of labour force
-0.5
0.0
0.5
1.0
1.5
07 08 09 10
% change from previous quarter
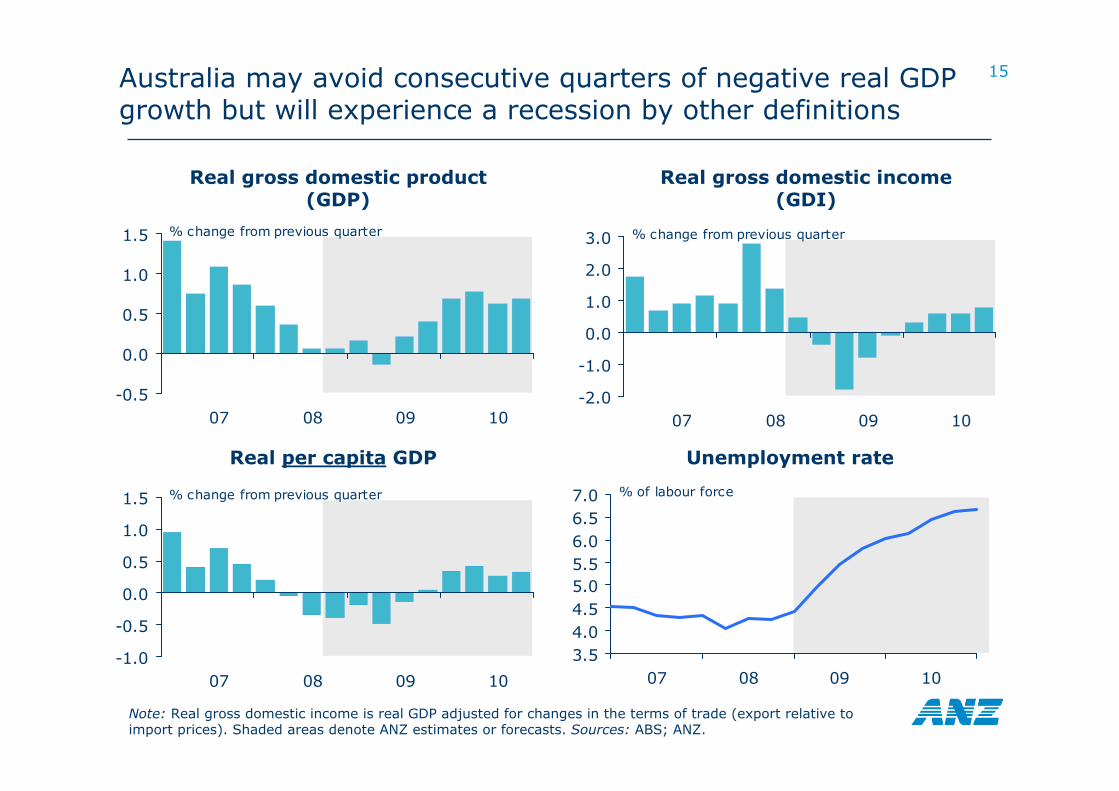
Australia may avoid consecutive quarters of negative real GDP growth but will experience a recession by other definitions
Real per capita GDP
Note: Real gross domestic income is real GDP adjusted for changes in the terms of trade (export relative to import prices). Shaded areas denote ANZ estimates or forecasts. Sources: ABS; ANZ.
Real gross domestic income (GDI)
Unemployment rate
Real gross domestic product (GDP)
-1.0
-0.5
0.0
0.5
1.0
1.5
07 08 09 10
% change from previous quarter
-2.0
-1.0
0.0
1.0
2.0
3.0
07 08 09 10
% change from previous quarter
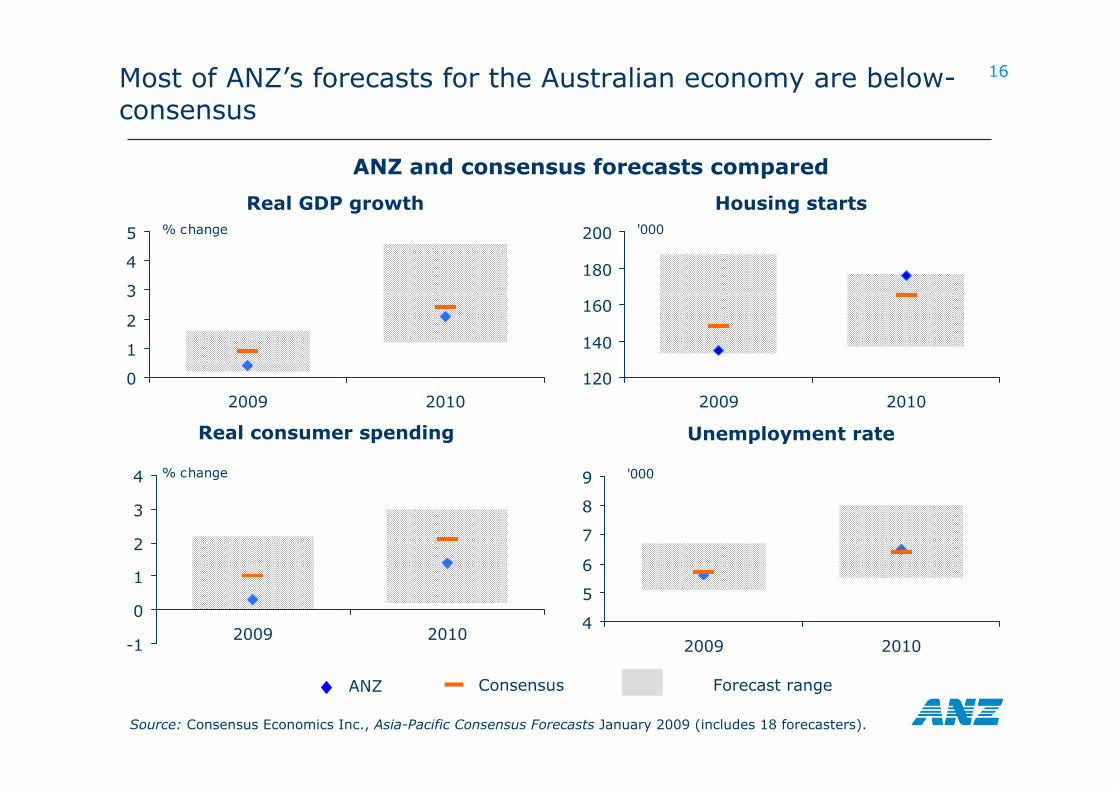
16Most of ANZ’s forecasts for the Australian economy are below-consensus
ANZ and consensus forecasts compared
Real GDP growth
Source: Consensus Economics Inc., Asia-Pacific Consensus Forecasts January 2009 (includes 18 forecasters).
0
1
2
3
4
5
2009 2010
% change
Real consumer spending
-1
0
1
2
3
4
2009 2010
% change
Housing starts
120
140
160
180
200
2009 2010
'000
Unemployment rate
4
5
6
7
8
9
2009 2010
'000
ANZ Consensus Forecast range
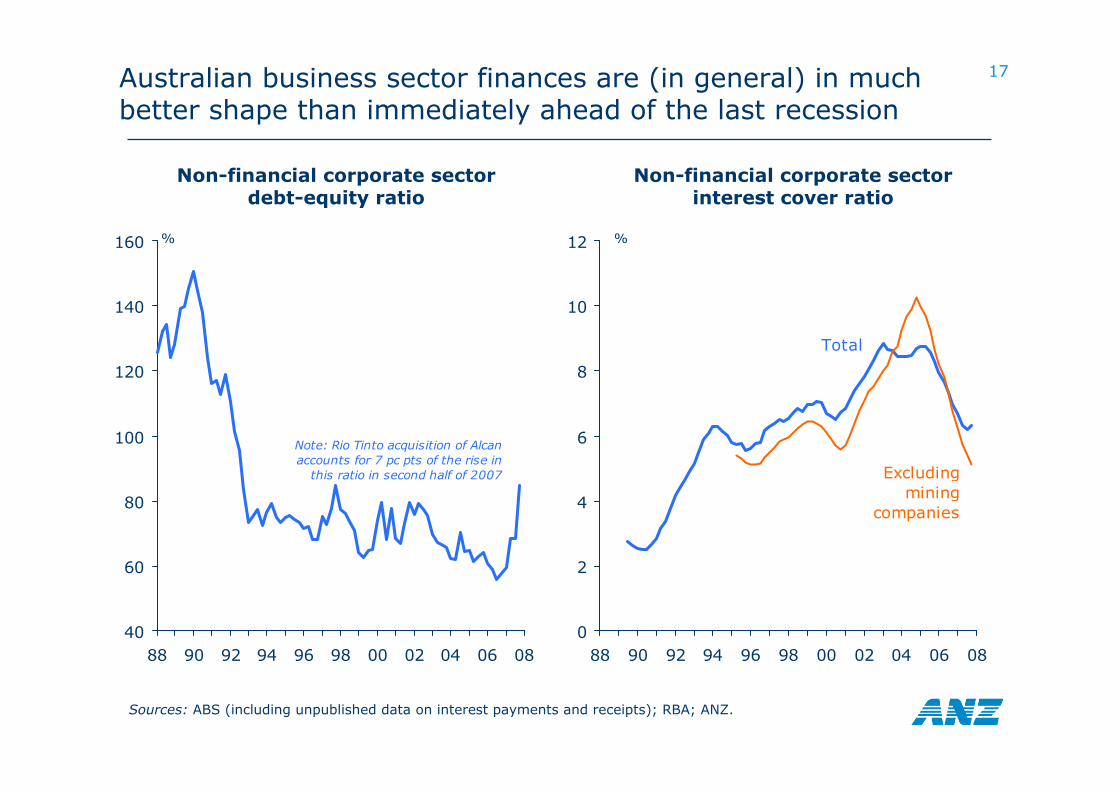
17Australian business sector finances are (in general) in much better shape than immediately ahead of the last recession
Non-financial corporate sectordebt-equity ratio
Sources: ABS (including unpublished data on interest payments and receipts); RBA; ANZ.
40
60
80
100
120
140
160
88 90 92 94 96 98 00 02 04 06 08
%
Note: Rio Tinto acquisition of Alcanaccounts for 7 pc pts of the rise in
this ratio in second half of 2007
0
2
4
6
8
10
12
88 90 92 94 96 98 00 02 04 06 08
%
Total
Excludingmining
companies
Non-financial corporate sectorinterest cover ratio
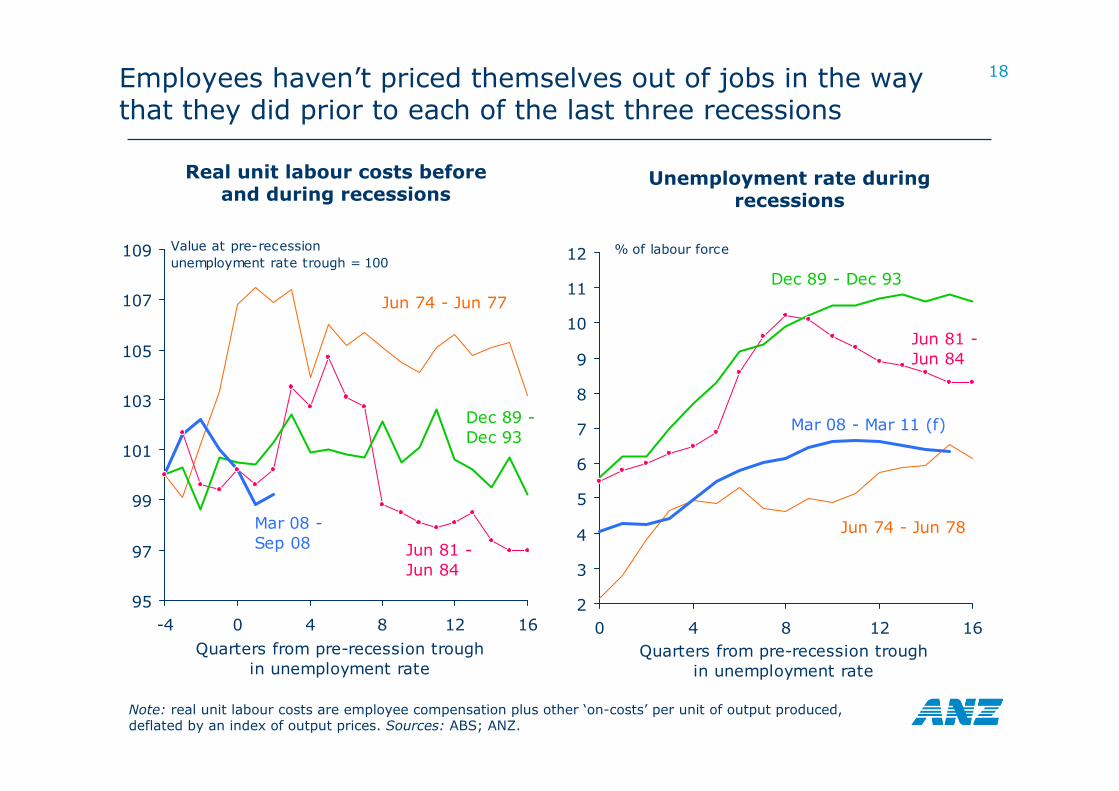
18Employees haven’t priced themselves out of jobs in the way that they did prior to each of the last three recessions
Unemployment rate during recessions
Note: real unit labour costs are employee compensation plus other ‘on-costs’ per unit of output produced, deflated by an index of output prices. Sources: ABS; ANZ.
Real unit labour costs before and during recessions
2
3
4
5
6
7
8
9
10
11
12
0 4 8 12 16
% of labour force
Quarters from pre-recession troughin unemployment rate
Jun 74 - Jun 78
Dec 89 - Dec 93
Jun 81 - Jun 84
Mar 08 - Mar 11 (f)
95
97
99
101
103
105
107
109
-4 0 4 8 12 16
Value at pre-recessionunemployment rate trough = 100
Quarters from pre-recession troughin unemployment rate
Jun 74 - Jun 77
Dec 89 - Dec 93
Jun 81 - Jun 84
Mar 08 - Sep 08
19Inflation will fall quite quickly – but although deflation is possible in some other countries it’s less likely in Australia
Unlike many other countries, Australia had both a ‘headline’ and an ‘underlying’inflation problem up until mid-2008
– as in other countries, higher energy and food prices had pushed ‘headline’ inflation well above the central bank’s ‘comfort zone’ during first half of 2008
– however unlike most other countries, Australia’s ‘underlying’ inflation rate was also significantly outside the RBA’s target range throughout 2008 (reflecting the persistence of demand growth in excess of potential output growth, in circumstances where almost all ‘spare capacity’ had been absorbed)
The Reserve Bank remains pessimistic about the outlook for inflation, despite giving priority since last September to ameliorating the financial crisis
– the RBA has actually raised its forecasts for ‘underlying’ inflation in 2009 and 2010 by ¼ pc pt since last May, and pushed back the time horizon over which it expects inflation to return to the 2-3% target band from H2 2010 to H1 2011
– this more pessimistic view stems largely from the sharp fall in the A$ since July
We think inflation will actually fall more quickly─ ‘headline’ and ‘underlying’ inflation has already begun to decline sharply overseas─ deflation is a distinct possibility in countries whose exchange rates have appreciated
since mid-2008 (including the US, Japan, China, and HK) – although it is much less likely in countries whose currencies have fallen significantly (eg Australia, NZ & UK)
─ Australia (and NZ) are about the only countries in the world without monthly readings on inflation – but unofficial monthly data suggests that ‘headline inflation’ has declined, and ‘underlying’ inflation’ has stopped rising, since the end of September
─ Business and household inflation expectations have fallen significantly since mid-2008
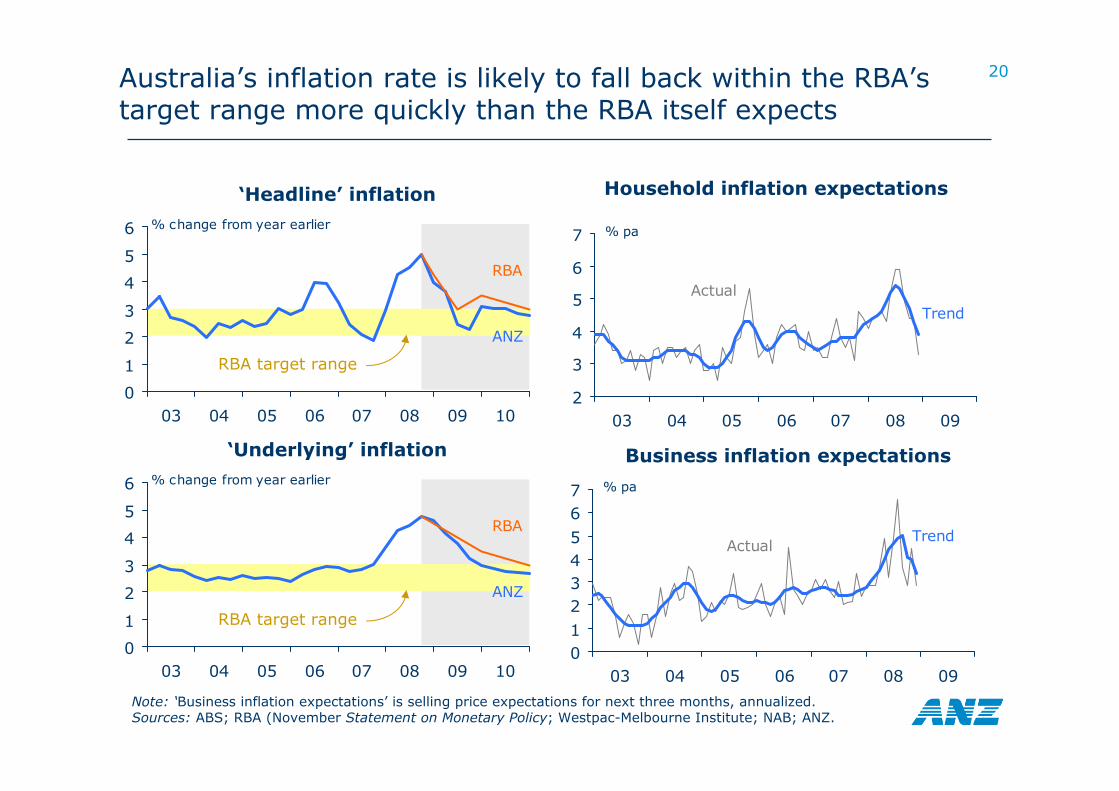
20Australia’s inflation rate is likely to fall back within the RBA’s target range more quickly than the RBA itself expects
Note: ‘Business inflation expectations’ is selling price expectations for next three months, annualized.Sources: ABS; RBA (November Statement on Monetary Policy; Westpac-Melbourne Institute; NAB; ANZ.
‘Headline’ inflation Household inflation expectations
2
3
4
5
6
7
03 04 05 06 07 08 09
% pa
Actual
Trend
‘Underlying’ inflation
0
1
2
3
4
5
6
03 04 05 06 07 08 09 10
% change from year earlier
RBA
ANZ
0
1
2
3
4
5
6
03 04 05 06 07 08 09 10
% change from year earlier
RBA
ANZ
RBA target range
RBA target range
Business inflation expectations
01234567
03 04 05 06 07 08 09
% pa
ActualTrend
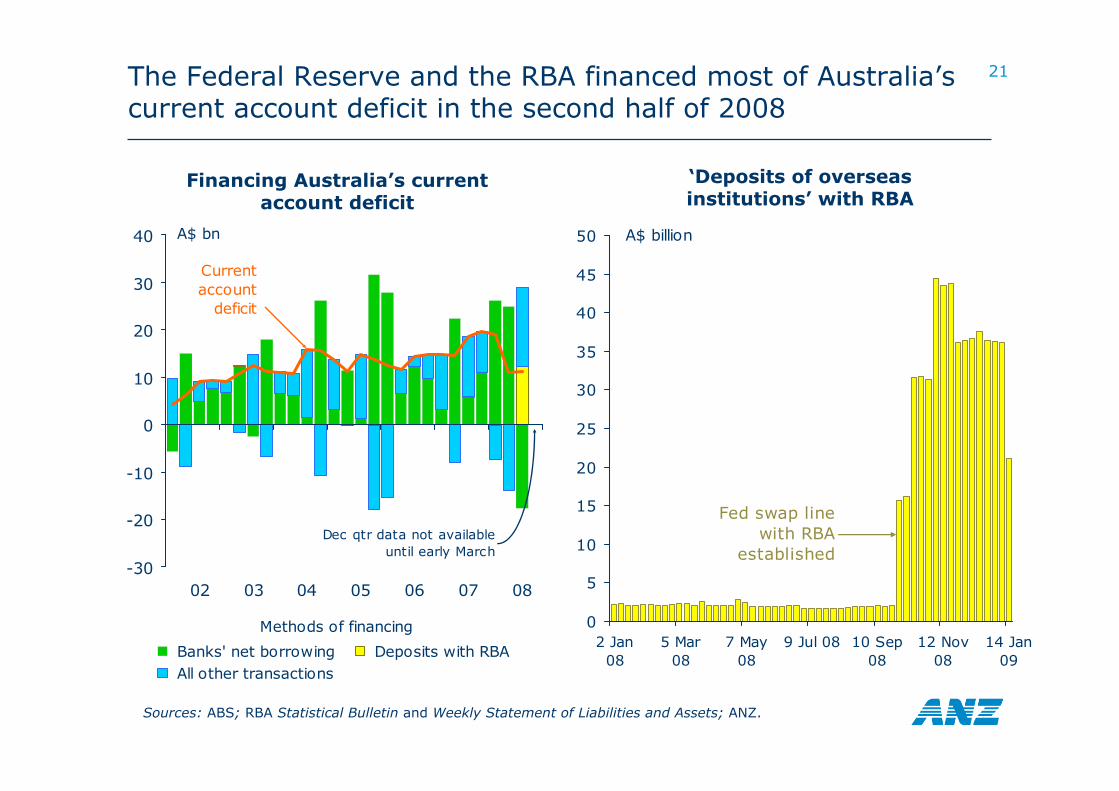
21The Federal Reserve and the RBA financed most of Australia’s current account deficit in the second half of 2008
Sources: ABS; RBA Statistical Bulletin and Weekly Statement of Liabilities and Assets; ANZ.
0
5
10
15
20
25
30
35
40
45
50
2 Jan08
5 Mar08
7 May08
9 Jul 08 10 Sep08
12 Nov08
14 Jan09
A$ billion
Fed swap linewith RBA
established
‘Deposits of overseas institutions’ with RBA
Financing Australia’s current account deficit
-30
-20
-10
0
10
20
30
40
02 03 04 05 06 07 08
Banks' net borrowing Deposits with RBA All other transactions
A$ bn
Current account
deficit
Methods of financing
Dec qtr data not available until early March

22
Summary
The global financial crisis is by no means over – there will be more write-offs, more capital raisings, more government bail-outs, and a lot more regulatory interventions – but there is a good chance that we have passed the ‘end of the beginning’A severe downturn in global economic activity is now under way, and is unlikely to hit bottom before the third quarter of 2009
– the current global downturn is unusually synchronized– conventional monetary policy will be ineffective in reversing it– global economic growth for 2009 as a whole may be as weak as 1982’s 1% (the
slowest since World War II), and possibly lower– some countries will experience deflation
Australia will experience a recession (on some definitions) in 2009─ there might not be consecutive quarters of negative real GDP growth, but real income
will decline, and the unemployment will rise by at least 1½ pc pts However Australia’s recession need not be as severe as those experienced in other countries, or as severe as previous Australian recessions─ Australia’s banking system and residential property markets have thus far been and
should continue to be more robust than those of the US and Europe─ business finances are (in general) in better shape, and labour costs have been better
contained, than ahead of previous Australian recessions – so there is less ‘need’ for mass retrenchments than occurred during previous downturns
─ economic policy responses have been more pro-active than during previous downturns, and appear to be having more impact in Australia than in other countries during the current downturn
23
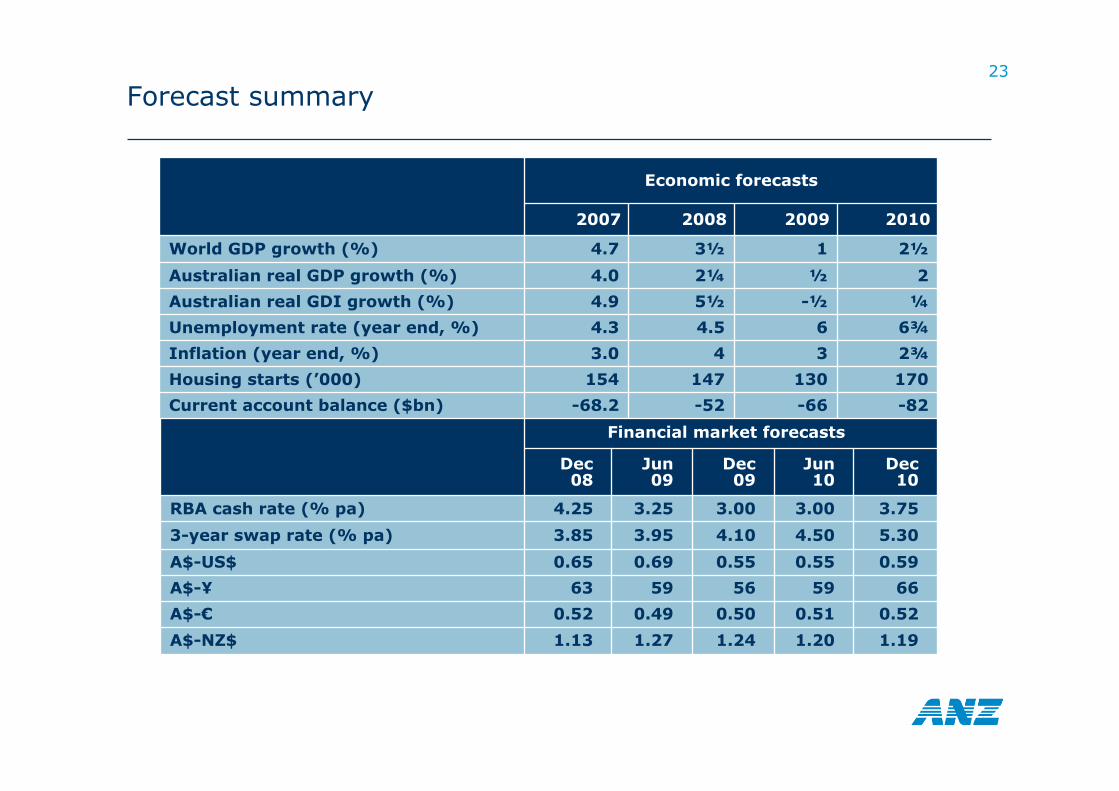
Forecast summary
1.191.201.241.271.13A$-NZ$
5.304.504.103.953.853-year swap rate (% pa)
6659565963A$-¥
0.590.550.550.690.65A$-US$
Financial market forecasts
0.50
3.00
Dec 09
0.51
3.00
Jun 10
0.49
3.25
Jun 09
0.52
4.25
Dec 08
0.52
3.75
Dec 10
A$-€
RBA cash rate (% pa)
¼-½5½4.9Australian real GDI growth (%)
Economic forecasts
6¾64.54.3Unemployment rate (year end, %)
2½2¼4.0Australian real GDP growth (%)
170130147154Housing starts (’000)
2¾343.0Inflation (year end, %)
-52
3½
2008
-66
1
2009
-68.2
4.7
2007
-82
2½
2010
Current account balance ($bn)
World GDP growth (%)