The Attachment of Colloidal Particles to Environmentally ...
155
The Attachment of Colloidal Particles to Environmentally Relevant Surfaces: Effect of Ionic Strength, Particle Shape, and Physicochemical Properties By Coy P. McNew Dissertation Submitted to the Faculty of the Graduate School of Vanderbilt University in partial fulfillment of the requirements for the degree of DOCTOR OF PHILOSOPHY in Environmental Engineering December, 2015 Nashville, Tennessee Approved: Professor Eugene J. LeBoeuf, Chair Professor George Hornberger Professor M. Douglas LeVan Associate Professor Alan Bowers Associate Professor Yusong Li
Transcript of The Attachment of Colloidal Particles to Environmentally ...

The Attachment of Colloidal Particles to Environmentally Relevant Surfaces: Effect of
Ionic Strength, Particle Shape, and Physicochemical Properties
By
Coy P. McNew
Dissertation
Submitted to the Faculty of the
Graduate School of Vanderbilt University
in partial fulfillment of the requirements
for the degree of
DOCTOR OF PHILOSOPHY
in
Environmental Engineering
December, 2015
Nashville, Tennessee
Approved:
Professor Eugene J. LeBoeuf, Chair
Professor George Hornberger
Professor M. Douglas LeVan
Associate Professor Alan Bowers
Associate Professor Yusong Li

To my mom and dad, unconditionally supportive
ii

ACKNOWLEDGMENTS
This work was financially supported by the National Science Foundation Award Nos.
1133528 and 1133280, the Vanderbilt University Discovery Grant Program, and the Van-
derbilt University Department of Civil and Environmental Engineering.
This work would not have been possible without the support of my advisor, Gene
LeBoeuf. From the day I received your call informing me of my acceptance into the doc-
toral program in Civil and Environmental Engineering, I knew I was in for something
special and I definitely have not been disappointed. The freedom you’ve afforded me in
my research pursuits and consistent confidence you’ve shown in my decisions have surely
made me a better researcher, teacher, academic, and all around person.
To all of my family, who have unwaveringly supported me since day one. To my mom
and dad, who have beamed with pride at each and every accomplishment I’ve ever achieved,
regardless of how small or large. You have no idea how much you mean to me and how
much you’ve shaped me into the person I am today. From the bottom of my heart, thank you
for all that you’ve done for me and continue to do on a daily basis. To my late grandmother
who always reminded me to look out for number one. If there’s a better piece of daily
advice out there, I’ve yet to hear it.
To Kate, who has shared in the daily (and sometimes hourly) ups and downs of being a
graduate student. No one has ever taught me more about what it means to be emotionally
mature and exactly how to make it through tough times. You have a big heart and some big
brains too.
iii

TABLE OF CONTENTS
Page
DEDICATION . . . . . . . . . . . . . . . . . . . . . . . . . . . . . . . . . . . . . ii
ACKNOWLEDGMENTS . . . . . . . . . . . . . . . . . . . . . . . . . . . . . . . . iii
LIST OF TABLES . . . . . . . . . . . . . . . . . . . . . . . . . . . . . . . . . . . vii
LIST OF FIGURES . . . . . . . . . . . . . . . . . . . . . . . . . . . . . . . . . . . viii
1 Introduction . . . . . . . . . . . . . . . . . . . . . . . . . . . . . . . . . . . . . 11.1 Background and Motivation . . . . . . . . . . . . . . . . . . . . . . . . . . 11.2 Literature Review . . . . . . . . . . . . . . . . . . . . . . . . . . . . . . . 2
1.2.1 Macromolecular properties of SOM . . . . . . . . . . . . . . . . . 21.2.2 Aggregation of ENMs in the aqueous environment . . . . . . . . . 61.2.3 Deposition of ENMs in the subsurface environment . . . . . . . . . 111.2.4 Data-Driven Modeling . . . . . . . . . . . . . . . . . . . . . . . . 14
1.3 Quartz Crystal Microbalance with Dissipation Monitoring . . . . . . . . . . 171.4 Research Obejctives . . . . . . . . . . . . . . . . . . . . . . . . . . . . . . 21
2 The role of soil and sediment organic matter physicochemical properties on nC60attachment . . . . . . . . . . . . . . . . . . . . . . . . . . . . . . . . . . . . . . 232.1 Introduction . . . . . . . . . . . . . . . . . . . . . . . . . . . . . . . . . . 232.2 Materials and Methods . . . . . . . . . . . . . . . . . . . . . . . . . . . . 26
2.2.1 Materials and solution chemistry . . . . . . . . . . . . . . . . . . . 262.2.2 nC60 stock suspension and SOM stock solutions . . . . . . . . . . . 262.2.3 nC60 attachment experiments . . . . . . . . . . . . . . . . . . . . . 282.2.4 DLVO interaction energy calculations . . . . . . . . . . . . . . . . 31
2.3 Results and Discussion . . . . . . . . . . . . . . . . . . . . . . . . . . . . 332.3.1 Materials characterization . . . . . . . . . . . . . . . . . . . . . . 332.3.2 nC60 attachment analysis . . . . . . . . . . . . . . . . . . . . . . . 382.3.3 Thermal effects on attachment . . . . . . . . . . . . . . . . . . . . 39
2.4 Conclusions . . . . . . . . . . . . . . . . . . . . . . . . . . . . . . . . . . 45
3 nC60 deposition onto humic acid coated silica and the effect of ionic strength . . . 463.1 Introduction . . . . . . . . . . . . . . . . . . . . . . . . . . . . . . . . . . 463.2 Materials and Methods . . . . . . . . . . . . . . . . . . . . . . . . . . . . 49
3.2.1 Materials . . . . . . . . . . . . . . . . . . . . . . . . . . . . . . . 493.2.2 Preparation of stock suspensions and solutions . . . . . . . . . . . . 493.2.3 nC60 aggregation kinetics . . . . . . . . . . . . . . . . . . . . . . . 503.2.4 Electrophoretic mobility measurements . . . . . . . . . . . . . . . 513.2.5 QCM-D experiments . . . . . . . . . . . . . . . . . . . . . . . . . 52
iv

3.2.6 nC60 deposition kinetics . . . . . . . . . . . . . . . . . . . . . . . 543.2.7 DLVO Interaction Energy Calculations . . . . . . . . . . . . . . . . 56
3.3 Results and Discussion . . . . . . . . . . . . . . . . . . . . . . . . . . . . 583.3.1 nC60 aggregation kinetics . . . . . . . . . . . . . . . . . . . . . . . 583.3.2 nC60 deposition kinetics . . . . . . . . . . . . . . . . . . . . . . . 583.3.3 Effect of humic acid layer . . . . . . . . . . . . . . . . . . . . . . 62
3.4 Conclusions . . . . . . . . . . . . . . . . . . . . . . . . . . . . . . . . . . 67
4 The attachment of colloidal particles to environmentally relevant surfaces and theeffect of particle shape . . . . . . . . . . . . . . . . . . . . . . . . . . . . . . . 684.1 Introduction . . . . . . . . . . . . . . . . . . . . . . . . . . . . . . . . . . 684.2 Materials and Methods . . . . . . . . . . . . . . . . . . . . . . . . . . . . 71
4.2.1 Materials . . . . . . . . . . . . . . . . . . . . . . . . . . . . . . . 714.2.2 Preparation of stretched PS particles . . . . . . . . . . . . . . . . . 714.2.3 Preparation of HHA solution . . . . . . . . . . . . . . . . . . . . . 734.2.4 Characterization measurements . . . . . . . . . . . . . . . . . . . . 734.2.5 Attachment experiments . . . . . . . . . . . . . . . . . . . . . . . 744.2.6 AFM images . . . . . . . . . . . . . . . . . . . . . . . . . . . . . 774.2.7 DLVO interaction energy calculations . . . . . . . . . . . . . . . . 77
4.3 Results and Discussion . . . . . . . . . . . . . . . . . . . . . . . . . . . . 794.3.1 Particle and surface characterization . . . . . . . . . . . . . . . . . 794.3.2 Attachment experiments . . . . . . . . . . . . . . . . . . . . . . . 814.3.3 Mechanistic insights . . . . . . . . . . . . . . . . . . . . . . . . . 85
4.4 Conclusions . . . . . . . . . . . . . . . . . . . . . . . . . . . . . . . . . . 89
5 Predicting particle attachment efficiency from physicochemical characteristics: amachine learning approach . . . . . . . . . . . . . . . . . . . . . . . . . . . . . 905.1 Introduction . . . . . . . . . . . . . . . . . . . . . . . . . . . . . . . . . . 905.2 Methods . . . . . . . . . . . . . . . . . . . . . . . . . . . . . . . . . . . . 94
5.2.1 Database . . . . . . . . . . . . . . . . . . . . . . . . . . . . . . . 945.2.2 Machine learning . . . . . . . . . . . . . . . . . . . . . . . . . . . 985.2.3 Model structure . . . . . . . . . . . . . . . . . . . . . . . . . . . . 98
5.3 Results and Discussion . . . . . . . . . . . . . . . . . . . . . . . . . . . . 1015.3.1 Recursive feature elimination with cross validation . . . . . . . . . 1015.3.2 Attachment efficiency prediction performance . . . . . . . . . . . . 1015.3.3 Implications of database findings . . . . . . . . . . . . . . . . . . . 1055.3.4 Implications of model findings . . . . . . . . . . . . . . . . . . . . 108
5.4 Conclusions . . . . . . . . . . . . . . . . . . . . . . . . . . . . . . . . . . 112
6 Conclusions and Future Work . . . . . . . . . . . . . . . . . . . . . . . . . . . . 1146.1 Conclusions . . . . . . . . . . . . . . . . . . . . . . . . . . . . . . . . . . 1146.2 Future Work . . . . . . . . . . . . . . . . . . . . . . . . . . . . . . . . . . 119
v

BIBLIOGRAPHY . . . . . . . . . . . . . . . . . . . . . . . . . . . . . . . . . . . 121
Appendix . . . . . . . . . . . . . . . . . . . . . . . . . . . . . . . . . . . . . . . . 139
A Details on Materials Characterization . . . . . . . . . . . . . . . . . . . . . . . . 139A.1 Harpeth humic and fulvic acid characterization details . . . . . . . . . . . . 139A.2 nC60 characterization details . . . . . . . . . . . . . . . . . . . . . . . . . 140A.3 PS particle stretching details . . . . . . . . . . . . . . . . . . . . . . . . . 142
B Reynolds and Peclet Number Calculations . . . . . . . . . . . . . . . . . . . . . 145
C Details on Grid Search Hyper Parameter Optimization with Cross Validation . . . 146
vi

LIST OF TABLES
Table Page
3.1 nC60 zeta potential values for use in DLVO calculations . . . . . . . . . . . 57
4.1 Spherical and stretched PS details . . . . . . . . . . . . . . . . . . . . . . 79
5.1 Domain of training and target features . . . . . . . . . . . . . . . . . . . . 95
5.2 Model performance summary . . . . . . . . . . . . . . . . . . . . . . . . . 104
A.1 HHA and HFA elemental and water content analysis . . . . . . . . . . . . . 139
A.2 HHA and HFA functional group analysis . . . . . . . . . . . . . . . . . . . 139
A.3 nC60 particle radius and dielectric permittivity of water as a function oftemperature . . . . . . . . . . . . . . . . . . . . . . . . . . . . . . . . . . 141
C.1 Grid search parameter optimization with cross validation details . . . . . . 146
vii

LIST OF FIGURES
Figure Page
1.1 Example DLVO interaction energy curve . . . . . . . . . . . . . . . . . . . 10
1.2 Summary of QCM-D principles . . . . . . . . . . . . . . . . . . . . . . . . 17
2.1 Representative nC60 deposition experiment . . . . . . . . . . . . . . . . . . 30
2.2 Representative nC60 TEM images . . . . . . . . . . . . . . . . . . . . . . 34
2.3 nC60 particle diameter as a function of temperature . . . . . . . . . . . . . 34
2.4 nC60 zeta potential as a function of temperature . . . . . . . . . . . . . . . 35
2.5 Voigt calculated mass of HHA and HFA layers . . . . . . . . . . . . . . . . 35
2.6 HHA heating/cooling loop . . . . . . . . . . . . . . . . . . . . . . . . . . 36
2.7 HFA heating/cooling loop . . . . . . . . . . . . . . . . . . . . . . . . . . . 37
2.8 DLVO interaction energy profiles . . . . . . . . . . . . . . . . . . . . . . . 38
2.9 nC60 attachment efficiency onto HHA, HFA, or bare silica as a function oftemperature . . . . . . . . . . . . . . . . . . . . . . . . . . . . . . . . . . 40
2.10 HHA layer thermal characterization . . . . . . . . . . . . . . . . . . . . . 41
2.11 HFA layer thermal characterization . . . . . . . . . . . . . . . . . . . . . . 42
3.1 Representative nC60 deposition experiment . . . . . . . . . . . . . . . . . . 53
3.2 nC60 particle size and EPM as a function of ionic strength . . . . . . . . . . 55
3.3 nC60 aggregation attachment efficiency . . . . . . . . . . . . . . . . . . . . 59
3.4 nC60 deposition rates as a function of ionic strength . . . . . . . . . . . . . 61
3.5 nC60 deposition attachment efficiency as a function of ionic strength . . . . 63
3.6 EPM measurements of relevant surfaces . . . . . . . . . . . . . . . . . . . 64
viii

3.7 DLVO interaction energy curves . . . . . . . . . . . . . . . . . . . . . . . 65
4.1 Particle stretching apparatus diagram . . . . . . . . . . . . . . . . . . . . . 72
4.2 Representative attachment experiment . . . . . . . . . . . . . . . . . . . . 76
4.3 SEM images of spherical and stretched PS . . . . . . . . . . . . . . . . . . 79
4.4 EPM of PS as a function of ionic strength . . . . . . . . . . . . . . . . . . 80
4.5 EPM of relevant surfaces as a function of ionic strength . . . . . . . . . . . 82
4.6 Attachment efficiency of PS . . . . . . . . . . . . . . . . . . . . . . . . . . 84
4.7 DLVO interaction energy calculations . . . . . . . . . . . . . . . . . . . . 85
4.8 Representative AFM images . . . . . . . . . . . . . . . . . . . . . . . . . 86
4.9 Voigt modeling of NOM layers . . . . . . . . . . . . . . . . . . . . . . . . 87
5.1 Attachment efficiency database . . . . . . . . . . . . . . . . . . . . . . . . 97
5.2 Structure of employed machine learning model . . . . . . . . . . . . . . . 100
5.3 Model performance during cross validation . . . . . . . . . . . . . . . . . 102
5.4 Model performance of holdout set prediction . . . . . . . . . . . . . . . . . 103
5.5 Ionic strength range of α database . . . . . . . . . . . . . . . . . . . . . . 106
5.6 Dissolved NOM concentration range of α database . . . . . . . . . . . . . 107
5.7 Relative feature importance . . . . . . . . . . . . . . . . . . . . . . . . . . 108
A.1 nC60 particle size distribution . . . . . . . . . . . . . . . . . . . . . . . . . 140
A.2 nC60 zeta potential as a function of pH . . . . . . . . . . . . . . . . . . . . 141
A.3 Major axis dimension of stretched PS . . . . . . . . . . . . . . . . . . . . . 142
A.4 Minor axis dimension of stretched PS . . . . . . . . . . . . . . . . . . . . 143
A.5 Major to minor axis ratio of stretched PS . . . . . . . . . . . . . . . . . . . 144
ix

Chapter 1
Introduction
1.1 Background and Motivation
The worldwide market for nanotechnology products is expected to reach a total of $64.2
billion over the next five years [1]. With such a high level of production and dissemina-
tion, the eventual release of engineered nanomaterials (ENMs) into the environment is
inevitable, either from industrial sources or through disposal in municipal waste. In partic-
ular, carbonaceous nanomaterials (CNMs), such as fullerene (C60) and multiwalled carbon
nanotubes (MWNTs), have widespread applications in many areas (e.g. biomedical tech-
nology, electronics, and optics) [2–5] and are also produced in large quantities (e.g., 300
tons/year) [6]. Several studies have investigated and revealed the potential human health
effects, aquatic toxicity, and antimicrobial properties of ENMs [3, 7–10]. Due to the ongo-
ing environmental release coupled with a strong potential for toxicity, concern for the fate
and transport of these materials in the environment is growing.
The fate and transport of ENMs are influenced by their unusual physicochemical prop-
erties, attributable to many factors including their small size (surface area and size distribu-
tion), composition (purity, crystallinity, electronic properties), surface structure (functional
groups, inorganic or organic coatings), solubility, shape, and aggregation. Once in the en-
vironment, ENMs will participate in complex interactions with natural soils and sediments,
and thus, organic matter attached on the soil and sediment surfaces. This soil and sediment
organic matter (SOM) may be dissolved in the aqueous phase or immobilized (attached)
on the surface soil or sediment grains. Attached SOM layers are the product of on-site
physical and biological decomposition and are an essential component of natural soil and
sediments. Attached SOM has been found to strongly sorb hydrophobic organic chemicals
(HOCs) and thus influence their fate and transport [11]. If similar interactions between
1

SOM and ENMs exist, these interactions will influence potential pathways of exposure and
eventual impact on ecosystems and human health. This work will focus on the interac-
tion between ENMs and attached SOM layers, with the central hypothesis being that this
interaction is governed by (A) the physicochemical characteristics (e.g. macromolecular
properties) of SOM, (B) the ionic strength of solution, and (C) the fundamental nanostruc-
ture (e.g. shape) of ENMs. By using a suite of analytical instruments, the physicochemical
properties of SOM, the shape of ENMs, and the ionic strength of solution are systemati-
cally varied while monitoring the effects on ENM aggregation, deposition, and attachment,
as well as alterations in SOM structure. Not only will knowledge of SOM and ENM inter-
actions improve the understanding of the fate and transport of ENMs in the natural environ-
ment, but it will also aid in the engineered environment, through improved understanding
of factors influencing ENM aggregation and deposition behavior for applications in water
and wastewater treatment.
1.2 Literature Review
1.2.1 Macromolecular properties of SOM
There are several categories of SOM with varying physical and chemical characteristics
and composition based on age and degree of biological decomposition. SOM ranges from
newly deposited biopolymers (e.g. polysaccharides and lignin), to moderately aged humic
substances, to well-aged kerogen and black carbon. Some biopolymers show low affinities
for HOCs, such as polysaccharides and lignin, but others, such as lipids, appear to be strong
sorbents for HOCs [12]. Lipids, however, usually occur at very low concentrations in
natural soils. Even though biopolymers are not normally considered a significant source of
HOC sorption in soils [11], a study by Wang and Xing [13] observed an enhanced sorption
of HOCs by biopolymer-derived chars.
Humic substances, including humins, humic acids, and fulvic acids, typically repre-
2

sent the dominant organic components in soils and sediments [14]. Chemically, humic
substances are a mixture of both substituted aromatic and aliphatic compounds, form-
ing a complex physical structure held together by inter- and intra-molecular interactions
[15]. Humic acids represent complex mixtures of macromolecules with varying degrees
of crosslinkages; however, research suggests that bulk properties of humic substances may
be similar to those of organic macromolecules. For example, several humic substances
have been shown to undergo thermal transitions similar to those observed for other organic
macromolecules. These humic substances have been shown to transition from a more rigid,
glass-like state to a more soft, rubbery-like state at temperatures ranging from 35 °C to 65
°C [16–22]. Some more well-aged, rigid SOMs, such as coals and kerogens, have also
been observed to undergo similar transitions [23, 24], albeit usually at much higher tem-
peratures. At this transition, additional thermal energy available results in an increase in
the number and magnitude of molecular motions, effectively breaking molecular inter- and
intra-chain crosslinkages, and allowing molecular chains to slide past one another. These
increased molecular motions create greater free volume and a discontinuity in the second
partial derivatives of free volume [22, 25]. The spreading of this transition over a range
of temperatures is likely due to the heterogeneous nature of humic substances, both in
terms of molecular weight and structure [22]. All of these studies, however, investigate a
bulk and (in most cases) dry state of SOM. Attached SOM layers are typically hydrated,
immobilized, thin layers of SOM which bring added variables into consideration, most no-
tably water content and the presence of cations. Because of these added variables, it is not
yet clear to what extent conclusions drawn in the aforementioned studies will translate to
attached layers of SOM.
Soft humic substances often posses linear sorption behavior for HOCs, suggesting a
partitioning-type process [26]. Rigid SOM, such as kerogen and black carbon, are char-
acterized by more condensed, cross-linked, aromatic structures and are generally believed
to be primarily responsible for adsorption-dominated processes [27]. Soft SOMs are usu-
3

ally associated with shorter sorption equilibrium attainment, on the order of several weeks
to several months, while more rigid SOMs are usually associated with longer equilibrium
times on the order of years [26]. The rate of diffusion of HOCs into the SOM is largely
governed by the relaxation of the SOM matrix to accommodate the sorbing HOCs [28].
Since humic substances typically possess fewer and looser cross-linkages, they likely relax
much quicker than the more condensed, cross-linked and tightly bound kerogen-dominated
materials. This may partly explain the faster sorption equilibration times in humic sub-
stances.
An important factor when considering the macromolecular properties of SOM is, of
course, the presence of water. The hydration of SOM has been shown to alter the SOM
matrix in several key ways, namely through altered physicochemical properties. Water has
been shown to interact strongly with hydrophilic SOM, with solubility parameters closest
to that of water, including fulvic and humic acids [22, 25]. A stronger interaction results
in greater water uptake and more swelling of the macromolecular matrix. In the case of
humic acids, the swelling of the macromolecular matrix has been shown to result in in-
creased macromolecular mobility and a reduced thermal transition temperature [22, 25],
known as a plasticizing effect. In some studies, however, water has been shown to have an
antiplasticizing effect [29–31]. In one study [29], the reduction of water content in a peat
sample resulted in the reduction of the glass transition temperature, which suggested the
water had an antiplasticizing effect. The authors attributed this antiplasticizing effect to a
reduction in side chain mobility due to hydrogen bonds formed between water molecules
and side chains. In another study [32], the hydration of a peat soil was investigated us-
ing differential scanning calorimetry. During the hydration and swelling of the peat soil
matrix over an extended period of time, the increased water content showed a short term
plasticizing effect (on the order of days) and a slow, long term antiplasticizing effect (on
the order of weeks or months). This unexpected antiplasticizing effect was attributed to the
slow formation of water bridges. Water molecule bridges (WaMB) form when small groups
4

of water molecules connect two functional groups by way of a hydrogen-bond bridge and
reduce the mobility of these molecular segments [33].
These physicochemical changes in SOM due to hydration have also been shown to sig-
nificantly affect the sorption of HOCs [34–37]. One study by Graber and Borisover [37]
investigated the sorption equilibrium of phenol, pyridine, and atrazine on Pahokee peat. In
the case of two of the three HOCs, sorption was greatly increased as the hydration of Pa-
hokee peat was increased. Another such study [36] monitored the sorption of pyridine by
Pahokee peat by investigating both the sorption equilibrium and kinetics in the presence of
several solvents. The results indicate that the uptake of pyridine was clearly enhanced by
all polar solvents, including hydration by water. The mechanism for increased sorption of
HOCs due to increased hydration is likely explained by water-assisted disruption of polar
SOM contacts, as described by Graber and Borisover [37]. As hydration increases, water
molecules penetrate the SOM matrix and reach polar areas that were previously unavail-
able to HOC interaction, due to inter- or intra-molecular interactions. By hydrating these
areas, the water molecules disrupt the interactions between these contacts and provide a
new sorption site, which was previously unavailable. The extent to which this sorption en-
hancing characteristic of SOM hydration may apply to the attachment behavior of ENMs,
however, has not yet been investigated.
Another important factor when considering the macromolecular properties of SOM is
the presence of cation-mediated cross-linking and bridging. Cation-SOM interactions have
been shown to depend on SOM characteristics (e.g. molecular size, composition, configu-
ration), pH, ionic strength of the solution, cation properties, and the ratio of cation to SOM
[38]. Thermal energy has not yet been shown to have an effect on cation-SOM interactions,
though our recent work suggests it may also play a role [39]. In order for a cation cross-link
or bridge to occur, the cation must be able to form a bi- or polydentate complex with two or
more SOM functional groups [40]. This, however, does not mean the cations must be mul-
tivalent. In fact, the results of one study suggest that Na+ could act as an effective cation
5

for cross-linking [41]. Despite this finding, the tendency for cations to form cross-links is
still expected to increase with increased valence [42]. If the SOM functional groups to be
cross-linked are on different molecules, then the resulting cross-link is intermolecular, and
if the SOM functional groups belong to the same molecule, the cross-link is intramolecu-
lar. Intermolecular cross-links have been shown to have effects on SOM supramolecular
structure as well as the rigidity of the SOM macromolecular matrix [43]. In several studies,
increases in sorption behavior and differences in sorption/desorption behavior of HOCs to
NOM have been explained by the effects of cation cross-linking [43, 44], though this cation
cross-linking effect on sorption has not yet been directly shown.
In order for a cation to form a cross-link or cation bridge (CaB) with two or more func-
tional groups, the functional groups must be close enough together to all interact with the
same cation. On the other hand, much larger distances between functional groups can be
bridged by water molecules. As briefly mentioned earlier, WaMBs can span longer dis-
tances than direct CaB, with networks of up to 6–10 water molecules [33]. These WaMBs
will increase cross-linking and can lead to a more rigid SOM matrix [45]. Cross-linking
by combined WaMB and CaB can span even longer distances [43] and could cross-link
functional groups that are too far apart for direct CaB or even WaMB. Since several studies
have shown that water molecules do, in fact, contribute to cation cross-linking [33, 41] and
in turn affect SOM macromolecular matrix rigidity [46], it is clear that water content is an
important factor when considering cross-linking influences on macromolecular properties
of SOM. The extent to which WaMB and combined WaMB and CaB affect the attachment
behavior of ENMs to SOM has not yet been investigated.
1.2.2 Aggregation of ENMs in the aqueous environment
Once ENMs are released, their aggregation behavior and stability in the aqueous envi-
ronment are key factors in determining their fate and transport. Large unstable aggregates
will settle out quickly, reducing their transport and bioavailability, but smaller, more stable
6

aggregates may travel much further and pose a higher risk to organisms, ecosystems, or
ultimately, human health. For this reason, it is critical to understand how ENM aggregates
interact with all components of natural water systems. Natural water is a complex system
of components, however, and because of that, very few studies have investigated the stabil-
ity of ENMs in true natural water. Instead, this area of study has been broken down into
three key variables that affect the stability of aqueous ENM suspensions, which include
the presence of dissolved organic matter (DOM), the effect of pH, and the effect of ionic
strength
DOM, being ubiquitous in the natural environment, will have ample opportunity to
interact with ENMs once they are released. DOM is believed to interact with ENMs by
adsorbing to the surface and coating the particles, altering their surface physicochemical
properties and increasing their stability through steric repulsion [47, 48]. Several studies
have illustrated that NOM fractions can interact with aqueous ENMs and increase their
stability. A tannic acid was shown to stabilize multiwalled carbon nanotubes (MWNTs) in
water [49], a humic acid was shown to increase the stability of an aqueous nC60 suspension
[50], and a DOM extracted from Sahan River in Ukraine was shown to do the same [51]. In
addition to these fractionated NOM studies, a Suwannee River water sample with unaltered
NOM background was shown to stabilize a suspension of MWNTs, which remained stable
for over a month [52]. This result was attributed to the high amount of DOM in the Suwan-
nee River water, which amounted to 59.1 mg/L total carbon content. As discussed earlier,
SOM is a heterogeneous mixture of macromolecules with varying physical and chemical
characteristics depending on the history, age, and degree of biodecomposition. Depending
on these factors, different types of SOM could affect aqueous ENMs in different ways,
which remains to be explored.
In the aquatic environment, pH is a master variable that affects the properties of most
components. In terms of aqueous ENMs, pH is the major determining factor of zeta poten-
tial. Zero point charge (zpc) is the pH value at which a particle carries a zeta potential of
7

zero and the uncharged particle is at a minimum stability. At a pH near the zpc, the particles
will aggregate and flocculate to form large particles and settle out rapidly. At a pH below
the zpc, the particles are positively charged and at a pH above the zpc, the particles are neg-
atively charged. The further the pH deviates from the zpc, the more charged the particles
become. Zpc values reported for ENMs of interest to this work include a pH of 4.7–6.4
for MWNTs [53] and a pH of 0–1 for nC60 [54]. The actual zpc for any given system may
deviate from the reported values however, as one study hypothesizes that the zpc of ENMs
might vary with particle size [55]. No discernible correlation between particle size and zpc
can be seen in summaries of the reported zpc literature [56] however, and so these reported
differences may be due to other factors (e.g., suspension preparation method or method for
synthesis of particles), so further study would be needed to confirm this hypothesis.
The pH may also affect the stability of aqueous ENMs in another, more complex man-
ner by affecting the DOM coating on the surface of the particles. As discussed previously,
DOM can coat the aqueous ENM particles and enhance their stability through steric repul-
sion. Contrary to this finding, two studies involving the interaction of iron oxide nanoparti-
cles with Suwannee River humic acid [57] and MWNTs with tannic acid [53], have shown
that, at suitable pH values, the presence of DOM can actually decrease the stability of the
nanoparticles. In the latter study, tannic acid is introduced into an aqueous suspension of
MWNTs, effectively enhancing the stability of the suspension. Once the pH is lowered
below 5, however, the particles destabilize and settle out. The authors attributed this effect
to the lowering of the pH below the pKa of the tannic acid, which caused it to bridge tan-
nic acid coated molecules with possible hydrogen bonds, aggregating particles and greatly
reducing the stability of the suspension. This conclusion may be suspect though, since a
pH of 5 falls right in the middle of the previously reported zpc range for MWNTs (pH 4.7 -
6.4) [53], and therefore the particle destabilization may be due to the neutral zeta potential
instead of the DOM bridging. Despite this disputable conclusion, it is clear that pH plays a
major and complex role in the stability of aqueous ENMs.
8

The effect of ionic strength on the stability of aqueous colloidal particles is a well stud-
ied subject and appears to apply to ENMs quite well. When an ENM particle forms in an
aqueous environment, it carries a surface charge which causes an electrical double layer to
form around it. Depending on the strength of the charge (magnitude of zeta potential), the
electrical double layer surrounding each approaching particle will repel one another and
keep the particles stable in suspension. The presence of electrolytes will screen this elec-
trical double layer repulsion to some extent, depending on the concentration of electrolytes
and the valence of ions. The electrical double layer repulsion can be screened to an ex-
tent where the van der Waals attraction forces dominate and the particles aggregate rapidly
and settle out. The classic Derjaguin-Landau-Verwey-Overbeek (DLVO) theory [58, 59]
describes the stability of aqueous colloids by combining the effects of the two aforemen-
tioned forces, electrical double layer repulsion (VR) and van der Waals attraction (VA), to
constitute the total interaction energy (VT ).
A representative interaction profile of a relatively stable suspension of spherical par-
ticles is presented in Fig. 1.1. As one particle approaches another from a distance, the
attractive and repulsive forces combine to form an energy barrier, which must be overcome
for the particles to aggregate. As ionic strength is increased or zeta potential decreased,
both of which usually result from an increase in electrolytes, the energy barrier is reduced.
This can continue until van der Waals attractions dominate and the energy barrier vanishes.
At this point, the suspension becomes unstable and the particles aggregate rapidly. In this
manner, the magnitude of the energy barrier can describe the stability of the colloidal sus-
pension.
The transformation from a stable colloid to a rapidly aggregating colloid occurs over
a very narrow range of electrolyte concentration, which culminates in the critical coagula-
tion concentration (CCC) [60]. According to the Schulze-Hardy rule [60], the valence (z)
of the counterions play a major role in the location of the CCC, with the CCC being pro-
portional to z−6. Several studies have confirmed the presence of CCC and proportionality
9

Figure 1.1: Example DLVO interaction energy curve.
10

to z for both aqueous nC60 suspensions [50, 61] and aqueous MWNT suspensions [53, 62],
suggesting qualitative agreement with the DLVO theory. Furthermore, the aggregation of
an aqueous suspension of nC60 has been shown to be in good quantitative agreement with
DLVO theory [61]. Based on all the previously discussed information, it is clear that the
stability of ENM aqueous suspensions are dependent upon a complex interaction of vari-
ables, namely the presence and type of DOM, pH of solution, and the concentration and
valence of counterions.
1.2.3 Deposition of ENMs in the subsurface environment
Just as the aggregation behavior of ENMs can determine their fate and transport in the
natural environment, so can their deposition behavior. The deposition of ENMs occur when
ENM particles collide with and sorb to an immobile surface such as sand or soil grains,
which may or may not be coated with different types of SOM. ENM deposition can occur
in many types of aquatic environments, including surface or ground water and because of
this, the deposition of ENMs is expected to play an important role in determining the fate
and transport of ENMs in the natural environment.
The immobile surface, onto which the ENM particles deposit, can be considered an
infinitely large particle (relative to the ENM particles), and therefore deposition can be
studied as a form of heteroaggregation [60]. Because of this, the DLVO theory is some-
times employed to describe the deposition of ENMs. As stated previously, the DLVO
theory describes the interaction between particles as the sum of the electrical double layer
repulsive forces and the van der Waals attractive forces. As also stated previously, the elec-
trical double layer repulsive forces are strongly affected by the valence and concentration
of electrolyte within the system [60]. Therefore, qualitatively, DLVO theory would pre-
dict the deposition of ENMs to increase with both increasing concentration and valence of
electrolytes. Several studies have focused on investigating deposition of ENMs onto silica
surfaces by varying the electrolyte concentration [61, 63–66] and these studies are explored
11

further below.
In order to compare deposition rates at varying conditions, independent of ENM ag-
gregation effects [61], the attachment efficiency (α) can be calculated by dividing the ini-
tial deposition rate by the corresponding initial deposition rate under favorable (oppositely
charged) conditions. By comparing α between varying solution conditions, instead of the
deposition rates, the attachment behavior can be compared independent of ENM aggre-
gation effects. Studies investigating aqueous suspensions of both nC60 [61, 64, 66] and
MWNTs [63, 65] report an increase in α with increasing electrolyte concentration until a
critical concentration when α levels off at a maximum of 1. As electrolyte concentration in-
creased, the electrical double layer repulsive forces between the particle and the negatively
charged silica surface were screened and the van der Waals attraction forces were unaf-
fected. This continued until the electrical double layer screening was so effective that the
van der Waals attractions dominated and the deposition was equal to the deposition onto
an oppositely charged surface. These findings are in qualitative agreement with DLVO
theory. Additionally, two of the aforementioned studies [61, 66] reported a much larger
charge screening effect when a divalent cation (Ca2+) was introduced. This finding is in
further qualitative agreement with DLVO theory. These studies demonstrate that the ionic
strength can have a tremendous effect on the deposition of ENMs onto mineral surfaces
in electrolyte solutions and that this effect can be described by DLVO theory. Unfortu-
nately, the subsurface environment contains additional variables for consideration, namely
the presence of SOM as both DOM and attached SOM layers.
As discussed earlier, SOM is ubiquitous in the subsurface environment and can exist in a
dissolved form as DOM or attached to large particle or grain surfaces as immobilized SOM
layers. When DOM is present in an ENM suspension, it is believed to adsorb to the surface
of the particles and increase their stability through steric repulsion. Studies have confirmed
this effect for aqueous suspensions of both nC60 [50] and MWNTs [52]. In the context
of ENM deposition, DOM is expected to have a similar effect. Two studies confirm this
12

expectation by investigating the effect of DOM (humic substances) on the deposition of an
aqueous nC60 suspension [66, 67]. In both cases, the deposition of nC60 particles onto the
silica surface was hindered by the presence of dissolved humic substances. As expected, the
authors attributed this finding to the steric hindrance induced by humic molecules adsorbing
onto the surface of the nanoparticles. Steric repulsion is a non-DLVO force and therefore,
DLVO theory does not correctly predict this effect.
Until very recently, less work has been done to investigate the interactions between
ENMs and the other ubiquitous form of SOM, attached SOM layers. One study [66] inves-
tigated the deposition of an aqueous suspension of nC60 onto silica surfaces precoated with
humic acid and alginate. Attached humic acid was shown to reduce the attachment of nC60
for both NaCl concentrations investigated, while attached alginate increased the attachment
of nC60 in the presence of 10 mM NaCl, while decreasing the attachment of nC60 in the
presence of 30 mM NaCl. The variable behavior of the alginate layer was attributed to its
compaction at higher salt concentrations, resulting in a smoother, more rigid layer. A recent
study [64] investigated the deposition of an aqueous nC60 suspension onto silica surfaces
coated with two different humic acids. The Suwannee River Humic Acid (SRHA) coating
showed similar attachment of nC60 as that of bare silica, while the Elliot Soil Humic Acid
appeared to hinder the attachment of nC60 over the majority of the NaCl concentration
range investigated. A very recent study [63] investigated the interaction between MWNTs
and silica surfaces with and without coatings of SRHA. In the presence of attached SRHA,
the MWNTs displayed similar attachment behavior as the case for bare silica, since α val-
ues for the two cases did not appear statistically different. As described previously, DLVO
theory only takes into account the forces of electrical double layer repulsion and van der
Waals attraction, therefore these studies illustrate yet another SOM effect that DLVO the-
ory does not correctly predict. Due to the variable nature of conclusions about the effect
of SOM layers in the aforementioned papers, it is clear that the physicochemical properties
and origin of SOM will likely play a key role in its effect on ENM deposition.
13

Another important variable to consider for the transport of ENMs or colloidal parti-
cles is the particle shape. Many natural colloids are nonspherical in shape, including plate
and rod shaped clay [68], various bacterial shapes (e.g., ellipsoid, ovoid, and rod shaped)
[69, 70], and some engineered nanomaterials (e.g., carbon nanotubes). Despite the ubiquity
of nonspherical colloids, only a limited number of studies have focused on the role of shape
with regard to colloidal transport [71–75]. Since most of the aforementioned studies exclu-
sively employ column experiments, the mechanisms behind the particle-surface attachment
cannot be isolated. To date, only one study has attempted to isolate the role of shape on
particle deposition. Seymour et al. [71] reported a much higher deposition rate of spherical
carboxylate-modified polystyrene particles as compared to 2:1 and 4:1 stretched versions
of the same particles. These experiments, however, were conducted under favorable con-
ditions (i.e., a positively charged, PLL-coated silica surface), lacking an energy barrier to
deposition and limiting the environmental relevance of the findings. No study to date has
investigated the role of shape on colloidal particle attachment to environmentally relevant
surfaces.
1.2.4 Data-Driven Modeling
Unlike the traditional method of modeling, which involves the fitting of model results to
experimental data by tuning model parameters, data-driven modeling allows for the devel-
opment of empirical models which are trained on large databases of experimental results.
This allows for the production of models which do not rely on physically vague model
parameters, but rather on the physical and chemical characteristics that define the system.
Particle transport models to date have largely relied on such model parameters [76–78]
which do not explicitly take into account the physicochemical properties of the particles
or the system [79]. Qualitative explanations that link physicochemical characteristics to
particle transport and attachment have been developed (e.g., agreement or disagreement
with DLVO theory) [39, 61, 64, 66, 80–82] however little quantitative mechanistic insight
14

has been developed from these studies. Without explicitly linking the physicochemical
properties of the particle and system to the transport and attachment, these models remain
descriptive tools rather than powerful predictive models.
Machine learning allows us to develop empirical models from complex systems where
the underlying relationships between the data are too complex to develop by hand [83].
Machine learning has been successfully applied to a wide range of complex problems,
including speech and computer vision, self driving cars, search engines, and medical di-
agnoses [84–87]. In two recent studies [88, 89] machine learning was applied to predict
the toxicity and biological impacts of ENMs, based explicitly on the molecular properties
of the nanomaterial. Despite the successes of machine learning in a wide range of appli-
cations, it has not been applied to the complex task of modeling environmental transport
until very recently. A very recent study by Goldberg et al. [90] employed ensemble ma-
chine learning (random forest) regression and classification to predict the retained fraction
(RF; the fraction of materials retained during a soil column experiment in comparison to
the total mass of materials injected into the column) and shape of retention profile (RP) us-
ing a database of more than 200 nanomaterial column transport experiments amassed from
published literature. Goldberg et al. [90] reported that their model was able to predict the
RF with a mean squared error between 0.025–0.033, and the RP with an expected F1-score
(the weighted harmonic mean of precision and recall) between 60–70%. Further, by recur-
sively removing physical and chemical features to optimize model predictive performance,
the authors were able to rank the importance of the physicochemical state features (e.g.,
pH, ionic strength, nanomaterial type, ect) to ENM transport.
An important difference between a data-driven modeling approach like machine learn-
ing and the traditional modeling approach is that the data-driven model is trained on a large
database of experiments conducted at varying experimental conditions as a whole, rather
than developed through separate investigations of isolated factors. This allows the data-
driven model to consider the complex interactions between physicochemical conditions
15

which are lost when the conditions are investigated in isolation. The limiting factor, until
recently, has been the lack of a sufficient amount of high quality experimental results to
support a data-driven approach.
16

Figure 1.2: An overview of the main concepts involved in utilizing the QCM-D. Massis coupled to the surface of the sensor, causing a decrease in observed frequency (A). Atregular intervals, the power is shut off to the sensor and the rate of oscillatory energy decayis monitored (B & C), with lower dissipation values corresponding to a rigid mass (B) andhigher dissipation values corresponding to a soft mass (C). This figure was adapted from aQ-Sense training course on the use of the QCM-D [91].
1.3 Quartz Crystal Microbalance with Dissipation Monitoring
The quartz crystal microbalance with dissipation monitoring (QCM-D) is a device that
relies on the piezoelectric properties of quartz to measure nanogram sensitive mass uptake
or release through changes in frequency and viscoelastic properties through changes in
dissipation, in real time. The QCM-D used in the current work was a Q-Sense E4 system
from Biolin Scientific (Stockholm, Sweden). The system consists of four flow modules,
each containing a 5 MHz AT-cut, silica coated quartz sensor.
By applying an alternating voltage that matches the quartz sensor’s resonance frequency
(5 MHz), or multiples of the resonance frequency called overtones, the sensor undergoes
an oscillatory deformation. In the case of the AT-cut sensor, this results in vibrations in the
thickness-shear mode [92], which means the top and bottom surfaces oscillate in parallel,
17
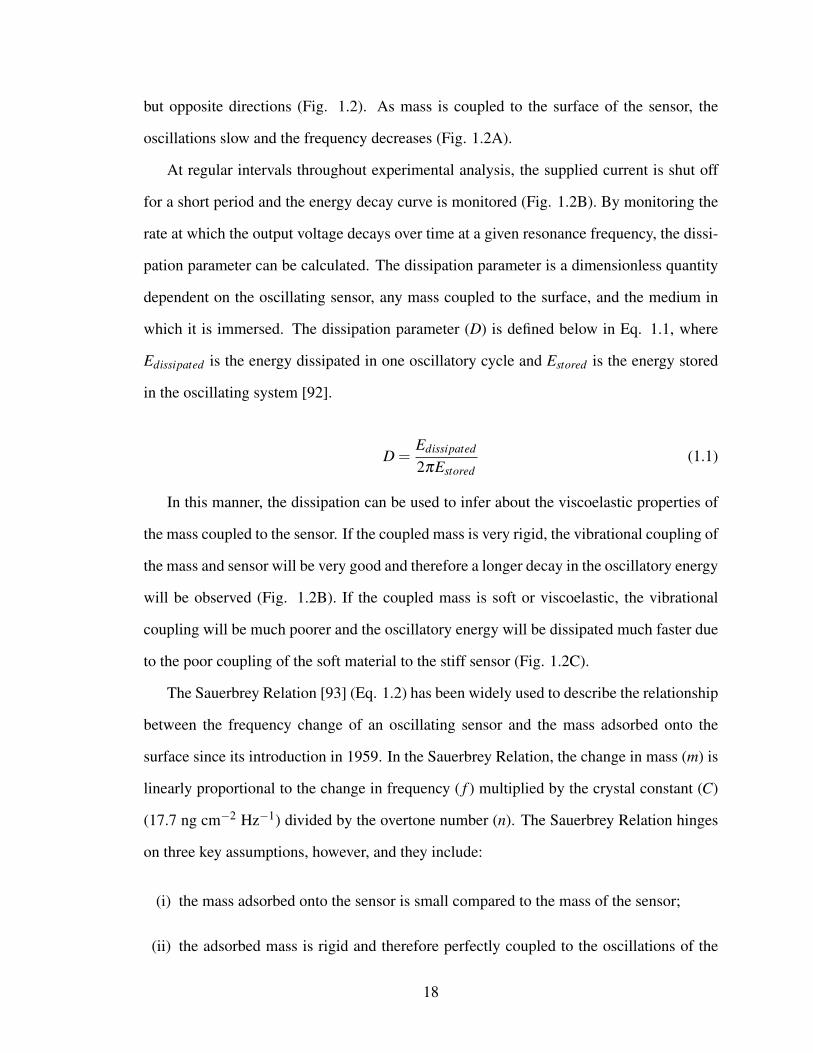
but opposite directions (Fig. 1.2). As mass is coupled to the surface of the sensor, the
oscillations slow and the frequency decreases (Fig. 1.2A).
At regular intervals throughout experimental analysis, the supplied current is shut off
for a short period and the energy decay curve is monitored (Fig. 1.2B). By monitoring the
rate at which the output voltage decays over time at a given resonance frequency, the dissi-
pation parameter can be calculated. The dissipation parameter is a dimensionless quantity
dependent on the oscillating sensor, any mass coupled to the surface, and the medium in
which it is immersed. The dissipation parameter (D) is defined below in Eq. 1.1, where
Edissipated is the energy dissipated in one oscillatory cycle and Estored is the energy stored
in the oscillating system [92].
D =Edissipated
2πEstored(1.1)
In this manner, the dissipation can be used to infer about the viscoelastic properties of
the mass coupled to the sensor. If the coupled mass is very rigid, the vibrational coupling of
the mass and sensor will be very good and therefore a longer decay in the oscillatory energy
will be observed (Fig. 1.2B). If the coupled mass is soft or viscoelastic, the vibrational
coupling will be much poorer and the oscillatory energy will be dissipated much faster due
to the poor coupling of the soft material to the stiff sensor (Fig. 1.2C).
The Sauerbrey Relation [93] (Eq. 1.2) has been widely used to describe the relationship
between the frequency change of an oscillating sensor and the mass adsorbed onto the
surface since its introduction in 1959. In the Sauerbrey Relation, the change in mass (m) is
linearly proportional to the change in frequency ( f ) multiplied by the crystal constant (C)
(17.7 ng cm−2 Hz−1) divided by the overtone number (n). The Sauerbrey Relation hinges
on three key assumptions, however, and they include:
(i) the mass adsorbed onto the sensor is small compared to the mass of the sensor;
(ii) the adsorbed mass is rigid and therefore perfectly coupled to the oscillations of the
18

sensor; and
(iii) the adsorbed mass is evenly spread over the surface of the sensor.
∆m =−C1n
∆ fn (1.2)
The first and third assumptions hold true in most cases where well dispersed, small
particles are being deposited onto the sensor in a thin layer. The second assumption how-
ever, does not hold true in the case of soft, viscoelastic films. This has been a well known
issue since the QCM-D was shown to be applicable in liquids around 1980 [94]. Since
a soft film does not follow the motions of the sensor perfectly well, some energy is lost,
which is not measured by the frequency alone. By using multiple overtones of frequency
and dissipation, there are enough inputs to use viscoelastic models that do not rely on the
second assumption. Two such models are the Voigt and the Maxwell viscoelastic models
[95]. Both of which are commonly used to estimate quantitative information about a soft
mass from a QCM-D experiment, including thickness, viscosity, and density [94]. Due to
the limitations of these models, for example, they rely on many parameters to be solved for
simultaneously and they assume a homogenous, uniform layer, the deposition rate in this
study will be quantified by the initial slope of the frequency shift.
QCM-D monitors the deposition rate of particles onto an oscillating sensor surface, iso-
lating deposition kinetics, and allowing for a direct measure of attachment efficiency (α)
without contributions from convection or filtration, unlike traditional soil column experi-
ments. α is an important kinetic transport parameter and is widely used in colloid filtration
theory (CFT) to quantify the likelihood of a particle attaching to a surface after a colli-
sion. In this manner, α allows the deposition behavior between varying conditions to be
compared independent of particle aggregation effects.
Throughout this work, α was calculated from QCM-D data as seen in Eq. 1.3. The
initial change of the third overtone of frequency with respect to time (d f3dt ) was calculated
19

from the first 120 seconds of particle deposition. Since the particles explored throughout
this work were negatively charged at all experimental conditions examined, any particles
that flow near a positively charged surface will attach, meaning the deposition in this case
is limited only by diffusive mass transport. Such conditions were created by modifying
the silica sensor with a layer of positively charged poly-L-lysine (PLL) and therefore, the
diffusion limited deposition rate ((
d f3dt
)di f f limited
) was taken to be the particle deposition
rate onto the PLL-coated surface at each corresponding experimental condition.
α =d f3/dt
(d f3/dt)di f f limited(1.3)
It should also be noted here that while the frequency shift gives insight into mass
changes of the adsorbed layer, this includes any water molecules within the layer, or bound
to the layer. The frequency shift associated with mass uptake which results in altered
surface topography can be non-negligibly altered by a change in bound water molecules,
depending on the surface roughness of the adsorbed layer [96, 97]. The root mean squared
roughness (as measured by atomic force microscopy) of all surfaces investigated through-
out this work were less than 6 nm, therefore this effect should not alter the frequency
shift significantly, according to Rechendorff et al. [96]. Furthermore, all layer topography
changes throughout this work resulted from altered solution conditions (ionic strength or
temperature) after which ample time was given for the layer to equilibrate before particle
deposition was monitored, therefore any frequency shift alterations resulting from water
molecule trapping did not affect the observed value of particle deposition rate.
20

1.4 Research Obejctives
The purpose of this work is to quantitatively investigate the effect of various physic-
ochemical characteristics and solution conditions on the value of particle attachment ef-
ficiency, identify which characteristics are most important to predicting attachment effi-
ciency, and finally combine all published attachment efficiency data into an empirical,
predictive model. The central hypothesis of this work states that the particle attachment
efficiency will depend heavily on:
• The presence and physicochemical characteristics (e.g. macromolecular properties)
of any attached SOM layers.
• The ionic strength of solution, through both salt concentration and ion valence.
• The shape of the colloidal, biological, or ENM particle.
Chapter 2 investigates the effect of type and physicochemical properties of attached
SOM layers on the particle attachment efficiency of nC60. Using a quartz crystal microbal-
ance with dissipation monitoring (QCM-D), the deposition of nC60 onto silica sensors is
monitored, with and without coatings of Harpeth humic acid (HHA) and Harpeth fulvic
acid (HFA), while varying thermal energy. By comparing attachment efficiency curves as
a function of temperature between bare silica, HHA-coated, and HFA-coated sensors with
DLVO predictions, the effect of SOM coatings is elucidated. By comparing a thermal char-
acterization of the SOM layers with the attachment efficiency trends, possible mechanisms
are identified and discussed.
Chapter 3 focuses on solution chemistry and how it affects particle attachment effi-
ciency. The attachment of nC60 onto silica sensors with and without coatings of HHA
was monitored while salt concentration and valence was varied. Measurements of surface
charge for all depositional surfaces at each experimental condition were compared with the
attachment efficiency curves and DLVO predictions of interaction energy. Possible mecha-
21

nisms for the observed phenomena were introduced and discussed. The findings were also
compared to similar published literature.
In Chapter 4, the role of particle shape is explored. Polystyrene (PS) spheres are heated
to their glass transition temperature and stretched into an ellipsoidal conformation. By com-
paring the attachment efficiency of spherical and stretched PS, the role of shape is isolated.
The presence of a terrestrial (HHA) and aquatic (Alginate) coating is also investigated and
dramatic differences are observed. Through DLVO interaction energy calculations and
atomic force microscopy images, possible mechanisms for these observed differences are
elucidated.
Chapter 5 introduces a machine learning predictive model for attachment efficiency.
All relevant, published attachment efficiency data is gathered and combined into a database
and a total of 13 physicochemical characteristics are chosen as predictive features. An en-
semble machine learning model (gradient boosting decision trees) is then trained on the
database and the most important features for prediction are identified using recursive fea-
ture elimination with cross-validation (RFECV). The results from the predictive model and
RFECV are presented and the implications of these findings are discussed.
Chapter 6 wraps up the work presented here, by bringing together all the reported in-
formation from each preceding chapter and discussing the conclusions and implications of
the findings as a whole. Based on these findings, the suggested direction for future, related
work is presented.
22

Chapter 2
The role of soil and sediment organic matter physicochemical properties on nC60
attachment
2.1 Introduction
In 2014, the nanotechnology market was valued at around $26 billion and it is expected
to grow to $64.2 billion over the next five years [1]. In particular, the buckminsterfullerene
(C60) molecule has attracted much attention due to its widespread applications in many
areas (e.g. biomedical technology, electronics, and optics) [2–4]. Due to the very low
aqueous solubility of C60 [98], the nano-sized colloidal particle it forms in water (nC60)
is the most environmentally relevant form to study. With such a high level of production
and dissemination, the eventual release of nC60 into the environment is inevitable, either
from industrial sources or through disposal in municipal waste. Several studies have inves-
tigated and revealed the potential human health effects, aquatic toxicity, and antimicrobial
properties of nC60 [3, 9, 10, 99]. The ongoing environmental release coupled with a strong
potential for toxicity raise serious concern for the fate and transport of this material in the
environment.
The fate and transport of nC60 is mainly influenced by aggregation and deposition pro-
cesses, which are controlled by a complex balance of variables including pH, ionic strength,
and presence of organic matter [56]. Once in the environment, nC60 will interact with natu-
ral soils and sediments, and thus, organic matter attached on the soil and sediment surfaces.
Immobilized layers of soil and sediment organic matter (SOM) are the product of on-site
physical and biological decomposition and are an essential component of natural soils and
sediments. SOM layers have been found to strongly sorb hydrophobic organic chemicals
(HOCs) and thus influence their transport [11]. If similar interactions between SOM layers
and nC60 exist, these interactions will influence potential pathways of exposure and their
23

eventual impact on ecosystems and human health.
Humic substances, including humins, humic acids, and fulvic acids, typically repre-
sent the dominant organic components in soils and sediments [14]. Chemically, humic
substances are a mixture of both substituted aromatic and aliphatic compounds, forming a
complex physical structure held together by inter- and intra-molecular interactions [15] and
therefore represent complex mixtures of macromolecules with varying degrees of crosslink-
ages. An important factor when considering the macromolecular properties of SOM is, of
course, the presence of water. The hydration of SOM has been shown to alter the SOM
matrix in several key ways, namely through altered physicochemical properties. Water
has been shown to interact strongly with hydrophilic SOM, including fulvic and humic
acids, resulting in water uptake and swelling of the macromolecular matrix [22, 25]. The
physicochemical changes in SOM due to increased hydration have also been shown to sig-
nificantly increase the sorption of HOCs [34–37]. The mechanism for increased sorption of
HOCs due to increased hydration is likely explained by water-assisted disruption of polar
SOM contacts, as described by Graber and Borisover [37]. As hydration increases, water
molecules penetrate the SOM matrix and reach polar areas that were previously unavail-
able to HOC interaction, due to inter- or intra-molecular interactions. By hydrating these
areas, the water molecules disrupt the interactions between these contacts and provide a
new sorption site, which was previously unavailable. The extent to which this sorption
enhancing characteristic of SOM hydration may apply to the deposition behavior of nC60,
however, has not yet been investigated.
Dissolved organic matter (DOM), in the form of humic substances, has been shown
to adsorb to the surface of nC60 aggregates and, through steric repulsion, increase their
stability to aggregation [50] and deposition [66]. Until very recently, however, little work
has been done to investigate the interaction between nC60 and the other form of ubiqui-
tous SOM, immobilized SOM layers. In recent studies, SOM layers have been shown to
enhance, hinder, or have no effect on the attachment of nC60 depending on the type of
24

SOM and the ionic strength of solution [64, 66]. Furthermore, depending on the stabilizer,
the transport of carbon nanotubes through humic acid coated quartz sand grains has been
shown to vary between complete retention and minimal retention [100]. Due to the variable
nature of conclusions presented in these studies, it is clear that SOM layers will play a com-
plex role in the deposition of nC60, likely dependent upon the type and physicochemical
properties of SOM and the ionic strength of solution.
The purpose of this study is to further investigate the role SOM layers play on the depo-
sition of nC60 by varying the type and physicochemical properties of SOM. Using a quartz
crystal microbalance with dissipation monitoring (QCM-D), the deposition of nC60 onto
silica surfaces with and without coatings of humic and fulvic acid was studied, while al-
tering the physicochemical properties of the layer by varying temperature. The attachment
efficiencies of nC60 onto three different surfaces as a function of temperature are then com-
pared to DLVO theory predictions, and the effect of SOM physicochemical properties on
the transport of nC60 is discussed. Not only will knowledge of SOM and engineered nano-
material (ENM) interactions improve the understanding of the fate and transport of ENMs
in the natural environment, but it will also aid in the engineered environment, through
improved understanding of factors influencing the deposition behavior of similar types of
ENMs for applications in water and wastewater treatment.
25

2.2 Materials and Methods
2.2.1 Materials and solution chemistry
Sublimed nC60 powder (99.9%) was purchased from MER Corporation (Tucson, AZ).
Dry Harpeth River Humic Acid (HHA) and Fulvic Acid (HFA) were isolated as described
in our previous publication [101]. Sodium phosphate monobasic (S5011), sodium phos-
phate dibasic (S5136), and poly-L-lysine hydrobromide (PLL, P1274) were purchased from
Sigma-Aldrich (St. Louis, MO). Reagent grade NaCl (S671) was purchased from Fisher
Scientific (Pittsburgh, PA). Silica-coated QCM-D sensors (QSX-303) were purchased from
Q-Sense (Biolin Scientific, Stockholm, Sweden). All solutions were prepared using ul-
tra pure water purified by the Milli-Q Water Purification system from Millipore (Billerica,
MA).
Sodium phosphate monobasic and sodium phosphate dibasic were mixed on a 50%
molar basis to produce a phosphate buffer that would maintain all solutions at a pH of 6.7
± 0.1. The background electrolyte concentration for all experiments consisted of 70 mM
NaCl and 2 mM of the previously described phosphate buffer.
2.2.2 nC60 stock suspension and SOM stock solutions
The nC60 stock suspension was prepared using a similar method to that described by
Andrievsky et al. [102]. First, approximately 35 mg of C60 powder was dissolved in 30 mL
toluene, forming a clear, dark purple solution. Then, 5 mL of this mixture was introduced
into a beaker containing 50 mL deionized water, forming two distinct phases. This solu-
tion was then sonicated (Fisher Sonic Dismembrator 300, Pittsburgh, PA) for more than 3
hours in a fume hood to allow for evaporation of the toluene. The beaker was topped off
with deionized water every 20 minutes to account for the evaporated water. The resulting
transparent, brown-yellow liquid was filtered through 0.22 µm pore size membrane filter
paper (Fisher, GSWP02500), resulting in a clear, bright yellow liquid. This method was
26

repeated a total of 6 times to produce approximately 330 mL of nC60 stock suspension. The
resulting nC60 stock suspension was determined to have a total carbon content (Shimadzu
TOC-V CPH/CPN, Columbia, MD) of 30.48 mg/L and an unadjusted pH of 5.5. The sus-
pension was stored in the dark at 4 °C for the entirety of the study. All experiments took
place within 3 months of preparing the nC60 stock suspension, during which time the parti-
cle size was stable, as confirmed by periodic Dynamic Light Scattering (DLS) monitoring
(Malvern Zetasizer Nano ZS, Worcestershire, UK).
Fifty milligrams of dry HHA was introduced into 400 mL deionized water and stirred
for more than 3 hours. During this time, the pH was adjusted drop wise with 0.1 N NaOH
to a pH of 10.0 to allow the HHA to completely dissolve. After 3 hours and complete
dissolution of the HHA, the pH was adjusted drop wise with 0.1 N HCl down to a pH of
6.7 and filtered through 0.22 µm pore size membrane filter paper. The stock solution was
then diluted to 500 mL total volume, including the addition of NaCl and phosphate buffer
to make a 0.1 g/L HHA, 70 mM NaCl, and 2 mM phosphate buffer solution.
Fifty milligrams of dry HFA was introduced into 400 mL of deionized water and stirred
for more than three hours. Once the HFA had completely dissolved, the pH was adjusted
drop wise with 0.1 N NaOH to a pH of 6.7 and filtered through 0.22 µm pore size membrane
filter paper. The stock solution was then diluted to 500 mL total volume, including the
addition of NaCl and phosphate buffer, to make a 0.1 g/L HFA, 70 mM NaCl, and 2 mM
phosphate buffer solution.
Using DLS, the intensity weighted hydrodynamic diameter of the HHA and HFA par-
ticles in solution was determined to be 247 and 390 nm, respectively. Also using DLS,
the zeta potential of the HHA and HFA particles were determined to be -43 and -12 mV,
respectively, based on 14 independent measurements. Both solutions were stored at room
temperature in the dark for the entirety of the study, during which time the particle size was
stable, as confirmed by periodic DLS monitoring. The HHA and HFA used in this study
were characterized in a previous publication by DeLapp et al. [101] and the elemental and
27

functional group analysis are provided in Tables A.1 and A.2 (A.1).
2.2.3 nC60 attachment experiments
The deposition of nC60 nanoparticles onto silica surfaces with and without HHA and
HFA coatings was explored using a Quartz Crystal Microbalance with Dissipation Moni-
toring (QCM-D, Q-Sense E4 unit, Biolin Scientific, Stockholm, Sweden). The unit consists
of 4 flow modules, each containing a 5 MHz AT-cut quartz crystal sensor. Flowrates were
0.1 mL/min, ensuring laminar flow within the flow module. Temperatures of the solution
and flow module were maintained at ± 0.02 °C by a Peltier element.
The cleaning protocol for the QCM-D sensors is as follows. Before each experiment,
the silica coated quartz sensors (QSX303) were soaked in a 2 % Hellmanex II (Hellma An-
alytics, Mullheim, Germany) solution overnight, rinsed with copious amounts of deionized
water, dried with ultrapure N2 gas, and then cleaned in a UV-Ozone cleaner (Jelight 42
UVO Cleaner, Irvine, CA) for 20 minutes. Immediately after cleaning, the sensors were
loaded into the QCM-D for execution of the experiment.
A representative nC60 deposition experiment protocol is illustrated in Fig. 2.1. The
background solution, 70 mM NaCl and 2 mM phosphate buffer, was flowed over the sur-
face of the sensors until a stable baseline was achieved. The signal was considered stable
when the third overtone frequency ( f3) failed to drift more than 0.3 Hz over the course of
10 minutes. Once a stable baseline was achieved, 2 mL of a 0.1 g/L PLL solution that
contained the same electrolyte and buffer concentrations was flowed across the sensor sur-
face. During this time, the PLL adsorbed to the silica surface very rapidly. The PLL layer
was then rinsed with 2 mL of the background solution. If PLL was the final layer before
nC60 deposition, the layer construction ended here. In the case of the HHA and HFA ex-
periments, a solution of 0.1g/L HHA or HFA, containing the same electrolyte and buffer
concentrations, was then flowed across the rinsed PLL layer until the signal once again
stabilized, ≈20 minutes. During this time, the oppositely charged HHA or HFA macro-
28

molecules readily adsorbed onto the rinsed PLL layer, forming a second layer. The rapid
adsorption of HHA or HFA onto the PLL layer usually resulted in a shift in f3 of approxi-
mately 20 and 22 Hz, respectively. The mass of HHA and HFA deposited onto the sensor
surface was calculated to be approximately 411 and 351 ng/cm2, respectively, by the Voigt
viscoelastic model [95]. A plot of the model calculated masses can be seen in Figure 2.5.
Finally, the HHA or HFA layer was then rinsed with 2 mL of the background solution until
a stable baseline was achieved. The layer construction portion of all experiments took place
at 25 °C.
Once the layers were constructed, the temperature was adjusted to the desired tempera-
ture of the nC60 deposition experiment. All solutions used in each experiment were held at
2 °C above the set point temperature of the experiment for several hours before the experi-
ment took place to ensure the solutions would not degas on the surface of the sensor. Once a
stable baseline was achieved in the background electrolyte, measured amounts of the stock
1 M NaCl and 1 M phosphate buffer were added to the diluted stock nC60 suspension to
make a nC60 concentration of 6 mg/L, with electrolyte and buffer concentrations matching
all other solutions. The resulting diluted nC60 suspension was then immediately flowed
into the flow module and across the surface of the sensor, allowing for nC60 deposition and
attachment to the sensor surface.
As nC60 deposited onto the sensor surface, the mass continually increased, causing a
continuous decrease in frequency, as described by the Sauerbrey Relation [93] (Eq. 2.1),
where m is the mass of material deposited, C is the crystal constant (17.7ngcm−2Hz−1),
and fn is the frequency at overtone n. The first 120 seconds of frequency drop correspond-
ing with nC60 deposition were considered in calculating the initial deposition rate at each
experimental condition.
∆m =−C1n
∆ fn (2.1)
While nC60 deposited onto the sensor surfaces, the first 120 seconds of the shift in the
29

Figure 2.1: Representative nC60 deposition experiment. The initial baseline was collectedin the background solution (A) before PLL was attached to the silica surface (B). Theattached PLL was then washed in the background solution (C) before HHA was attachedto the PLL surface (D). The attached HHA was then washed with background solution andthe temperature of the sensor and chamber was lowered to 15 °C (E). Once a stable baselinewas observed at the new temperature, the nC60 nanoparticle suspension with backgroundsolution was introduced and attached to the HHA surface (F).
30

third overtone of frequency ( f3) were used to calculate the initial deposition rates. In or-
der to compare deposition rates at different experimental conditions independent of nC60
aggregation effects [61], the deposition rates were normalized by calculating the attach-
ment efficiency factor (α). The attachment efficiency factor was calculated (Eq. 2.2) by
normalizing the initial deposition rates to the corresponding initial deposition rate under
favorable (nonrepulsive) conditions. Here, the favorable deposition rates are provided by
the deposition rates of nC60 onto oppositely charged PLL layers at identical experimental
conditions.
α =d f3/dt
(d f3/dt) f av(2.2)
2.2.4 DLVO interaction energy calculations
By treating the nC60 deposition as a sphere-plate interaction, the total interaction energy
between the nC60 particles and the silica sensor surface was estimated from the sum of the
electrical double layer repulsion (VR) and van der Waals attraction (VA). Eq. 2.3 [103] was
used to calculate the van der Waals attraction, where A is the combined Hamaker constant
for the nC60 water silica system (4.71 x 10⁻²¹ J) [64], a is the radius of nC60 particles (Table
A.3), h is the separation distance between the nC60 particle and silica sensor surface, and λ
is the characteristic wavelength of interaction (usually assumed to be 100 nm) [104]. Mean
values of particle diameter and zeta potential are used in all DLVO calculations.
VA =−Aa6h
(1+
14hλ
)−1
(2.3)
Eq. 2.4 [103] was used to calculate the electrical double layer repulsion, where ε0 is the
dielectric permittivity in a vacuum, εr is the relative dielectric permittivity of water (Table
A.3), ζp is the zeta potential of the nC60 particles (-27.2 mV, remained constant over the
temperature range investigated according to DLS measurements (Fig. 2.4), ζc is the zeta
31

potential of the silica surface (-30 mV), and κ is the inverse Debye length.
VR = πε0εra{
2ζpζcln[
1+ exp(−κh)1− exp(−κh)
]+(ζ
2p +ζ
2c)
ln [1− exp(−2κh)]}
(2.4)
Eq. 2.5 was used to calculate the inverse Debye length for the electrolyte system [104],
where e is the elementary charge, n j is the number concentration of ions in the bulk solu-
tion, z j is ion valence, k is the Boltzmann constant, and T is the absolute temperature.
κ =
√e2 ∑n jz2
j
ε0εrkT(2.5)
Since the nC60 particle radius and relative dielectric permittivity of water vary with tem-
perature, the values used in Eqs. 2.3, 2.4, and 2.5 are summarized in Table A.3. The values
for the relative dielectric permittivity of water were obtained from a study by Malmberg
and Maryott [105].
32

2.3 Results and Discussion
2.3.1 Materials characterization
Investigation by Transmission Electron Microscopy (TEM) (Philips CM 20 TEM, Eind-
hoven, Netherlands) suggested the particles were polydisperse, as seen in Fig. 2.2, where
representative images of an aggregate (left image) and individual particles (right image) are
shown. DLS measurements confirmed a polydisperse particle distribution with an intensity
weighted, mean hydrodynamic diameter of the nC60 nanoparticles of 103 nm based on 14
independent measurements and a zeta potential of -42 mV, based on 20 independent mea-
surements. The zeta potential of the suspension was measured over a pH range of 3–10 and
the results remained negative over the entire pH range investigated. Figures A.1 and A.2
(A.2) summarize particle size distribution and zeta potential measurements.
The nC60 suspension was also characterized throughout the temperature range investi-
gated in this study. The nC60 particle size and zeta potential as a function of temperature
can be seen in Fig. 2.3 and 2.4, respectively. The figures illustrate that there was no sig-
nificant change in nC60 particle size or zeta potential observed throughout the temperature
range investigated.
The mass of the layers formed by depositing HHA and HFA were determined to be ap-
proximately 411 and 351 ng/cm2, respectively, by the Voigt viscoelastic model [95]. A plot
of the model calculated masses can be seen in Fig. 2.5. The SOM layers were further char-
acterized thermally, to ensure that the high temperatures did not facilitate desorption of the
SOM layers, which would in turn affect nC60 deposition. After the layers were constructed,
as described in 2.2.3, they were taken through a temperature ramp which encompassed the
entire temperature range of the experiment. Upon cooling the SOM layers, the frequency
curve returned to its original value in each case, meaning the mass of the layers remained
unchanged and desorption was not observed. Representative heating/cooling curves for
HHA and HFA can be seen in Fig. 2.6 and 2.7, respectively.
33

Figure 2.2: Representative nC60 TEM images.
Figure 2.3: Mean hydrodynamic particle diameter of the nC60 stock suspensions as a func-tion of temperature. Each point represents 20 independent measurements and error barsrepresent standard deviation.
34

Figure 2.4: Zeta potential of the nC60 stock suspension as a function of temperature. Eachpoint represents 14 independent measurements and error bars represent the standard devia-tion.
Figure 2.5: Calculated mass of the HHA and HFA layers, by the Voigt viscoelastic model.
35

Figure 2.6: The heating/cooling loop of HHA, showing no change in mass over the tem-perature range investigated.
36

Figure 2.7: The heating/cooling loop of HFA, showing no change in mass over the temper-ature range investigated.
37

Figure 2.8: Calculated DLVO interaction energy profiles as nC60 approaches a bare silicasurface.
2.3.2 nC60 attachment analysis
The deposition behavior of nC60 onto bare silica has been shown to be in qualitative
agreement with DLVO theory [61], therefore the total interaction energy profiles for nC60
approaching a bare silica surface were calculated for each temperature investigated and
presented in Fig. 2.8. As temperature increases, the total interaction energy profiles remain
very similar, except for a small decrease in the energy barrier.
For the first time, the attachment efficiency factors of nC60, onto three different sur-
faces, as a function of temperature are presented in Fig. 2.9. The bare silica attachment
trend appears rather flat, with a small net increase, though the total increase does not fall
outside the error of the measurements. This can be considered relatively consistent with
DLVO predictions (Fig. 2.8), as the energy barrier shows a small decrease with increasing
38

temperature, which could lead to a negligible increase in attachment. The presence of HHA
and HFA coatings cause significant deviations from the bare silica trend. Compared to the
attachment onto bare silica, both HHA and HFA hinder nC60 attachment at lower tempera-
tures, while HHA enhances attachment at higher temperatures. At the highest temperature
investigated, HHA greatly enhances attachment while HFA appears to marginally enhance
it, including a very slight overlap of error bars with the bare silica curve. The HHA and
HFA trends continuously increase with increasing temperatures, though the rate of increase
appears complex, presumably due to the change in physicochemical properties of the SOM
layers over the temperature range investigated. The HHA trend displays a rate increase
throughout the temperature range investigated, while the HFA trend appears to level off
and then recover. The largest increase in attachment for both surfaces occurs in the tem-
perature range of 35–45 °C. This suggests that the SOM layers undergo the largest change
in physicochemical properties in this region. Previous studies of the HHA and HFA have
illustrated thermal transitions within this region [101], however these studies investigated
the materials as a dry, bulk powder. In our current work, the HHA and HFA are examined
as thin, hydrated layers, bringing into account additional variables and, because of this, the
degree to which these studies apply to the current work is unknown.
2.3.3 Thermal effects on attachment
In order to understand the deviation in attachment onto the HHA and HFA surfaces,
the thermal properties of the SOM layers were investigated using the QCM-D. This is a
particularly novel approach because the QCM-D has never before been used to thermally
characterize SOM layers. First, each SOM layer was constructed following the same pro-
cedure as executed for the deposition experiments and as described previously. Then, the
layer was exposed to a temperature ramp covering the entire temperature range of this
study. The density and viscosity of water are a function of temperature, so the response of
the sensor submerged in a solution is also expected to change as a function of temperature
39

Figure 2.9: nC60 attachment efficiencies onto bare, HHA-coated, and HFA-coated silicasensors as a function of temperature. Error bars represent the standard deviation.
40

Figure 2.10: Thermal characterization of the HHA layer by QCM-D, with all bulk solutionand sensor effects subtracted, compared to the corresponding nC60 attachment efficiencytrend. The 3rd overtone of frequency is displayed.
[106]. In order to isolate the effects caused only by changes in each SOM layer, the same
bare sensor was first taken through an identical temperature ramp and its response was sub-
tracted. In this manner, the QCM-D was utilized to thermally characterize a thin layer of
SOM. The frequency curves displayed in Figs. 2.10 and 2.11 represent the response of the
HHA and HFA layers, respectively, to a change in temperature. By comparing the SOM
layer frequency response to the corresponding nC60 attachment trend, we can gain insights
into the mechanisms by which the attachment onto each SOM layer deviates from that of
bare silica.
The frequency curve provides insight into the mass changes of the layer, including any
water molecules that are hydrating the layer. The overall trend of each frequency curve is
downwards, indicating an increase in mass (see Eq. 2.1), attributable to the hydration of the
41

Figure 2.11: Thermal characterization of the HFA layer by QCM-D, with all bulk solutionand sensor effects subtracted, compared to the corresponding nC60 attachment efficiencytrend. The 3rd overtone of frequency is displayed.
42

SOM layer at increasing temperatures. The observed increase in hydration with increasing
temperature is in agreement with a study by Vidyasagar et al. [107], which investigated
the thermal characteristics of a polyectrolyte using a similar QCM-D method. As indicated
by Figs. 2.10 and 2.11, an increase in hydration (decrease in frequency) corresponds with
an increase in attachment for both SOM layers investigated. As the HHA layer begins to
hydrate between 15–25 °C, the attachment shows a small increase (Fig. 2.10). As the
HHA continues to hydrate more rapidly between 25–35 and 35–45 °C, the attachment also
results in a sharper increase. As the HFA layer begins to hydrate in the range of 15–25
°C, the attachment begins to rise as well (Fig. 2.11). As the HFA hydration rate slows and
begins to reverse in the range of 25–35 °C, however, the increase in attachment slows and
begins to level off. The lack of an observable decrease in attachment in this region suggests
that the interaction is a complex one, relying on more than just hydration of the layer. As
the HFA layer resumes a rapid hydration rate between 35–45 °C, the attachment shows a
correspondingly rapid increase. For these reasons, Figs. 2.10 and 2.11 clearly illustrate a
strong correlation between SOM layer hydration and resulting nC60 attachment efficiency,
which, to our knowledge, has not been illustrated for ENMs.
An increase in hydration of the SOM layers at higher temperatures contribute to the
increased attachment behavior through water-assisted disruption of polar SOM contacts, as
described by Graber and Borisover [37]. As hydration increases, water molecules penetrate
the SOM matrix and reach polar areas that were previously unavailable to nC60 attachment,
due to inter- or intra-molecular interactions. By hydrating these areas, the water molecules
disrupt the interactions between these contacts and provide a new contact for attachment,
which was previously unavailable. This effect has been illustrated for the sorption of HOCs
by a Pahokee peat hydrated by water [37] and other polar solvents [36]. The results of the
current study illustrate a similar effect for the attachment of nC60 by two different humics,
bringing into account more complexity in the environmental fate and transport of nC60.
Another possible contributing factor to the observed increase in attachment involves
43

the swelling of the SOM layer. At higher temperatures the SOM layers expand or swell
due to increased thermal motions and apparent increased hydration, much like the matrix
relaxation observed in previous studies [29, 32]. Swelling will increase the volume of the
layers, allowing them to take a more extended conformation from the surface of the sensor
and also provide an increasingly cross-linked or bridged mesh of organic matter for the
nC60 particles to become entangled in. At lower temperatures, the SOM layers dehydrate,
which compacts the layer. This compacted layer likely has a more condensed, less extended
(smoother) surface with reduced potential for nC60 particle entanglement, effectively low-
ering attachment efficiency (Fig. 2.9). This finding is in agreement with a study by Chen
and Elimelech [66] which investigated the deposition of nC60 onto an alginate coated silica
surface. When the alginate was exposed to a higher electrolyte concentration, the layer
compacted and resulted in lower attachment efficiency.
44

2.4 Conclusions
In this study, we have shown that the attachment of nC60 to immobilized layers of HHA
and HFA is greatly affected by temperature and that the trend in attachment efficiency onto
the SOM layers deviate greatly from that of bare silica. The attachment efficiency onto both
SOM layers hinder attachment at low temperatures and then begin to rise as temperatures
increase, eventually resulting in enhanced attachment at high temperatures, in the case of
the HHA layer. (Fig. 2.9). Based on thermal characterization of the SOM layers compared
to the corresponding attachment trends (Figs. 2.10 and 2.11), the attachment efficiency
is strongly correlated with hydration of the layer. Regions of rapid hydration correspond
to steep increases in attachment and regions of slowed or decreased hydration correspond
to lower increases in attachment. Possible mechanisms explaining this phenomenon in-
clude water-assisted disruption of polar SOM contacts and hydration induced swelling of
the SOM matrix. This thermal effect on the attachment of nC60 to SOM may prove to be
crucial in understanding the fate and transport of ENMs in areas that are rich in SOM, like
the subsurface environment, because humic substances typically represent the dominant
organic components in soils and sediments [14]. In areas that see large temperature fluctu-
ations throughout the year, we may see a much larger uptake of ENMs in the warm seasons
and less uptake in the cold seasons. Understanding how ENMs interact with individual
components of soil is crucial to understanding the fate and transport of ENMs in a complex
soil system, leading to their eventual impact on ecosystem and human health. The thermal
effect illustrated in the current study may also prove useful in the removal of similar ENMs
from wastewater or drinking water, by exploiting the much higher attachment efficiency
at increased temperatures. Further studies need to be carried out, however, to investigate
the relative importance of other variables which may play a role in ENM interactions with
SOM.
45

Chapter 3
nC60 deposition onto humic acid coated silica and the effect of ionic strength
3.1 Introduction
The popularity of engineered nanomaterials (ENMs) has grown rapidly over the last
decade, with the ENM market expected to reach a total of $64.2 billion over the next five
years [1]. This increase in production will certainly lead to the eventual release of ENMs
into the environment through production and manufacturing of the products or use and
disposal from the consumer [108]. One particular ENM of note is buckminsterfullerene
(C60), which has applications throughout many fields, including biomedical technology,
electronics, and optics [2, 3]. Since the solubility of fullerene in water is very low [98], the
nano-sized colloidal particle it forms in water (nC60) is the most environmentally relevant
form to study. The antimicrobial properties, aquatic toxicity, and potential human toxicity
of nC60 [3, 9, 10, 109] combined with the inevitable release to the environment raise serious
concerns about the environmental fate and transport of nC60.
As with other colloidal particles, the transport of nC60 throughout the environment will
be determined by its aggregation and deposition processes. These processes are controlled
by a complex system of variables including ionic strength, the presence of organic matter,
and pH [56]. The aggregation behavior of nC60 in clean systems (absent of organic matter)
is usually described by the classic Derjaguin-Landau-Verwey-Overbeek (DLVO) theory
[58, 59], which describes the stability of aqueous colloids by combining the effects of an
electrical double layer repulsion (EDL) and a van der Waals (vdW) attraction. An increase
in ionic strength screens the EDL repulsion and lowers the energy barrier to aggregation.
Furthermore, the Schulze-Hardy rule [60] states that the valence (z) of counterions play a
major role as well, predicting the critical coagulation concentration (CCC) to be propor-
tional to z−6. The aggregation behavior of nC60 has been shown to be in agreement with
46

DLVO theory both in terms of sensitivity to ionic strength and proportionality to z [50, 61].
The deposition of nC60 occurs when nC60 particles collide with and sorb to an immo-
bile surface in the complex subsurface environment. Relative to the nC60 particles, these
mineral and soil surfaces can be considered infinitely large particles and therefore deposi-
tion can be studied as a form of heteroaggregation [60]. Several studies have monitored
the deposition of nC60 using both quartz crystal microbalance with dissipation monitoring
(QCM-D) [50, 61, 64, 66] and packed column experiments [64, 67, 73, 110–112], however
most were conducted in a simple electrolyte system with bare mineral surfaces. As ionic
strength increased in the aforementioned QCM-D studies, the attachment efficiency of nC60
onto silica surfaces increased until reaching a maximum of 1 at the CCC, suggesting qual-
itative agreement with DLVO theory. Additionally, two of these studies [61, 66] reported
a much larger charge screening effect when a divalent cation (Ca2+) was introduced, sug-
gesting qualitative agreement with the Schulze-Hardy rule. DLVO theory describes the
deposition of nC60 well in these clean systems, however the subsurface often contains ad-
ditional variables for consideration, namely the presence of organic matter.
Soil organic matter (SOM) is ubiquitous in the subsurface environment, either dissolved
or immobilized (attached) onto the surface of mineral and soil surfaces and humic sub-
stances typically represent the dominant organic components in soils and sediments [14].
Dissolved organic matter has been shown to adsorb onto the surface of nC60 particles and
increase their stability to aggregation and deposition through steric repulsion [50, 66] and,
in turn, increase their mobility. The effect of attached soil organic matter (SOM) layers
on the deposition behavior of nC60, however, appears to be much more complex. The
presence of attached SOM layers has been shown to enhance, hinder, or have no effect on
the attachment of nC60, depending on the type of SOM and the ionic strength of solution
[50, 64, 66]. One study reported that an alginate layer enhanced nC60 attachment in the
presence of 10 mM NaCl, while hindering it in the presence of 30 mM NaCl [66]. The
variable behavior was attributed to its compaction at higher NaCl concentrations, resulting
47

in a smoother, more rigid layer, with less room for nC60 particle entanglement. Further-
more, in our previous work, we reported that increasing the temperature of a humic acid
layer while holding all other variables constant, raised the attachment efficiency of nC60
from low attachment (α = 0.3) to complete attachment (α = 1) [39]. We attributed this to
the temperature-dependent hydration of the layer, opening up previously unavailable sorp-
tion sites. Since the interaction between nC60 and environmentally relevant surfaces will
likely play a very important role in the fate and transport of nC60 throughout the environ-
ment [113], it is clear that more study is needed in order to understand what role attached
SOM layers will play.
The purpose of this study is to further the understanding of nC60 deposition behav-
ior in the presence of attached SOM layers. By varying the ionic strength of the system,
through both ion concentration and valence, while holding all other variables constant, the
deposition rate of nC60 is directly monitored using a QCM-D. Deposition rate and attach-
ment efficiency curves are then constructed over a range of ion concentrations and va-
lences. By comparing these curves between surfaces of bare silica and humic acid coated
silica, the role of ionic strength in nC60 deposition onto SOM layers is elucidated, dis-
cussed, and compared to DLVO theory. Combined with our previous work regarding the
role of SOM layer physicochemical properties [39], this study illustrates the importance of
attached SOM layers in the transport of nC60 and the need for a better quantitative under-
standing of its role. A better understanding of these interactions would lead to more precise
predictions on the potential pathways of exposure and their eventual impact on ecosystems
and human health.
48

3.2 Materials and Methods
3.2.1 Materials
Sublimed C60 powder (>99.9%) was purchased from MER Corporation (Tucson, AZ).
Dry Harpeth humic acid (HHA) was isolated as described in our previous publication [101].
Poly-L-lysine hydrobromide (PLL, P1274) and 4-(2-Hydroxyethyl)-1-piperazineethanesulfonic
acid (HEPES) were purchased from Sigma-Aldrich (St. Louis, MO). Reagent grade NaCl
(S671) and CaCl2 (C79) were purchased from Fisher Scientific (Pittsburgh, PA). Silica-
coated QCM-D sensors (QSX-303) were purchased from Q-Sense (Biolin Scientific, Stock-
holm, Sweden). 900 nm silica microspheres were purchased from Polysciences Inc (War-
rington, PA) as a surrogate for estimating the electrophoretic mobility of the silica sensor
surface. All solutions were prepared using ultra pure water purified by the Milli-Q Water
Purification System from Millipore (Billerica, MA).
3.2.2 Preparation of stock suspensions and solutions
The method used to produce the stock nC60 suspension in this study is similar to that
provided by Andrievsky et al. [102] and identical to that used in our previous publication
[39]. First, approximately 35 mg of C60 powder was dissolved in 30 mL toluene, forming
a clear, dark purple solution. Then, 5 mL of this mixture was introduced into a beaker
containing 50 mL deionized water, forming two distinct phases. This solution was then
sonicated (Fisher Sonic Dismembrator 300, Pittsburgh, PA) for more than 3 hours in a fume
hood to allow for evaporation of the toluene. The beaker was topped off with deionized
water every 20 minutes to account for the evaporated water. The resulting transparent,
brown-yellow liquid was filtered through 0.22 µm pore size membrane filter paper (Fisher,
GSWP02500), resulting in a clear, bright yellow liquid. This method was repeated a total
of 6 times to produce approximately 330 mL of nC60 stock suspension.
The resulting nC60 stock suspension was determined to have a total carbon content
49

(Shimadzu TOC-V CPH/CPN, Columbia, MD) of 33.6 mg L−1 and a pH of 5.6. The
nC60 stock suspension was stored in the dark at 4 °C for the entirety of the study and
all experiments took place within 4 months of preparation, during which time the nC60
stock suspension was stable as confirmed by periodic Dynamic Light Scattering (DLS)
measurements (Malvern Zetasizer Nano ZS, Worcestershire, UK).
50 mg of dry HHA was introduced into 400 mL deionized water and stirred for more
than 3 hours. During this time, the pH was adjusted drop wise with 0.1 N NaOH to a pH of
10.0 to allow the HHA to completely dissolve. After 3 hours and complete dissolution of
the HHA, the pH was adjusted drop wise with 0.1 N HCl down to a pH of 5.6 and filtered
through 0.22 µm pore size membrane filter paper. The stock solution was then diluted to
500 mL total volume to make for a concentration of 0.1 g/L HHA.
The HHA stock solution was kept in the dark for the entirety of the study, during which
time the solution was stable as confirmed by periodic DLS measurements. The HHA used
in this study has been extensively characterized by DeLapp et al. [101] and shown to un-
dergo thermal transitions at elevated temperatures. Due to the constant temperature of 25
°C employed throughout this study, however, no such transition behavior is expected. All
prepared solutions were filtered through 0.22 µm pore size membrane filter paper (Fisher,
GSWP02500) and pH adjusted to 5.6, so that all experiments could take place at the unad-
justed pH of the nC60 stock suspension.
3.2.3 nC60 aggregation kinetics
Since particle size can control the rate of diffusion, it is important to characterize the
aggregation of nC60 under all experimental conditions. By mixing measured amounts of
concentrated electrolyte and stock nC60 immediately before introduction into the DLS,
the nC60 particle size at each experimental condition can be monitored over time. The
nC60 concentration and pH were held constant at 6.1 mg L−1 and 5.6, respectively, for all
experiments throughout this study in order to remain consistent with other relevant studies
50

[61, 64, 66] and environmentally relevant conditions. The particle size was monitored
once per minute, with each point representing 10 independent measurements. In order to
calculate the aggregation attachment efficiency factor (αA) (Eq 3.1), the aggregation rate
for each experimental condition was normalized by the aggregation rate under diffusion
limited conditions. The aggregation rate under diffusion limited conditions was taken to be
the aggregation rate at which an increase in ionic strength did not result in an increase in
aggregation rate.
αA =dap/dt
(dap/dt)di f f limited(3.1)
3.2.4 Electrophoretic mobility measurements
In order to measure the electrophoretic mobility (EPM) of nC60 and silica under all ex-
perimental conditions, the DLS was used in combination with a universal dip cell (Malvern
ZEN1002, Worcestershire, UK). Each reported EPM value was the result of 10 independent
measurements. 900 nm silica micsospheres were used as a surrogate for the silica QCM-D
sensor surface. EPM values were measured at each experimental condition for uncoated,
PLL-coated, and HHA-coated silica particles. In order to coat the negatively charged silica
particles with HHA, they were first coated with positively charged PLL, rinsed with DI
water, and then coated with HHA. The silica particles were introduced into a 100 mg L−1
solution of PLL, stirred for 20 minutes, and then drained through a 0.45 µm pore size mem-
brane filter (Fisher, GSWP02500) while rinsing in DI water, allowing the unbound PLL to
pass through, leaving the coated silica particles behind. The process was then repeated
for an HHA coating. The uncoated silica particles were also taken through an identical
procedure without the addition of PLL or HHA, as a control. The silica concentration was
10 mg L−1 for all EPM measurements. Since the particle radius was much larger than the
Debye length at each experimental condition investigated in this work, zeta potentials were
estimated using the Smoluchowski approximation [114].
51

3.2.5 QCM-D experiments
The deposition rate of nC60 under varying experimental conditions was monitored using
a QCM-D (Q-Sense E4 unit, Biolin Scientific, Stockholm, Sweden). Flowrates were 0.1
mL min−1, ensuring laminar flow within the module, as confirmed by a Re of 0.26 (details
can be found in B). Temperature was held constant at 25 ± 0.02 °C by a Peltier element.
The nC60 concentration and pH were held constant at 6.1 mg L−1 and 5.6, respectively,
for all experiments throughout this study in order to remain consistent with other relevant
studies [61, 64, 66] and environmentally relevant conditions. Before each experiment,
the silica coated quartz sensors were soaked in a 2% Helmmanex II solution (Mullheim,
Germany) overnight, rinsed with copious amounts of DI water, dried with ultrapure N2 gas
and then cleaned in a UV-Ozone cleaner (Jelight 42, Irvine, CA) for 20 min. The QCM-
D experimental protocol is explained in detail below and a representative experimental
procedure is illustrated in Fig. 3.1.
For nC60 deposition experiments taking place on bare silica, the desired electrolyte
type and concentration was first flowed across the sensor surface until a stable baseline was
achieved. The signal was considered stable when the third overtone of frequency ( f3) failed
to drift more than 0.3 Hz over the course of 10 minutes. The nC60 stock was then diluted
to 6.05 mg/L with a measured amount of electrolyte to form the desired concentration and
immediately introduced into the measurement chamber. As the nC60 flowed across the
sensor surface, the first 120 seconds of the drop in frequency were used to calculate the
initial deposition rates for each set of experimental conditions.
For nC60 deposition experiments taking place on PLL or HHA surfaces, the surfaces
were first constructed using the following method. The initial baseline was collected in
a buffer solution consisting of 10 mM HEPES and 100 mM NaCl. Then, 2 mL of a 0.1
g/L PLL solution was introduced, containing the same HEPES and NaCl concentrations.
During this time, oppositely charged PLL attached rapidly to the surface, forming a pos-
itively charged layer. The PLL layer was then rinsed with 2 mL of the HEPES solution.
52

Figure 3.1: Representative nC60 deposition experiment. The initial baseline was collectedin HEPES solution (A) before PLL was attached to the silica surface and rinsed in HEPESsolution (B). The PLL layer was then rinsed in 1 mM NaCl (C) before HHA was attachedto the PLL surface and rinsed in 1 mM NaCl (D). Finally, the HHA layer was rinsed in theelectrolyte concentration at which the deposition experiment would take place (100 mMNaCl in this case) (E). Once a stable baseline was observed the nC60 was mixed with apremeasured volume of electrolyte to form the desired concentration (100 mM NaCl in thiscase) and immediately introduced onto the sensor surface (F).
53

If PLL was the terminal layer, then the nC60 deposition experiment proceeded from here,
as described previously. If not, the PLL layer was then rinsed with 2 mL of 1 mM NaCl,
followed by 2 mL of 0.1 g/L HHA. During this period, the negatively charged HHA at-
tached rapidly to the oppositely charged PLL layer, forming a second layer. After the HHA
layer was rinsed with 2 mL of 1 mM NaCl, the nC60 deposition experiment proceeded as
described previously.
3.2.6 nC60 deposition kinetics
A continuous increase in mass during deposition results in a continuous decrease in
frequency, as described by the Sauerbrey Relation [93], which can be seen in Eq. 3.2,
where m is the mass of material deposited, C is the crystal constant (17.7 ng cm−2Hz−1),
and fn is the frequency at overtone n.
∆m =−C1n
∆ fn (3.2)
In order to compare deposition rates under different experimental conditions, indepen-
dent of nC60 aggregation effects, the deposition attachment efficiency factor was calculated
(αD) as seen in Eq. 3.3. The initial change of the third overtone of frequency with respect
to time (d f3dt ) was calculated from the first 120 seconds of nC60 deposition. Since the nC60
particles are negatively charged at all experimental conditions examined (Fig. 3.2), any
particles that flow near the positively charged PLL-coated surface will attach, meaning the
deposition in this case is limited only by diffusive mass transport. Therefore, the diffusion
limited deposition rate ((
d f3dt
)di f f limited
) was taken to be the nC60 deposition rate onto the
PLL-coated surface at each corresponding experimental condition.
αD =d f3/dt
(d f3/dt)di f f limited(3.3)
54

Figure 3.2: The intensity weighted average hydrodynamic particle diameter and elec-trophoretic mobility of nC60 at each NaCl and CaCl2 concentration investigated. Errorbars represent standard deviation.
55

3.2.7 DLVO Interaction Energy Calculations
By assuming a sphere-plate interaction, Eq. 3.4 was used to calculate the van der Waals
attraction energy between nC60 and the coated or uncoated silica surface [103], where A is
the combined Hamaker constant for the nC60 water silica system (4.71 x 10⁻²¹ J) [64], a is
the radius of nC60 particles at a given electrolyte concentration (Fig. 3.2), h is the separation
distance between the nC60 particle and silica sensor surface, and λ is the characteristic
wavelength of interaction (usually assumed to be 100 nm) [104]. Mean values of particle
diameter and zeta potential are used in all DLVO calculations.
VA =−Aa6h
(1+
14hλ
)−1
(3.4)
Eq. 3.5 was used to calculate the electrical double layer repulsion energy between nC60
and the coated or uncoated silica surface [103], where ε0 is the dielectric permittivity in a
vacuum (8.85 x 10 −12 c2J−1m−1), εr is the relative dielectric permittivity of water (78.3),
ζp is the zeta potential of the nC60 particles at a given electrolyte concentration (Table
3.1), ζc is the zeta potential of the coated or uncoated silica surface at a given electrolyte
concentration (Fig. 5), and κ is the inverse Debye length.
VR = πε0εra{
2ζpζcln[
1+ exp(−κh)1− exp(−κh)
]+(ζ
2p +ζ
2c)
ln [1− exp(−2κh)]}
(3.5)
Eq. 3.6 was used to calculate the inverse Debye length for the electrolyte system, where
e is the elementary charge, n j is the number concentration of ions in the bulk solution, z j is
ion valence, k is the Boltzmann constant, and T is the absolute temperature.
κ =
√e2 ∑n jz2
j
ε0εrkT(3.6)
56

Table 3.1: nC60 zeta potential values for use in DLVO calculations, estimated from theelectrophoretic mobility values using the Smoluchowski approximation [114].
ElectrolyteConcentration
nC60 Electrophoretic Mobility(10−4cm2V−1s−1)
Zeta Potential(mV)
7 mM NaCl -3.43 -44.116 mM NaCl -3.36 -43.130 mM NaCl -2.70 -34.755 mM NaCl -2.80 -36.9
100 mM NaCl -2.37 -30.50.30 mM CaCl2 -1.30 -16.70.55 mM CaCl2 -1.55 -19.90.95 mM CaCl2 -1.52 -19.51.2 mM CaCl2 -1.35 -17.3
57

3.3 Results and Discussion
3.3.1 nC60 aggregation kinetics
Since the size of nC60 particles can affect their mass transport rate towards the sensor
surface and therefore control their deposition, it is important to first understand their ag-
gregation behavior. Presented in Fig. 3.3 are the aggregation attachment efficiency factors
(Eq. 3.1) for a range of NaCl (a) and CaCl2 (b) concentrations. As the ionic strength is
increased, the EDL repulsion becomes more suppressed and therefore the energy barrier
to aggregation is reduced, allowing the nC60 particles to aggregate more rapidly. When
the ionic strength becomes high enough, the EDL repulsion is reduced to zero, the energy
barrier to aggregation vanishes, and the aggregation rate is limited only by the diffusion
of particles towards each other. This concentration is known as the CCC [60]. Above the
CCC, αA values level off at 1, as can be seen in Fig. 3.3. By interpolation of the data in
Fig. 3.3 to find the point of intersection between the reaction limited and diffusion limited
regimes, the CCC was estimated as 217 mM NaCl (a) and 3.7 mM CaCl2 (b), illustrating
a much higher sensitivity to aggregation in the presence of the divalent cation Ca2+. The
ratio of CCC values derived here (3.7/217) is proportional to z−5.9, where z is the valence
of Ca2+. This is in very close agreement with the Schulze-Hardy rule which predicts a
value of z−6, [60] and much closer than the previously reported value of z−4.64 for nC60
[61], though it is worth noting that the properties of nC60 have been shown to be somewhat
dependent upon preparation method [67].
3.3.2 nC60 deposition kinetics
The initial deposition rate of nC60 onto the sensor surface was accompanied by a lin-
ear change in frequency (Fig. 3.1), suggesting continuous deposition on the clean sensor
surface with no ripening or detachment. The Voigt viscoelastic model [95] is typically
employed to estimate the mass and thickness of a viscoelastic film [94] such as nC60 in
58

Figure 3.3: nC60 aggregation attachment efficiency factors for a range of NaCl (a) andCaCl2 (b) concentrations. Each point consists of three measurements and error bars repre-sent standard deviation.
59

this study. Because of the limitations of the Voigt model, for example, it assumes a ho-
mogenous, uniform layer, the mass calculated includes water, and the density of the layer
is assumed and held constant, we chose to quantify deposition rate as the initial slope of
the third overtone of frequency.
The nC60 deposition rate as a function of NaCl (a) and CaCl2 (b) concentrations onto
three different surfaces can be seen in Fig. 3.4. The calculated Peclet number (Pe) for the
experiments in this study ranged from 7.94*10−8 to 4.34*10−7 (details can be found in B).
Pe describes the rate of convective mass transport to diffusive mass transport, therefore such
small values suggest diffusive mass transport dominates for all experimental conditions
investigated. Since nC60 is negatively charged over all experimental conditions investigated
(Fig. 3.2)), deposition onto the oppositely charged PLL surface is limited only by diffusion
of the particles towards the sensor surface and therefore the deposition onto PLL in Fig. 3.4
represents diffusion limited conditions. As NaCl concentration increases in Fig. 3.4(a), the
nC60 particle size increases (Fig. 3.3(a)) causing a decrease in diffusive mass transport and
a corresponding decrease in deposition for the PLL-coated trend, with the highest decrease
occurring as the NaCl concentration in Fig. 3.4(a) approaches the CCC. The PLL-coated
trend in the presence of CaCl2 (Fig. 3.4(b)) shows a small decrease throughout, without the
sharp decrease observed in Fig. 3.4(a), which can be explained by noticing that the highest
CaCl2 concentration in Fig. 3.4(b) is far from reaching the corresponding CCC for CaCl2
in Fig. 3.3(b).
As ionic strength increases, the EDL repulsion between the bare silica surface and nC60
is increasingly suppressed, lowering the energy barrier to deposition and therefore increas-
ing the deposition rate for the bare silica trend in Fig. 3.4. As ionic strength increases,
it eventually reaches a point where the energy barrier is completely suppressed, the de-
position is limited by diffusion alone, and the bare silica and PLL-coated trends coincide,
known as the critical deposition concentration (CDC). In this manner, the bare silica trend
in Fig. 3.4 represents the summation of the energy barrier reduction and particle aggrega-
60

Figure 3.4: nC60 deposition rates as a function of NaCl (a) and CaCl2 (b) concentrationsonto three different surfaces. Each point consists of three measurements and error barsrepresent standard deviation.
61

tion effects. At low NaCl and CaCl2 concentrations, an increase in ionic strength results
in a large reduction in the energy barrier, but only a small increase in nC60 particle size,
so the bare silica deposition trend increases rapidly. Conversely, at high concentrations of
NaCl and CaCl2 an increase in ionic strength results in a large increase in nC60 particle size
but no reduction in the energy barrier, since it is already reduced to zero, so the bare silica
deposition trend decreases (Fig. 3.4 (a)) or remains the same (Fig. 3.4 (b)). As explained
previously, the lack of a decrease in the bare silica trend in Fig. 3.4 (b) is likely due to the
CDC occurring at a CaCl2 concentration far from the CCC. At intermediate concentrations
of NaCl and CaCl2, the two effects offset and result in smaller changes to the bare silica
deposition trend.
3.3.3 Effect of humic acid layer
In order to elucidate the effect of the HHA coating, the deposition attachment efficiency
was calculated at every experimental condition (Eq. 3.3) and presented in Fig. 3.5. For both
cations investigated, the HHA coating enhanced nC60 attachment at low concentrations
and hindered attachment at high concentrations. The HHA coating raised the attachment
efficiency an order of magnitude for both of the lowest NaCl concentrations (Fig. 3.5
(a)) and the lowest CaCl2 concentration (Fig. 3.5 (b)). As the concentration increased
however, the HHA coating hindered attachment and raised the CDC to near 100 mM NaCl
(Fig. 3.5 (a)) or, in the case of CaCl2, failed to reach the CDC within the concentration
range investigated (Fig. 3.5 (b)). The presence of the HHA coating caused a hindering of
attachment for NaCl concentrations of 30 and 55 mM and CaCl2 concentrations of 0.95 and
1.2 mM. Quite clearly, this behavior deviates from the typical steric stabilization often seen
in the presence of DOM [49–52, 66] and further validates the variable nature observed in
other deposition studies of NOM coatings [39, 50, 64, 66]. In order to explain the observed
behavior of the HHA-coating, the electrophoretic mobility (EPM) of silica with and without
coatings of HHA was measured and presented in Fig. 3.6.
62

Figure 3.5: nC60 deposition attachment efficiency factors as a function of NaCl (a) andCaCl2 (b) concentrations onto bare and HHA-coated silica. Each point consists of threemeasurements and error bars represent standard deviation. Figure insets provide a moredetailed view of experimental values at high electrolyte concentrations, presented on anarithmetic scale.
63

Figure 3.6: Electrophoretic mobility measurements of 900 nm silica microspheres with andwithout coatings of HHA, as a function of NaCl and CaCl2 concentration. Each value wasthe result of 10 independent measurements and error bars represent standard deviation.
64

Figure 3.7: DLVO interaction energy profile of nC60 approaching a silica surface with andwithout a HHA coating in the presence of 7 (a) and 55 (b) mM NaCl.
The bare silica remains negatively charged throughout the concentration range investi-
gated (Fig. 3.6), as expected from reported zeta potential values of SiO2 thin films [115]
and silica sands [64]. Interestingly, however, the HHA coating reduced the surface charge
(closer to neutral) of the silica throughout all concentrations investigated, except for the
case of 100 mM NaCl, at which point the two values were statistically identical. A less
negatively charged (closer to neutral) surface would certainly provide less resistance to
nC60 deposition through a reduction in electrostatic repulsion, which is evident by the en-
hanced nC60 attachment at low NaCl and CaCl2 concentrations (Fig. 3.5). If this were
the only contributing effect, however, enhanced attachment would continue throughout the
entire range of concentrations investigated, instead of hindering nC60 attachment at higher
concentrations, as observed in Fig. 3.5. In order to further understand the complex inter-
actions taking place in this system, a DLVO interaction energy profile was calculated for a
100 nm nC60 particle approaching a silica surface with and without a coating of HHA, with
properties matching the nC60 (Fig. 3.2 and Table 3.1), silica (Fig. 3.6), and HHA coating
(Fig. 3.6) measured in this study.
In the presence of 7 mM NaCl, the DLVO interaction energy curve predicts a much
lower energy barrier to nC60 deposition when the silica surface is coated with HHA (Fig.
3.7 (a)) as observed in Fig. 3.5 (a). At a concentration of 55 mM NaCl (Fig. 3.7 (b))
65

DLVO predicts a much larger EDL screening effect and therefore the energy barrier to
nC60 deposition is much lower for both cases, bare silica and HHA-coated silica. In the
presence of 55 mM NaCl, the energy barrier to nC60 deposition is still slightly smaller
onto the HHA-coated silica, due to a reduction in surface charge. The significance of
this difference, however, is much lower since the energy barrier has nearly disappeared at
the increased NaCl concentration. Since DLVO does not correctly predict the attachment
hindering behavior of the HHA coating at increased NaCl and CaCl2 concentrations, a
non-DLVO force is likely contributing.
The structure of immobilized macromolecules has been shown to depend on ionic
strength [116, 117] and, in particular, NOM layers have been shown to condense with
increased ionic strength [66, 118]. At increased NaCl and CaCl2 concentrations, the HHA
layer compacts and has a more condensed, less extended (smoother) surface with reduced
potential for nC60 particle entanglement, effectively lowering attachment efficiency (Fig.
3.5). Furthermore, the compaction of the HHA layer may reduce the amount of available
hydrophobic regions for nC60 attachment, contributing to the reduction in attachment effi-
ciency. This finding is in agreement with two studies which have reported a reduction in
nC60 attachment due to the compaction of alginate [66] and humic acid [39] layers.
66

3.4 Conclusions
In this study, we have shown that the presence of a HHA coating can both hinder and
enhance nC60 attachment onto a silica surface, depending on solution chemistry. At low
electrolyte concentrations, the HHA coating enhances nC60 attachment for both mono and
divalent cations. By lowering the surface potential of the silica surface, the HHA coating
significantly reduces the energy barrier to nC60 deposition. As electrolyte concentration
rises, the HHA coating eventually results in a hindering of attachment for both mono and
divalent cations. Though still lowering the surface potential of silica, the HHA coating
doesn’t significantly lower the energy barrier to deposition at these elevated electrolyte
concentrations, due to the significant suppression of EDL repulsion resulting in a near zero
energy barrier to nC60 deposition. Furthermore, the structure of the HHA coating likely
condenses at elevated electrolyte concentration, leading to a more compact and smoother
surface with less potential for nC60 particle entanglement, contributing to the observed
reduction in attachment efficiency. Because of the aforementioned reasons, we hypothesize
that the summation of two contributing forces are responsible for the observed trend in nC60
attachment onto HHA-coated silica: (1) the reduction in electrostatic repulsion due to the
HHA-coating and (2) HHA layer compaction at increased NaCl and CaCl2 concentrations.
Based on the findings presented in this study and our recent work [39], attached SOM
layers play a complex role in the deposition behavior of nC60. If similar contributions exist
for other types of ENMs, SOM will play a major role in determining the environmental
fate and transport of ENMs. Fully understanding the contributions from SOM may prove
crucial to predicting potential pathways of exposure and their impact on ecosystems and
human health.
67

Chapter 4
The attachment of colloidal particles to environmentally relevant surfaces and the effect of
particle shape
4.1 Introduction
Colloidal transport through the subsurface environment is a topic of great importance
and intense study to the field of environmental engineering. Seemingly immobile toxins
can attach to the surface of mobile colloids and be readily transported through the subsur-
face, greatly enhancing their risk to ecosystems and human health, or in some cases, the
colloid itself is the toxin of concern [119]. Many natural colloids are nonspherical in shape,
including plate and rod shaped clay [68], various bacterial shapes (e.g. ellipsoid, ovoid, and
rod shaped) [69, 70], and some engineered nanomaterials (e.g. carbon nanotubes) which
exhibit an aquatic toxic potential [3]. Despite the ubiquity of nonspherical colloids, only
a limited number of studies have focused on the role of shape with regard to colloidal
transport [71, 72, 74, 75, 120].
Aside from advection, dispersion, and diffusion, colloidal transport also depends on
the kinetic rate at which particles attach to soil and grain surfaces with which they col-
lide. Since most of the aforementioned studies exclusively employ column experiments,
the mechanisms behind the particle-surface attachment cannot be isolated. To date, only
one study has attempted to isolate the role of shape on particle deposition. Seymour et al.
[71] reported a much higher deposition rate of spherical carboxylate-modified polystyrene
particles as compared to 2:1 and 4:1 stretched versions of the same particles. These ex-
periments, however, were conducted under favorable conditions (i.e. a positively charged,
PLL-coated silica surface), lacking an energy barrier to deposition and limiting the envi-
ronmental relevance of the findings. No study to date has investigated the role of shape on
colloidal particle attachment to environmentally relevant surfaces.
68

Derjaguin-Landau-Verwey-Overbeek (DLVO) theory [58, 59] describes the attractive
and repulsive forces between a colloidal particle and a surface. Several studies have inves-
tigated the attachment of colloidal particles to bare mineral surfaces in simple electrolyte
solutions [61, 63, 65, 66, 104, 121, 122] and the results appear to be in good qualitative
agreement with DLVO theory. The attachment deviates significantly from DLVO theory,
however, in the presence of natural organic matter (NOM), whether dissolved in solution
[64, 66, 104, 123, 124] or coated onto the depositional surface [39, 63, 64, 66, 80, 104, 124,
125]. When dissolved in solution, NOM adsorbs to the surface of colloidal particles and
typically limits their deposition through steric hindrance, a force not considered by DLVO
theory. When the depositional surfaces are pre-coated with NOM, however, the results
tend to be much more complex. Pre-coating silica surfaces with various NOM have been
shown to hinder, enhance, or have no effect on attachment, depending on the type of NOM
[39, 66], ionic strength of solution [63, 64, 66], and temperature [39]. Chen and Elimelech
[66] reported that an alginate layer enhanced nC60 attachment in the presence of 10 mM
NaCl, while hindering it in the presence of 30 mM NaCl. The variable nature was attributed
to the alginate layer’s compaction at higher NaCl concentrations, resulting in a smoother,
more rigid layer, with less room for nC60 particle entanglement. In our recent work [39],
we reported that increasing the temperature of a humic acid layer while holding all other
variables constant, raised the attachment efficiency of nC60 from low attachment (α = 0.3)
to complete attachment (α = 1). We attributed this to the temperature-dependent hydration
of the layer, opening up previously unavailable sorption sites. Quite clearly, more research
is needed into the effect of NOM coatings on colloidal particle attachment.
The purpose of this study is to isolate the role of shape on the attachment of colloidal
particles to environmentally relevant surfaces by combining quartz crystal microbalance
with dissipation monitoring (QCM-D), atomic force microscopy (AFM), and dynamic light
scattering (DLS) experiments. For the first time, we present attachment efficiency curves
for colloidal particles onto NOM coated silica surfaces, as a function of particle shape and
69

ionic strength. By comparing the attachment results with DLS surface measurements and
AFM topography images, we elucidate and discuss the mechanisms driving the complex
attachment behavior observed. The results presented here suggest that colloidal particle
shape will play an important role in predicting transport, especially in the presence of
NOM. A better understanding of the role of shape in the attachment of colloidal particles
to environmentally relevant surfaces will lead to a more accurate prediction of colloidal
particle transport, aiding in risk assessment of potential exposure pathways.
70

4.2 Materials and Methods
4.2.1 Materials
200 nm carboxylate-modified polystyrene (PS) spheres were purchased from Phos-
phorex (107, Hopkinton, MA). Dry Harpeth humic acid (HHA) was isolated and char-
acterized as described in our previous publication [101]. Alginic acid sodium salt (al-
ginate, A2158), poly-L-lysine hydrobromide (PLL, P1274), and 4-(2-Hydroxyethyl)-1-
piperazineethanesulfonic acid (HEPES) were purchased from Sigma-Aldrich (St. Louis,
MO). Reagent grade NaCl (S671) was purchased from Fisher Scientific (Pittsburgh, PA).
Silica-coated QCM-D sensors (QSX-303) were purchased from Q-Sense (Biolin Scientific,
Stockholm, Sweden). 900 nm silica microspheres were purchased from Polysciences Inc
(Warrington, PA) as a surrogate for estimating the electrophoretic mobility of the silica
sensor surface. All solutions were prepared using ultra pure water purified by the Milli-Q
Water Purification System from Millipore (Billerica, MA).
4.2.2 Preparation of stretched PS particles
The method described here is based on a procedure previously published by Champion
et al. [126]. First, 10% (wt/vol) polyvinyl alcohol (PVA, Sigma-Aldrich) solution was
introduced into 80 °C Milli-Q water, and stirred for 30 minutes to achieve complete disso-
lution of PVA. 100 mg glycerol (Sigma-Aldrich) and 2.5 mL of 1% solid content (0.0625%
(wt/vol) particle/water) PS spheres were added to the PVA solution. The solution mixture
was then poured onto a 12 x 12 cm clean film plate and was set to dry for 24 hours to form
a thin film. The film was then cut into four pieces and subsequently placed in a stretching
apparatus (Fig. 4.1). The stretching apparatus was submerged in a 125 °C mineral oil bath
for 5 minutes and stretched to a 2:1 ratio. This temperature is close to the glass transition
temperature of polystyrene particles, which allows the particles to stretch to the desired
ratio. The stretched film was then cooled to room temperature and cut from the apparatus.
71

Figure 4.1: Diagram of the particle stretching apparatus before (a) and after (b) stretching.
After being cleaned by 100% isopropyl alcohol (IPA) for at least two hours, the film was
dissolved in 70 °C water for several hours. Finally, the stretched PS particles were cleaned
with IPA and extracted using a series of centrifugation (Eppendorf Centrifuge 5840R).
In order to determine the concentration of the stretched particles, a calibration curve
was constructed using known concentrations of stock PS particles and UV-vis spectropho-
tomemtry (NanoDrop 2000 Thermo Scientific, Wilmington, DE). The stock stretched PS
suspension was determined to have a concentration of 129 mg L−1.
72

4.2.3 Preparation of HHA solution
In order to prepare the HHA solution, 50 mg dry HHA was introduced into 400 mL
deionized water and stirred for more than 3 hours. During this time, the pH was adjusted
drop wise with 0.1 N NaOH to a pH of 10.0 to allow the HHA to dissolve. After nearly
complete dissolution of the HHA, the pH was adjusted drop wise with HCl down to 7.0. The
alginate stock solution was prepared by stirring 50 mg dry alginate in 400 mL deionized
water overnight, after which time the alginate was adjusted drop wise with 0.1 N NaOH to
a pH of 7.0. Both HHA and alginate stock solutions were filtered through 0.22 µm pore
size membrane filter paper (Fisher, GSWP02500) and kept in the dark for the entirety of
the study, during which time they remained stable to aggregation as confirmed by periodic
DLS measurements. The resulting HHA and alginate stock solutions were determined to
have a total carbon content (Shimadzu TOC-V CPH/CPN, Columbia, MD) of 110 and 102
mg L−1, respectively.
All prepared electrolyte solutions were filtered through a 0.22 µm pore size membrane
filter paper and pH adjusted so that all attachment experiments could take place at a pH of
7.0.
4.2.4 Characterization measurements
Because particle size can control diffusion rate, DLS (Malvern Zetasizer Nano ZS,
Worcestershire, UK) was utilized to measure the size of spherical PS particles at each ex-
perimental condition investigated. Five independent runs at 1 minute each were performed
for each particle size measurement, with each resulting data point consisting of 5 indepen-
dent measurements.
Image J software was used to measure the length of major and secondary axes of the
stretched PS particles. Figs. A.3, A.4, and A.5 show the distribution of major and minor
axis of the stretched PS particles and their ratio based on the Image J measurement of
73

100 particles. Additional shape related parameters including averaged ellipticity, effective
diameter, and surface area are provided in Tab. 4.1. The method for calculating these values
is summarized in A.3.
Electrophoretic mobility (EPM) measurements were conducted for the spherical and
stretched PS particles at each experimental condition by DLS in conjunction with a univer-
sal dip cell (Malvern ZEN1002, Worcestershire, UK). Each reported value of EPM was the
result of 10 independent measurements. In order to estimate the EPM values of the silica
depositional surfaces utilized in this study, 900 nm silica microspheres were used as a surro-
gate. EPM values were measured for uncoated, HHA-coated, and alginate-coated silica at
each experimental condition. In order to coat the silica microspheres, they were first intro-
duced into a 100 mg L−1 solution of PLL, stirred for 20 minutes and then drained through
0.45 µm pore size membrane filter paper (Fisher, GSWP02500) while being rinsed with
DI water, allowing all unbound PLL to pass through, but leaving the positively charged,
PLL-coated silica particles behind. The process was then repeated for a HHA or alginate
coating. All EPM measurements were conducted at a silica concentration of 10 mg L−1.
Since the particle radius was much larger than the Debye length at each experimental con-
dition investigated in this work, zeta potentials were estimated using the Smoluchowski
approximation [114].
4.2.5 Attachment experiments
The deposition rate of spherical or stretched PS was monitored using a QCM-D (Q-
Sense E4 unit, Biolin Scientific, Stockholm, Sweden) under varying experimental condi-
tions. Flowrates were held constant at 0.1 mL min−1, resulting in laminar flow within the
module as confirmed by a Reynolds Number of 0.26. PS particle concentration and pH
was held constant at 6 mg L−1 and 7, respectively, in order simulate environmentally rel-
evant conditions. All experiments took place at a temperature of 20 °C, which was held
constant by a Peltier element. The QCM-D sensor cleaning protocol is as follows. Before
74

each experiment, the silica QCM-D sensors were soaked in a 2% Hellmanex II solution
(Hellma Analytics, Mullheim, Germany) overnight, rinsed in DI water, and dried in ultra-
pure N2. The sensors were then cleaned in a UV-Ozone cleaner (Jelight 42, Irvine, CA) for
20 minutes immediately before being loaded into the QCM-D.
A representative QCM-D experiment can be seen in Fig. 4.2, with a detailed experi-
mental protocol as follows. A baseline was first collected in a HEPES solution (10 mM
HEPES, 100 mM NaCL). The signal was considered stable when the third overtone of fre-
quency ( f3) failed to drift more than 0.3 Hz over the course of 10 minutes. Then, a layer of
positively charged PLL was constructed on the silica surface by flowing a solution of 0.1
g L−1 PLL, 10 mM HEPES, and 100 mM NaCl until the signal stabilized. The PLL layer
was then washed in the HEPES solution to remove any unbound PLL from the surface. A
1 mM NaCl solution was then introduced until a stable signal was reached, followed by a
0.1 g L−1 HHA or alginate solution containing 1 mM NaCl. The negatively charged HHA
or alginate readily adsorbed to the oppositely charge PLL surface, forming a second layer.
Once the signal stabilized, the HHA or alginate layer was washed in 1 mM NaCl to remove
any unbound particles and then a solution of the ionic strength of interest was introduced.
Once the signal stabilized, the stock suspension of spherical or stretched PS was diluted to
6 mg L−1 with a measured amount of concentrated NaCl solution to form the same ionic
strength and then immediately introduced into the measurement chamber. As the PS sus-
pension flowed across the sensor surface, the first 120 seconds of the drop in frequency
were used to calculate the initial deposition rates for each set of experimental conditions.
As particles attach to the sensor surface, mass increases, corresponding to a continuous
decrease in frequency, as described in the Sauerbrey relation [93]. The Sauerbrey relation
can be seen in Eq. 4.1, where m is the mass deposited, C is the crystal constant (17.7 ng
cm−2 Hz−1) and fn is the frequency at overtone n.
∆m =−C1n
∆ fn (4.1)
75

Figure 4.2: Representative attachment experiment. A baseline is collected in HEPES (A)before PLL is adsorbed to the surface (B), followed by a rinse in HEPES (C). 1 mM NaClis introduced (D) before HHA or alginate is adsorbed to the surface (E) and rinsed with 1mM NaCl (F). Finally, the ionic strength of interest is introduced (G) and once a baselineis reached, stretched or spherical PS particles are introduced in a solution of the same ionicstrength (H).
In order to compare the particle attachment between varying ionic strengths indepen-
dent of aggregation and diffusion effects, the deposition attachment efficiency (α) was
calculated from Eq. 4.2, where d f3/dt is the initial deposition rate of the third overtone of
frequency calculated from the first 120 seconds of frequency drop and (d f3/dt)di f f limited is
the diffusion limited deposition rate, under identical experimental conditions. The diffu-
sion limited deposition rate was measured by flowing the PS particles over the PLL layer
at each experimental condition investigated. Since the PS particles are negatively charged
and the PLL layer is positively charged, there is no energy barrier to deposition and any PS
particles that flow near the PLL surface will attach, therefore the deposition is limited only
76

by diffusion of the PS particles to the sensor surface.
α =d f3/dt
(d f3/dt)di f f limited(4.2)
4.2.6 AFM images
A Bruker Dimension Icon AFM (Billerica, MA) was used to image the HHA and algi-
nate surfaces. The HHA or alginate layer was constructed as described in the experimental
procedure, carefully removed from the QCM-D, dried in N2, and loaded into the AFM for
imaging. The AFM was operated in tapping mode, using a silicon cantilever. The nominal
tip characteristics were 8 nm radius of curvature, 40 N/m spring constant, and 300 kHz
resonant frequency.
4.2.7 DLVO interaction energy calculations
Eq. 4.3 [103] was used to calculate the van der Waals attraction between spherical
or stretched PS and HHA or alginate surface. A is the combined Hamaker constant (4.71
x 10−21 J), a is the particle radius (for stretched particles, the average of the major and
minor axis was used), h is the separation distance, and λ is the characteristic wavelength
of interaction (usually taken to be 100 nm). Mean values of particle diameter and zeta
potential were used in all DLVO calculations.
VA =−Aa6h
(1+
14hλ
)−1
(4.3)
Eq. 4.4 [103] was used to calculate the electrical double layer repulsion between spheri-
cal or stretched PS and HHA or alginate surface. ε0 is the dielectric permitivity in a vacuum
(8.85 x 10 −12 c2J−1m−1), εr is the relative dielectric permittivity of water (80.1), ζp is the
zeta potential of the PS particles at a given electrolyte concentration, ζc is the zeta potential
of the HHA or alginate surface at a given electrolyte concentration, and κ is the inverse
77

Debye length. Since the particle radius was much larger than the Debye length at each
experimental condition investigated in this work, zeta potentials were estimated using the
Smoluchowski approximation [114].
VR = πε0εra{
2ζpζcln[
1+ exp(−κh)1− exp(−κh)
]+(ζ
2p +ζ
2c)
ln [1− exp(−2κh)]}
(4.4)
Eq. 4.5 was used to calculate the inverse Debye length. e is the elementary charge, n j is
the number concentration of ions in the bulk solution, z j is ion valence, k is the Boltzmann
constant, and T is the absolute temperature.
κ =
√e2 ∑n jz2
j
ε0εrkT(4.5)
78

Figure 4.3: Representative SEM images of spherical (A) and stretched (B) PS particles.
Table 4.1: Detailed characteristics of spherical and stretched PS particles.
Particle Characteristic Spherical (Unstretched) PSParticles
Sretched (2:1) PSParticles
Major axis diameter(nm)
208±3 278±13
Minor axis diameter(nm)
190±3 175±5
Ellipticity 0.37±0.04 0.72±0.03Surface area (µm2) 0.120±0.003 0.138±0.008
4.3 Results and Discussion
4.3.1 Particle and surface characterization
Spherical and stretched PS particles were investigated by SEM (Hitachi S4700) and
representative images can be seen in Fig. 4.3a and 4.3b, respectively. SEM images of
the stretched PS particles were used to quantify the shape of the particles using Image J
software. Major axis diameter, minor axis diameter, ratio of axis diameters, ellipticity,
surface area, and effective diameter were all estimated for both the spherical and stretched
PS particles. A summary of the shape quantification can be seen in Tab. 4.1, with details
provided in A.3. After stretching, the major to minor axis ratio was raised from 1:1 to 1.6:1
and the ellipticity was nearly doubled.
The diameter of spherical PS and EPM of spherical and stretched PS were measured as
79

Figure 4.4: EPM measurements of spherical and stretched PS and particle diameter ofspherical PS. The control value refers to spherical PS which were exposed to an identicalexperimental routine as the stretched PS, without being stretched. Each value was the resultof 10 independent measurements and error bars represent standard deviation.
a function of ionic strength and can be seen in Fig. 4.4. The spherical PS particle diameter
was as expected, based on the nominal 200 nm particle size reported by the manufacturer.
The spherical PS diameter remained constant over the ionic strength range investigated,
suggesting there was no significant aggregation of the particles.
Both spherical and stretched PS were negatively charged, with the stretched PS carrying
a smaller charge (closer to neutral) throughout the entire ionic strength range investigated.
Several previous studies have reported a change in EPM between spherical and stretched
particles [71, 74, 127–129]. One such study [71], using identical particles to those used
here, reported that the EPM of PS particles decreased (closer to neutral) as aspect ratio
increased, therefore the sensitivity of EPM to aspect ratio reported here is consistent with
80

previous studies. The sensitivity of EPM to aspect ratio could be a result of altered charge
density due to a change in surface area, or an altered surface due to residual chemicals
from the particle stretching process. In order to evaluate which of these possible con-
tributors had a larger effect, a control group of spherical particles was taken through an
identical stretching procedure without being stretched, exposing the control group to all
the same chemicals. As can be seen in Fig. 4.4, the EPM of the control particles remained
statistically identical to that of the spherical PS particles, similar to the reported control in
the aforementioned study [71]. This suggests that an altered charge density of the stretched
particles is the main contributor to the EPM sensitivity to aspect ratio observed here and
elsewhere. The same control group was also used in attachment experiments, to further
validate this finding.
The EPM of each depositional surface was also measured and reported in Fig. 4.5.
Each surface was negatively charged throughout the ionic strength range investigated and
the EPM of the HHA and alginate surfaces were statistically identical at each ionic strength.
These findings are in agreement with previous reports for silica surfaces coated with similar
NOM [39, 64]. We observed a positive charge for PLL-coated silica, validating it’s use to
obtain the deposition rate of negatively charged spherical and stretched PS under diffusion-
limited conditions (Eq. 4.2).
4.3.2 Attachment experiments
For the first time, we report the attachment efficiency of spherical and stretched PS
particles onto HHA and alginate coated silica surfaces as a function of ionic strength in
Fig. 4.6. In the presence of the HHA coated silica surface, we observed a higher attach-
ment of spherical than stretched PS at low ionic strengths. At a NaCl concentration of 100
mM, we observed similar attachment values for spherical and stretched PS and above 100
mM NaCl, we observed a higher attachment of stretched than spherical PS. The attachment
of the control particles, which were exposed to all the same chemicals as the stretched
81

Figure 4.5: EPM measurements of each depositional surface as a function of ionic strength.Each value was the result of 10 independent measurements and error bars represent stan-dard deviation.
82

particles without being stretched, didn’t deviate from the attachment of the spherical PS.
This confirms that the observed differences in attachment between spherical and stretched
particles are due to the differences in particle shape, rather than a surface alteration as a
result of exposure to the chemicals required in the stretching procedure. This finding is
in agreement with a previous study [71] which reported similar deposition rates between
spherical PS and control particles, despite observing differences for stretched PS. Attach-
ment of spherical and stretched PS onto the alginate coated silica surface, however, were
statistically identical for all ionic strengths investigated, except for a small deviation at 30
mM NaCl.
According to DLVO theory, as ionic strength increases, the electrical double layer re-
pulsion between the negatively charged PS and NOM coated surfaces (Figs. 4.4 and 4.5, re-
spectively) is suppressed and the energy barrier to deposition is decreased. At high enough
ionic strength, the energy barrier to deposition vanishes and the particle deposition is only
limited by diffusion, meaning at and above this concentration, the attachment efficiency is
equal to 1. The attachment of stretched and spherical PS onto alginate (Fig. 4.6b) is lowest
at the lowest ionic strength, gradually increases with increasing ionic strength, and equals
1 at and above 100 mM NaCl, therefore these trends are in good qualitative agreement with
DLVO theory.
The attachment of stretched PS onto HHA (Fig. 4.6a) follows a similar trend, again as
predicted by DLVO theory. The attachment of spherical PS onto HHA, however, deviates
significantly from the predicted trend. Total DLVO interaction energy was calculated for
stretched and spherical PS onto both NOM surfaces at each ionic strength. The interaction
energy profiles for spherical and stretched PS onto HHA are presented in Fig. 4.7 in the
presence of 16 (a) and 200 (b) mM NaCl. At 16 mM NaCl, the predicted energy barrier
to deposition for spherical PS is much larger than that of stretched PS, which is in contra-
diction with the observed attachment at the same experimental condition (Fig. 4.6a). The
calculated energy barrier to deposition at 200 mM NaCl, while somewhat diminished, does
83

Figure 4.6: Attachment efficiency of spherical and stretched PS particles onto HHA (a) andalginate (b) coated silica surfaces as a function of ionic strength. Each value was the resultof at least 4 independent measurements and error bars represent standard deviation.
84

Figure 4.7: Calculated DLVO interaction energy for the deposition of spherical andstretched PS onto HHA in the presence of 16 (a) and 200 (b) mM NaCl.
in fact correctly predict the relative values of attachment at this condition. Since DLVO
theory fails to correctly predict attachment at low ionic strength onto HHA, a non-DLVO
force is most likely contributing.
4.3.3 Mechanistic insights
Both HHA and alginate layers were explored using AFM and representative images are
reported in Fig. 4.8 a and b, respectively. The topography of the HHA surface is very het-
erogeneous, with large peaks extended from the surface, and a higher relative roughness.
The topography of the alginate surface is smoother, with much fewer peaks extending from
the surface relative to HHA. The rougher, more extended surface of the HHA layer pos-
sesses more voids than the alginate layer, and therefore an increased potential for particle
entanglement. The smaller size of the spherical PS particles allow for entanglement in these
relatively small voids, while the nearly doubled major axis diameter of the stretched PS hin-
der particle entanglement. Furthermore, investigation by the Voigt viscoelastic model [95]
estimates that the mass of the HHA layer is more than 5 times larger than the mass of the
alginate layer (Fig. 4.9). This also suggests that the HHA layer provides a much larger
85

Figure 4.8: Representative AFM images of HHA (a) and alginate (b) coated silica surfaces.
mesh for particle entanglement. These findings are in agreement with two previous studies
which reported increased attachment of spherical nC60 onto NOM coated surfaces in the
presence of low ionic strength solutions [39, 66]. Particle entanglement, in this manner, is
not considered in DLVO theory, and is therefore likely the main contributor to the observed
deviation from DLVO theory at low ionic strength.
Immobilized macromolecule structure has been reported to depend heavily on the ionic
strength of solution [116, 117]. Furthermore, NOM layers have been reported to condense
in the presence of high ionic strength solutions [61, 66]. As ionic strength increases, the
HHA layer condenses, likely induced by increased inter- and intra-molecular crosslinks,
forming a smoother, less extended surface with fewer voids for particle entanglement.
Since the condensed surface has a lower potential for particle entanglement, the particle
86

Figure 4.9: The mass of HHA and alginate layers as estimated by the Voigt viscoelasticmodel, plotted against the relative frequency of deposition.
87

entanglement effect seen at low ionic strength diminishes and DLVO forces dominate at
high ionic strength. Since the size and shape of the spherical PS particles provide them no
increased potential for attachment on the smoother surface, the reduced energy barrier to
deposition (Fig. 4.7) allows the stretched PS to attach more readily than the spherical PS.
Two previous studies have reported reduced attachment of spherical particles onto NOM
layers as ionic strength increased [39, 66], however none have yet illustrated the depen-
dency on aspect ratio reported in this study.
88

4.4 Conclusions
In this study, we showed that the attachment of colloidal particles onto NOM-coated
surfaces can be greatly affected by the shape of the particles, depending on ionic strength
and the type of NOM coating. In the presence of the alginate surface, the attachment of
both spherical and stretched PS qualitatively agreed with DLVO theory. In the presence
of the HHA surface, however, deviations from DLVO theory were observed. At low ionic
strengths, spherical PS attached to HHA at a much higher rate than stretched PS. This de-
viation from DLVO theory can be explained by the increased surface heterogeneity and
roughness observed for the HHA surface. More voids present in the HHA layer allows for
a higher potential of spherical PS particle entanglement, while the enlarged major axis of
the stretched particles hinder their ability to become entangled in the extended HHA sur-
face. As ionic strength increases, the HHA layer condenses and the potential for spherical
particle entanglement is reduced. At high ionic strengths, the HHA layer condenses to a
point where DLVO forces dominate and the stretched particles attach at a higher rate than
spherical particles, due to a reduced energy barrier to deposition.
Complex interactions exist between colloidal particles and environmentally relevant
surfaces and, based on the findings presented in this study, it is clear that the shape of col-
loidal particles can play a major role in such interactions. If similarly complex interactions
exist for other types of environmentally relevant surfaces, particle shape may greatly affect
the environmental fate and transport of colloidal particles. A complete understanding of the
role of particle shape will improve the accuracy of colloidal particle transport predictions,
aiding in the assessment of risk and potential exposure pathways.
89

Chapter 5
Predicting particle attachment efficiency from physicochemical characteristics: a machine
learning approach
5.1 Introduction
The work presented in this chapter is part of a collaborative effort [130] and is presented
here with permission from the co-authors. Environmental applications of engineered nano-
materials (ENMs) have tremendous potential to enhance remediation of pollutants in the
subsurface, to improve sustainability of nano-formulated plant protection products in com-
parison to traditional pesticides, and to improve nano-based plant nutrient delivery [131–
133]. However, the increased production of ENMs, coupled with their apparent aquatic
toxicity, [3, 9, 10] raise serious concerns about the fate and transport of these materials in
the environment.
Our understanding of ENM transport in the subsurface is far from complete. Similar to
larger, colloidal particles, the transport behavior of ENMs in the subsurface environment
is a function of numerous deposition processes, which are controlled by a complex system
of physical and chemical factors [56]. Despite numerous qualitative investigations that
examine the influence of physical chemical factors on ENM transport [39, 61, 63–66, 81,
82, 104, 116, 121, 122, 124], relatively few quantitative insights have been gained. One
contributing factor for the slow rate of progress is that it is not yet possible to identify and
separate natural nanomaterials from engineered nanomaterials in complex environmental
matrices [134]. As a result, investigation of ENM transport, particularly for high production
volume nanomaterials (e.g., TiO2 and ZnO), is limited to examination in simple, artificial
soil systems. Another critical factor is that ENM transport is primarily investigated through
experimentation with soil columns. Soil columns have been in use for more than 130 years
and are the foundation for most fluid dynamics, but are too coarse to sufficiently understand
90

nano-scale processes. While advanced imaging techniques, such as high-resolution X-ray
computed tomography of soil columns, enable non-destructive transport characterization,
the scanning resolution is typically between 0.84µm – 4.4µm, which is too large to resolve
ENMs, which are by definition less than 100 nm [135].
Quartz crystal microbalance with dissipation monitoring (QCM-D) enables real-time
monitoring of nanoscale mass deposition. QCM-D monitors the deposition rate of particles
onto an oscillating sensor surface, isolating deposition kinetics, and allowing for a direct
measure of attachment efficiency (α) without contributions from convection or filtration,
unlike traditional soil column experiments. α is an important kinetic transport parameter
and is widely used in colloid filtration theory (CFT) to quantify the likelihood of a particle
attaching to a surface after a collision. It is important to note that several closed-form
correlations have been developed to predict α [136–140], although none explicitly consider
the physicochemical conditions which have been reported to affect the value of α , including
ionic strength [61, 63, 65, 66, 81, 104, 121, 122], pH [122–124], charge of particle and
collector surface [39, 61, 63–66, 80, 104, 121–125], presence of organic matter, whether
dissolved in solution [64, 66, 104, 123, 124] or coating the collector surface [39, 63, 64,
66, 80, 104, 124, 125], temperature [39], and particle shape [71, 82]. Furthermore, while
the qualitative influence of these conditions on α has been well studied and, in some cases,
reasonable mechanistic explanations are provided (e.g., agreement or disagreement with
Derjaguin-Landau-Verwey-Overbeek (DLVO) theory [58, 59]), a predictive model of α
that explicitly considers these conditions has not yet been developed.
Machine learning allows us to develop empirical models from complex systems where
the underlying relationships between the data are too complex to develop by hand [83].
Machine learning has been successfully applied to a wide range of complex problems,
including speech and computer vision, self driving cars, search engines, and medical di-
agnoses [84–87]. In two recent studies [88, 89], machine learning was applied to predict
the toxicity and biological impacts of ENMs, based explicitly on the molecular properties
91

of the nanomaterial. Despite the successes of machine learning in a wide range of appli-
cations, it has not been applied to the complex task of modeling environmental transport
until very recently. A very recent study by Goldberg et al. [90] employed ensemble ma-
chine learning (random forest) regression and classification to predict the retained fraction
(RF; the fraction of materials retained during a soil column experiment in comparison to
the total mass of materials injected into the column) and shape of retention profile (RP) us-
ing a database of more than 200 nanomaterial column transport experiments amassed from
published literature. Goldberg et al. [90] reported that their model was able to predict the
RF with a mean squared error between 0.025–0.033, and the RP with an expected F1-score
(the weighted harmonic mean of precision and recall) between 60–70%. Further, by recur-
sively removing physical and chemical features to optimize model predictive performance,
the authors were able to rank the importance of the physicochemical state features (e.g.,
pH, ionic strength, nanomaterial type, etc.) to ENM transport.
The high variability in reported α values under seemingly similar experimental condi-
tions is one reason why these data have not yet been successfully modeled. For example,
the presence of an attached layer of natural organic matter (NOM) has been reported to
hinder, enhance, or have no effect on α under similar solution conditions [64, 66, 81]. The
purpose of this work is to combine all of the available α data in order to identify which
of the complex set of variables are most important and, ultimately, produce a predictive
model for α based on the identified variables. Here, 299 total experiments with 13 physic-
ochemical features each were chosen from 12 publications [39, 61, 63–66, 81, 82, 104,
116, 121, 122, 124] to form the largest QCM-D derived α database to date. Ensemble
machine learning (gradient boosting decision trees) was employed to empirically relate the
physicochemical state (i.e., physicochemical training features) to the α values (i.e., target
feature) measured by QCM-D. Grid search hyper parameter optimization with cross vali-
dation (GSHPOCV) and recursive feature elimination with cross-validation (RFECV) were
employed to optimize model performance. To identify the physicochemical features most
92

important to prediction, RFECV results from 100 model runs were aggregated and investi-
gated to identify the physical and chemical features critical to predicting α . The predictive,
empirical model presented here will aid in identifying which physicochemical characteris-
tics are most influential to α . An improved understanding of transport parameters is key to
accurately predicting the impact of new particle types and making risk-informed regulatory
decisions, or even designing new ENMs to be safe from the ground up.
93

5.2 Methods
5.2.1 Database
The database developed for this work includes 299 separate experiments extracted from
12 peer-reviewed QCM-D particle transport studies [39, 61, 63–66, 81, 82, 104, 116, 121,
122, 124]. From each experiment, 13 physicochemical training features were recorded and
1 target experimental result feature i.e., α was chosen. Studies which reported particle
deposition rate but not particle attachment efficiency were not included in the database.
As mentioned previously, in order to calculate α from particle deposition rates, the favor-
able deposition rate at identical experimental conditions must be known, and so without
this knowledge, α could not be extrapolated from particle deposition rates. Furthermore,
studies which explored particle deposition onto oppositely charged surfaces were not con-
sidered, as α = 1 in these cases, by definition. The investigated applicability domain and
range of training and target features employed for this study are presented in Table 5.1.
94

Table 5.1: Investigated domain of physicochemical training and target features.
Training Features Range Investigated
Particle Type C60, C6020h−UV , C607D−UV , ZnO, PS, MS2RNA,
BL21RNA, MWCNTs, MWCNTsLO, MWCNTsHO, TiO2
Debye Length 0.5 – 56.2 [nm]
Salt Type NaCl, CaCl2
Particle ζ -potential -48.5 – 3.31 [mV]
Collector ζ -potential -79.6 – -21.4 [mV]
pH 5.2 – 8
Dissolved NOM Type None, SRHA, EHA, Alg
Dissolved NOM Concentration 0 – 10 [mg/L]
Immobilized NOM layer None, HHA, HFA, SRHA, EHA, Alg
Temperature 15 – 45 [°C]
Shape Sphere, ellipsoid, tube
Suspension Preparation Method Liquid-liquid exchange, direct sonication, commercial
stock
Particle Concentration 5 – 100 [mg/L]
Target Features Range Investigated
α 4.1·10−4 – 1.7 [-]
Alg: alginate; 7D-UV: 7 day UV exposure; 20h-UV: 20 hour UV exposure; EHA: Elliott hu-
mic acid; HHA: Harpeth humic acid; HFA: Harpeth fulvic acid; LO/HO: Lowly/highly oxidized;
MWCNTs: multi-walled carbon nanotubes; NOM: natural organic matter; SRHA: Suwannee
River humic acid; PS: polystyrene, MS2/BL21 RNA: RNA extracted from bacteriophage MS2
and E. coli BL21
The physicochemical features (listed in Table 5.1) were chosen based on three criteria:
(i) features that have been reported to affect α , i.e. particle type, presence of NOM, salt
95

type, Debye length (through ionic strength), temperature, shape;
(ii) features that affect interaction energy, i.e. Debye length, ζ -potential of particle and
collector, pH; and
(iii) features that have been reported to affect particle properties, i.e. suspension prepara-
tion method, particle shape.
Particle size was excluded as a physicochemical feature because the diffusion rate in-
fluences both favorable and unfavorable deposition conditions equally and therefore has no
net effect on α . Furthermore, there were large inconsistencies in particle size reporting,
due to simultaneous particle aggregation during QCM-D experiments for certain particle
types exposed to high ionic strengths. Dissolved NOM, which consists of NOM dissolved
in solution within the particle suspension and likely adsorbed to the particle surfaces, is
differentiated from the immobilized NOM layer, which is attached to the sensor surface by
electrostatic layer-by-layer (LbL) assembly. In some cases, the values for zeta potential of
particle or collector surface were not reported, so values were interpolated from reports of
identical particle or surface type under similar solution conditions. When electrophoretic
mobility was reported, zeta potential was estimated using the Smoluchowski approximation
[114].
A graphical depiction of the relationship between the training and target features is
shown in Figure 5.1. Each circular layer represents a training feature of the database and
the legend located at the top of the figure denotes the order of the circular layers, starting
with the innermost circular layer. The outermost layer is the target feature, α . Each layer is
color coded by value, according to the values (or range of values) listed below the legend.
A value of zero (or the absence of a NOM layer or dissolved NOM) is represented by the
color white in each layer. For more precise browsing, a live figure is provided online [141].
96

Figure 5.1: Graphical representation of the α database amassed for this work.
97

5.2.2 Machine learning
To attain the best prediction performance, several machine learning regression methods
(random forest, ADA boosting, decision tree, and gradient boosting) were evaluated simul-
taneously with the provided model structure (Figure 5.2), which includes automated hyper
parameter optimization (GSHPOCV) and feature selection sub routines (RFECV). Python
and scikit-learn package [142] were employed for model construction and the entire model
is available for distribution online. In this work, we present gradient boosting regression as
it provided higher prediction performance with lower variance in comparison to the other
methods.
Gradient boosting regression is an ensemble machine learning method that combines a
series of decision trees in a forward stage-wise fashion. In the first stage, a single-layer de-
cision tree is trained to fit the regression data. In each sequential stage, a new single-layer
decision tree is fit to the previous models’ residuals and appended to previous layer(s). By
sequentially fitting the residuals, the model iteratively increases its ability to predict obser-
vations modeled poorly by the previous steps. Overfitting occurs when trees are added in
excess, which increases the likelihood that the model considers noise within the training
data to be important. Standard gradient boosting regularization strategies were employed to
prevent overfitting by calibrating the number of stages to minimize the test-train deviance
(Appendix C), restricting the tree complexity (number of nodes), and by employing a learn-
ing rate parameter <1 to shrink the contribution of each tree as it is added to the model.
Note that the learning rate and the number of boosting stages parameters are selected by
GSHPOCV and propagated throughout for each model run.
5.2.3 Model structure
To provide internal estimates of error and generalizability, the database was partitioned
into training, cross validation, and testing data sets (the testing partition is called the ‘hold-
98

out’ partition to prevent confusion with cross validation testing). A schematic of the model
structure is shown in Figure 5.2 and supplemented with a textual description.
Overall, 100 model runs were performed. For each model, all usable experiments within
the database were randomly assigned to the holdout (15%) or training (85%) data sets. No
training was performed on the holdout set. Next, grid search hyper parameter optimization
with cross validation (GSHPOCV) was performed to identify the best performing combi-
nation of model parameters (i.e., the parameter combination that resulted in the highest R2
cross-validation score) [142]. A description of the GSHPOCV routine, and a breakdown
of the investigated hyper parameter space are provided in Appendix C. Following GSH-
POCV, recursive feature elimination with 5-fold cross validation (RFECV) was employed
to identify the minimum number of training features required to maximize model perfor-
mance [90, 142]. A description of the RFECV routine is provided in Appendix C. The
training set was then ‘trimmed’ to the features identified by RFECV and a new model was
trained on the trimmed training set and evaluated against the holdout set (i.e., the holdout
set training features [physicochemical features] are fed into the model and accuracy of the
model to predict α is evaluated in comparison to the ground truth values.)
99

Figure 5.2: Graphical depiction of data partitioning scheme and model structure. Thefraction of training and target features employed for each step are shown in parentheses. Inthe first step, the database is divided into the holdout set (15%) or the training set (85%).No training is performed on the holdout set training features. Grid search hyperparmeteroptimization with cross validation (GSHPOCV) is employed to determine the optimummachine learning parameters on which to train the model, which are employed throughoutthe rest of the model run. Next, unimportant features are removed from the database usingrecursive feature elimination with cross validation (RFECV; Figure 5.3). The model isretrained on the trimmed training set and evaluated using the holdout set to produce theholdout results(Figure 5.4).
100

5.3 Results and Discussion
5.3.1 Recursive feature elimination with cross validation
The performance of the model (measured as R2) to predict α as a function of the num-
ber of features selected during RFECV training can be seen in Figure 5.3. The performance
associated with predicting α during RFECV is a very conservative estimate of the gener-
alized performance of the predictive model and is not representative of overall model per-
formance because it is trained on a reduced data set (68% of the total database is employed
for RFECV score; 85% is employed for prediction against the holdout set). It can be seen
from Figure 5.3 that performance increased when the model is trained with larger feature
set sizes, as expected, with a marked increase in performance (20% median performance
gain) occurring between 7 and 8 features chosen. Progressing from 8 to 13 features contin-
ues to decrease the variance in model performance, decreases the observation frequency of
outliers, and improves the remaining outlier score (i.e., outliers move closer to the bulk of
the data). In terms of cross validation performance, there are diminishing returns to adding
more features. Median performance increases by 5% between 8 and 10 features, however
a performance increase of only 2% is observed between 10 and 13 features.
5.3.2 Attachment efficiency prediction performance
The model performance in predicting α for the holdout set as a function of the number
of RFECV selected features to train the model can be seen in Figure 5.4. The lack of
performance data below 8 features indicates that the model performance was never optimal
when fewer than 8 features were employed for model training. The median performance to
predict α in the holdout set was higher for each feature set size as compared to the RFECV
performance. This is to be expected because the model was trained on the entire trimmed
training database (additional 17% in comparison to the RFECV).
In order to identify the highest performing model utilizing the fewest number of fea-
101

Figu
re5.
3:A
ggre
gate
mod
elpe
rfor
man
cein
pred
ictin
gα
inth
ecr
oss
valid
atio
nte
stfo
lddu
ring
the
500
RFE
CV
mod
elru
ns.
The
mod
elpe
rfor
man
ce(m
easu
red
asR
2 )as
afu
nctio
nof
num
bero
ffea
ture
sch
osen
issh
own,
with
the
box
plot
sre
pres
entin
gth
em
inim
um,
max
imum
,med
ian,
and
inte
rqua
rtile
rang
eof
R2
valu
es.C
ircl
esre
pres
ents
tatis
tical
outli
ers.
102

Figu
re5.
4:A
ggre
gate
mod
elpe
rfor
man
cein
pred
ictin
gα
inth
eho
ldou
tset
asa
func
tion
ofth
enu
mbe
rof
RFE
CV
sele
cted
feat
ures
.Fo
rea
chm
odel
run,
the
data
base
was
trim
med
toth
enu
mbe
rof
feat
ures
sele
cted
byR
FEC
V,th
em
odel
was
retr
aine
don
the
trim
med
data
base
,and
then
the
αpr
edic
tion
accu
racy
(mea
sure
das
R2 )
was
eval
uate
dus
ing
the
hold
outs
et.
Box
plot
sre
pres
entt
hem
inim
um,
max
imum
,m
edia
n,an
din
terq
uart
ilera
nge
ofR
2va
lues
.C
ircl
esre
pres
ent
stat
istic
alou
tlier
s.T
hem
inim
umto
max
imum
rang
eof
RFE
CV
cros
sva
lidat
ion
R2
valu
esar
ere
pres
ente
dby
the
gree
nsh
adin
g,w
ithth
edo
tted
line
repr
esen
ting
med
ian
valu
esfo
rm
odel
perf
orm
ance
com
pari
son.
103

tures, the optimum result was chosen using Equation 5.1, where n f eatures is the number of
features employed for a given feature set size, R2median is the median R2 value corresponding
to the aggregated median predictive accuracy of holdout scores for a given feature set size,
rIQ is the interquartile range of the aggregated holdout scores for a given feature set size,
and Fobservation % is the percentage of model runs that result in a given optimum feature set
size. A summary of the values utilized in determining the optimum model and the resulting
optimum result value from Equation 5.1 are reported in Table 5.2.
Optimum result = max(
1n f eatures
· 1(1−R2
median)· 1
rIQ·Fobservation %
)(5.1)
Table 5.2: Summary of values utilized in determining the highest performing model withthe fewest number of features and resulting optimum values using Equation 5.1.
Feature Set Size 8 9 10 11 12 13
RFECV Selection Frequency 2% 2% 6% 14% 19% 57%
Median R2 0.71 0.78 0.79 0.76 0.7 0.75
Interquartile Range 0.04 0.04 0.13 0.07 0.1 0.1
Optimum Result Value 0.22 0.25 0.22 0.76 0.53 1.75
The highest median performance corresponded to a selection of 10 features, however
RFECV only selected an optimal model of 10 features in 6% of the total model runs. Fea-
ture sets consisting of 8 and 9 features reported the lowest variance (interquartile range),
however feature sets of size 8 and 9 were chosen for only 2% of the total RFECV model
runs, respectively. This indicates that there is a subset of data that can be predicted more
accurately with fewer features. In general, however, model prediction performance is more
frequently optimal for feature sets consisting of 13 features. Feature sets of 13 features
were chosen for 57% of model runs. The next most frequently observed feature set sizes
consisted of 12 and 11 features, and were observed for 19% and 14% of the model runs,
respectively. Due to the corresponding high model performance, high RFECV selection
104

frequency, and low interquartile range, the model consisting of all 13 identified physico-
chemical features was chosen as the optimum. This result suggests that the relationship
between the 13 physicochemical features chosen in this study and α is a complex one that
likely depends heavily on all chosen features.
5.3.3 Implications of database findings
By analyzing the range of features investigated within the α database in comparison
to environmentally relevant conditions, future α experiments can be guided towards areas
in need. Figures 5.5 and 5.6 illustrate the range of ionic strength conditions and dissolved
NOM content, respectively, explored within the α database. The cross-hatched areas within
each figure represent the range of ionic strength conditions and dissolved NOM content
reported in typical groundwater, according to Freeze and Cherry [143].
It can be seen in Figure 5.5 that the typical groundwater ionic strength range (0-25 mM)
is covered quite well by the majority of the experiments explored within the α database,
however there are quite a few experiments at ionic strengths well above this range. Because
these experiments fall so well outside the range of typical groundwater, any observed ef-
fects are likely not applicable or important to transport through the subsurface environment,
unless a brackish or saline area is being considered. While some experiments do fall within
the typical groundwater dissolved NOM concentration range (0.1-10 mg/L) in Figure 5.6,
the majority of the experiments within the α database were performed in the absence of
dissolved NOM. Because the presence of NOM has been shown to alter α quite drasti-
cally (depending on the type of NOM and solution conditions present), the conclusions
drawn from these studies are likely not applicable to transport through the natural environ-
ment, unless an area of unusually low NOM content is being considered. Because of these
findings, future α experiments should include dissolved NOM in the typical concentration
range (0.1-10 mg/L) to maximize the utility of experimental findings.
105

Figure 5.5: Range of ionic strength conditions explored within the α database, expressedas the percentage of total experiments. The cross hatched area represents the ionic strengthrange of typical, fresh groundwater [143].
106

Figure 5.6: Range of dissolved NOM concentrations explored within the α database, ex-pressed as the percentage of total experiments. The cross hatched area represents dissolvedNOM concentration range of typical groundwater [143].
107

Figure 5.7: Relative feature importance, reported as percentage of total model runs in whicheach feature was included in the optimal model to predict α .
5.3.4 Implications of model findings
In order to identify the features most important to accurately predicting α , a ranked
chart is presented in Figure 5.7 based on the percentage of total model runs in which each
feature was included in the optimal model to predict α .
The features included in the optimal predictive α model with 100% frequency were
not surprising, as they have been the focus of many quantitative α studies, including the
studies utilized in the training database for this work (i.e., Debye length, particle type,
particle concentration, NOM layer type, solution pH, particle ζ -potential, and collector ζ -
potential). The feature chosen in the optimal model with the lowest relative frequency, salt
type, might seem surprising at first due to the importance of ion valence on particle-surface
interaction energy [58, 59]. It should be noted, however, that the salt type is included within
108

Debye length (as ionic strength) and so the results presented here suggest that the salt type
has a somewhat limited influence on top of influencing Debye length. Furthermore, this
finding is in agreement with a recent study by Goldberg et al. [90], which reported that
salt type was of relative low importance to predicting the retained fraction of ENMs in
column experiments when a random forest machine learning model was trained on the data.
Temperature was reported to be the second least frequent feature included in the optimal
model (albeit still quite often at 74%), despite having been reported to greatly alter the α of
nC60 onto NOM coated surfaces in a study by McNew and LeBoeuf [39]. The authors do
report, however, that temperature has no effect on nC60 attachment to uncoated surfaces.
These findings seem to agree with our ranking of temperature below other features which
have been shown to affect α regardless of the presence or absence of a NOM layer.
The shape of the learning curve presented in Figures 5.3 and 5.4 in combination with
the relatively high model performance for predicting the holdout set suggest that the α
database amassed for this work is well suited to prediction by a machine learning model.
This finding also validates the selection of the 13 features used to train the model, by con-
firming that these features describe the changes in α well. While it is possible that an
important parameter was overlooked (e.g. Hamaker constant), the results presented here
indicate that there is enough information provided by the physicochemical characteristics
of the particles and depositional system to predict α with relative accuracy. This is not sur-
prising, however, since most transport parameters are controlled by the physicochemical
properties of the system, and therefore would provide redundant information if they were
to be included in a model based explicitly on physicochemical characteristics. Whether or
not this finding extends to α values measured by column experiments or other transport
parameters, however, is not yet known. Further, applicability beyond the investigated ex-
perimental domain is not known and the model must be retrained, and re-evaluated, when
new data is added.
While there has been tremendous focus on developing mechanistic models to predict
109

ENM transport, our mechanistic understanding, even in simple, synthetic systems, is in-
sufficient to enable prediction [79]. As a result, the applicability of mechanistic methods
outside the experimental state on which the models are conditioned is too limited, primar-
ily because the influence of physicochemical conditions on transport is not well understood
and it is difficult to gain process understanding using conventional experimental and mod-
eling methods.
In this work, we provided an empirical method to disentangle the complex interaction
between physicochemical conditions and α to enable the prediction of α under a wide
range of complex environmental and particle conditions. Model performance results indi-
cated that the prediction of α is dependent on all 13 features, which evidences the complex
relationship between α and the physicochemical state. In this work, we provided an em-
pirical method to sort out the complexity and enable prediction of alpha under a range of
complex conditions. The optimum model chosen in this work consisted of all 13 features,
illustrating the complex relationship between α and the chosen features, which depends
heavily on all physicochemical features identified in this work. This finding suggests that
future mechanistic models for predicting α should focus on all features identified in this
work, especially those selected for prediction in the optimum model with 100% (or near
100%) frequency, i.e. Debye length, particle type, particle concentration, NOM layer type,
solution pH, particle and collector ζ -potential, particle preparation method, and dissolved
NOM type. The features identified as most important to the quantitative prediction of α in
this work have been previously reported to qualitatively affect the value of α [39, 61, 63–
66, 81, 82, 104, 116, 121, 122, 124], further validating the findings presented in this work.
Finally, the findings presented here should be used to conduct informed experiments. By
measuring and reporting the features identified as important within this work, future α ex-
perimentalists can ensure their work to be as quantitatively useful as possible and efficiently
aid in the future effort of constructing a mechanistic model to describe α .
The approach developed herein provides a fundamentally new method to understand
110

particle transport. As such, the method could be used to support risk-informed decisions
concerning particle fate and transport by predicting transport behaviors of new and po-
tentially dangerous materials. This enables a sophisticated understanding of risk without
waiting on the development of a mechanistic model. Furthermore, this approach could sup-
port innovation of new materials as well, by allowing particles to be designed safely from
the ground up. With a better understanding of exactly which physicochemical character-
istics of the particle affect transport, the transport of a new material could be considered
during development. By tweaking these characteristics, particle transport can be controlled
from the very beginning, leading to a diminished environmental impact before the particle
is even manufactured.
111

5.4 Conclusions
In this work, we presented an empirical model to predict α explicitly based on physico-
chemical characteristics of the particles and depositional environment. The observed model
performance (Figures 5.3 and 5.4) indicates that prediction of the α database was well cap-
tured by the machine learning method chosen and the 13 physicochemical characteristics
selected. Results from predicting the holdout set (Table 5.2) suggest that the relationship
between α and the prediction features is a complex one, relying on all 13 physicochemical
features selected. The features reported as most important to the accurate prediction of α
(Figure 5.7) are in agreement with previous studies and the features reported as less impor-
tant are either somewhat redundant (salt type) or have been previously shown to only affect
α under certain conditions (temperature).
In summary, the intended utility of this work is threefold by:
(i) providing an accurate, quantitative prediction of α based explicitly on physicochem-
ical characteristics;
(ii) directing future mechanistic modeling efforts towards the physicochemical character-
istics most critical to prediction of α; and
(iii) guiding future experiments as to which characteristics are most important to measure
and report in order to maximize the scientific benefit of results.
In conclusion, the results presented here illustrate that the relationship between α and
the explored physicochemical conditions is too complex to be investigated by a single study
alone. Only through compilation of reported α experiments from many different authors
and incorporation into an all encompassing model, were we able to predict α based explic-
itly on physicochemical conditions. Furthermore, similar steps need to be taken to improve
the understanding of all aspects of particle transport. Only through compilation of data
in coordination with advanced modeling techniques can we make progress towards an all
112

encompassing understanding of transport. In short, we need to close the gaps between ex-
perimental understanding and quantitative predictive modeling, in order to maximize the
benefit of the high quality transport data being reported on a regular basis.
113

Chapter 6
Conclusions and Future Work
6.1 Conclusions
The work presented in this dissertation has centered around quantitatively investigating
the relationship between particle attachment efficiency and several physicochemical and
solution characteristics. Each chapter has focused on a different characteristic, building on
knowledge from the previous one. The work culminates with Chapter 5, which combines
all of the data presented in previous chapters with all relevant published data to produce
a predictive model for particle attachment efficiency based explicitly on physicochemical
characteristics.
Chapter 2 focused on varying the type and physicochemical properties of SOM lay-
ers in order to identify their role in particle attachment efficiency. The work presented in
Chapter 2 illustrated that the attachment of nC60 to immobilized layers of HHA and HFA
is greatly affected by temperature and that the trend in attachment efficiency onto the SOM
layers deviate greatly from that of bare silica. Both types of SOM layers hinder attach-
ment at low temperatures. The attachment efficiency then begins to rise as temperature
increases, eventually resulting in enhanced attachment at high temperatures, in the case of
the HHA layer (Fig. 2.9). Based on thermal characterization of the SOM layers compared
to the corresponding attachment trends (Figs. 2.10 and 2.11), the attachment efficiency
is strongly correlated with hydration of the layer. Regions of rapid hydration correspond
to steep increases in attachment and regions of slowed or decreased hydration correspond
to lower increases in attachment. Possible mechanisms explaining this phenomenon in-
clude water-assisted disruption of polar SOM contacts and hydration induced swelling of
the SOM matrix. This thermal effect on the attachment of nC60 to SOM may prove to be
crucial in understanding the fate and transport of ENMs in areas that are rich in SOM, like
114

the subsurface environment, because humic substances typically represent the dominant
organic components in soils and sediments. In areas that see large temperature fluctuations
throughout the year, we may see a much larger uptake of ENMs in the warm seasons and
less uptake in the cold seasons. Understanding how ENMs interact with individual com-
ponents of soil is crucial to understanding the fate and transport of ENMs in a complex
soil system, leading to their eventual impact on ecosystem and human health. The ther-
mal effect illustrated in Chapter 2 may also prove useful in the removal of similar ENMs
from wastewater or drinking water, by exploiting the much higher attachment efficiency at
increased temperatures.
Chapter 3 focused on investigating the role solution chemistry plays on attachment ef-
ficiency by varying the salt concentration and ion valence. Results from Chapter 3 indicate
that the presence of a HHA coating can both hinder and enhance nC60 attachment onto a sil-
ica surface, depending on solution chemistry. At low electrolyte concentrations, the HHA
coating enhances nC60 attachment for both mono and divalent cations. By lowering the sur-
face potential of the silica surface, the HHA coating significantly reduces the energy barrier
to nC60 deposition. As electrolyte concentration rises, the HHA coating eventually results
in a hindering of attachment for both mono and divalent cations. Though still lowering the
surface potential of silica, the HHA coating doesn’t significantly lower the energy barrier
to deposition at these elevated electrolyte concentrations, due to the significant suppression
of EDL repulsion resulting in a near zero energy barrier to nC60 deposition. Furthermore,
the structure of the HHA coating likely condenses at elevated electrolyte concentrations,
leading to a more compact and smoother surface with less potential for nC60 particle en-
tanglement, contributing to the observed reduction in attachment efficiency. Because of the
aforementioned reasons, we hypothesize that the summation of two contributing forces are
responsible for the observed trend in nC60 attachment onto HHA-coated silica:
(i) the reduction in electrostatic repulsion due to the HHA-coating, and
(ii) HHA layer compaction at increased NaCl and CaCl2 concentrations.
115

Chapter 4 investigated the role of shape on the attachment efficiency of PS particles.
Results from Chapter 4 indicate that the attachment of colloidal particles onto NOM-coated
surfaces can be greatly affected by the shape of the particles, depending on ionic strength
and the type of NOM coating. In the presence of the alginate surface, the attachment of
both spherical and stretched PS qualitatively agreed with DLVO theory. In the presence
of the HHA surface, however, deviations from DLVO theory were observed. At low ionic
strengths, spherical PS attached to HHA at a much higher rate than stretched PS. This
deviation from DLVO theory can be explained by the increased surface heterogeneity and
roughness of the HHA surface observed by AFM. More voids present in the HHA layer
allows for a higher potential of spherical PS particle entanglement, while the enlarged
major axis of the stretched particles hinder their ability to become entangled in the extended
HHA surface. As ionic strength increases, the HHA layer condenses and the potential
for spherical particle entanglement is reduced. At high ionic strengths, the HHA layer
condenses to a point where DLVO forces dominate and the stretched particles attach at a
higher rate than spherical particles, due to a reduced energy barrier to deposition.
Chapter 5 incorporated all the data from Chapters 2, 3, and 4 along with attachment
efficiency data amassed from literature to empirically model the attachment efficiency as
an explicit function of 13 identified physicochemical characteristics of the particle and de-
positional system. The observed model performance (Figures 5.3 and 5.4) indicates that
prediction of the attachment efficiency database was well captured by the machine learn-
ing model applied and the 13 physicochemical characteristics selected. Holdout prediction
results (Table 5.2) demonstrate that the relationship between attachment efficiency (i.e., tar-
get feature) and the physicochemical state (i.e., training features) is complex and relies on
all 13 physicochemical features selected. The physicochemical features reported as most
important to the accurate prediction of attachment efficiency (Figure 5.7) are in agreement
with previous studies and the features reported as less important are either somewhat redun-
dant (salt type) or have been previously shown to only affect attachment efficiency under
116

certain conditions (temperature). In summary, the intended utility of the work presented in
Chapter 5 is threefold by:
(i) providing an accurate, quantitative prediction of attachment efficiency based explic-
itly on physicochemical characteristics;
(ii) directing future mechanistic modeling efforts towards the physicochemical character-
stics most critical to prediction of attachment efficiency; and
(iii) guiding future experiments as to which characteristics are most important to measure
and report in order to maximize the scientific benefit of results.
The work presented in Chapters 2, 3, and 4 indicate that the presence of SOM layers
can greatly affect the attachment efficiency of colloidal particles. Depending on the type of
SOM (Chapters 2 and 5), ionic strength of solution (Chapter 3), and particle shape (Chapter
4), attachment efficiency can be hindered, enhanced, or remain unchanged. These findings
clearly suggest that SOM layers, which are ubiquitous in the subsurface environment, will
play a major role in the deposition processes of colloidal particles and therefore may in-
fluence their transport. Fully understanding the transport contributions of SOM layers may
prove crucial to predicting the fate and transport of colloidal particles through the subsur-
face environment and, in turn, their eventual impact on the environment. Combined with
the predictive model presented in Chapter 5, these results indicate that the physicochemical
characteristics of the system alter attachment efficiency through many, complex pathways.
In summary, the work presented in this dissertation indicates that attachment efficiency
is influenced by many physicochemical features and describing this relationship is too com-
plex for a single study, or series of studies, alone. Only through a compilation of attachment
experiments, both contained within this dissertation and amassed from recent publications,
were we able to predict attachment efficiency based explicitly on physicochemical fea-
tures with relative accuracy. The results presented in Chapter 5 should prove encouraging
to the field of environmental science, however. It illustrates that if we can combine high
117

quality transport data from many sources with advanced machine learning techniques, we
can make progress towards an all encompassing understanding of transport, allowing us to
make impactful, risk-informed decisions in the present day, before we fully understand the
theory and mechanisms driving environmental transport.
118

6.2 Future Work
The work presented in this dissertation has improved the understanding of how ionic
strength, particle shape, and the presence of attached SOM affect the attachment efficiency
of colloidal particles. Though these improvements certainly aid in our mechanistic under-
standing of attachment, studying one factor alone is not enough to result in a true, impact-
ful advancement of transport knowledge. Only through the compilation of all of our work
and all recently published similar work were we able to create a database with sufficient
complexity to predict attachment efficiency with acceptable accuracy. Though the model
presented in Chapter 5 predicts attachment efficiency for a wide range of physicochemical
characteristics, it is only applicable for the range of values available in current literature,
and therefore included in the database. As additional data is published investigating physic-
ochemical characteristics outside of this range, the database will need to be updated and
the model retrained. Only through this iterative process can we hope to produce a model
robust enough to predict attachment efficiency in real, environmental conditions. Further-
more, the database created in Chapter 5 should be used as a guide for future attachment
efficiency experiments. By utilizing the database, scientists can identify any gaps that need
to be filled or relevant characteristics which have not yet been explored.
In this same manner, similar steps should be taken to improve the understanding of
all aspects of particle transport. Only through compilation of data in coordination with
advanced modeling techniques can we make progress towards an all encompassing under-
standing of particle transport. In short, we need to close the gaps between experimental
understanding and quantitative predictive modeling, in order to maximize the benefit of
the high quality transport data being reported on a regular basis. Not only will the future
of predictive modeling benefit from a comprehensive database, but so will the future of
experimental transport science. A database will inform experimental scientists which ar-
eas are lacking so that they can focus their efforts accordingly, improving the efficiency of
transport research. The improved predictive models which arise from such databases will
119

also help identify which characteristics are crucial to predicting transport, informing the
experimental scientist exactly which characteristics to measure and report. Only through
this kind of closed loop can we hope to accurately predict particle transport in a system as
complex as the natural environment.
120

BIBLIOGRAPHY
[1] A. McWilliams. Nanotechnology: A realistic market assessment,
2014. URL http://www.bccresearch.com/market-research/nanotechnology/
nanotechnology-market-assessment-report-nan031f.html.
[2] M.S. Mauter and M. Elimelech. Environmental applications of carbon-based nano-
materials. Environmental Science & Technology, 42(16):5843–5859, 2008.
[3] A. Nel, T. Xia, L. Madler, and N. Li. Toxic potential of materials at the nanolevel.
Science, 311(5761):622–627, 2006.
[4] S. Bosi, T. Da Ros, G. Spalluto, and M. Prato. Fullerene derivatives: an attractive
tool for biological applications. European Journal of Medicinal Chemistry, 38(11-
12):913–923, 2003.
[5] Philippe Poncharal, Z.L. Wang, Daniel Ugarte, and Walt A. De Heer. Electrostatic
deflections and electromechanical resonances of carbon nanotubes. Science, 283
(5407):1513–1516, 1999.
[6] Jonathan Loeffler, Ulrih Sutter, Rgeine Hedderich, et al. Overview on promising
nanomaterials for industrial applications. Nanomaterial Roadmap, 2015.
[7] Zhifeng Long, Jing Ji, Kun Yang, Daohui Lin, and Fengchang Wu. Systematic and
quantitative investigation of the mechanism of carbon nanotubes? toxicity toward
algae. Environmental Science & Technology, 46(15):8458–8466, 2012.
[8] Delina Y. Lyon, Lena Brunet, George W. Hinkal, Mark R. Wiesner, and Pedro J.J.
Alvarez. Antibacterial activity of fullerene water suspensions (nc60) is not due to
ros-mediated damage. Nano letters, 8(5):1539–1543, 2008.
121

[9] J.P. Kamat, T.P.A. Devasagayam, K.I. Priyadarsini, and H. Mohan. Reactive oxygen
species mediated membrane damage induced by fullerene derivatives and its possible
biological implications. Toxicology, 155(1):55–61, 2000.
[10] N. Nakajima, C. Nishi, F.M. Li, and Y. Ikada. Photo-induced cytotoxicity of water-
soluble fullerene. Fullerene Science and Technology, 4(1):1–19, 1996.
[11] W.J. Weber, E.J. LeBoeuf, T.M. Young, and W.L. Huang. Contaminant interactions
with geosorbent organic matter: Insights drawn from polymer sciences. Water Re-
search, 35(4):853–868, 2001.
[12] Baoshan Xing, William B. McGill, and Marvin J. Dudas. Cross-correlation of po-
larity curves to predict partition coefficients of nonionic organic contaminants. En-
vironmental Science & Technology, 28(11):1929–1933, 1994.
[13] Xilong Wang and Baoshan Xing. Sorption of organic contaminants by biopolymer-
derived chars. Environmental Science & Technology, 41(24):8342–8348, 2007.
[14] F.J. Stevenson. Humus chemistry : genesis, composition, reactions. Wiley, New
York, 2nd edition, 1994.
[15] R. Sutton and G. Sposito. Molecular structure in soil humic substances: the new
view. Environmental Science & Technology, 39(23):9009–9015, 2005.
[16] Rossane C. DeLapp and Eugene J. LeBoeuf. Thermal analysis of whole soils and
sediment. Journal of Environmental Quality, 33(1):330–337, 2004.
[17] Rossane C. DeLapp, Eugene J. LeBoeuf, and Katherine D. Bell. Thermodynamic
properties of several soil-and sediment-derived natural organic materials. Chemo-
sphere, 54(4):527–539, 2004.
122

[18] Eugene J. LeBoeuf and Walter J. Weber. Macromolecular characteristics of natu-
ral organic matter. 2. sorption and desorption behavior. Environmental Science &
Technology, 34(17):3632–3640, 2000.
[19] Eugene J. LeBoeuf and Walter J. Weber. Macromolecular characteristics of natural
organic matter. 1. insights from glass transition and enthalpic relaxation behavior.
Environmental Science & Technology, 34(17):3623–3631, 2000.
[20] Gabriele E. Schaumann and Olivia Antelmann. Thermal characteristics of soil or-
ganic matter measured by dsc: A hint on a glass transition. Journal of Plant Nutrition
and Soil Science, 163(2):179–181, 2000.
[21] Katherine D. Young and Eugene J. LeBoeuf. Glass transition behavior in a peat
humic acid and an aquatic fulvic acid. Environmental Science & Technology, 34
(21):4549–4553, 2000.
[22] E.J. LeBoeuf and W.J. Weber. A distributed reactivity model for sorption by soils and
sediments .8. sorbent organic domains: Discovery of a humic acid glass transition
and an argument for a polymer-based model. Environmental Science & Technology,
31(6):1697–1702, 1997.
[23] Lucy M. Lucht, John M. Larson, and Nikolaos A. Peppas. Macromolecular structure
of coals. 9. molecular structure and glass transition temperature. Energy & Fuels, 1
(1):56–58, 1987.
[24] Lu Zhang, Eugene J. LeBoeuf, and Baoshan Xing. Thermal analytical investiga-
tion of biopolymers and humic-and carbonaceous-based soil and sediment organic
matter. Environmental Science & Technology, 41(14):4888–4894, 2007.
[25] E.J. LeBoeuf. Macromolecular characteristics of natural organic matter and their
influence on sorption and desorption behavior of organic chemicals. University of
Michigan, 1998.
123

[26] Weilin Huang and Walter J. Weber. A distributed reactivity model for sorption by
soils and sediments. 11. slow concentration-dependent sorption rates. Environmental
Science & Technology, 32(22):3549–3555, 1998.
[27] Thomas M. Young and Walter J. Weber. A distributed reactivity model for sorption
by soils and sediments. 3. effects of diagenetic processes on sorption energetics.
Environmental Science & Technology, 29(1):92–97, 1995.
[28] H.B. Hopfenberg and V. Stannett. The diffusion and sorption of gases and vapours
in glassy polymers. In The Physics of Glassy Polymers, pages 504–547. Springer,
1973.
[29] G.E. Schaumann and E.J. LeBoeuf. Glass transitions in peat: their relevance and the
impact of water. Environmental science & technology, 39(3):800–806, 2005.
[30] V.R.N. Telis and P.J.A. Sobral. Glass transitions and state diagram for freeze-dried
pineapple. LWT-Food Science and Technology, 34(4):199–205, 2001.
[31] D. Benczedi, I. Tomka, and F. Escher. Thermodynamics of amorphous starch-water
systems. 2. concentration fluctuations. Macromolecules, 31(9):3062–3074, 1998.
[32] G.E. Schaumann. Matrix relaxation and change of water state during hydration of
peat. Colloids and Surfaces A: Physicochemical and Engineering Aspects, 265(1):
163–170, 2005.
[33] Adelia J.A. Aquino, Daniel Tunega, Gabriele E. Schaumann, Georg Haberhauer,
Martin H. Gerzabek, and Hans Lischka. Stabilizing capacity of water bridges in
nanopore segments of humic substances: a theoretical investigation. The Journal of
Physical Chemistry C, 113(37):16468–16475, 2009.
[34] E.R. Graber, L. Tsechansky, and M. Borisover. Hydration-assisted sorption of a
124

probe organic compound at different peat hydration levels: the link solvation model.
Environmental science & technology, 41(2):547–554, 2007.
[35] M. Borisover and E.R. Graber. Relationship between strength of organic sorbate
interactions in nom and hydration effect on sorption. Environmental science & tech-
nology, 36(21):4570–4577, 2002.
[36] M. Borisover, M. Reddy, and E.R. Graber. Solvation effect on organic compound
interactions in soil organic matter. Environmental science & technology, 35(12):
2518–2524, 2001.
[37] E.R. Graber and M. Borisover. Hydration-facilitated sorption of specifically inter-
acting organic compounds by model soil organic matter. Environmental science &
technology, 32(2):258–263, 1998.
[38] A.G. Kalinichev and R.J. Kirkpatrick. Molecular dynamics simulation of cationic
complexation with natural organic matter. European Journal of Soil Science, 58(4):
909–917, 2007.
[39] Coy P. McNew and Eugene J. LeBoeuf. The role of attached phase soil and sediment
organic matter physicochemical properties on fullerene (nc60) attachment. Chemo-
sphere, 139:609–616, 2015.
[40] Yamuna Kunhi Mouvenchery, Jirı Kucerık, Doerte Diehl, and Gabriele E. Schau-
mann. Cation-mediated cross-linking in natural organic matter: a review. Reviews
in Environmental Science and Biotechnology, 11(1):41–54, 2012.
[41] Adelia J.A. Aquino, Daniel Tunega, Gabriele E. Schaumann, Georg Haberhauer,
Martin H. Gerzabek, and Hans Lischka. The functionality of cation bridges for bind-
ing polar groups in soil aggregates. International Journal of Quantum Chemistry,
111(7-8):1531–1542, 2011.
125

[42] R. Kelman Wieder. Metal cation binding to sphagnum peat and sawdust: Relation to
wetland treatment of metal-polluted waters. Water, Air, and Soil Pollution, 53(3-4):
391–400, 1990.
[43] G.E. Schaumann and S. Thiele-Bruhn. Molecular modeling of soil organic matter:
Squaring the circle? Geoderma, (169):e1, 2011.
[44] Yuefeng Lu and Joseph J. Pignatello. Sorption of apolar aromatic compounds to
soil humic acid particles affected by aluminum (iii) ion cross-linking. Journal of
Environmental Quality, 33(4):1314–1321, 2004.
[45] G.E. Schaumann and M. Bertmer. Do water molecules bridge soil organic matter
molecule segments? European Journal of Soil Science, 59(3):423–429, 2008.
[46] Gabriele E. Schaumann, Daniela Gildemeister, Yamuna Kunhi Mouvenchery, San-
dra Spielvogel, and Dorte Diehl. Interactions between cations and water molecule
bridges in soil organic matter. Journal of Soils and Sediments, 13(9):1579–1588,
2013.
[47] Saikat Ghosh, Hamid Mashayekhi, Prasanta Bhowmik, and Baoshan Xing. Colloidal
stability of al2o3 nanoparticles as affected by coating of structurally different humic
acids. Langmuir, 26(2):873–879, 2009.
[48] Bin Xie, Zhihua Xu, Wenhua Guo, and Qilin Li. Impact of natural organic matter
on the physicochemical properties of aqueous c60 nanoparticles. Environmental
Science & Technology, 42(8):2853–2859, 2008.
[49] Daohui Lin and Baoshan Xing. Tannic acid adsorption and its role for stabilizing
carbon nanotube suspensions. Environmental Science & Technology, 42(16):5917–
5923, 2008.
126

[50] K.L. Chen and M. Elimelech. Influence of humic acid on the aggregation kinetics
of fullerene (c60) nanoparticles in monovalent and divalent electrolyte solutions.
Journal of Colloid and Interface Science, 309(1):126–134, 2007.
[51] Motoki Terashima and Seiya Nagao. Solubilization of [60] fullerene in water by
aquatic humic substances. Chemistry Letters, 36(2):302–303, 2007.
[52] Hoon Hyung, John D. Fortner, Joseph B. Hughes, and Jae-Hong Kim. Natural or-
ganic matter stabilizes carbon nanotubes in the aqueous phase. Environmental Sci-
ence & Technology, 41(1):179–184, 2007.
[53] Daohui Lin, Ni Liu, Kun Yang, Lizhong Zhu, Yong Xu, and Baoshan Xing. The
effect of ionic strength and ph on the stability of tannic acid-facilitated carbon nan-
otube suspensions. Carbon, 47(12):2875–2882, 2009.
[54] Xin Ma and Dermont Bouchard. Formation of aqueous suspensions of fullerenes.
Environmental Science & Technology, 43(2):330–336, 2008.
[55] Y. Thomas He, Jiamin Wan, and Tetsu Tokunaga. Kinetic stability of hematite
nanoparticles: the effect of particle sizes. Journal of Nanoparticle Research, 10
(2):321–332, 2008.
[56] D. Lin, X. Tian, F. Wu, and B. Xing. Fate and transport of engineered nanomaterials
in the environment. Journal of Environmental Quality, 39(6):1896–1908, 2010.
[57] Mohammed Baalousha, Adriana Manciulea, Susan Cumberland, Kevin Kendall, and
Jamie R. Lead. Aggregation and surface properties of iron oxide nanoparticles:
influence of ph and natural organic matter. Environmental Toxicology and Chemistry,
27(9):1875–1882, 2008.
[58] EJW Verwey. Theory of the stability of lyophobic colloids. The Journal of Physical
Chemistry, 51(3):631–636, 1947.
127

[59] BV Derjaguin. Theory of the stability of strongly charged lyophobic sols and the
adhesion of strongly charged particles in solutions of electrolytes. Acta Physicochim.
USSR, 14:633–662, 1941.
[60] Menachem Elimelech, Xiadong Jia, John Gregory, and Richard Williams. Particle
deposition & aggregation: measurement, modelling and simulation. Butterworth-
Heinemann, 1998.
[61] K.L. Chen and M. Elimelech. Aggregation and deposition kinetics of fullerene (c-
60) nanoparticles. Langmuir, 22(26):10994–11001, 2006.
[62] Navid B. Saleh, Lisa D. Pfefferle, and Menachem Elimelech. Aggregation kinet-
ics of multiwalled carbon nanotubes in aquatic systems: measurements and envi-
ronmental implications. Environmental Science & Technology, 42(21):7963–7969,
2008.
[63] Xiaojun Chang and Dermont C. Bouchard. Multiwalled carbon nanotube deposition
on model environmental surfaces. Environmental Science & Technology, 47(18):
10372–10380, 2013.
[64] X.L. Qu, P.J.J. Alvarez, and Q.L. Li. Impact of sunlight and humic acid on the depo-
sition kinetics of aqueous fullerene nanoparticles (nc(60)). Environmental Science
& Technology, 46(24):13455–13462, 2012.
[65] Peng Yi and Kai Loon Chen. Influence of surface oxidation on the aggregation
and deposition kinetics of multiwalled carbon nanotubes in monovalent and divalent
electrolytes. Langmuir, 27(7):3588–3599, 2011.
[66] K.L. Chen and M. Elimelech. Interaction of fullerene (c-60) nanoparticles with
humic acid and alginate coated silica surfaces: Measurements, mechanisms, and
environmental implications. Environmental Science & Technology, 42(20):7607–
7614, 2008.
128

[67] Benjamin Espinasse, Ernest M. Hotze, and Mark R. Wiesner. Transport and retention
of colloidal aggregates of c60 in porous media: Effects of organic macromolecules,
ionic composition, and preparation method. Environmental Science & Technology,
41(21):7396–7402, 2007.
[68] C. Degueldre, H.R. Pfeiffer, W. Alexander, B. Wernli, and R. Bruetsch. Colloid
properties in granitic groundwater systems. i: Sampling and characterisation. Ap-
plied Geochemistry, 11(5):677–695, 1996.
[69] Peter Hirsch and Ellen Rades-Rohkohl. Microbial colonization of aquifer sediment
exposed in a groundwater well in northern germany. Applied and Environmental
Microbiology, 56(10):2963–2966, 1990.
[70] D.L. Balkwill, J.K. Fredrickson, and J.M. Thomas. Vertical and horizontal variations
in the physiological diversity of the aerobic chemoheterotrophic bacterial microflora
in deep southeast coastal plain subsurface sediments. Applied and Environmental
Microbiology, 55(5):1058–1065, 1989.
[71] Megan B. Seymour, Gexin Chen, Chunming Su, and Yusong Li. Transport and
retention of colloids in porous media: does shape really matter? Environmental
Science & Technology, 47(15):8391–8398, 2013.
[72] Ruth E. Baltus, Appala Raju Badireddy, Wendong Xu, and Shankararaman Chellam.
Analysis of configurational effects on hindered convection of nonspherical bacteria
and viruses across microfiltration membranes. Industrial & Engineering Chemistry
Research, 48(5):2404–2413, 2008.
[73] Yonggang Wang, Yusong Li, John D Fortner, Joseph B Hughes, Linda M Abriola,
and Kurt D Pennell. Transport and retention of nanoscale c60 aggregates in water-
saturated porous media. Environmental science & technology, 42(10):3588–3594,
2008.
129

[74] Michael B. Salerno, Matt Flamm, Bruce E. Logan, and Darrell Velegol. Transport
of rodlike colloids through packed beds. Environmental Science & Technology, 40
(20):6336–6340, 2006.
[75] Thomas H. Weiss, Aaron L. Mills, George M. Hornberger, and Janet S. Herman.
Effect of bacterial cell shape on transport of bacteria in porous media. Environmental
Science & Technology, 29(7):1737–1740, 1995.
[76] Jack F Schijven, S Majid Hassanizadeh, and Ria HAM de Bruin. Two-site kinetic
modeling of bacteriophages transport through columns of saturated dune sand. Jour-
nal of Contaminant Hydrology, 57(3):259–279, 2002.
[77] Scott A Bradford, Jirka Simunek, Mehdi Bettahar, Martinus Th van Genuchten, and
Scott R Yates. Modeling colloid attachment, straining, and exclusion in saturated
porous media. Environmental Science & Technology, 37(10):2242–2250, 2003.
[78] Nathalie Tufenkji and Menachem Elimelech. Spatial distributions of cryptosporid-
ium oocysts in porous media: Evidence for dual mode deposition. Environmental
Science & Technology, 39(10):3620–3629, 2005.
[79] Eli Goldberg, Martin Scheringer, Thomas D Bucheli, and Konrad Hungerbuhler.
Critical assessment of models for transport of engineered nanoparticles in saturated
porous media. Environmental Science & Technology, 48(21):12732–12741, 2014.
[80] Indranil Chowdhury, Matthew C. Duch, Nikhita D. Mansukhani, Mark C. Hersam,
and Dermont Bouchard. Interactions of graphene oxide nanomaterials with natural
organic matter and metal oxide surfaces. Environmental Science & Technology, 48
(16):9382–9390, 2014.
[81] Coy P. McNew and Eugene J. LeBoeuf. nc60 deposition onto a humic acid coated
silica surface and the effect of ionic strength. Manuscript submitted for publication,
2015.
130

[82] Coy P. McNew, Negin Kananizadeh, Yusong Li, and Eugene J. LeBoeuf. The at-
tachment of colloidal particles to environmentally relevant surfaces and the effect of
particle shape. Manuscript in preparation, 2015.
[83] Christopher M Bishop. Pattern Recognition and Machine Learning. springer, 2006.
[84] Li Deng, Geoffrey Hinton, and Brian Kingsbury. New types of deep neural network
learning for speech recognition and related applications: An overview. In Acoustics,
Speech and Signal Processing (ICASSP), 2013 IEEE International Conference on,
pages 8599–8603. IEEE, 2013.
[85] David Stavens and Sebastian Thrun. A self-supervised terrain roughness estimator
for off-road autonomous driving. arXiv preprint arXiv:1206.6872, 2012.
[86] Gary Bradski and Adrian Kaehler. Learning OpenCV: Computer vision with the
OpenCV library. ” O’Reilly Media, Inc.”, 2008.
[87] Travis B Murdoch and Allan S Detsky. The inevitable application of big data to
health care. Jama, 309(13):1351–1352, 2013.
[88] Jeremy M Gernand, Elizabeth Casman, et al. Machine learning for nanomaterial
toxicity risk assessment. Intelligent Systems, IEEE, 29(3):84–88, 2014.
[89] DA Winkler, FR Burden, Bing Yan, Ralph Weissleder, Carlos Tassa, Stanley Shaw,
and VC Epa. Modelling and predicting the biological effects of nanomaterials. SAR
and QSAR in Environmental Research, 25(2):161–172, 2014.
[90] Eli Goldberg, Martin Scheringer, Thomas D Bucheli, and Konrad Hungerbuhler.
Prediction of nanoparticle transport behavior from physicochemical properties: ma-
chine learning provides insights to guide the next generation of transport models.
Environmental Science: Nano, 2(4):352–360, 2015.
131

[91] Archana Jaiswall. Qcm-d basic training: Introduction and applications. QCM-D
Training Course, 2013.
[92] Matthew C Dixon. Quartz crystal microbalance with dissipation monitoring: en-
abling real-time characterization of biological materials and their interactions. Jour-
nal of Biomolecular Techniques, 19(3):151, 2008.
[93] G. Sauerbrey. Verwendung von schwingquarzen zur wagung dunner schichten und
zur mikrowagung. Z. Phys, 155:206–222, 1959.
[94] Ilya Reviakine, Diethelm Johannsmann, and Ralf P Richter. Hearing what you can-
not see and visualizing what you hear: interpreting quartz crystal microbalance data
from solvated interfaces. Analytical chemistry, 83(23):8838–8848, 2011.
[95] M.V. Voinova, M. Rodahl, M. Jonson, and B. Kasemo. Viscoelastic acoustic re-
sponse of layered polymer films at fluid-solid interfaces: continuum mechanics ap-
proach. Physica Scripta, 59(5):391, 1999.
[96] Kristian Rechendorff, Mads Bruun Hovgaard, Morten Foss, and Flemming Besen-
bacher. Influence of surface roughness on quartz crystal microbalance measurements
in liquids. Journal of Applied Physics, 101(11):114502, 2007.
[97] Lubica Macakova, Eva Blomberg, and Per M Claesson. Effect of adsorbed layer
surface roughness on the qcm-d response: focus on trapped water. Langmuir, 23
(24):12436–12444, 2007.
[98] Chad T Jafvert and Pradnya P Kulkarni. Buckminsterfullerene’s (c60) octanol- water
partition coefficient (kow) and aqueous solubility. Environmental science & technol-
ogy, 42(16):5945–5950, 2008.
[99] D.Y. Lyon, L.K. Adams, J.C. Falkner, and P.J.J. Alvarez. Antibacterial activity of
132

fullerene water suspensions: Effects of preparation method and particle size. Envi-
ronmental Science & Technology, 40(14):4360–4366, 2006.
[100] Y. Lu, K. Yang, and D. Lin. Transport of surfactant-facilitated multiwalled carbon
nanotube suspensions in columns packed with sized soil particles. Environmental
Pollution, 192:36–43, 2014.
[101] R.C. DeLapp, E.J. LeBoeuf, J. Chen, and B.H. Gu. Advanced thermal characteriza-
tion of fractionated natural organic matter. Journal of Environmental Quality, 34(3):
842–853, 2005.
[102] G.V. Andrievsky, M.V. Kosevich, O.M. Vovk, V.S. Shelkovsky, and L.A.
Vashchenko. On the production of an aqueous colloidal solution of fullerenes. Jour-
nal of the Chemical Society-Chemical Communications, (12):1281–1282, 1995.
[103] R. Hogg, T.W. Healy, and D.W. Fuerstenau. Mutual coagulation of colloidal disper-
sions. Transactions of the Faraday Society, 62:1638–1651, 1966.
[104] X. Jiang, M. Tong, H. Li, and K. Yang. Deposition kinetics of zinc oxide nanoparti-
cles on natural organic matter coated silica surfaces. Journal of colloid and interface
science, 350(2):427–434, 2010.
[105] C.G. Malmberg and A.A. Maryott. Dielectric constant of water from 0 to 100 °c.
Journal of Research of the National Bureau of Standards, 56(1):1–8, 1956.
[106] N. Ishida and S. Biggs. Direct observation of the phase transition for a poly(n-
isopropylacryamide) layer grafted onto a solid surface by afm and qcm-d. Langmuir,
23(22):11083–11088, 2007.
[107] A. Vidyasagar, C. Sung, R. Gamble, and J.L. Lutkenhaus. Thermal transitions in dry
and hydrated layer-by-layer assemblies exhibiting linear and exponential growth.
ACS Nano, 6(7):6174–6184, 2012.
133

[108] Fadri Gottschalk and Bernd Nowack. The release of engineered nanomaterials to the
environment. Journal of Environmental Monitoring, 13(5):1145–1155, 2011.
[109] Jiasong Fang, Delina Y Lyon, Mark R Wiesner, Jinping Dong, and Pedro JJ Alvarez.
Effect of a fullerene water suspension on bacterial phospholipids and membrane
phase behavior. Environmental science & technology, 41(7):2636–2642, 2007.
[110] Jonathan Brant, Helene Lecoanet, and Mark R Wiesner. Aggregation and deposition
characteristics of fullerene nanoparticles in aqueous systems. Journal of Nanoparti-
cle Research, 7(4-5):545–553, 2005.
[111] Yonggang Wang, Yusong Li, and Kurt D Pennell. Influence of electrolyte species and
concentration on the aggregation and transport of fullerene nanoparticles in quartz
sands. Environmental toxicology and chemistry, 27(9):1860–1867, 2008.
[112] Yusong Li, Yonggang Wang, Kurt D Pennell, and Linda M Abriola. Investigation of
the transport and deposition of fullerene (c60) nanoparticles in quartz sands under
varying flow conditions. Environmental science & technology, 42(19):7174–7180,
2008.
[113] Helene F Lecoanet, Jean-Yves Bottero, and Mark R Wiesner. Laboratory assess-
ment of the mobility of nanomaterials in porous media. Environmental science &
technology, 38(19):5164–5169, 2004.
[114] Robert J Hunter. Zeta potential in colloid science: principles and applications.
Academic press, 2013.
[115] Luc Bousse, Shahriar Mostarshed, Bart Van Der Shoot, NF De Rooij, Peter Gimmel,
and Wolfgang Gopel. Zeta potential measurements of ta2o5 and sio2 thin films.
Journal of colloid and interface science, 147(1):22–32, 1991.
134

[116] Baoling Yuan, Mai Pham, and Thanh H Nguyen. Deposition kinetics of bacterio-
phage ms2 on a silica surface coated with natural organic matter in a radial stagnation
point flow cell. Environmental science & technology, 42(20):7628–7633, 2008.
[117] Seungkwan Hong and Menachem Elimelech. Chemical and physical aspects of natu-
ral organic matter (nom) fouling of nanofiltration membranes. Journal of membrane
science, 132(2):159–181, 1997.
[118] Kai Loon Chen, Steven E Mylon, and Menachem Elimelech. Aggregation kinetics
of alginate-coated hematite nanoparticles in monovalent and divalent electrolytes.
Environmental science & technology, 40(5):1516–1523, 2006.
[119] C.H. Ward, W. Giger, and P.L. McCarty. Groundwater Quality (Environmental Sci-
ence and Technology Series). John Wiley & Sons Inc, 1985. ISBN 0471815977.
[120] Yingying Wang, Frederik Hammes, Marcel Du?ggelin, and Thomas Egli. Influence
of size, shape, and flexibility on bacterial passage through micropore membrane
filters. Environmental Science & Technology, 42(17):6749–6754, 2008.
[121] Indranil Chowdhury, Matthew C. Duch, Nikhita D. Mansukhani, Mark C. Hersam,
and Dermont Bouchard. Deposition and release of graphene oxide nanomaterials
using a quartz crystal microbalance. Environmental Science & Technology, 48(2):
961–969, 2014.
[122] Yun Shen, Hyunjung Kim, Meiping Tong, and Qingyun Li. Influence of solution
chemistry on the deposition and detachment kinetics of rna on silica surfaces. Col-
loids and Surfaces B: Biointerfaces, 82(2):443–449, 2011.
[123] Nelson Akaighe, Sean W. Depner, Sarbajit Banerjee, and Mary Sohn. Transport
and deposition of suwannee river humic acid/natural organic matter formed silver
nanoparticles on silica matrices: The influence of solution ph and ionic strength.
Chemosphere, 92(4):406–412, 2013.
135

[124] Beng Joo Reginald Thio, Dongxu Zhou, and Arturo A. Keller. Influence of natural
organic matter on the aggregation and deposition of titanium dioxide nanoparticles.
Journal of Hazardous Materials, 189(1):556–563, 2011.
[125] Meiping Tong, Jiali Ding, Yun Shen, and Pingting Zhu. Influence of biofilm on the
transport of fullerene (c 60) nanoparticles in porous media. Water Research, 44(4):
1094–1103, 2010.
[126] Julie A. Champion, Yogesh K. Katare, and Samir Mitragotri. Making polymeric
micro-and nanoparticles of complex shapes. Proceedings of the National Academy
of Sciences, 104(29):11901–11904, 2007.
[127] Qiang Liu, Volha Lazouskaya, Qingxiang He, and Yan Jin. Effect of particle shape
on colloid retention and release in saturated porous media. Journal of Environmental
Quality, 39(2):500–508, 2010.
[128] C.C. Ho and R.H. Ottewill. Investigation of the charge distribution of ellipsoidal
particles. Colloids and Surfaces A: Physicochemical and Engineering Aspects, 141
(1):29–35, 1998.
[129] C.C. Ho, R.H. Ottewill, and L. Yu. Examination of ellipsoidal polystyrene particles
by electrophoresis. Langmuir, 13(7):1925–1930, 1997.
[130] Eli Goldberg, Coy P. McNew, Martin Scheringer, Eugene J. LeBoeuf, and Kon-
rad Hungerbuuhler. Predicting particle attachment efficiency from physicochemical
characteristics: a machine learning approach. Manuscript in Preparation.
[131] Barbara Karn, Todd Kuiken, and Martha Otto. Nanotechnology and in situ remedia-
tion: a review of the benefits and potential risks. Environmental health perspectives,
pages 1823–1831, 2009.
136
[132] Bhupinder Singh Sekhon. Nanotechnology in agri-food production: an overview.
Nanotechnology, science and applications, 7:31, 2014.
[133] Vandana Ghormade, Mukund V Deshpande, and Kishore M Paknikar. Perspectives
for nano-biotechnology enabled protection and nutrition of plants. Biotechnology
advances, 29(6):792–803, 2011.
[134] Frank Von der Kammer, P Lee Ferguson, Patricia A Holden, Armand Masion, Kim R
Rogers, Stephen J Klaine, Albert A Koelmans, Nina Horne, and Jason M Unrine.
Analysis of engineered nanomaterials in complex matrices (environment and biota):
general considerations and conceptual case studies. Environmental Toxicology and
Chemistry, 31(1):32–49, 2012.
[135] Steven Sleutel, Veerle Cnudde, Bert Masschaele, J Vlassenbroek, Manuel Dierick,
Luc Van Hoorebeke, Patric Jacobs, and Stefaan De Neve. Comparison of different
nano-and micro-focus x-ray computed tomography set-ups for the visualization of
the soil microstructure and soil organic matter. Computers & Geosciences, 34
(8):931–938, 2008.
[136] Tanapon Phenrat, Hye-Jin Kim, Fritjof Fagerlund, Tissa Illangasekare, and Gre-
gory V. Lowry. Empirical correlations to estimate agglomerate size and deposition
during injection of a polyelectrolyte-modified fe 0 nanoparticle at high particle con-
centration in saturated sand. Journal of Contaminant Hydrology, 118(3):152–164,
2010.
[137] Tanapon Phenrat, Jee Eun Song, Charlotte M. Cisneros, Daniel P. Schoenfelder,
Robert D. Tilton, and Gregory V. Lowry. Estimating attachment of nano-and
submicrometer-particles coated with organic macromolecules in porous media: de-
velopment of an empirical model. Environmental Science & Technology, 44(12):
4531–4538, 2010.
137

[138] Renbi Bai and Chi Tien. Particle deposition under unfavorable surface interactions.
Journal of Colloid and Interface Science, 218(2):488–499, 1999.
[139] Renbi Bai and Chi Tien. A new correlation for the initial filter coefficient under
unfavorable surface interactions. Journal of Colloid and Interface Science, 179(2):
631–634, 1996.
[140] Menachem Elimelech. Predicting collision efficiencies of colloidal particles in
porous media. Water Research, 26(1):1–8, 1992.
[141] Eli Goldberg and Coy P. McNew. Particle attachment efficiency database live figure,
2015. URL http://bl.ocks.org/mcnewcp/raw/3028811a3f6582c255ad/.
[142] Fabian Pedregosa, Gael Varoquaux, Alexandre Gramfort, Vincent Michel, Bertrand
Thirion, Olivier Grisel, Mathieu Blondel, Peter Prettenhofer, Ron Weiss, Vincent
Dubourg, et al. Scikit-learn: Machine learning in python. The Journal of Machine
Learning Research, 12:2825–2830, 2011.
[143] R Allan Freeze and John A Cherry. Groundwater. Prentice-Hall, 1977.
138

Appendix A
Details on Materials Characterization
A.1 Harpeth humic and fulvic acid characterization details
Table A.1: Elemental analysis and water content of HHA and HFA after DeLapp et al.[101], reproduced here with permission from the author.
NOM C
(mass
%)
H
(mass
%)
O
(mass
%)
N
(mass
%)
S
(mass
%)
P
(mass
%)
Water Content
(mass %)
Harpeth
Humic Acid
51.2 4.9 39.1 4.0 0.56 0.12 5.8
Harpeth
Fulvic Acid
43.4 3.4 49.4 1.5 0.20 0.75 5.2
Table A.2: Relative abundance of functional groups by 13C nuclear magnetic resonance(NMR) analysis of HHA and HFA after DeLapp et al. [101], reproduced here with permis-sion from the author.
NOM Alkyl
0-50
(ppm)
O-Alkyl
50-112
(ppm)
Aromatic
112-145
(ppm)
Phenolic
145-163
(ppm)
Carboxyl
163-190
(ppm)
Harpeth
Humic
Acid
0.2 0.28 0.22 0.13 0.18
Harpeth
Fulvic
Acid
0.15 0.29 0.19 0.18 0.20
139

A.2 nC60 characterization details
Figure A.1: Particle size distribution of the nC60 nanoparticle stock suspension by DLS,based on 14 independent measurements.
140

Figure A.2: Zeta potential of the nC60 stock suspension over a pH range of 3–10, by DLS.Each point represents 14 independent measurements and error bars represent a 95% confi-dence interval.
Table A.3: Temperature-dependent nC60 particle radius and relative dielectric permittivityof water used to calculate the total interaction energy between the nC60 particles and silicasensor surface.
Temperature (°C) nC60 Particle Radius (nm) εr
15 49.7 81.95
25 50.8 78.30
35 52.2 74.83
45 52.5 71.51
141

A.3 PS particle stretching details
Figure A.3: Summary of the major axis dimensions of stretched PS.
142

Figure A.4: Summary of the minor axis dimensions of stretched PS.
143

Figure A.5: Summary of the major to minor axis ratios of stretched PS.
The ellipticity (e), surface area (S), and effective diameter (de f f ) of the rod shape
stretched particles are calculated using the following equations, where s and m are the
radius of minor and major axis dimensions, respectively.
e =
√1− s2
m2 (A.1)
S = 2πs2 +2πsm
esin−1e (A.2)
de f f = 2√
s4π
(A.3)
144

Appendix B
Reynolds and Peclet Number Calculations
In order to calculate Re and Pe of the QCM-D system, a parallel-plate channel config-
uration was assumed [60].
Re =ρvL
µ(B.1)
Eq. B.1 was used to calculate the Re of the QCM-D system where ρ is the density of water,
v is the flow velocity within the chamber (2*10−4 ms−1), L is the half depth of the channel
(3.2*10−4 m), and µ is the viscosity of water.
Pe =3va3
2L2D(B.2)
D =kT
3πµd(B.3)
Eq. B.2 was used to calculate the Pe of the QCM-D system where a is the nC60 particle
radius and D is the diffusion coefficient. The diffusion coefficient was estimated using the
Stokes-Einstein equation (Eq. B.3) where k is the Boltzmann constant (1.38*10−23 JK−1),
T is the temperature (298 K), and d is the nC60 particle diameter.
145

Appendix C
Details on Grid Search Hyper Parameter Optimization with Cross Validation
For each model run, the mean 5-fold cross validation R2 score is evaluated for each
hyper parameter combination. The parameter combination resulting in the highest R2 score
is employed in the next step.
Table C.1: Grid search parameter optimization with cross validation (GSPOCV) parameterspace for the chosen machine learning method (gradient boosting regressor).
Parameter Range
Learning rate [0.01,0.1,1,3,5]
Max depth [3, 4, 5, 6, 7, 8, 9, None]
Max features [’auto’, ’sqrt’, ’log2’
Loss [’ls’, ’lad’]
Minimum Samples Leaf [2]
Following GSHPOCV, recursive feature elimination with 5-fold cross validation (RFECV)
was performed by recursively removing features of lesser importance from the training set,
which is composed of four of five folds (68% of the total data), retraining the gradient
boosting regressor on the reduced feature training set, and evaluating the performance of
the regressor to predict the remaining fold (17% of the total data) until a single feature
remained. For each of the five RFECV iterations, the RFECV routine generates 12 sets
of gradient boosted decision regressors (with the feature set size decreasing from 13 to 1)
and reports the feature set size corresponding to the highest cross-validation score (i.e.,
the ‘optimum number of features’)[142]. If two or more feature set sizes have the same
score, the smallest set size is recorded. The optimum number of features indicates the min-
imum number of features required to maximize the cross-validation score for a particular
cross-validation fold.
146