The atomic and electronic structures of NiO(001)/Au(001 ... · The atomic and electronic structures...
16
The atomic and electronic structures of NiO(001)/Au(001) interfaces A. Visikovskiy 1 , K. Mitsuhara 2 , M. Hazama 2† , M. Kohyama 3 , and Y. Kido 2 1 Department of Appl. Quantum Phys. & Nucl. Eng., Kyushu University, Fukuoka, 819-0395 Japan 2 Department of Physics, Ritsumeikan University, Kusatsu, Shiga-ken 525-8577, Japan 3 Research Institute for Ubiquitous Energy Devices, AIST, Ikeda, Osaka 563-8577, Japan Abstract The atomic and electronic structures of NiO(001)/Au(001) interfaces were analyzed by high-resolution medium energy ion scattering (MEIS) and photoelectron spectroscopy using synchrotron-radiation-light. The MEIS analysis clearly showed that O atoms were located above Au atoms at the interface and the inter-planar distance of NiO(001)/Au(001) was derived to be 2.30±0.05 Å, which were consistent with the calculations based on the density functional theory (DFT). We measured the valence band spectra and found metallic features for the NiO thickness up to 3 monolayer (ML). Relevant to the metallic features, electron energy loss analysis revealed that the band gap for NiO(001)/Au(001) reduced with decreasing the NiO thickness from 10 down to 5 ML. We also observed Au 4f lines consisting of surface, bulk, and interface components and found a significant electronic charge transfer from Au(001) to NiO(001). The present DFT calculations demonstrated the presence of an image charge beneath Ni atoms at the interface just like alkali-halide/metal interface, which may be a key issue to explain the core level shift and band structure. † Present address; Fuji Springs Co., Inc.
-
Upload
phungthuan -
Category
Documents
-
view
220 -
download
4
Transcript of The atomic and electronic structures of NiO(001)/Au(001 ... · The atomic and electronic structures...

The atomic and electronic structures of
NiO(001)/Au(001) interfaces
A. Visikovskiy1, K. Mitsuhara2, M. Hazama2†, M. Kohyama3,
and Y. Kido2 1 Department of Appl. Quantum Phys. & Nucl. Eng., Kyushu University, Fukuoka,
819-0395 Japan
2 Department of Physics, Ritsumeikan University, Kusatsu, Shiga-ken 525-8577, Japan
3 Research Institute for Ubiquitous Energy Devices, AIST, Ikeda, Osaka 563-8577, Japan
Abstract
The atomic and electronic structures of NiO(001)/Au(001) interfaces were analyzed by
high-resolution medium energy ion scattering (MEIS) and photoelectron spectroscopy
using synchrotron-radiation-light. The MEIS analysis clearly showed that O atoms were
located above Au atoms at the interface and the inter-planar distance of
NiO(001)/Au(001) was derived to be 2.30±0.05 Å, which were consistent with the
calculations based on the density functional theory (DFT). We measured the valence
band spectra and found metallic features for the NiO thickness up to 3 monolayer (ML).
Relevant to the metallic features, electron energy loss analysis revealed that the band gap
for NiO(001)/Au(001) reduced with decreasing the NiO thickness from 10 down to 5 ML.
We also observed Au 4f lines consisting of surface, bulk, and interface components and
found a significant electronic charge transfer from Au(001) to NiO(001). The present
DFT calculations demonstrated the presence of an image charge beneath Ni atoms at the
interface just like alkali-halide/metal interface, which may be a key issue to explain the
core level shift and band structure.
† Present address; Fuji Springs Co., Inc.
I. INTRODUCTION
The electronic contact between metal and oxide is an important issue in terms of
oxide electronics, which has recently attracted much attention[1-3]. It has been also
revealed that electronic charge transfers between metal and oxide supports play a crucial
role in catalytic activities, in particular, for Au nano-particles on oxide supports[4-6].
NiO is one of the most frequently utilized oxide supports as catalyst. Indeed, Au
nano-particles grown on NiO supports work well as catalyst in CO oxidation and other
reactions[7,8]. Aside from such applications, NiO is known as a typical
anti-ferromagnetic and charge transfer type insulating material[9,10]. The mechanism for
emerging large band gap of 4.3 eV is still a debatable issue. Much attention has been also
paid to the electronic and magnetic properties of the ultra-thin films dependent on the
thickness and substrate materials[11-14]. In the latter case, an electronic charge transfer
which induces an interface dipole plays a crucial role[15].
There are many reports on the interface structure of NiO(001)/Ag(001), which were
analyzed by tensor low energy electron diffraction (LEED) analysis[16,17] and by
extended X-ray absorption fine structure (EXAFS) technique[12,18]. A similar structure
is expected for NiO(001)/Au(001) but not analyzed experimentally so far. Concerning
Au deposition on NiO(001) substrates, it was reported that the Au grew initially in a
two-dimensional (2D) mode and then took a form of 3D islands[19-21] and a remarkable
chemical reduction of the NiO occurred at the interface[19,21]. It must be, here, noted
that the growth mode for NiO thin layers on Au(001) substrate is different from that for
Au on NiO(001), which will be mentioned later. As well known, the polar NiO(111)
surface is energetically unstable and thus the surface grown on Au(111) takes a
reconstructed octopolar structure [22,23]. There is also no report on the interface
structure of the NiO(111)/Au(111).
In this study, we formed epitaxially ultra-thin NiO(001) layers on Au(001) thin films,
which were also epitaxially grown on Ag(001) substrate. Then the atomic and electronic
interface structures were analyzed by high-resolution medium energy ion scattering
(MEIS) combined with photoelectron spectroscopy using synchrotron-radiation (SR)
light[24]. First we determined using MEIS the inter-layer distance of the
NiO(001)/Au(001) and which atomic species was located above the Au atoms at the
interface. Then observations of valence band as well as Au 4f core level spectra were
carried out using polarized SR light. Inelastic electron energy loss spectra were also
measured to determine the band gap of the NiO(001) stacked on the Au(001) films
dependent on the NiO thickness. The results obtained were discussed in detail
considering the ab initio calculations by VASP (Vienna ab initio simulation

package)[25,26] using the Dudarev’ approach to treat on-site Coulomb interaction in
NiO[27].
II. EXPERIMENT
We prepared a clean (1×1) surface of Ag(001) substrate by repeating Ar+-sputtering/
annealing cycle and finished by annealing at 550°C for 30 min UHV. Then an Au(001)
thin film with thickness of ~10 atomic layer was epitaxially grown at RT on the Ag(001)
substrate at a deposition rate of 0.35 ML/min. Finally, NiO(001) thin layers were grown
epitaxially on the Au(001) at a rate of 0.39
ML/min in O2 atmosphere (1×10⁻⁶ Torr) at room
temperature (RT). The thickness ranged from 1 up
to 10 mono-layer (ML: 1 ML = 2.30×10¹⁵
atoms/cm2: areal density of NiO(001), 1.20×10¹⁵
atoms/cm2 for Au(001)) and the crystalline
quality was checked by reflection high energy
electron diffraction (RHEED). Note that the
lattice mismatch between Au and Ag is 0.2 % and
that between Au and NiO is 2.2 % (lattice
constant: 4.079 Å for Au and 4.17 Å for NiO at
RT). It is essential to grow NiO(001) layers on
thin Au(001) films in order to avoid overlapping
the scattering signals from Ni and deep Au layers
in MEIS spectra. Figure 1 shows the RHEED
patterns observed at [110]-azimuth for Ag(001),
Au(001)(~10 ML)/Ag(001), and NiO(001)(2
ML)/Au(001)(~10 ML)/Ag(001), from the top to
bottom. The (20×5) reconstructed structure[28]
was seen for the Au(001) clean surface. After
NiO(2 ML) deposition, the long range ordered
structure disappeared and broad NiO(001) lines
emerged. It has to be noted that previous studies
carried out on NiO(001)/Ag(001), the system
which is supposed to resemble to NiO/Au,
showed that NiO layers covered the Ag surface
completely at the coverage of 2 ML[16]. Smaller
Ag(001)-(1x1)
10M Au(001)-(20x5)/Ag(001)
2ML NiO(001)-(1x1)
on 10 ML Au(001)/Ag(001)
Fig. 1. RHEED patterns observed for
Ag(111), 10 ML-Au(001)/Ag(001),
and 2 ML-NiO(001)/10 ML-
Au(001)/Ag(001) from the top to
bottom.

coverages result in incomplete surface occupancy. For this reason the main structural
analysis in the present work was carried out for 2ML NiO coverage, although electronic
properties of the valence band including band gap were analyzed in a wide range of NiO
thickness from 1 up to 10 ML.
The samples were then transferred to MEIS and photoemission chambers maintaining
ultra-high vacuum (UHV) conditions. Monochromated SR photons were incident on the
sample surface and emitted photoelectrons were detected by a concentric hemispherical
electrostatic analyzer (ESA) under normal emission condition. The incident photon
energy was calibrated using the second harmonic waves by measuring bulk Au 4 f5/2, 7/2
lines and the position of the Fermi level was assigned as the Fermi edge measured for a
poly-crystal Au film. We determined the work function of the hemispherical ESA
assuming the binding energy of Au 4f7/2 to be EB = 84.0 eV (bulk component). The
photoemission chamber was equipped with an electron gun, which allowed for observing
electron inelastic energy loss spectra providing the values of the band gap of NiO(001).
The photoemission and MEIS analyses together with the sample preparation were
performed in situ under UHV condition (10102 Torr) throughout the experiments.
High-resolution MEIS using 80 and 120 keV He+ ions made it possible to identify
which atom, O or Ni is located on top of Au atom at the NiO(001)/Au(001) interface and
also to determine the inter-planar distance between NiO(001) and Au(001) using the
shadowing and blocking effects. To do that, we performed Monte Carlo (MC)
simulations of He+ ion trajectories assuming the interface atomic structure to reproduce
the observed MEIS spectra. The scattering yield from atomic species j in n-th layer is
given by
in
)j(
CL
)n(
jjj cos/)n(Pc)d/d(Q)n(Y , (1)
Q, d/d j , , )n(
jc , , and in , respectively are number of incident He+ ions,
differential scattering cross section calculated from Molière potential, solid angle
subtended by the detector, number of atomic species j in the n-th layer, detection
efficiency of the position sensitive detector (0.44 as measured previously), and incident
angle with respect to surface normal. Here, is He+ fraction dependent on the surface
material and emerging energy of He+ ions and )n(P )j(
CL is the close encounter
probability for the atom j in the n-th layer, which was calculated by the MC simulations
of He ion trajectories. The value for He ions scattered from Au were measured in
advance employing thin Au films deposited on Ni(111) whose thickness was determined

by Rutherford backscattering using 2.0 MeV He+ ions and that for NiO surface was
estimated from the data obtained for rutile TiO2(110) whose surface structure was already
known.
III. RESULTS AND DISCUSSION
We first determine which atomic species, O or Ni atom is located above the Au atom at
the NiO/Au interface by means of high-resolution MEIS. Figure 2 shows the MEIS
spectrum observed for 80 keV He+ ions incident along the [110]-axis of NiO(5
ML)/Au(001)-(~10 ML)/Ag(001) and scattered to the [ 011 ] direction. Unexpectedly we
observed a broad and intense Au surface peak, which is probably due to formation of Au
clusters and partly due to tetragonal distortion of the overlying NiO(001) film[18].
Fig. 2. MEIS spectrum (circles) observed for 80 keV He+ ions incident on NiO(2 ML)/Au(10
ML)/Ag(001) at 45° and scattered to 45° with respect to surface normal at [100]-azimuth of Ag(001).
Thin solid curves denote simulated spectra from the regions covered with NiO (70 %) and with Au
clusters (30 %). Thick solid curve corresponds to simulated total MEIS spectrum. Vertical arrows
indicate the energy position for He+ ions scattered from Au and Ag atom on top of the surface.
68 69 70 71 72 73 74 75 76 77 780
20
40
60
80
100
120
beneath Au clusters
Ag Surface
Au Surface
80 keV He+ NiO(2 ML)/Au(10 AL)/Ag(001)
Scattering Angle: 90°Au
197
Ag147
Ni58,60
Scat
teri
ng
Yiel
d
Scattered He+ Energy (keV)
Observed
NiO/Au(0.7)
Au-cluster(0.3)
Total

Indeed, the observed MEIS spectrum was reproduced well by assuming Au clusters on
the NiO(001) surface with average diameter and height of 3.0 and 0.85 nm, respectively
and areal occupation of 30 %. This indicates that Au atoms were segregated on the
NiO(001) surface to form thin islands (total amount of Au islands: 4.3×10¹⁴ atoms/cm2
corresponds to ~0.35 ML). The small peak (decomposed) from Au beneath NiO(001) is
attributed to the double alignment geometry ([ 110 ]-incidence and [101]-emergence:
strong shadowing effect), while the large contribution from Au clusters indicates their
random orientation in the lateral direction. The double peak coming from Ag corresponds
to scattering components from Ag beneath NiO (70 %) and Au clusters (30 %). Note that
the probing depth of the present MEIS analysis is 5 – 10 nm maintaining a good depth
resolution. The reason why the intensity ratio of the double peak does not correlate with
the areal occupation ratio cannot be explained clearly. The randomly oriented Au clusters
in the lateral direction may increase the dechanneling fraction, which enhances the
scattering yield from the underlying Ag atoms.
Fig. 3(a) Side view of scattering geometry for 80 keV He+ ions incident at a fixed random direction
on NiO(001)-2 ML/Au(001)-10 ML/Ag(001) at [100]-azimuth. Blue, red and orange circles denote
Ni, O and Au atoms, respectively.
(a)

Fig. 3. (b) Observed angular scan spectrum (circles) for scattering component from Au as a function of
emerging angle scaled from surface normal. Thick solid and dashed curves, respectively are simulated
angular scan profiles assuming O atoms above Au and Ni atoms above Au at the interface. Pseudomorphic
NiO(001) layer stacking on Au(001) and the interlayer distance of 2.45 Å were assumed. (c) Observed
angular scan spectrum after subtracting background level to match the simulated one at emergence in
random directions. Thick solid curve is simulated spectrum assuming the surface covered with NiO(70 %)
and Au-clusters (30 %) and the interlayer distance of 2.30 Å. Dashed curve indicates the simulated
angular scan spectrum for all the surface covered with Au clusters.
0 10 20 30 40 50 60 70 80100
200
300
400
500(c)80 keV He
+ NiO(2
ML)/Au(10
ML)/Ag(001)
Scat
teri
ng
Yiel
d f
rom
Au
Emerging Angle
Observed
Au-exposed
O above Au
NiO/Au Distance: 2.30 Å
5 10 15 20 25 30 35 40 45 50 55 60 65 70
100
200
300
400
500
600
700
800
NiO/Au Distance: 2.45 Å
(b)
80 keV He+
NiO(2 ML)/Au(10 ML)/Ag(001)
Scat
teri
ng
Yiel
d f
rom
Au
Emerging Angle (deg)
Observed
Ni above Au
O above Au
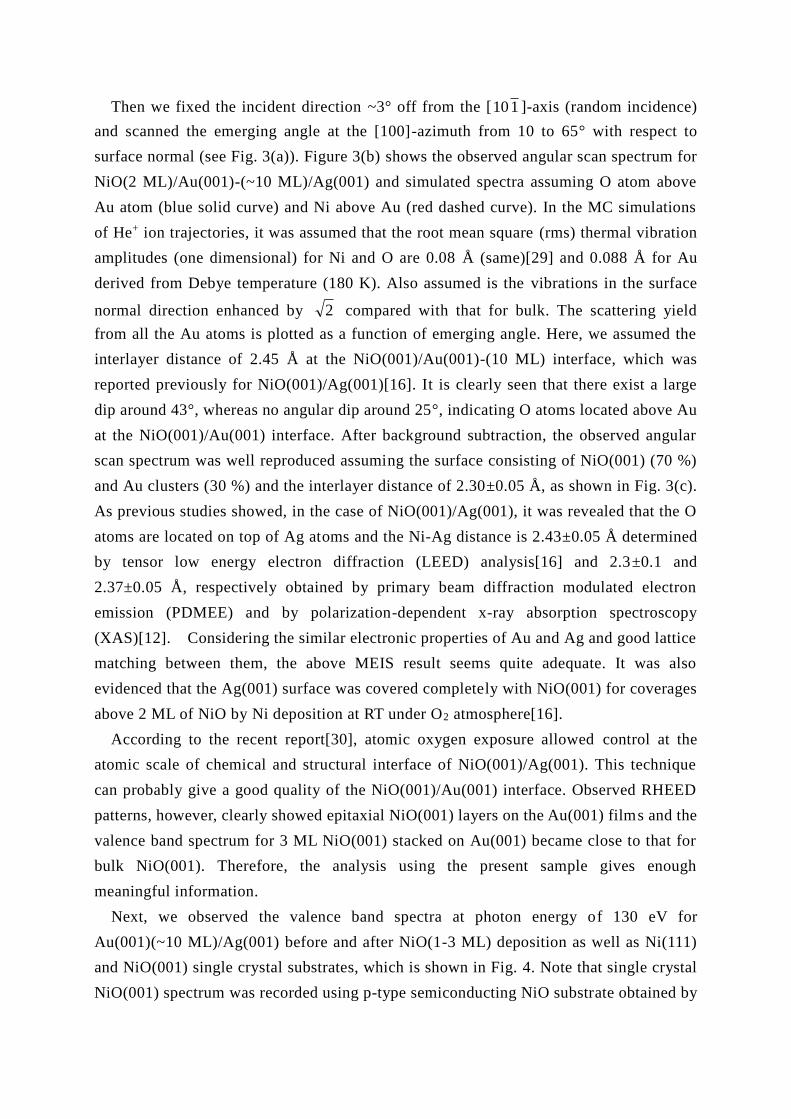
Then we fixed the incident direction ~3° off from the [ 110 ]-axis (random incidence)
and scanned the emerging angle at the [100]-azimuth from 10 to 65° with respect to
surface normal (see Fig. 3(a)). Figure 3(b) shows the observed angular scan spectrum for
NiO(2 ML)/Au(001)-(~10 ML)/Ag(001) and simulated spectra assuming O atom above
Au atom (blue solid curve) and Ni above Au (red dashed curve). In the MC simulations
of He+ ion trajectories, it was assumed that the root mean square (rms) thermal vibration
amplitudes (one dimensional) for Ni and O are 0.08 Å (same)[29] and 0.088 Å for Au
derived from Debye temperature (180 K). Also assumed is the vibrations in the surface
normal direction enhanced by 2 compared with that for bulk. The scattering yield
from all the Au atoms is plotted as a function of emerging angle. Here, we assumed the
interlayer distance of 2.45 Å at the NiO(001)/Au(001)-(10 ML) interface, which was
reported previously for NiO(001)/Ag(001)[16]. It is clearly seen that there exist a large
dip around 43°, whereas no angular dip around 25°, indicating O atoms located above Au
at the NiO(001)/Au(001) interface. After background subtraction, the observed angular
scan spectrum was well reproduced assuming the surface consisting of NiO(001) (70 %)
and Au clusters (30 %) and the interlayer distance of 2.30±0.05 Å, as shown in Fig. 3(c).
As previous studies showed, in the case of NiO(001)/Ag(001), it was revealed that the O
atoms are located on top of Ag atoms and the Ni-Ag distance is 2.43±0.05 Å determined
by tensor low energy electron diffraction (LEED) analysis[16] and 2.3±0.1 and
2.37±0.05 Å, respectively obtained by primary beam diffraction modulated electron
emission (PDMEE) and by polarization-dependent x-ray absorption spectroscopy
(XAS)[12]. Considering the similar electronic properties of Au and Ag and good lattice
matching between them, the above MEIS result seems quite adequate. It was also
evidenced that the Ag(001) surface was covered completely with NiO(001) for coverages
above 2 ML of NiO by Ni deposition at RT under O2 atmosphere[16].
According to the recent report[30], atomic oxygen exposure allowed control at the
atomic scale of chemical and structural interface of NiO(001)/Ag(001). This technique
can probably give a good quality of the NiO(001)/Au(001) interface. Observed RHEED
patterns, however, clearly showed epitaxial NiO(001) layers on the Au(001) films and the
valence band spectrum for 3 ML NiO(001) stacked on Au(001) became close to that for
bulk NiO(001). Therefore, the analysis using the present sample gives enough
meaningful information.
Next, we observed the valence band spectra at photon energy of 130 eV for
Au(001)(~10 ML)/Ag(001) before and after NiO(1-3 ML) deposition as well as Ni(111)
and NiO(001) single crystal substrates, which is shown in Fig. 4. Note that single crystal
NiO(001) spectrum was recorded using p-type semiconducting NiO substrate obtained by

annealing in UHV to avoid charge-up. In addition to Au 5d3/2 and 5d5/2 lines, a strong Ni
3d peak with metallic feature appeared at ~1 eV below the Fermi level (EF) for
NiO(001)(1 ML)/Au(001). According to Caffio et al.[16], there coexist Ni and NiO
islands at 1 ML NiO deposition and complete NiO(001) coverage was achieved after 2
ML NiO deposition on Ag(001) substrate. After stacking of 2 ML of NiO(001), the Ni 3d
peak with metallic property shifted slightly to higher binding energy side and the satellite
line from NiO appeared at 10EB eV[31]. The Ni 3d peak coincides with that coming
from bulk NiO (main line: 3d8 L−1 configuration; L: O2−) and the satellite line (3d7 L)
clearly emerged. Interestingly, the 3 ML-NiO(001) stacked on Au(001) has still a
metallic feature. This is consistent with the theoretical prediction that the NiO/Ag(001)
interfacial layer is metallized even for 5-ML NiO stacking[32]. It must be noted that the
contribution from Au 6s band is small enough not to disturb the apparent spectrum near
the Fermi edge because of its delocalized nature and a small occupancy (~1 electron)(see
the valence band spectrum for Au(001) surface in Fig. 4).
Fig. 4. Valence band spectra observed at 130 eV photon incidence for Ni(111), Au(001), NiO(1
ML)/Au(10 ML), NiO(2 ML)/Au(10 ML), NiO(3 ML)/Au(10 ML), and p-type NiO(001) crystal from
bottom to top. The cross-hatched area for Au(001) surface indicates Au 6s band. Photoelectrons
emitted to surface normal direction were detected with hemispherical electrostatic analyzer.
14 12 10 8 6 4 2 0 -2 -40.0
0.4
0.8
1.2
1.6
2.0
2.4
Au 6s bandNi Satellite
p-NiO(001)
3ML NiO
2ML NiO
1ML NiO
Au(001)
Ni(111)
EF
NiO Satellite
Ni 3d
Au 5d
Ph
oto
elec
tro
n In
ten
sity
Binding Energy (eV)

We then observed Au 4f core level for Au(001)-(5×20) surface and onto which 1, 2,
and 3 ML NiO(001) layers were grown epitaxially. Figure 5 shows the spectra measured
at incident photon energy of 130 eV under normal emission condition. For clean
Au(001)-(5×20) surface, the spectrum consists of two components; bulk and surface. The
Au 4f7/2 line appeared at 83.62 and 84.0 eV, which were identified as the surface and bulk
component, respectively[33,34]. Here, we employed the Doniach-Sunjic line shape[31]
with an asymmetric parameter α = 0.06 and full width at half maximum: FWHM = 0.32
eV, according to Hsieh et al.[33]. After NiO(001) deposition, the Au 4f line shifted to
higher EB side with increasing NiO thickness. This is due to decrease in the intensity of
the surface component and to increase in the intensity of the interface component, which
appeared at EB = 84.35 eV. The fact that the interface component takes a higher EB value
than that for Au bulk indicates electronic charge transfer from Au(001) to NiO(001).
Intuitively, the electrons bound to Au are transferred to the above O atom. This charge
transfer will be discussed later based on the ab initio calculations using VASP.
Fig. 5. Au 4f core level spectra observed at 130 eV photon incidence for Au(10 ML)/Ag(001) (upper
right), NiO(2 ML)/Au(10 ML) (lower left), NiO(3 ML)/Au(10 ML) (lower right), and total three
spectra (upper left). Spectra were decomposed into three components (thin solid curves) coming from
surface (lower EB), bulk, and interface (higher EB). Thick solid curves are best-fitted total spectra.
92 90 88 86 84 82 92 90 88 86 84 82
92 90 88 86 84 82 92 90 88 86 84 82
Au 4f5/2
Au 4f7/2
(d)(c)
(b)
NiO(3ML)/Au(001)NiO(2ML)/Au(001)
Clean Au(001)
Ph
oto
elec
tro
n In
ten
sity Au(001)-(5 x 20)
NiO 1ML/Au
NiO 2ML/Au
NiO 3ML/Au
(a)
Observed
bulk
surface
total
bulksurface
bulk
interface
Ph
oto
elec
ton
Inte
nsi
ty
Binding Energy (eV)
surface(-0.36 eV)
interface(+0.35 eV)
bulk
Binding Energy (eV)

It is interesting to see the band gap dependent on the thickness of NiO(001) on
Au(001). Electron energy loss spectroscopy (EELS) gives information on band gap (EG)
as the energy loss of the inter-band transition. Figure 6 shows the EELS spectrum
observed for 200 eV electron incidence on NiO(10 ML)/Au(10 ML)/Ag(001). The small
peak seen around 197.5 eV corresponds to excitation of Au surface plasmon[35,36],
which can be approximately expressed by a Gaussian shape. The observed spectrum can
be fitted by a Fermi-Dirac distribution coupled with a Gaussian shape, given by
}2/)EE(exp{2
A
}E/)EEexp{(1
)AA(A)E(f 22
P0
0
121
, (2)
where P0210 E,E,E,A,A,A , and are fitting parameters. The tangent of the
Fermi edge crosses the background level and the crossing point (denoted as P in a graph)
gives the energy loss due to the inter-band transition, namely the band gap EG (see Fig. 6).
We thus obtained the EG values as a function of NiO(001) thickness, which is indicated
in Fig. 7. Contrary to the usual quantum size effect, the band gap of NiO(001) decreases
with decreasing the thickness from 10 down to 5 ML. Such a phenomenon was also
reported for α-Al2O3 thin layers grown on Ru(0001) substrate[11]. This may be related to
the metallic feature of thin NiO(001) stacked on Au(001), which was predicted based on
the DFT calculations in spite of small density of states[32].
Fig. 6. EELS spectrum observed for NiO(10 ML)/Au(10 ML)/Ag(001) at 100 eV of electron impact.
Observed spectrum was best-fitted by Gaussian coupled with Boltzmann function. Crossing point P
between tangent of Fermi edge and background level corresponds to onset of inter -band transition.
0 1 2 3 4 5 6 7 8
500
1000
1500
3.0±0.2 eV
200 eV EELS
NiO(10 ML)/Au(10 ML)/Ag(001)
Au Surface Plasmon
P
Scat
tere
d E
lect
ron
Inte
nsi
ty
Inelastic Energy Loss (eV)
Observed
Total Fit
Edge Fit (Boltzmann)

We performed ab initio calculations using VASP (Vienna ab initio simulation
package)[25,26] to explain the atomic structure and electronic properties obtained in the
present study. In this calculations, the slab consists of 2 ML of a pseudomorphic
NiO(001) and of 5 ML of Au(001) with a (2×2) surface unit cell. The bottom Au(001)
layer was fixed and the other atoms were free to relax. We used the generalized gradient
approximation (GGA)[37] as the exchange-correlation potentials and projector-
augmented wave (PAW) method[38] as the basis functions. The cut-off energy for the
plane-wave basis was set to 380 eV. For k
point sampling, we employed the
Monkhorst-Pack meshes[39] of 9×9×1 for structure optimization and of 13×13×1 for
evaluation of the electronic properties. The partial occupancies for wave functions were
estimated by means of Methfessel-Paxton method[40] for the structure optimization and
by the tetrahedron method with Blöchl corrections[38] for band structure analysis. The
structure optimization calculations were continued until the Hellmann-Feynman force
acting on each atom was less than 0.01 eV/Å. In order to consider the insulating nature of
NiO, we employed the L(S)DA+U correction realized by Dudarev’ approach (local spin
density approximation + (U+J) correlation potentials)[27]. The best choice was U = 6.0
– 6.3 eV and J = 1.0 eV to give a band gap of 3.1 eV and a magnetic moment of 1.67 μB
(μB: Bohr magneton) close to the experimental values of 4.3 eV and 1.7 μB.
Fig. 7. Band gap values derived from EELS for NiO(001)/Au(001)-10 ML/Ag(001) as a function of
NiO thickness. Open squares and circles denote the data obtained using 300 and 200 eV electron
incidence, respectively.
4 5 6 7 8 9 101.4
1.6
1.8
2.0
2.2
2.4
2.6
2.8
3.0
3.2
3.4NiO(001)/Au(10 ML)/Ag(001)
Ban
d G
ap (
eV)
Thickness of NiO(001) (ML)
300 eV
200 eV

As the results, the location of the O atoms above Au at the interface is more stable by
0.16 eV/(unit cell) rather than the configuration of Ni above Au, supporting our MEIS
result, just like the location of O above Ag for the NiO(001)/Ag(001) interface[12,16].
Concerning the NiO(001)/Au(001) interlayer distance, the present VASP calculations
using the (U+J) potentials gave a larger value of 2.60±0.10 Å than the value of
2.30±0.05 Å derived from MEIS analysis. This interlayer distances are affected by choice
of exchange–correlation potential (it is commonly known that LDA sometimes
overestimates interatomic distances) and (U+J) potential values, which were chosen to
give a band gap and magnetic moment closer to the experimental values. This choice
may cause the above disagreement.
We then tried to analyze electronic charge transfer occurring between Au substrate and
NiO layers. The Bader charge analysis[41] showed very small electronic charge transfer
from NiO to Au, ~2×10⁻³ e/Å2 for 2 ML-NiO stacking and ~7×10⁻⁴ e/Å2 for 4 ML-NiO
stacking. Note that Au is an electronegative species. This is in contradiction with the
higher EB shift of the Au 4f interface component. There are other methods to estimate
electronic charge transfer such as Mulliken method. In any methods, there still exist
ambiguities to some extent. In order to perform more detailed analysis, we evaluated
quantitatively the electron charge density distribution for NiO(2 ML)/Au(5 ML), which
is indicated in Fig. 8 (left panel). The electron charge density distribution was also
calculated for separate non-interacting NiO(001) and Au parts for the same unit cell
configuration. Figure 8(b) is the difference between the charge density distributions for
interacting and non-interacting NiO/Au. Interestingly, an electron rich region emerges
beneath the bottom Ni atoms, whereas an electron lack region appears beneath the
bottom O atoms, just like the image charge which was predicted by Finnis[42] for
metal/ceramics interfaces. The electrons of metal are redistributed to form apparently
like a structure of anion above cation and cation on anion at the interface. This situation
means that the electrons of the top Au at the interface move to the region below the
bottom Ni to form the image charge distribution, which may cause the higher EB shift of
the Au 4f core line. Indeed, no Au 4f core level shift was observed for NiO(111)/Au(111)
for NiO thickness from 1 to 3 ML (not shown here). This is probably due to pure Ni/Au
interface which does not contain O atoms in that system. The image charge may also lead
to band gap narrowing, which has been studied mainly from theoretical view
point[43,44]. Unfortunately, no clear explanation has been still given. Finally, it is
pointed again that the metallic feature observed for 1-3 ML NiO(001)/Au(001) is
intimately related to the band gap narrowing probably in terms of the image charge.

IV. CONCLUSION
We first revealed by MEIS that the O atoms were located above Au atoms at the
NiO(001)/Au(001) interface. This was supported by the ab initio calculations using
VASP. The interlayer distance of 2.30±0.05 Å derived from MEIS is comparable with
that for NiO(001)/Ag(001), but significantly smaller than that (2.6±0.1 Å) predicted by
VASP. This disagreement is due to the choice of (U + J) potentials, which were taken to
give a magnetic moment and large band gap close to those for bulk NiO. Concerning the
electronic properties of the NiO/Au interface, we observed metallic features for
NiO(001)/Au(001) for NiO thickness up to 3 ML. This trend is consistent with the DFT
prediction by Thomas and Fortunelli[32]. Relevant to the metallic features, the band gap
decreased with decreasing the NiO thickness from 10 down to 5 ML. We also observed
the interface component for Au 4f core level, which shifted by 0.35 eV to higher EB side
compared with that for bulk Au. Despite that, the ab initio calculations using VASP
demonstrated no significant charge transfer, which was evaluated quantitatively by the
Bader charge analysis. We, however, found out the presence of image charge beneath the
Ni atoms at the NiO(001)/Au(001) interface, which may be a key issue to explain the
core level shift and band structure.
Fig. 8. (Left side panel) Electron charge density distribution calculated by VASP for
NiO(001)-2ML/Au(001)-5ML. (Right side panel) Difference between the charge density distributions
for interacting and non-interacting NiO/Au. Electron condensation is seen beneath the bottom Ni atoms
at the interface (image charge).
ACKMOWLEDEMENTS
The authors would like to thank M. Shibuya, A. Iwamoto, and Y. Kitsudo for their
support in the MEIS experiments. This work was partly supported by the Ministry of
Education, Japan, ‘Academic Frontier Project’.
References
[1] A. Ohtomo and H.Y. Hwang, Nature 427 (2004) 423.
[2] A.F. Santaner-Syro, O. Copie, T. Kondo, F. Fortuna, S. Pailhès, R. Weht, X.G. Qiu, F.
Bertran, A. Nicolaou, A. Taleb-Ibrahimi, P. Le Fèvre, G. Herranz, M. Bibes, N. Reyren, Y.
Apertet, P. Lecoeur, A. Barthélémy, M.J. Rozenberg, Nature 469 (2011) 189.
[3] M. D’Angelo, R. Yukawa, K. Ozawa, S. Yamamoto, T. Hirahara, S. Hasegawa, M.G.
Silly, F. Sirotti, and I. Matsuda, Phys. Rev. Lett. 108 (2012) 116802.
[4] J.G. Wang and B. Hammer, Phys. Rev. Lett. 97 (2006) 136107.
[5] H. Shi, M. Kohyama, S. Tanaka, and S. Takeda, Phys. Rev. B 80 (2009) 155413.
[6] K. Mitsuhara, M. Tagami, T. Matsuda, A. Visikovskiy, M. Takizawa, and Y. Kido, J.
Chem. Phys. 136 (2012) 124303.
[7] M. Haruta, Chem. Record 3 (2003) 75.
[8] M. Haruta, N. Yamada, T. Kobayashi, and S. Iijima, J. Catal. 115 (1989) 301.
[9] G.A. Sawatzky and J.W. Allen, Phys. Rev. Lett. 53 (1984) 2339.
[10] O. Miura and T. Fujiwara, Phys. Rev. B 77 (2008) 195124.
[11] Y. Murata, K. Nagata, H. Fujimoto, T. Sakurai, M. Okada, and Y. Ebe, J. Phys. Soc.
Jpn. 70 (2001) 793.
[12] C. Lamberti, E. Groppo, C. Prestipino, S. Casassa, A.M. Ferrari, C. Pisani, C.
Giovanardi, P. Luches, S. Valeri, and F. Boscherini, Phys. Rev. Lett. 91 (2003) 046101.
[13] D. Spanke, V. Solinus, D. Knabben, F.U. Hillebrecht, F. Ciccacci, L. Gregoratti , and
M. Marsi, Phys. Rev. B 58 (1998) 5201.
[14] C. Lamberti, Surf. Sci. Reports 53 (2004) 1.
[15] S. Casassa, A.M. Ferrari, M. Busso, and C. Pisani, J. Phys. Chem. B 106 (2002)
12978.
[16] M. Cafio, B. Cortigiani, G. Rovida, A. Atrei, C. Giovanardi, A.di Bona, and S.
Valeri, Surf. Sci. 531 (2003) 368.
[17] C. Giovanardi, A. di Bona, and S. Valeri, Phys. Rev. B 69 (2004) 075418.
[18] E. Groppo, C. Prestipino, C. Lamberti, R. Carboni, F. Boscherini, P. Luches, S.
Valeri, and S. D’Addato, Phys. Rev. B 70 (2004) 165408.

[19] R. de Masi, D. Reinicke, F. Müller, P. Steiner, and S. Hüfner, Surf. Sci. 515 (2002)
523.
[20] T. Okazawa, M. Fujiwara, T. Nishimura, T. Akita, M. Kohyama and Y. Kido, Surf.
Sci. 600 (2006) 1331.
[21] S. Benedetti, P. Torelli, P. Luches, A. Rota, and S. Valeri, Surf. Sci. 600 (2006)
4251.
[22] A. Barbier, C. Mocuta, H. Kuhlenbeck, K.F. Peters, B. Richter, and G. Renaud,
Phys. Rev. Lett. 84 (2000) 2897.
[23] T. Okazawa, T. Nishizawa, T. Nishimura and Y. Kido, Phys. Rev. B 75 (2007)
033413.
[24] Y. Kido, H. Namba, T. Nishimura, A. Ikeda, Y. Yan and A. Yagishita, Nucl. Instrum.
Methods Phys. Res. B 136-138 (1998) 798.
[25] G. Kresse and J. Hafner, Phys. Rev. B 47 (1993) 558.
[26] G. Kresse and J. Furthmüller, Phys. Rev. B 54 (1996) 11169.
[27] S.L. Dudarev, G.A. Savrasov, C.H. Hamphreys, and A.P. Sutton, Phys. Rev. B 57
(1998) 1505.
[28] D.M. Kolb and J. Schneider, Electrochem. Acta 31, 929 (1986) 929.
[29] T. Okazawa, Y. Yagi and Y. Kido, Phys. Rev. B 67 (2003) 195406.
[30] A. Rota, S. Altieri, and S. Valeri, Phys. Rev. B 79 (2009) 161401.
[31] S. Hüfner, Photoelectron Spectroscopy (Springer, 2003, Berlin).
[32] I.O. Thomas and A. Fortunelli, Eur. Phys. J. B 75 (2010) 5.
[33] T.C. Hsieh, A.P. Shapiro, and T.-C. Chiang, Phys. Rev. B 31 (1985) 2541.
[34] A. Tanaka, Y. Takeda, T. Nagasawa, H. Sasaki, Y. Kuriyama, S. Suzuki, and S. Sato,
Surf. Sci. 532 (2003) 281.
[35] H.A.E. Hagelin-Weaver, J.F. Weaver, G.B. Hoflund, and G.N. Salaita, J. Alloys
Compounds 393 (2005) 93.
[36] A. Politano and G. Chiarello, Gold Bulletin 42 (2009) 195.
[37] J.P. Perdew, K. Burke, and M. Erzerhof, Phys. Rev. Lett. 77 (1996) 3865.
[38] P.E. Blöchl, Phys. Rev. B 50 (1994) 17953.
[39] H.J. Monkhorst and J.D. Pack, Phys. Rev. B 13 (1976) 5188.
[40] M. Methfessel and A.T. Paxton, Phys. Rev. B 40 (1989) 3616.
[41] R.F.W. Bader, Atoms in Molecules -A quantum theory (Oxford University Press,
New York, 1990).
[42] M.W. Finnis, J. Phys. Condens. Mat. 8 (1996) 5811.
[43] J.P.A. Charlesworth, R.W. Godby, and R.J. Needs, Phys. Rev. Lett. 70 (1993) 1685.
[44] R. Arita, Y. Tanida, K. Kuroki, and H. Aoki, Phys. Rev. B 64 (2001) 245112.