The Astrophysics Research Process: A Vignette Alyssa A. Goodman Harvard University.
32
The Astrophysics Research Process: A Vignette Alyssa A. Goodman Harvard University
-
date post
20-Dec-2015 -
Category
Documents
-
view
218 -
download
0
Transcript of The Astrophysics Research Process: A Vignette Alyssa A. Goodman Harvard University.

The Astrophysics Research Process:A Vignette
Alyssa A. Goodman
Harvard University

Alyssa A. Goodman, Principal Investigator (CfA)João Alves (ESO, Germany)
Héctor Arce (AMNH, New York)Paola Caselli (Arcetri, Italy)
James DiFrancesco (HIA, Canada)Jonathan Foster (CfA, PhD Student)
Mark Heyer (UMASS/FCRAO)Helen Kirk (HIA, Canada)
Di Li (CfA)Doug Johnstone (HIA, Canada)
Jaime Pineda (CfA, PhD student)Naomi Ridge (CfA)
Scott Schnee (CfA, PhD student)Mario Tafalla (OAN, Spain)
Tom Wilson (ESO, Germany)
COMPLETE
The COordinated Molecular Probe Line Extinction Thermal Emission Survey

The Astrophysics Research Process:A Vignette
Alyssa A. Goodman
Harvard University


Near-Infrared
Optical

Today’s Talk
Proposal (September 8, 2004)
Data Acquisition (January 1-4, 2005)
Data Reduction (February-March 2005)
Data on Group Web Site (March 2005)
Data Analysis & Context (March 2005-)
Preparation of Publication (April 2005)
Submission (May 2005)
“Final” Reduced Data On-line (May 2005)
On-line Publication (May 2005)
Refereed Publication (September 2005)
Proposal to ResultsEstimated Timeline

E-mail thread: Part 1 (1/4-3/7)Jan. 4, 2005, AG to Jonathan Foster (2nd-year graduate student in AG’s group at Harvard)What I was trying to ask is if you want to talk by phone sometime tomorrow? Or iSight? How's the weather/observing going???
Jan. 5, 2005, JF to AGI will upload a rough-reduced image of L1448 in K (Ks actually) to the COMPLETE website. http://cfa-www.harvard.edu/COMPLETE/L1448_Ks.fits
It's fairly nifty looking, although obviously not a final reduction. In particular the extended jets and so forth are not well dealt with by the sky-subtraction routine I was using, producing a lot of the extra fake structure. There is so much neat going on in the image- and yet the most exciting thing (for extinction mapping) are the fainest, most boring stars.
March 7, 2005 JF to AGI'll send Elizabeth Lada an image to take a look at as soon as I have one I'm not ashamed to show. The problem is I've been using ESO's eclipse+jitter package, because that's what was used at the telescope, so the configuration files were already (mostly) present. Unfortunately, this software is not sufficiently powerful, flexible, or well-documented for my tastes: the two main problems being an inflexible shift/register routine which continues to mess up on some sub-frames and produce aliases, and naive sky subtraction (without using object masks) which produces incorrect sky halos around even moderately large stars.
Anyhow, it's best to switch to something more robust and configurable. After playing around with a few packages this weekend I settled on xdimsum (an IRAF package), and I think it will provide the very accurate images which are really necessary to study the faint glow (although there are inherent limitations to how well we can ever look at it since I was observing in point-source mode, without taking the extra sky images necessary to actually do extended structures). I'm still learning how to use xdimsum it properly, and at this stage it's still producing images which are ugly (and probably subtly wrong).

E-mail thread: Part 2 (3/7 cont’d.)March 7, 2005 AG to JF
Sounds wise to use the (IRAF) better software. One question, though. I'd like to make others aware of the early results at this afternoon's telecon. Is there one field that's still ugly-ish, but at least has reliable coordinates that we can try overlaying w/our IRAS, 2MASS/NICER, and/or SCUBA images by this afternoon's telecon? Just as an experiment?
March 7, 2005 JF to AG
I just tried overlaying (well, blinking in DS9) my L1448 and L1451 images on various things. The correspondence in L1448 between the 850 micron map and my image is very good - you can see the embedded sources and the brightest jets. In the CO map (I looked at 12CO integrated) it's less easy to identify features, but the bright ridge of fuzzy stuff in L1451 lines up quite well with a ridge of CO. 2MASS/NICER is too low resolution to see much of anything. I'd be very interested to overlay with N2H+, but we don't have those FITS files yet. All-in-all I found it very easy to grab the necessary files from the COMPLETE website and make this comparison, so we're doing well.
I have just these two regions for now which have WCS info in the headers. Both are available from the COMPLETE website:
http://cfa-www.harvard.edu/COMPLETE/complete_pswd/L1448_Ksw.fitshttp://cfa-www.harvard.edu/COMPLETE/complete_pswd/L1451_Ksw.fits
I'll send another e-mail to the whole COMPLETE group in just a second explaining them a little bit.

COMPLETE Data Page

E-mail thread: Part 3 (3/7 cont’d.)March 7, 2005 JF to whole COMPLETE group (before telecon)
Data reduction of the deep near-IR images of Perseus which I obtained at Calar Alto has turned up something quite strange and interesting. There is some extended, diffuse structure visible in all three bands (J, H, and Ks) in these images which is definitely real. It is too faint to show up in 2MASS, but I have been able to take a look at the second deepest near-IR image of one region (L1448, courtesy of Mashiro Tsujimoto) and the same structure appears there, somewhat hidden by higher noise.
Data reduction is still ongoing, but there are two images available through the COMPLETE website (username COMPLETE, password ••••••••••)
http://cfa-www.harvard.edu/COMPLETE/complete_pswd/L1448_Ksw.fitshttp://cfa-www.harvard.edu/COMPLETE/complete_pswd/L1451_Ksw.fits
These are Ks images of the two dark clouds at the southwest of Perseus. The two were reduced using somewhat different pipelines (thus L1451 is a strict union of the dither pattern with degraded signal at the edges, while the L1448 is trimmed to regions covered by every dither position). Both images currently have dark halos around extended objects (bright stars and jets) due to the sky subtraction algorithm used, which I will be able to fix using object masks in the final reduction, as well as series of little black holes running in an evenly spaced line down or across from the brightest pixels (which is a result of crosstalk in the detector electronics and is unfixable). Both images have WCS applied to their headers, but neither has been calibrated photometrically.
It is enlightening to overlay these images with other COMPLETE data. L1448 and the SCUBA 850 micron emission map make a particularly nice comparison. For those who are curious, the final list of images will be these two Lynds clouds, B5 (covered in four frames), one frame of B3, and two control fields taken off the cloud. All are covered in very deep H and Ks, and relatively shallower J.

The image on 3/7/05
Notice that the image is up-down reversed!

E-mail thread: Part 4 (3/9)March 9, 2005 JF to AG
So I checked out the control field which was easiest to reduce, and there's no diffuse glow in the background. This was in a pretty low extinction region, so this isn't unexpected; people have done much deeper near-IR images for cosmology in presumably pretty clear regions before, and those images show no trace of fluff.
I think my next task will be to do some photometric calibration and find out how deep the images really are.
I'll organize a page in the appropriate (password-protected) place on the COMPLETE website, and start organizing files there for easier reference.

Web page with links to
raw & reduced
data
created by JF 3/10/05

E-mail thread: Part 4 (3/9)(the start of “context”)
March 10, 2005 JF to COMPLETE group
In an effort to understand the diffuse glow in my Calar Alto images, I have overlaid Mario's N2H+ maps on top of the K-band images in L1448 and L1451 (in the south-west of Perseus).
I did this overlay as carefully as possible with only a post-script file for the N2H+ maps. Mario, if you have a data file with coordinates I would love to have it. From the centers of the maps and the labeled extents, I made a box region in DS9 of the correct size and at the correct position. I then exported this box and made the relevant portions of both files the same size. Although I cannot guarantee that the alignment is perfect, the coincidence between the dense N2H+ features and the origin of many of the outflows in L1448 is gratifying.
The end result are Photoshop files (apologies if this causes difficulties for anyone), in which you can play with the opacity of the top layer (the N2H+ map) and look for patterns; I won't bias you by suggesting what I see. Rather than e-mail around these fairly large files, I have made them available in the collaborators space:
http://cfa-www.harvard.edu/COMPLETE/data_html_pages/collab_pswd/PerA_ExtCalAlt_P.html
You will need:username = completepassword = ••••••••
Alternatively, here are direct links. Safari just displays these images which you then need to save in order to play with the opacity:
http://cfa-www.harvard.edu/COMPLETE/data/collab_pswd/L1448_Overlay.psdhttp://cfa-www.harvard.edu/COMPLETE/data/collab_pswd/L1451_Overlay.psd

Overlay of March 10, 2005

NVO
e.g. lookup of “L1448”

Aladin e.g. images
of L1448

ADS
e.g. links for “L1448”

E-mail thread: Part 5(the start of “analysis”)
Joao Alves (expert collaborator) to JF, 3/10/05
Excellent!
In the case of the 1451 you have stars through all the cores so you will be able to construct dust maps all the way into to the densest region. Not so much for 1448, but it was expected since it's happily forming stars. Still you have plenty of stars at some interesting positions.
Regarding the diffuse light, did you look into scattering as the culprit? I see similar diffuse light in B68 and other clouds (but not always) although with much less structure than in your images (but smaller FOV).
I'm sorry I missed the last telecon. I was in Porto teaching PhD students about starformation.
JF reply to Alves, 3/10/05
Scattering seems the most likely explanation, but I'm not sure how to establish definatively that that's what's going on, or how to quantify what effect (if any) this will have on extinction maps. It's a fairly significant contribution of (presumably) colored light, but on the other hand there generally aren't any stars visible through the strongest parts.
I don't see anything like in the famous B68 images - does it only show up in deeper images? I'd love to take a look at some more examples of this phenomena.

E-mail thread: Part 6(things get very exciting & colorful)
JF to AG, March 13, 2005 (written from an unrelated observing trip)
The first part of last night was cloudy, so I got some useful otherwork done. I finally got xdimsum running correctly. It does an excellent job of removing the dark halos from around bright stars, but can't do so much with fainter stuff like the fan-shaped reflection nebula in L1448.
I ran through all three L1448 colors, and you can find the results on the data website:
http://cfa-www.harvard.edu/COMPLETE/data_html_pages/collab_pswd/PerA_ExtCalAlt_P.html
In particular, the color image is quite gorgeous, with lovely red outflows and a multi-hued reflection nebula. DS9 version 3 has a nice mode for doing this, which turned out to be impossible in Photoshop since the opposite corners wouldn't register correctly in the different colors. I think this is due to some chromatic aberration in the camera. With WCS headers, DS9 registers the images correctly.
Also, I made versions of the N2H+ overlays with transparency between the contours. It's still a little hard to see much of anything without adjusting the opacity of the top layer in Photoshop. I'm not going to invest any time in this comparison method though. The inherent uncertainties in using the postscript N2H+ maps are too great. Hopefully Mario will get me full maps soon.

3/13 Image, as Optimized in Photoshop by AG (3/14/05)

E-mail thread: Part 7Is this right? Is it really “green” (brightest at “H”)?
JF to AG, w/cc to Stanek, Stubbs, Alves (to whom AG had sent the image)
The diffuse features look essentially the same in all three bands. They are brightest in H (green), but then I was aiming for the deepest image in that band.
At AAS I talked with Masahiro Tsujimoto, who imaged this region in K and X-rays. He claimed that his observations were the deepest previously taken at K. His presentation (X-ray and Near-infrared Studies of a Star-forming Cloud:L1448) is available here: http://www.astro.psu.edu/users/tsujimot/en/publication.html
I have clipped out the relevant image. This portion is near the top-left of my image. The outflow visible here is the brightest red/yellow one in my image, and the scale is roughly the same. Although significantly more blurry, the diffuse features match very well. This image was taken with a different camera (FLAMINGOS) and telescope, and almost certainly a very different dither pattern.

How much better is this?

It’s “everywhere” L1451 (not L1448)JF to AG, 3/26/05:
I finished processing the other Lynds cloud (L1451) and was playing around with the color bars. It turns out that I can easily make a lot of my image look very much like figure 1 from Nakajima (2003). That is, a red/brown central section surrounded by a blue halo. I'll try to approximate their color scale on L1448 tomorrow and see what that's like. Clearly a first model to test is the one they cite to explain their observations (Witt & Stephens 1974). It's not clear how well that will work in the regions which don't look qualitatively like a very dense clump glowing, but in general, it seems like scattered light is a likely (if somewhat boring) solution.
I'm attaching the false-color jpeg of L1451 now and will post full-resolution data files to the website later.
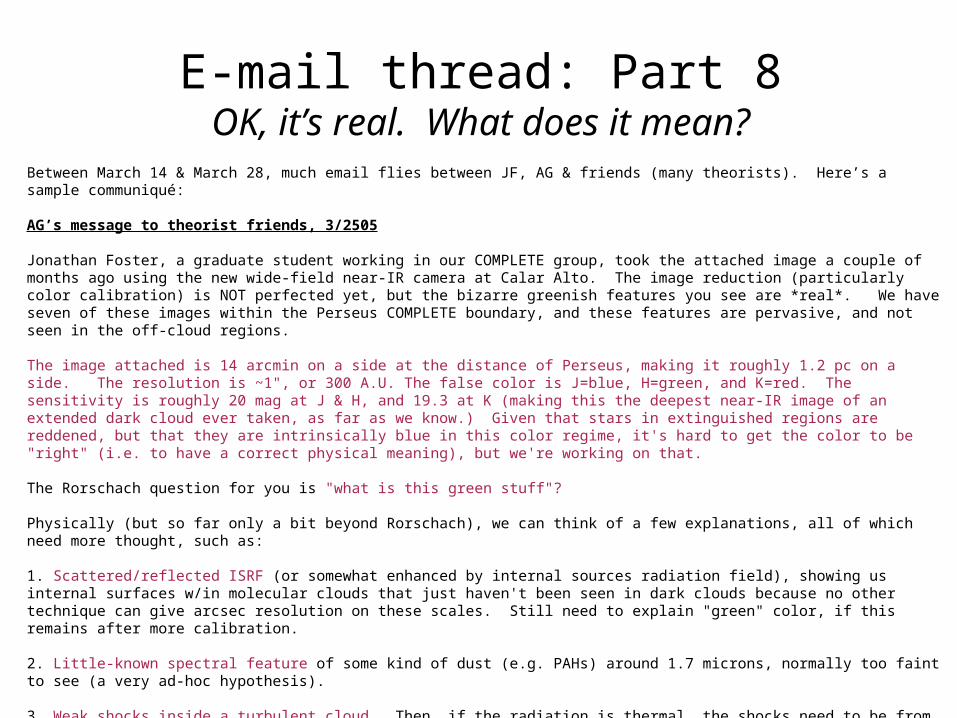
E-mail thread: Part 8OK, it’s real. What does it mean?
Between March 14 & March 28, much email flies between JF, AG & friends (many theorists). Here’s a sample communiqué:
AG’s message to theorist friends, 3/2505
Jonathan Foster, a graduate student working in our COMPLETE group, took the attached image a couple of months ago using the new wide-field near-IR camera at Calar Alto. The image reduction (particularly color calibration) is NOT perfected yet, but the bizarre greenish features you see are *real*. We have seven of these images within the Perseus COMPLETE boundary, and these features are pervasive, and not seen in the off-cloud regions.
The image attached is 14 arcmin on a side at the distance of Perseus, making it roughly 1.2 pc on a side. The resolution is ~1", or 300 A.U. The false color is J=blue, H=green, and K=red. The sensitivity is roughly 20 mag at J & H, and 19.3 at K (making this the deepest near-IR image of an extended dark cloud ever taken, as far as we know.) Given that stars in extinguished regions are reddened, but that they are intrinsically blue in this color regime, it's hard to get the color to be "right" (i.e. to have a correct physical meaning), but we're working on that.
The Rorschach question for you is "what is this green stuff"?
Physically (but so far only a bit beyond Rorschach), we can think of a few explanations, all of which need more thought, such as:
1. Scattered/reflected ISRF (or somewhat enhanced by internal sources radiation field), showing us internal surfaces w/in molecular clouds that just haven't been seen in dark clouds because no other technique can give arcsec resolution on these scales. Still need to explain "green" color, if this remains after more calibration.
2. Little-known spectral feature of some kind of dust (e.g. PAHs) around 1.7 microns, normally too faint to see (a very ad-hoc hypothesis).
3. Weak shocks inside a turbulent cloud. Then, if the radiation is thermal, the shocks need to be from VERY supersonic (e.g. 10 km/s) gas, which seems nuts outside of an outflow. (Note that the red outflow-looking stuff in the image *is* the outflows.) So, if the green glow has something to do with shocks, the emission would need to be a strange kind of line feature, bringing us back to (unlikely) #2.
Would any of you like to add more "theories" to the list, or emphatically cross off any of the ideas above?
Thanks much & hope you like the picture--it sure makes me curious...

E-mail thread: Part 8OK, it’s real. What does it mean?
Preview images sent to friends generates universal excitement over the images, and consensus among experts is that the “green” features are truly a new, unprecdentedly high-resolution, way to map (the dust distribution) in star-forming regions. Also, much discussion of “color’s” meaning.
e.g. Bruce Draine (Princeton theorist) to AG, 3/26/05
Very beautiful image! The overall structure is surely dust.
What about its color? I would think the "natural" color balance would be where hot stars look white. Then reddened stars should look red, and scattered light from dust would be expected to be blue. And you should "Luptonize" the images so that the color remains accurate even in high surface brightness regions (bright stars).
Assuming that the color balance is as above, why is the dust brightest in H? I think your hypothesis #2 must be the answer. In this connection, have a look at Figures 4 and 5 of Gordon et al 2000, ApJ 544, 859, reporting observations of the reflection nebula NGC 7023. They report observing an emission excess in the H band, peaking at about 1.5um, that they attribute to luminescence from amorphous iron disilicide FeSi_2 . Whether it's iron disilicide, I don't know, but if your photometry is accurate (and the cloud has an excess at H relative to what would be expected for scattered light) then I will bet on dust luminescence being the reason.
I don't think that weak shocks are likely be the answer -- I would not expect these to be bright in the H band. I haven't looked closely at the "red" (K bright) extended structures in the cloud, but my guess would be H2 1-0 line emission, either from uv pumping if there is a hot star present, or in shocked gas in an outflow. So the "red" regions may be shocks, but not the green ones. However, the red regions could also be extincted (reddened) reflection nebulosities.
That's my 2 cents worth. Thanks for letting me see this! I would love to see an IRAC image, to see whether the green regions correlate with 6 and 8um PAH emission (I bet they will).

“Luptonizing” for “True”
False Color
(as suggested by Draine)

E-mail thread Part 9:What will Simulations have to say?
Paolo Padoan (UCSD theorist/numericist to AG, 3/27/05):
Thanks for the preview of these beautiful images. I like Bruce's suggestion. Unfortunately Gordon et al. find the 1.5 emission band only in one of the two photodissociating filaments they study. There is no suggestion in their paper of a reason for that.
They think the grains should be nm in diameter, in which case they could trace intermediate to high density as well, but probably the 1.5 micron band would appear only in photodissociation regions. If so, what we see would be almost a projection of isosurfaces of the density structure of the cloud, at some intermediate density level.
As you point out, the reason why people have not seen this beautiful structure in clouds is merely lack of resolution, as we expect extremely rich structure in turbulent flows of course (I attach here a portion of the projected density of a 1,024^3 supersonic turbulence simulation, as an example of what one could expect to see at very high resolution...)
If you find the green color is not a strong excess in the H band, making the Gordon et al. 1.5 micron band irrelevant for your images, then it may be a little easier to try to simulate this emission.

Today’s Talk
Proposal (September 8, 2004)
Data Acquisition (January 1-4, 2005)
Data Reduction (February-March 2005)
Data on Group Web Site (March 2005)
Data Analysis & Context (March 2005-)
Preparation of Publication (April 2005)
Submission (May 2005)
“Final” Reduced Data On-line (May 2005)
On-line Publication (May 2005)
Refereed Publication (September 2005)
Proposal to ResultsEstimated Timeline