THE ASSESSMENT OF SERVICE QUALITY AND …repository.out.ac.tz/937/1/marry_temba.pdf · ·...
90
THE ASSESSMENT OF SERVICE QUALITY AND CUSTOMER SATISFACTION USING SERVQUAL MODEL: A CASE STUDY OF TANZANIA TELECOMMUNICATIONS COMPANY LIMITED (TTCL) MARY LOUIS TEMBA DISSERTATION SUBMITTED IN PARTIAL FULFILMENT OF THE REQUIREMENT FOR THE MASTERS DEGREE IN BUSINESS ADMINISTRATION OF THE OPEN UNIVERSITY OF TANZANIA 2013
-
Upload
truongtuong -
Category
Documents
-
view
228 -
download
1
Transcript of THE ASSESSMENT OF SERVICE QUALITY AND …repository.out.ac.tz/937/1/marry_temba.pdf · ·...

THE ASSESSMENT OF SERVICE QUALITY AND CUSTOMER
SATISFACTION USING SERVQUAL MODEL: A CASE STUDY OF
TANZANIA TELECOMMUNICATIONS COMPANY LIMITED (TTCL)
MARY LOUIS TEMBA
DISSERTATION SUBMITTED IN PARTIAL FULFILMENT OF THE
REQUIREMENT FOR THE MASTERS DEGREE IN BUSINESS
ADMINISTRATION OF THE OPEN UNIVERSITY OF TANZANIA
2013

ii
CERTIFICATION
The undersigned certifies that she has read and hereby recommends for acceptance
by the Open University of Tanzania, a dissertation entitled “The assessment of
service quality and customer satisfaction using SERVQUAL Model: The Case
Study of Tanzania Telecommunications Company Limited (TTCL)”, a partial
fulfillment of the requirement for the Masters of Business Administration of the
Open University of Tanzania (OUT).
………………………………………
Dr. Salum Mohamed
(Supervisor)
Date………………………………

iii
COPYRIGHT
No part of this dissertation may be reproduced, stored in any retrieval system, or
transmitted in any form by any means, electronic, mechanical, photocopying,
recording or otherwise without prior written permission of the author or the Open
University of Tanzania in that behalf.

iv
DECLARATION
I, Mary Temba, declare that this dissertation is my own original work and that it has
not been presented and will not be presented to any other University for a similar or
any other degree award.
Signature ……………………………………..
Date …………………………………….

v
DEDICATION
This dissertation is dedicated to my beloved husband Erasto Haji and our daughter
Jessica. I love them all.

vi
ACKNOWLEDGEMENTS
I would begin by sincerely thanking my supervisor; Dr Salum Mohamed for the
unyielding support that he extended to me to come up with quality write-up. I
appreciate his efforts because he offered me all the necessary guidelines I needed
during preparation of this academic paper.
I deeply thank my family and close friends for moral support and encouragements
extended during this study. Special thanks go to all questionnaire respondents for
providing on time responses and to those not mentioned for their upper hands while
preparing this dissertation finally many thanks go to the Almighty Lord God for his
blessings, strength and knowledge he extended to me while carrying out this
academic work.
vii
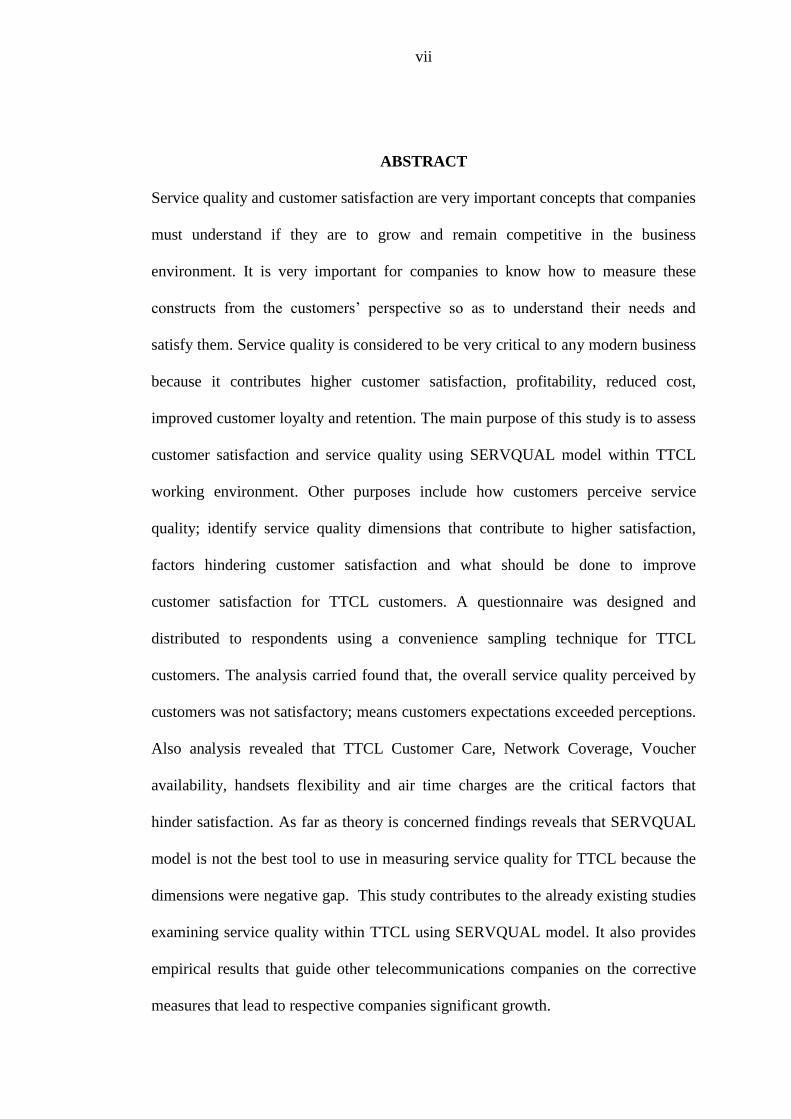
ABSTRACT
Service quality and customer satisfaction are very important concepts that companies
must understand if they are to grow and remain competitive in the business
environment. It is very important for companies to know how to measure these
constructs from the customers’ perspective so as to understand their needs and
satisfy them. Service quality is considered to be very critical to any modern business
because it contributes higher customer satisfaction, profitability, reduced cost,
improved customer loyalty and retention. The main purpose of this study is to assess
customer satisfaction and service quality using SERVQUAL model within TTCL
working environment. Other purposes include how customers perceive service
quality; identify service quality dimensions that contribute to higher satisfaction,
factors hindering customer satisfaction and what should be done to improve
customer satisfaction for TTCL customers. A questionnaire was designed and
distributed to respondents using a convenience sampling technique for TTCL
customers. The analysis carried found that, the overall service quality perceived by
customers was not satisfactory; means customers expectations exceeded perceptions.
Also analysis revealed that TTCL Customer Care, Network Coverage, Voucher
availability, handsets flexibility and air time charges are the critical factors that
hinder satisfaction. As far as theory is concerned findings reveals that SERVQUAL
model is not the best tool to use in measuring service quality for TTCL because the
dimensions were negative gap. This study contributes to the already existing studies
examining service quality within TTCL using SERVQUAL model. It also provides
empirical results that guide other telecommunications companies on the corrective
measures that lead to respective companies significant growth.

viii
TABLE OF CONTENTS
CERTIFICATION ...................................................................................................... ii
COPYRIGHT ............................................................................................................. iii
DECLARATION ........................................................................................................ iv
DEDICATION ............................................................................................................. v
ACKNOWLEDGEMENTS ...................................................................................... vi
ABSTRACT ............................................................................................................... vii
LIST OF TABLES .................................................................................................... xii
ABBREVIATIONS .................................................................................................. xiv
1.0 INTRODUCTION ................................................................................................. 1
1.1 Background of the Study....................................................................................... 1
1.2 Statement of the Research Problem ...................................................................... 2
1.3 Research Objectives .............................................................................................. 4
1.3.1 General Research Objective ................................................................................. 4
1.3.2 Specific Research Objectives ............................................................................... 4
1.4 Research Questions ................................................................................................. 5
1.4.1 General Research Question .................................................................................. 5
1.4.2 Specific Research Questions ................................................................................ 5
1.5 Significance of the Study ........................................................................................ 5
1.6 Scope of the Study .................................................................................................. 6
1.7 Organization of the Study ....................................................................................... 6

ix
CHAPTER TWO ........................................................................................................ 9
2.0 LITERATURE REVIEW .................................................................................... 9
2.1 Introduction ............................................................................................................. 9
2.2 Conceptual Definitions ........................................................................................... 9
2.2.1 Service Concept ................................................................................................... 9
2.2.2 Quality Concept ................................................................................................. 10
2.2.3 Product Quality .................................................................................................. 11
2.2.4 Service Quality Concept .................................................................................... 12
2.2.5 Customer Satisfaction ........................................................................................ 13
2.3 Theoretical Analysis ............................................................................................ 14
2.3.1 Service Quality Models ...................................................................................... 14
2.3.2 The Development and Evolution of the SERVQUAL Model ........................... 20
2.3.3 Functioning of the SERVQUAL ........................................................................ 21
2.3.4 Criticisms of SERVQUAL Model ..................................................................... 22
2.3.5 Customers’ Expectations Compared to Perceptions .......................................... 23
2.3.6 Factors that Affect Customer Satisfaction ......................................................... 25
2.3.7 Relationship Between Service Quality and Customer Satisfaction ................... 26
2.3.8 Customer Service Communication .................................................................... 27
2.3.9 Feedback in Customer Service Communication ................................................ 29
2.4 Empirical Analysis ................................................................................................ 30
2.5 Research Gap ........................................................................................................ 34
2.6 Conceptual Framework ......................................................................................... 35
2.7 Theoretical Framework ......................................................................................... 36

x
CHAPTER THREE .................................................................................................. 37
3.0 RESEARCH METHODLOGY ......................................................................... 37
3.1 Introduction ........................................................................................................... 37
3.2 Research Design .................................................................................................... 37
3.3 Area of Study ........................................................................................................ 37
3.4 Sampling Design and Procedures ......................................................................... 38
3.5 Research Approach ............................................................................................... 38
3.6 Variables and Measurement Procedures ............................................................... 38
3.7 Method of Data Collection .................................................................................... 40
3.8 Data Collection Tools ........................................................................................... 40
3.8.1 Questionnaires .................................................................................................... 40
3.8.2 Administering of Questionnaires ....................................................................... 41
3.9 Data Processing and Analysis ............................................................................... 41
3.9.1 Coding ................................................................................................................ 42
3.8.2 Re-coding ........................................................................................................... 44
CHAPTER FOUR ..................................................................................................... 45
4.0 DATA ANALYSIS AND PRESENTATIONS .................................................. 45
4.1 Introduction .......................................................................................................... 45
4.2 Demographic Characteristics of the Respondents ................................................ 45
4.3 The Overall Service Quality as Perceived by Customers in TTCL ..................... 47
4.4 Service Quality Dimensions that Brings Satisfaction in TTCL ............................ 50
4.5 Factors Hindering Customer Satisfaction in TTCL .............................................. 53
4.5.1 Network Coverage ............................................................................................. 53
4.5.2 Voucher Availability .......................................................................................... 55

xi
4.5.3 Flexibility ........................................................................................................... 56
4.5.4 Air Time Charges ............................................................................................... 57
4.5.5 Phones or Handset Prices ................................................................................... 58
4.5.6 Customer care .................................................................................................... 59
4.6 What Should be Done to Improve Customer Satisfaction in TTCL .................... 60
CHAPTER FIVE………………………………………………………….……….62
5.0 SUMMARY, CONCLUSION AND RECOMMENDATIONS…….……….62
5.1 Introduction ........................................................................................................... 63
5.2 Summary of Findings ............................................................................................ 63
5.3 Conclusion ............................................................................................................ 64
5.4 Implications of the Findings ................................................................................. 65
5.5 Recommendations ................................................................................................. 65
5.6 Limitations ............................................................................................................ 66
5.7 Suggestions for Further Research ......................................................................... 67
REFERENCES…………………………..……………...…………..……………………67
APPENDIX ................................................................................................................ 71

xii
LIST OF TABLES
Table 4.1: Personal Profile of Respondents ............................................................... 46
Table 4.2: Summary of Customer's Expectations and Gap Scores ............................. 47
Table 4.3: Average Gap Score on Expectations and Perceptions ............................... 50
Table 4.4: Ranked Service Quality Dimensions and its Average Score ..................... 53
Table 4.5: Network Coverage Satisfaction ................................................................. 54
Table 4.6: Voucher Availability ................................................................................. 55
Table 4.7: Flexibility ................................................................................................... 56
Table 4.8: Air Time Charges Satisfaction ................................................................... 57
Table 4.9: Handsets Prices Satisfaction ...................................................................... 58
Table 4.10: Customer Care ......................................................................................... 59
Table 4.11: To Determine What to be Done to Improve Customer Satisfaction in
TTCL .................................................................................................................................... 60
xiii
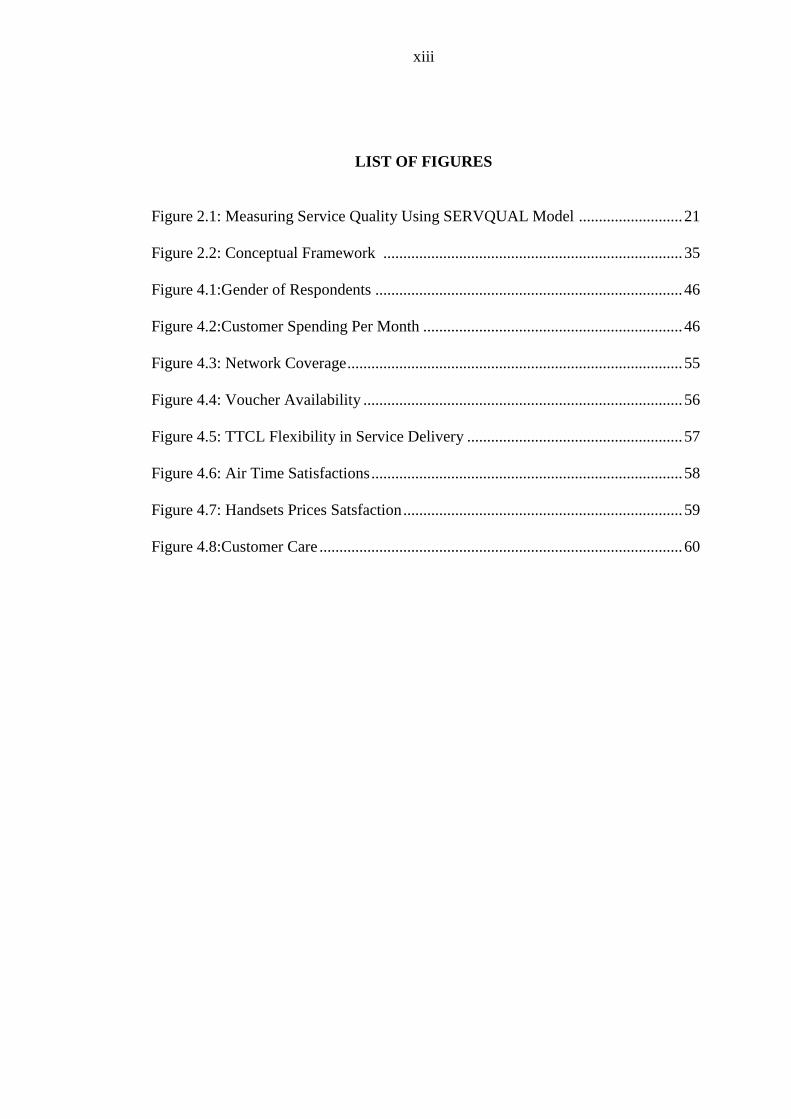
LIST OF FIGURES
Figure 2.1: Measuring Service Quality Using SERVQUAL Model .......................... 21
Figure 2.2: Conceptual Framework ........................................................................... 35
Figure 4.1:Gender of Respondents ............................................................................. 46
Figure 4.2:Customer Spending Per Month ................................................................. 46
Figure 4.3: Network Coverage .................................................................................... 55
Figure 4.4: Voucher Availability ................................................................................ 56
Figure 4.5: TTCL Flexibility in Service Delivery ...................................................... 57
Figure 4.6: Air Time Satisfactions .............................................................................. 58
Figure 4.7: Handsets Prices Satsfaction ...................................................................... 59
Figure 4.8:Customer Care ........................................................................................... 60

xiv
ABBREVIATIONS
EAC East African Community
EAP&TC East African Posts and Telecommunications Corporation
TCC Tanzania Communication Commission
TCRA Tanzania Communications Regulatory Authority
TPTC Tanzania Posts and Telecommunications Corporation
TTCL Tanzania Telecommunications Company Limited
OUT Open University of Tanzania
SERVQUAL Service quality model

1
CHAPTER ONE
1.0 INTRODUCTION
1.1 Background of the Study
Tanzania Telecommunications Company Limited (TTCL) is the oldest and largest
fixed line Telecommunications Company in Tanzania cropped from the former East
African telecommunications provider. In 1933, the former East African Post and
Telegraph Company incorporating the Tanganyikan, Kenyan and Ugandan Postal,
Telegraph and Telephone providers were formed. The East African Posts and
Telecommunication Act led to the formation of the East African Posts and
Telecommunications Administration in 1951. In 1967 the East African Community
(EAC) was founded and replaced the East African Common Service Organization;
consequently, the East African Post and Telecommunications Corporation
(EAP&TC) was established and replaced the East African Posts and
Telecommunications Administration.
The breaking up of EAC in 1977 forced EAC member countries again to re-establish
their own national Postal, Telegraph and Telephone service entities. Therefore, in
1978 an organization was established in Tanzania going with the name Tanzania
Posts and Telecommunications Corporation (TPTC). Telecommunication sector
liberalization process in 1993 in Tanzania again resulted into the splitting up of the
TPTC. In this context, the TPTC split into three separate entities, namely the
Tanzania Posts Corporation, the Tanzania Telecommunications Company Limited
(TTCL), and the Tanzania Communication Commission (TCC). TTCL was
responsible for Telecommunication services and it was established based on

2
Parliamentary Act, “The Tanzania Telecommunication Company Incorporation Act
of 1993”. TTCL officially started its operations on 1st January 1994 and its main
statutory function was to establish, develop and operate telecommunication and all
incidental services within and outside Tanzania in accordance with a license issued
by the Tanzania Communication Commission. The partial privatization of TTCL on
February 23, 2001 was one of the first steps towards full liberalization of the market
and this change marked the beginning of new era in terms of market behavior in the
country.
Changes in the telecommunications sector world-wide have also forced the
government of Tanzania to redefine its existing policy with the objective of
improving telecommunication service delivery so that it can contribute effectively to
the development of the national economy. In view of the liberalization of the
Tanzanian economy, activities such as banking, insurance, financial services, and
tourism have increased rapidly, coupled not only with a growing need for the basic
plain old telephony service (POTs) and data communication services, but also with
an increasing need for more advanced telecommunication services. This
environment has caused the management of telecommunication sector in Tanzania to
undergo drastic reform to face emerging challenges in order to provide service
quality to the customer’s satisfaction.
1.2 Statement of the Research Problem
The understanding of customer’s needs within current competitive telecoms
industry has become an important factor for service providers successes .Owing to

3
that , companies have moved from product-centric to a customer centric positions.
Satisfaction has become of great interest to practitioners because it is important to
customer retention (Patterson et al., 1997; Sedon, 1997). Available records reveals
that TTCL; the provider of both voice and data services has not achieved significant
customer base growth. The TCRA report (2011) shows that, TTCL has 3% of the
market share in terms of customer base. Still there is very low penetration rate over
many years there has been no significant customer base growth even after
deployment of new technologies. To cope with technological changes and meet
customer requirements, TTCL introduced mobile services in 2005. The introduction
of new technologies went extensively with training its workforce throughout the
country, modernization of customer service centers and customer enhancement,
coupled with lower tariff reduction. All these were done as positive steps towards
positioning itself well against the increasing competition in telecommunication
industry in Tanzania.
There is argument that despite several initiatives taken by the management of TTCL
to increase revenue creation, the overall Sales revenue performance continues to
decline. TTCL has lots of problems with its customers where most of them are
dissatisfied with the services they are getting from TTCL customer service centers.
These are discrepancies between perceived performance and expectation from
customers point of view (perceived performance is less than expectation) that make
them dissatisfied customer believes TTCL service quality can not satisfy them for
much service quality even though customer satisfaction is the major issue for
businesses that are providing telecommunication services and other related services.

4
Improved service quality in the future is the critical factor that will determine whether
the business will survive or fail (Thompson, Green &Bokma 2000). Better service
quality typically helps to get higher market share and better returns (Slu&Mou 2003)
Taking into consideration of service quality parameters for improved service
performance that is why the author assesses and uncover the applicability of TTCL
service quality and customer satisfaction using SERVQUAL model. This model
measures the difference between customers’ expectations and perceptions in terms of
performance within TTCL using various service quality dimensions including
tangibility, reliability, responsiveness, assurance and empathy. Striving at meeting or
exceeding customer expectations customers; TTCL will be able to increase market
share and maintain a high service quality within telecommunications industry.
1.3 Research Objectives
The research guided by the following objectives;
1.3.1 General Research Objective
The general objective was to assess service quality and customer satisfaction using
SERVQUAL model in TTCL
1.3.2 Specific Research Objectives
Specific objectives were;
i. To determine the overall service quality as perceived by customers within TTCL
ii. To determine service quality dimensions that brings satisfaction to TTCL customers
iii. To identify factors that hinder customer satisfaction in TTCL
iv. To determine what should be done to improve customer satisfaction in TTCL.

5
1.4 Research Questions
There were both general and specific questions.
1.4.1 General Research Question
How to assess service quality and customer satisfaction using SERVQUAL model in
TTCL?
1.4.2 Specific Research Questions
i. How do customers perceive service quality in TTCL?
ii. Which service quality dimensions brings satisfaction to TTCL customers?
iii. What are the factors hindering customer satisfaction in TTCL?
iv. What should be done to improve customer satisfaction in TTCL?
1.5 Significance of the Study
This study was significant in the following regards;
i. It will help TTCL to develop and implement effective service quality
improvement initiatives.
ii. It will serve as a valuable source of information that high lights the switching
intention of customers to other operators.
iii. It will essentially uncover dimension of service quality that TTCL customer
consider as important as well as customer’s intention to switch to other
operator.
iv. This study provides empirical support for management strategic decision in
several critical areas of their operation and to provide a justifiable valid and
reliable guide in designing workable service delivery improvement strategic
6
for creating and delivering customer value, achieving customer satisfaction
and loyalty, building long term mutually beneficial relationship with
customers and achieving sustainable growth in TTCL.
v. It will provide to the public better understanding of the organization in terms
of its services quality to customers. It is hoped that the information collected
may provide a base for improving marketing activities and services
development decisions. Also it will insist the importance of the Company to
communicate with present and potential stakeholder and the general public.
Furthermore, it is hoped that the finding of the study might stimulate further
study on other aspects concerning relationship between service quality and
customer satisfaction.
vi. Lastly, will serve as partial fulfillment of the requirements of the award on
master’s degree in business administration.
1.6 Scope of the Study
The focusing of this study is TTCL, where researcher evaluating how consumers
perceive service quality in this Company in general. This study is limited to TTCL
because the sample is drawn from the customers using TTCL services and to those
with experiences of telecom industry.
1.7 Organization of the Study
This gives a summary of each chapter of the thesis. Chapter one introduces the topic
to the reader. This chapter explains the background of the study and statement of the
problem giving a focus of the study. The Objective of the study and research

7
questions is identified. Scope of the study and organization of the study is also
identified.
This chapter two gives the literature review, where all the concepts that are
important to the study will be presented. Conceptual definitions presented, thus all
terms related to service, quality, customer satisfaction, customer expectations and
customer perception are to be identified. Theoretical and empirical analysis will also
be presented. After carefully analyzing various research studies conducted so far
using SERVQUAL model, research gap identified and conceptual framework
developed as well as theoretical framework described.
Chapter three describes how the study will be carried out, showing the measurement
of the constructs, the way data have been collected and coded. The purpose of this
chapter is to present, discuss and argue for the choices made in designing the
research framework of this study. The study is quantitative study and the research
design is case study design in which data collected from the respondents using self-
completion questionnaires in order to make the study very objective.
Chapter four discusses the data collected from the field that would enable to answer
research questions. The data collected was mainly based on respondents’
expectations and perceptions of the various items under the SERVQUAL model.
Demographic description of the respondents and factors hindering customer
satisfaction will be identified. General description of the consumers’ expectations
and perceptions of the various dimensions was done using descriptive statistics.

8
Also, gap score analysis was carried based on the difference between the
expectations and perceptions (P – E) in order to assess service quality and customer
satisfaction. The use of theory was necessary in this chapter in order to answer our
research questions.
Chapter five gives a summary of the findings have been outlined and thereby
providing answers to research questions. Theoretical, managerial implications and
finally possible recommendations from findings have been provided. Limitations and
suggestions for further research topics are mentioned in this chapter.

9
CHAPTER TWO
2.0 LITERATURE REVIEW
2.1 Introduction
This chapter reviews the literature and related models to research problem. The
chapter introduces the key concepts on customer service, service quality, customer
satisfaction, relationship between service quality and customer satisfaction. Service
quality dimensions, concept formations of customer satisfaction and empirical
analysis of the Past studies. Also it shows the research gap, conceptual framework
and theoretical framework.
2.2 Conceptual Definitions
From the title of this research work look at, to assess service quality and customer
satisfaction using SERVQUAL model, therefore all the term related to service,
quality and customer satisfaction were defined.
2.2.1 Service Concept
A study carried out by Johns, (1998, p.954) points out that a word ‘service’ has
many meanings which lead to some confusion in the way the concept is defined in
management literature, service could mean an industry, a performance, an output or
offering or a process. He further argues that services are mostly described as
‘intangible’ and their output viewed as an activity rather than a tangible object which
is not clear because some service outputs have some substantial tangible components
like physical facilities, equipments and personnel. An example of services offered by

10
TTCL, are voice services and data services which have tangibles such as sales
assistances, computers, self-service equipments, brochures. We consider tangible
components (servicescape) when assessing activities offered by TTCL in order to
understand better service activities.
2.2.2 Quality Concept
Some definitions of quality pointed out by Hardie & Walsh (1994, p.53) include;
“Quality is product performance which results in customer satisfaction freedom from
product deficiencies, which avoids customer dissatisfaction” – (Juran, 1985, p.5)
“Quality is the extent to which the customers or users believe the product or service
surpasses their needs and expectations” – (Gitlow et al. 1989). “Quality: the totality
of features and characteristics of a product that bear on its ability to satisfy stated or
implied needs”– International Standards Organization (ISO). “Quality is the total
composite product and service characteristics of marketing, engineering,
manufacture and maintenance through which the product in use will meet the
expectations of the customer” – (Feigenbaum, 1986).
Quality has been considered as being an attribute of an entity (as in property and
character), a peculiar and essential character of a product or a person (as in nature
and capacity), a degree of excellence (as in grade) and as a social status (as in rank
and aristocracy) and in order to control and improve its dimensions it must first be
defined and measured (Ghylin et al., 2008, p.75). The above definitions of quality
shed light in understand quality concept and point out that quality has many views.

11
2.2.3 Product Quality
Product quality is defined as the collection of features and characteristics of a
product that contribute to its ability to meet given requirements. The characteristic of
a product or service that satisfies the customer's wants and needs in exchange for
monetary considerations. If the consumer is satisfied that he/she had a fair exchange,
then the quality is acceptable. A perception of high quality or that which is above
expectations can help to create high brand loyalty and in turn helps create brand
equity for the company. If a consumer buys Maytag washers due to past exceptional
service, then this quality level has helped create brand loyalty.
According to Garvin, (1987) suggested eight dimensions of product quality which
are very important to customers since they lay much emphasis on quality when
buying among many similar products and they include; Performance- primary
operating characteristics of a product, Features- ‘bells and whistles’ of a product,
Reliability- probability of a product failing within a specified period of time;
Durability- measure of a product life; Conformance- degree that a product’s design
matches established standards; Serviceability- speed and competency of repair;
Aesthetics- subjective measure of how a product looks, feels, sounds, smells or
tastes; Perceived quality- subjective measure of how the product measures up against
a similar product.
In the case of TTCL, these factors play a very important role in knowing how
customers perceive service quality and therefore support in the measurement of
service quality for this study, the definition of quality used is the user-based

12
definition because quality is eventually evaluated by human and it is the most
appropriate method to examine dimensions of quality according to Ghylin et al.,
(2008, p.78). This definition of quality considers quality as subjective meaning it is
determined by the customer through his/her perceptions. This is also supported by
the view of Muffatto & Panizzolo, (1995, p.156), who believe that the most accepted
definition of quality is, defining quality as the extent to which a product and/or
service meets and/or exceeds customer’s expectation.
The relevance of this definition to our study is that quality is more important to the
customer and this therefore means that manufacturer or service provider must
consider the needs, wants and desires of customers in order to design products and
services that satisfy them. This makes it possible for us to identify factors of service
quality which are important to customers and not those that are merely based on
management’s judgments.
2.2.4 Service Quality Concept
Service quality is defined as the overall assessment of a service by the customer
(Eshghi et al., 2008, p.121). Ghylin et al., (2008, p.76) points out that, by defining
service quality, companies will be able to deliver services with higher quality level
presumably resulting in increased customer satisfaction. Understanding service
quality must involve acknowledging the characteristics of service which are
intangibility, heterogeneity and inseparability, (Parasuraman et al., 1985, p.42);
(Ladhari, 2008, p.172). In that way, service quality would be easily measured.

13
In this study, service quality can be defined as the difference between customer’s
expectation for service performance prior to the service encounter and their
perception of the service received. Customer’s expectation serves as a foundation for
evaluating service quality because, quality is high when performance exceeds
expectation and quality is low when performance does not meet their expectation
(Asubonteng et al., (1996, p.64). Expectation is viewed in service quality literature
as desires or wants of customer i.e., what they feel a service provider should offer
rather than would offer (Parasuraman et al., 1988, p.17). Perceived service is the
outcome of the customer’s view of the service dimensions, which are both technical
and functional in nature (Gronroos, 1984, p.39).
2.2.5 Customer Satisfaction
Customer satisfaction is conceptualized as been transaction-specific meaning it is
based on the customer’s experience on a particular service encounter, (Cronin &
Taylor, 1992) and also some think customer satisfaction is cumulative based on the
overall evaluation of service experience (Jones & Suh, 2000). These highlight the
fact that customer satisfaction is based on experience with service provider and also
the outcome of service. Customer satisfaction is considered as an attitude, Yi,
(1990). In the case of TTCL, there is some relationship between the customer and
the service provider and customer satisfaction will be based on the evaluation of
several interactions between both parties.
Therefore we will consider satisfaction as a part of overall customer attitudes
towards the service provider that makes up a number of measures (Levesque et

14
McDougall, 1996, p.14). Organizations that consistently satisfy their customers
enjoy higher retention levels and greater profitability due to increased customers’
loyalty, Wicks & Roethlein, (2009, p.83). This is why it is vital to keep customers
satisfied and this can be done in different ways and one way is by trying to know
their expectations and perceptions of services offered by service providers. In this
way, service quality could be assessed and thereby evaluating customer satisfaction.
In our study, we use customers to evaluate service quality by considering several
important quality attributes in TTCL and we think firms must take improvement
actions on the attributes that have a lower satisfaction level. This means customer
satisfaction will be considered on specific dimensions of service quality in order to
identify which aspects customers are satisfied with.
2.3 Theoretical Analysis
2.3.1 Service Quality Models
As stated earlier service quality has been defined differently by different people and
there is no consensus as to what the actual definition is. We have adopted the
definition by Parasuraman et al., (1988, p.5), which defines service quality as the
discrepancy between a customers’ expectation of a service and the customers’
perception of the service offering. Measuring service quality has been one of the
most recurrent topics in management literature, Parasuraman et al., (1988),
Gronroos, (1984), Cronin et al., (1992). This is because of the need to develop valid
instruments for the systematic evaluation of firms’ performance from the customer
point of view; and the association between perceived service quality and other key
organizational outcomes, Cronin et al., (2010, p.93), which has led to the

15
development of models for measuring service quality. Gilbert et al., (2004, p.372-
273) reviewed the various ways service quality can be measured. They include;
i. The expectancy-disconfirmation approach which is associated with the
identifying of customer expectation versus what they actually experienced. It
focuses on the comparison of the service performance with the customer’s
expectations. The customer’s expectations could be assessed after the service
encounter by asking him/her to recall them.
ii. Performance-only approach merely assesses service quality by merely asking
customers about their level of satisfaction with various service features
following a service encounter.
iii. Technical and functional dichotomy approaches identify two service
components that lead to customer satisfaction namely, the technical quality of
the product which is based on product characteristics such as durability,
security, physical features while functional quality is concerned with the
relationships between service provider and customer such as courtesy, speed
of delivery, helpfulness.
iv. Service quality versus service satisfaction approach which mainly focuses on
two service components that are interrelated; the transition-specific
assessment which evaluates specific features of quality and the overall
assessment which evaluates overall quality. This approach links perceived
quality at the time of the service encounter or immediately after it and overall
satisfaction with the service. Perceived quality is based on attributes of the
service over which the company has control and it is a measure of the
customer’s assessments of the service’s value without comparison to

16
customer’s expectation.
v. Attribute importance approach focuses on the relative weight on the
importance the customer places on attributes found to be linked with service
satisfaction.
vi. Parasuraman et al., 1985, (p.41-50) developed a conceptual model of service
quality where they identified five gaps that could impact the customer’s
evaluation of service quality in four different industries (retail banking, credit
card, securities brokerage and product repair and maintenance).
These gaps were;
i) Gap 1: Customer expectation - management perception gap
Service firms may not always understand what features a service must have in order
to meet customer needs and what levels of performance on those features are needed
to bring deliver high quality service. This results to affecting the way customers
evaluate service quality.
ii) Gap 2: Management perception - service quality specification gap
This gap arises when the company identifies want the customers want but the means
to deliver to expectation does not exist. Some factors that affect this gap could be
resource constraints, market conditions and management indifference. These could
affect service quality perception of the customer.
iii) Gap 3: Service quality specifications – service delivery gap
Companies could have guidelines for performing service well and treating customers
correctly but these do not mean high service quality performance is assured.

17
Employees play an important role in assuring good service quality perception and
their performance cannot be standardized. This affects the delivery of service which
has an impact on the way customers perceive service quality.
iv) Gap 4: Service delivery – external communications gap
External communications can affect not only customer expectations of service but
also customer perceptions of the delivered service. Companies can neglect to inform
customers of special efforts to assure quality that are not visible to them and this
could influence service quality perceptions by customers.
v) Gap 5: Expected Service – perceived service gap
From their study, it showed that the key to ensuring good service quality is meeting
or exceeding what customers expect from the service and that judgment of high and
low service quality depend on how customers perceive the actual performance in the
context of what they expected.Parasuraman et al., (1988), later developed the
SERVQUAL model which is a mult item scale developed to assess customer
perceptions of service quality in service and retail businesses. The scale decomposes
the notion of service quality into five constructs as follows: Tangibles, Reliability,
Responsiveness, Assurance and empathy. It bases on capturing the gap between
customers expectations and experience which could be negative or positive if the
expectation is higher than experience or expectation is less than or equal to
experience respectively.
The SERVPERF model developed by Cronin & Taylor, (1992), was derived from
the SERVQUAL model by dropping the expectations and measuring service quality

18
perceptions just by evaluating the customer’s the overall feeling towards the service.
In their study, they identified four important equations:
SERVQUAL = Performance – Expectations
Weighted SERVQUAL = importance x (performance – expectations)
SERVPERF = performance
Weighted SERFPERF = importance x (performance)
Implicitly the SERVPERF model assesses customers experience based on the same
attributes as the SERVQUAL and conforms more closely on the implications of
satisfaction and attitude literature, Cronin et al., (1992 p.64). Later, Teas, (1993,
p.23) developed the evaluated performance model (EP) in order to overcome some
of the problems associated with the gap in conceptualization of service quality
(Grönroos, 1984; Parasuraman et al., 1985, 1988). This model measures the gap
between perceived performance and the ideal amount of a feature not customers
expectation. He argues that an examination indicates that the P-E (perception –
expectation) framework is of questionable validity because of conceptual and
definitional problems involving the conceptual definition of expectations, theoretical
justification of the expectations component of the P-E framework, and measurement
validity of the expectation. He then revised expectation measures specified in the
published service quality literature to ideal amounts of the service attributes
(Teas,1993, p.18)
Brady & Cronin, (2001), proposed a multidimensional and hierarchical construct, in
which service quality is explained by three primary dimensions; interaction quality,
19
physical environment quality and outcome quality. Each of these dimensions
consists of three corresponding sub-dimensions. Interaction quality made up of
attitude, behavior and expertise; physical environment quality consisting of ambient
conditions, design and social factors while the outcome quality consists of waiting
time, tangibles and valence.
According to these authors, hierarchical and multidimensional model improves the
understanding of three basic issues about service quality:
a) What defines service quality perceptions
b) How service quality perceptions are formed
c) How important it is where the service experience takes place and this
framework can help managers as they try to improve customers’ service
experiences Brady & Cronin, (2001, p.44). Saravanan & Rao, (2007,
p.440), outlined six critical factors that customer-perceived service quality
is measured from after extensively reviewing literature and they include;
i. Human aspects of service delivery (reliability, responsiveness,
assurance, empathy)
ii. Core service (content, features)
iii. Social responsibility (improving corporate image)
iv. Systematization of service delivery (processes, procedures, systems
and technology)
v. Tangibles of service (equipments, machinery, signage, employee
appearance)
vi. Service marketing
20
From their study, they found out that these factors all lead to improved perceived
service quality, customer satisfaction and loyalty from the customer’s perspective.
According to Brady & Cronin, (2001, p.36), based on various studies, service quality
is defined by either or all of a customer’s perception regarding 1) an organisations’
technical and functional quality; 2) the service product, service delivery and service
environment; or 3) the reliability, responsiveness, empathy, assurances, and tangibles
associated with a service experience. Mittal and Lassar’s SERVQUAL-P model
reduces the original five dimensions down to four; Reliability, Responsiveness,
Personalization and Tangibles. Importantly, SERVQUAL-P includes the
Personalization dimension, which refers tothesocialcontentof interaction between
service employees and their customers (Bougoure & Lee, 2009, p.73)
2.3.2 The Development and Evolution of the SERVQUAL Model
“Parasuraman et al. (1985) identified 97 attributes which were found to have an
impact on service quality. These 97 attributes were the criteria that are important in
assessing customer’s expectations and perceptions on delivered service” (Kumar et
al., 2009, p.214). These attributes were categorized into ten dimensions
(Parasuraman et al., 1985) and later subjected the proposed 97 item instruments for
assessing service quality through two stages in order to purify the instruments and
select those with significant influences (Parasuraman et al., 1988, p.13).
The first purification stage came up with ten dimensions for assessing service
quality which were; tangibles, reliability, responsiveness, communication,
credibility, security, competence, courtesy, understanding, knowing, customers, and

21
access. They went into the second purification stage and in this stage they
concentrated on condensing scale dimensionality and reliability. They further
reduced the ten dimensions to five which were;
i. Tangibility: physical facilities, equipment, and appearance of personnel.
ii. Reliability: ability to perform the promised service dependably and
accurately.
iii. Responsiveness: willingness to help customers and provide prompt
service.
iv. Assurance: knowledge and courtesy of employees and their ability to
inspire trust and confidence.
v. Empathy: caring individualized attention the firm provides to its customers.
2.3.3 Functioning of the SERVQUAL
Figure 2.1: Measuring Service Quality Using SERVQUAL Model
Source: Kumar et al., (2009)

22
SERVQUAL represents service quality as the discrepancy between a customer's
expectations for a service offering and the customer's perceptions of the service
received, requiring respondents to answer questions about both their expectations
and their perceptions Parasuraman et al., (1988). The use of perceived as opposed to
actual service received makes the SERVQUAL measure an attitude measure that is
related to, but not the same as, satisfaction (Parasuraman et. al., 1988). The
difference between expectations and perceptions is called the gap which is the
determinant of customers’ perception of service quality as shown on Figure 2.1.
2.3.4 Criticisms of SERVQUAL Model
Notwithstanding its growing popularity and widespread application, SERVQUAL
has been subjected to a number of theoretical and operational criticisms which are
detailed below:
2.3.4.1Theoretical Criticisms
i. Paradigmatic objections: SERVQUAL is based on a disconfirmation
paradigm rather than an attitudinal paradigm; and SERVQUAL fails to
draw on established economic, statistical and psychological theory.
ii. Gaps model: there is little evidence that customers assess service quality
in terms of P – E gaps.
iii. Process orientation: SERVQUAL focuses on the process of service
delivery, not the outcomes of the service encounter.
iv. Dimensionality: SERVQUAL’s five dimensions are not universal; the
number of dimensions comprising service quality is contextualized; items

23
do not always load on to the factors which one would a priori expect; and
there is a high degree of intercorrelation between the five dimensions
(Reliability, assurance, tangible, empathy and responsiveness).
2.3.4.2 Operational Criticisms
i. Expectations: the term expectation is polysemic meaning it has different
definitions; customers use standards other than expectations to evaluate
service quality; and SERVQUAL fails to measure absolute service
quality expectations.
ii. Item composition: four or five items cannot capture the variability within
each service quality dimension.
iii. Moments of truth (MOT): customers’ assessments of service quality may
vary from MOT to MOT.
iv. Polarity: the reversed polarity of items in the scale causes respondent error.
v. Scale points: the seven-point Likert scale is flawed.
vi. Two administrations: two administrations of the instrument
(expectations and perceptions) cause boredom and confusion.
vii. Variance extracted: the over SERVQUAL score accounts for a
disappointing proportion of item variances.
2.3.5 Customers’ Expectations Compared to Perceptions
Gronroos, (1982); Parasuraman et al., (1985) have proposed that customer’s
perception of service quality is based on the comparison of their expectations (what
they feel service providers should offer) with their perceptions of the performance of
24
the service provider. Parasuraman et al., (1988, p.17) point out that expectation is
viewed differently in both satisfaction literature and service quality literature. In
satisfaction literature, expectations are considered as ‘predictions’ by customers
about what is likely to happen during a particular transaction while in service quality
literature, they are viewed as desires or wants of customers, that is, what they feels a
service provider ‘should’ offer rather than ‘would’ offer.
For this study, expectations define as desires or wants of customers because this
allows us to know exactly what service providers show offer and this is based on
based past experience and information received (Douglas & Connor, 2003, p.167). It
is important to understand and measure customer’s expectations in order to identify
any gaps in delivering services with quality that could ensure satisfaction, Negi,
(2009). Perceptions of customers are based solely on what they receive from the
service encounter (Douglas & Connor, 2003, p.167).
The study is mainly based on this discrepancy of expected service and perceived
service from the customer’s perspective. This is in order to obtain a better
knowledge of how customers perceive service quality in TTCL. We are not focusing
on the 1st four gaps because they are mainly focused on the company’s perspective
even though they have an impact on the way customers perceive service quality in
TTCL and thus help in closing the gap which arises from the difference between
customer’s expectation and perception of service quality dimensions.
Parasuraman et al., (1985, p.47) identified 10 determinants used in evaluating service
quality; reliability, responsiveness, competence, access, courtesy, communication,

25
credibility, security, understanding the customer, and tangibles. Most of these
determinants of service quality require the customer to have had some experience in
order to evaluate their level of service quality ranging from ideal quality to
completely unacceptable quality. They further linked service quality to satisfaction
by pointing out that when expected service is greater than perceive service,
perceived quality is less than satisfactory and will tend towards totally unacceptable
quality; when expected service equals perceived service, and perceived quality is
satisfactory; when expected service is less than perceived service, perceived quality
is more than satisfactory and will tend towards ideal quality (Parasuraman et al.,
1985, p.48).
2.3.6 Factors that Affect Customer Satisfaction
Matzler et al., (2002), classify factors that affect customers’ satisfaction into three
factor structures;
i. Basic factors: these are the minimum requirements that are required in a
product to prevent the customer from being dissatisfied. They do not
necessarily cause satisfaction but lead to dissatisfaction if absent. These are
those factors that lead to the fulfillment of the basic requirement for which
the product is produced. These constitute the basic attributes of the product
or service. They thus have a low impact on satisfaction even though they are
a prerequisite for satisfaction. In a nutshell competence and accessibility
ii. Performance factors: these are the factors that lead to satisfaction if fulfilled
and can lead to dissatisfaction if not fulfilled. These include reliability and
friendliness.

26
iii. Excitement factors: these are factors that increase customers’ satisfaction if
fulfilled but does not cause dissatisfaction if not fulfilled which include
project management.
2.3.7 Relationship Between Service Quality and Customer Satisfaction
According to Sureshchandar et al., (2002, p. 363), customer satisfaction should be
seen as a multi dimensional construct just as service quality meaning it can occur at
multi levels in an organization and that it should be operational zed along the same
factors on which service quality is operational zed. Parasuraman et al., (1985)
suggested that when perceived service quality is high, then it will lead to increase in
customer satisfaction. He supports that fact that service quality leads to customer
satisfaction and this is in line with Saravana & Rao, (2007, p.436) and Lee et al.,
(2000, p.226) who acknowledge that customer satisfaction is based upon the level of
service quality provided by the service provider.
Fen & Lian, (2005, p.59-60) found that both service quality and customer
satisfaction have a positive effect on customer’s re-patronage intentions showing that
both service quality and customer satisfaction have a crucial role to play in the
success and survival of any business in the competitive market. This study proved a
close link between service quality and customer satisfaction. Su et al., (2002, p.372)
carried a study to find out the link between service quality and customer satisfaction,
from their study, they came up with the conclusion that, there exist a great
dependency between both constructs and that an increase in one is likely to lead to
an increase in another. Also, they pointed out that service quality is more abstract

27
than customer satisfaction because, customer satisfaction reflects the customer’s
feelings about many encounters and experiences with service firm while service
quality may be affected by perceptions of value (benefit relative to cost) or by the
experiences of others that may not be as good.
2.3.8 Customer Service Communication
Customer service is a large concept related to various areas such as marketing,
economy, management, psychology, and then spreads to communication research
(Ford, 1994). Though service interactions are an integral part in our lives, they have
not been retained much attention in communication research (Ford, 2001). Overall,
many researchers on customer service encounter attempted to propose various
definitions to understand the con concept of customer service communication.
Customer service encounter is “a communication process in which an organizational
representative presents products or professional assistance in exchange for another
individual’s money or cooperation” (Ford, 1999:p.341).
Besides, communication of service encounters between customers. (Solomon et al.,
1995). Service encounter is also defined as “a personal (and social) interaction
between service provider and service customer” in which human behavior is
assembled (John, 1996:61). He added, a service encounter is a social encounter in
which interactions create the chance for customers and service providers to establish
relationship or assess the service quality (John, 1996). Thus, it is necessary to have
the mutual understanding of both individuals in the service encounters context.
Shostack defined service encounter as “a period of time during which a consumer
28
directly interacts with the service” (Shostack, 1985:243). According to Durvasula,
this definition is more broadly and implies several factors such as "personnel and
physical facilities" that related to a service process (Durvasula et al., 2005:2). and
employees is a human dyadic interaction and is interdependent each parties.
Customer service encounter have different outcomes that are emphasized by service
organizations, for instance, customer satisfaction, customer loyalty, customer
relationship or service quality, etc. Building relationship with customers was chosen
as the focused issue for this research. In customer service communication, building
relationship with customer is one of the primary goals of service organizations, in
particular service organizations as Koermer stated: “building relationships with
customers is an important part of conducting business” (Koermer, 2005:247). In
building relationship with customer, service encounters are considered as an early
sign to predict the development or discontinuation of a provider-customer
relationship (Bolton, 1998). Koermer believed also that “one could ascertain that the
communicative interplay between providers and customers plays a significant role in
fostering relational development” (Koermer, 2005:248). Overall, effective customer
service encounter is the fundamental part for organization's success and customer
relationship retention (Julian & Ramaseshan, 1994).
From different definitions and perspectives on the customer-employee relationships
by researchers in customer service, we can find that customer and service provider
are the two important elements involving in an interaction of service encounter. The

29
authors believed that customer in a service encounter would be enjoyable and
satisfying through contacting with helpful, experienced and pleasant service
employee. By doing so, customer will stay loyalty and organization can retain
relationship with customer. In reality, customer is a critical factor for activities and
existence of an organization, in particular organizations that provide service to
customers.
Deng et al. (2010) argued that how to satisfy and maintain relationship with
customers in order to have customer loyalty is the essential survival of profit
organizations. Therefore, it is needed for organizations to understand the connection
between customers’ satisfaction and their durability of relationship with service
provider (Bolton, 1998). Furthermore, organizations need to have policies for the
"customer gratitude" (Palmatier et al., 2009) to have long-term relationship with
customers.
2.3.9 Feedback in Customer Service Communication
Feedback plays a crucial role in communication. Feedback makes sense and
effective for communication. In the context of service, feedback is a channel where
customers can express their needs, perspectives or judgments about organizations’
activities and performances. Thus, feedback allows organizations to assess the
effectiveness of their service quality and customers' satisfaction. According to
Crowell et al, "feedback may serve more as a consequence than as an antecedent in
the control of behavior" (Crowell et al.,1988:66).
30
Sources of feedback can be diverse but customers would be the best reference and
primary source of information for organizations’ feedback because of frequent and
direct interactions with service providers. From customers, organizations can learn
new and interesting information that can help them to improve their service more
successful and productive. In doing so, the process of improvement of these
organizations may occur faster than those do not acquire any feedback from
customers (Voss et al., 2004). Thus, it is critical for organizations to encourage
feedback from customers.
Feedback that organizations received can be positive or negative. Negative feedback
is a sign of customers’ dissatisfaction and indicates that organization’s service does
not meet customer’s needs. Meanwhile positive feedback confirms the good service
quality of organizations that allow them to reinforce relationship with customers.
Voss et al. believed that “customer feedback is an often-overlooked factor in
explaining the relationship between service quality and customer satisfaction” (Voss
et al., 2004:212).
2.4 Empirical Analysis
According to Negi, (2009, p.33), the idea of linking service quality and customer
satisfaction has existed for a long time. He carried a study to investigate the
relevance of customer-perceived service quality in determining customer overall
satisfaction in the context of mobile services (telecommunication) and he found out
that reliability and network quality (an additional factor) are the key factors in
evaluating overall service quality but also highlighted that tangibles, empathy and

31
assurance should not be neglected when evaluating perceived service quality and
customer satisfaction.
This study was based only on a specific service product in telecom industry (mobile
service) and we think it is very important to identify and evaluate those factors
which contribute significantly to determination of customer-perceived service
quality and overall satisfaction. Researchers have yet to come to conclusion on the
antecedents to service quality and satisfaction. A study carried out by Bitner (1990)
on 145 tourists in international airport suggests satisfaction as antecedent to service
quality (satisfaction-service quality). On the other hand ,there are many other
researcher who concluded that service quality is antecedent to customer satisfaction
(Ahmad and Kamal,2002;Cronin and Taylor,1992;Yavas et al,.1997). Kumar et al,
(2009) used the SERVQUAL model in a research to determine the relative
importance of critical factors in delivering service quality of banks in Malaysia
(Kumar et al., 2009, p.211).
In this article they modified the SERVQUAL model and considered six dimensions;
tangibility, reliability, responsiveness, assurance empathy and convenience and these
consist of 26 statements. They considered convenience because it is an important
determinant of satisfaction for banking customers in Malaysia and contributes very
highly in the customers’ appreciation of the quality of services offered by the bank
(Kumar et al, 2009, p. 214). The respondents are asked questions based on the 26
statements and they seek to know about their expectations and experience. They
carried this study on banking customers regardless neither of which bank you use nor

32
how you do your transactions, could be domestically, internationally among others
(Kumar et al, 2009, p.215).
After they carried out their study they realized that there are four critical factors;
tangibility, reliability, convenience and competence. These variables had significant
differences between expectations and perceptions with tangibility having the
smallest gap and convenience has the largest gap. They end up with the
recommendation that banks need to be more competent in delivering their services
and fulfilling the assurance of customers and providing the banking services more
conveniently (Kumar et al, 2009, p.211). Curry et al., (2002, p.197) in an attempt to
assess the quality of physiotherapy services used the SERVQUAL model and three
physiotherapy services in Dundee, Scotland.
They considered the ten original criteria for evaluation and combined them into five;
tangibles, reliability, responsiveness, assurance (including competence, courtesy,
credibility, and security) and empathy (including access, communication, and
understanding). The quality gap is measured with these five dimensions with the
application of an adaptable 22 item survey instruments. The survey involves
questions relating to customers expectations and perceptions. They sought to
measure five gaps developed by Parasuraman et al., (1985).
They found out that the services were highly appreciated by customers even though
they realized that the perception gaps were slightly negative and the services could
be improved. Their studies proved that assurance and empathy were very important
in their research. In spite of the criticisms of the SERVQUAL model they confirm its

33
potential applicability in measuring service quality in the public sector to determine
consumer priorities and measure performance. Badri et al., (2003) made an
assessment and application of the SERVQUAL model in measuring service quality
in information technology centre. For their research gap they used a larger sample
which also differs from other studies that addressed the dimensionality problem of
the IT centre-adapted SERVQUAL instruments. The second gap was to identify the
gaps in service quality in the IT centres in the three institutions of higher education
in the United Arab Emirates. Their findings showed that there was an inadequacy of
dimensions for a perfect fit.
On the other hand, based on their feedback, respondents felt that SERVQUAL is a
useful indicator for IT center service quality in institutions of higher education.
SERVQUAL identified gaps in service quality for the three institutions. Empirical
results of SERVQUAL scores for the IT centers in the three institutions are also
presented. Negi, (2009, p.31-38) used the model to determine customer satisfaction
through perceived quality in the Telecommunication industry and found out that
reliability, empathy and network quality proved to significantly effective in
contributing to overall service quality and overall customer satisfaction with mobile
services. Akan, (1995, p.39-43) used the SERVQUAL model in the four stars hotels
and found out that competence and courtesy combined with assurance where most
important attributes influencing the perception of quality.
In a nutshell, try to apply this instrument in the context of TTCL and find if its
dimensions do measure service quality and customer satisfaction, hence are adequate

34
for a perfect measure of the constructs. This will also enable to identify gaps in
service quality and find out what dimensions consumers are satisfied with. The study
by Urio was on “factors influencing customers to move from TTCL to other mobile
companies “that was done in the year 2011 at Mzumbe university. The study took
TTCL as case study. where the findings was that, high price charged by TTCL, lack
promotion campaigns and lack of innovative products and services which can retain
customer not to move to other mobile companies.
While this study intend to assess the service quality and customer satisfaction using
SEVQUAL model within a company. These differences are expected to influence
the result of the study, although they may be somehow related. Urio study look at
high price charged by TTCL, poor innovative product and promotion campaign still
lack critical analysis on key dimensions of service quality that lead to customer
satisfaction that TTCL should focus.
2.5 Research Gap
After carefully analyzing various research studies conducted so far using the
SERVQUAL model, has been realized that many research works have been carried
in different service industries such as education, restaurants, banking, health care,
etc, but limited empirical study has been conducted using the SERVQUAL model to
assess service quality in telecommunication industry. Researcher considers
telecommunication industry as part of the service industry providing voice services
and data services.

35
There are some of research which find out the relationship between perceived
service quality, customer satisfaction and customer loyalty and it was proven that
perceived service quality had a positive relationship with customer satisfaction and
this supports the argument of linking service quality and customer satisfaction. They
did not use the SERVQUAL model but rather the performance to assess service
quality. Therefore using the SERVQUAL model would be a contribution to existing
research on TTCL. This is the research gap and in order to fill the gap, try to
measure service quality and customer satisfaction using the SERVQUAL model
from the customer’s perspective in order to know their perceptions.
2.6 Conceptual Framework
The conceptual framework (Figure 2.2) explains the underlying process, which is
applied to guide this study.
Figure 2.2: Conceptual Framework
Source: From field data (2012)
Service quality dimensions
Tangibles
Reliability
Assurance
Empathy
Responsiveness
Service expectation
Service
Performance
Perceived
Service
Quality
Customer
Satisfaction

36
2.7 Theoretical Framework
As shown in Figure 2.2, the SERVQUAL model is suitable for measuring service
quality and customer satisfaction in TTCL offering telecommunication. The same
dimensions used to measure both service quality and customer satisfaction because it
assumed both are related (Parasuraman et al., 1988) and customer satisfaction is an
antecedent of service quality (Negi, 2009). The SERVQUAL approach integrates the
two constructs and suggests that perceived service quality is an antecedent to
satisfaction (Negi, 2009, p.33). Therefore, in this research, the initial 20 items of
SERVQUAL model (in the attached appendix) are modified to measure the
perceived service quality and customer satisfaction in TTCL. The model is a
summary for the 20-items and researcher want to find out the overall service quality
perceived by customers and which dimensions customers are satisfied with.

37
CHAPTER THREE
3.1 RESEARCH METHODOLOGY
3.1 Introduction
This chapter gives a brief description on how this research conducted. This include
research design, research approach, sampling design, variables and measurement
procedures, method of data collection and data analysis.
3.2 Research Design
Research design is a plan or strategies to use to achieve the expected results. There
are different types of research design depending on the nature of a particular study.
This includes case study design survey study and experimental design study (Cooper
et al, 1998). This study carried out using a Case Study Design. Case study involved
when researchers want to gain a rich understanding of the context in the research.
This method provides flexibility because it allows the use of different data collection
methods such as interviews, questionnaires, observations and documentary
review.(Saunders et al.,2009) Also, it is depth and breadth study of variables and
maintains a unitary nature of the unity of inquiry over a range of variables. It allows
the use of triangulation which is important in the process of validation data.
3.3 Area of Study
The survey study conducted in Dare s salaam because all required sample space
represented here. Performing this study in Dar es salaam saved money that could
have been spent if other distant areas were to be involved.

38
3.4 Sampling Design and Procedures
The sampling procedure involves was non probabilistic sampling because the
research is Case study design. According to Saunder (2009) non probability
sampling (or non-random sampling) provides a range of alternative techniques to
select samples based on your subjective judgment to answer research questions and
meet the objectives. Non-probability sampling techniques also provide researcher
with the opportunity to select the sample purposively and to reach difficult-to-
identify members of the population. The researcher followed appropriate procedure
to avoid errors that may occur and cost the whole study.
3.5 Research Approach
According to Saunders et al., (2009), there are two main research approaches:
deduction and induction. With deduction a theory and hypothesis (or hypotheses) are
developed and a research strategy designed to test the hypothesis. With induction,
data are collected and a theory developed as a result of the data analysis. At this
study researcher used induction approach because there was no hypothesis testing
and data was qualitative in nature.
3.6 Variables and Measurement Procedures
There are two types of variables which are dependent and independent variables. A
dependent variable changes in response to changes in other variables. An
independent variable causes changes in a dependent variable Saunder (2009). For
this study dependent variables was customer satisfaction where independent
variables was service quality dimensions where any change to any dimension

39
resulted into change in satisfaction level.
The SERVQUAL model is used to assess customers’ expectations and perceptions
regarding service quality in TTCL. Both expectations and perceptions are measured
using a 5-point scale to rate their level of agreement or disagreement (1- strongly
disagree and 5- strongly agree), on which the higher numbers indicate higher level of
expectation or perceptions. Perceptions are based on the actual service they receive
in TTCL while expectations are based on past experiences and information received
about TTCL. Service quality scores are the difference between the perception and
expectation scores (P-E) with a possible range of values from -4 to +4 (-4 stands for
very dissatisfied and +4 means very satisfied). The quality score measures the
service gap or the degree to which expectations exceed perceptions. The more
positive the P-E scores, the higher the level of service quality leading to a higher
level of customer satisfaction. Satisfaction and service quality are both treated
together as functions of a customer’s perceptions and expectations. In most cases,
when expectation and perception are equal, service quality is satisfactory.
In this study, we use the disconfirmation paradigm which is based on the
discrepancy theories. According to this paradigm, consumer’s satisfaction judgments
are the result of consumer’s perceptions of the difference between their perception of
performance and their expectations. Positive disconfirmation leads to increased
satisfaction while negative disconfirmation leads to decreased satisfaction. This
theory has been used to develop questionnaire.

40
3.7 Method of Data Collection
Both primary and secondary data sources used to answer research questions. Primary
data was mainly obtained through the administered questionnaires. Questionnaire as
a general term to include all techniques of data collection in which each person
asked to respond to the same set of questions in a predetermined order (deVaus
2002). Researcher used self administered questionnaires where it administered
electronically using e mail and posted to respondents who return them by mail after
completion. Secondary data sources like past studies and archives was accessed from
various databases like, OUT database, TTCL in order to obtain some reliable
literature and empirical findings that applied in order to have a better understanding
the service quality construct and how the SERVQUAL model can be used to
measure it.
3.8 Data Collection Tools
3.8.1 Questionnaires
The SERVQUAL 5 dimensions (Tangibles, Reliability, Responsiveness, Assurance,
and Empathy) were used which are subdivided into 20 statements, which were
directed to measuring service quality in TTCL. As stipulated by the SERVQUAL
model, the statements are divided into two parts, the first part seeks to measure the
expectations of customers and the second part seeks to measure their perceptions.
There was also a part which measure satisfaction level for the purpose of knowing
factors that hinders satisfaction, the measures to be taken to improve customer
satisfaction and the last party which is demographic part that provides general
information about respondents on age, gender, and average monthly expenditures.

41
This was to enable to get a better understanding of the type of respondents and relate
it to how they perceive service quality in TTCL. The SERVQUAL model was used
as the basis for the structured questionnaire because it provides information in
research questions in which it trying to show how customers perceive service quality
in TTCL by assessing the difference between the expectation and perception of
services experienced by customers in TTCL. This enabled to know how perceived
service quality by customers and identify which items in the SERVQUAL
dimensions customers are satisfied with. Also factors that hinder customer
satisfaction in TTCL and what should be done to improve customer satisfaction.
3.8.2 Administering of Questionnaires
As mentioned earlier in this study, a convenience sampling technique has used and
had 175 questionnaires to administer which it took 7 days to administer these 175
questionnaires but unfortunately I only received 151 questionnaires that were
complete. This was because some people got the questionnaires and went away with
them and others did not completely answer the questions and so considered them
invalid.
3.9 Data Processing and Analysis
Data analysis refers to examining what has been collected in survey or experiment
and making deductions and inferences. Furthermore, data analysis is computation
of certain measures along with searching for patterns of relationship that exist among
data-groups. Whereas, data processing consists of a number of closely related
operations: editing, classification, coding, and tabulation. Data collected from

42
respondents and documents was processed, that was editing, classification, coding
and tabulation. All completed questionnaires/schedules thoroughly checked for
completeness, accuracy and uniformity. The raw data obtained from field was
prepared for analysis by transforming all of them into codes and entering into
spreadsheet packages. The analysis based on quantitative data to be collected and
some extent the qualitative information from questionnaires.
3.9.1 Coding
The SERVQUAL dimensions/items are main variables used in this study and coded
these dimensions/items in order to ease analysis of data collected. Also, demographic
information was collected from respondents and these variables have to be coded as
well for analysis. Here is the coding of the variables for analysis.
SERVQUAL Dimensions/Items
Tangibles (TA)
TA1 TTCLs have up-to-date equipments.
TA2 Physical facilities are virtually appealing.
TA3 Employees are well dressed and appear neat.
TA4 Physical environment of the TTCL is clean.
Reliability (RL)
RL1 When they promise to do something by a certain time, they do it.
RL2 When customer has a problem, they should show sincere interest in solving the
problem.
RL3 TTCLs perform the service right the first time.

43
RL4 They provide their services at the time they promise to do so.
RL5 TTCLs keep their records accurately.
Responsiveness (RN)
RN1 Employees make information easily obtainable by customers.
RN2 Employees give prompt services to customers.
RN3 Employees are always willing to help customers.
RN4 Employees are never too busy to respond to customers requests.
Assurance (AS)
AS1 The behavior of employees instill confidence in customers
AS2 Customers feel safe in their transactions with the employees
AS3 Employees are polite to customers.
AS4 Employees of TTCLs have knowledge to answer customers’ questions.
Empathy (EM)
EM1 TTCLs give customers individual attention.
EM2 Operating hours of TTCLs is convenient to customers.
EM3 Employees of TTCLs give customers personal service.
EM4 TTCLs have their customers’ interest at heart.
EM5 Employees of TTCLs understand the specific needs of their customers.
Demographics (DM)
DM1 Gender (0=male, 1=female)
DM2 TTCL spending per month (0=0 to 5,000,000tshs, 1=5,000,000 to
15,000,000tshs, 2=15,000,000 to 15,000,000tshs, 3=above 25,000,000tshs

44
3.9.2 Re-coding
TA- Average gap score for tangible items = (TA1+TA2+TA3+TA4)/4
RL- Average gap score for reliability items = (RL1+RL2+RL3+RL4+RL5)/5
RN- Average gap score for responsiveness items = (RN1+RN2+RN3+RN4)/4
AS- Average gap score for assurance items = (AS1+AS2+AS3+AS4)/4
EM- Average gap score for empathy items = (EM1+EM2+EM3+EM4+EM5)/5
OSQ- Overall service quality = (TA+RL+RN+AS+EM)/5

45
CHAPTER FOUR
4.0 DATA ANALYSIS AND PRESENTATIONS
4 .1 Introduction
This chapter presents and discusses findings of data from the field on assessing
customer satisfaction and service quality using SERVQUAL model in TTCL, The
study was aimed at to determine overall service quality perceived by customer,
service quality dimensions that brings satisfaction, factors hindering customer
satisfaction in TTCL and to determine what should be done to improve customer
satisfaction.Data analysis for this study was done in two steps, the preliminary
analysis and the main analysis. For preliminary analysis which involves mainly
descriptive statistics to summarize data, the demographic characteristics of the
respondents were outlined in order to simplify the understanding of the data. The
main analysis involved the gap score analysis whereby descriptive statistics were
applied to summarize means of perceptions and expectations of customers. We
calculate the perception minus expectation scores for each item and dimension in
order to identify the service quality gaps.
4.2 Demographic Characteristics of the Respondents
The demographic profile of the respondents is described as follows; males were
46.4% while females were 53.6% slightly higher than males. TTCL spending per
month shows that, 52.3% claimed that they spend between tshs 5,000,000 to
15,000,000 for TTCL services, followed by 25.8% who spend tshs 0 to 5,000,000,
17.2% spend tshs 15,000,000 to 25,000,000 and 4.7% spend above tshs 25, 000,000
TTCL services. This presented in the Figure4.1.

46
Table 4.1: Personal Profile of Respondents
Characteristics Description Percentage (%)
Gender Male 46.4
Female 53.6
TTCL spending per month
(In Tshs)
0-5,000,000 25.8
5000,000-15,000,000 52.3
15,000,000-25,000,000 17.2
Above 25,000,0000 4.7
Source: Field data (2012)
Figure 4.1:Gender of Respondents
Source: Field data
Figure 4.2: Customer Spending Per Month at TTCL
Source:Field data

47
4.3 The Overall Service Quality as Perceived by Customers in TTCL
Table 4.2: Summary of Customer's Expectations and Gap Scores
Dimension Statement
Expectation
Score in
Percentage
Perception
Score in
Percentage
Gap Score
in
Percentage
Overal
Gap
Score
Tangibles TA1 4 2 -2
TA2 5 3 -2
TA3 5 3 -2
TA4 4 3 -1 -7
Reliability RL1 4 3 -1
RL2 4 2 -1
RL3 5 4 -1
RL4 3 1 -2
RL5 2 1 -1 -9
Responsiveness RN1 4 2 -2
RN2 4 3 -1
RN3 5 5 0
RN4 5 5 0 -3
Assurance AS1 4 3 -1
AS2 5 4 -1
AS3 4 2 -1
AS4 6 1 -5 -8
Empathy EM1 5 4 -1
EM2 5 3 -2
EM3 5 1 -4
EM4 5 4 -1
EM5 5 4 -1 -9
Source: Field data (2012)

48
Expectations and perceptions were both measured using the 5-point likert scale
whereby the higher numbers indicate higher level of expectation or perception. In
general, customer expectation exceeded the perceived level of service shown by the
perception scores. This resulted in a negative gap score (Perception – Expectation).
According to Parasuraman et al., (1988, p.30) it is however common for customer’s
expectation to exceed the actual service perceived and this signifies that there is
always need for improvement.
The items with the highest expectation scores were TTCLs have up-to-date
equipments, physical facilities are virtually appealing, TTCLs perform the service
right the first time, employees are always willing to help customers, and employees
are never too busy to respond to customers requests, Customers feel safe in their
transactions with the employees, employees of TTCLs have knowledge to answer
customers’ questions, TTCLs give customers individual attention, operating hours of
TTCLs are convenient to customers, employees of TTCLs give customers personal
service, TTCLs have their customers’ interest at heart and employees of TTCLs
understand the specific needs of their customers.
However, these scores are not very different from scores of other items and this
implies generally, customers expect very high from TTCL. The items rated highest
for actual service perceived were, TTCLs perform the service right the first time,
employees are always willing to help customers, employees are never too busy to
respond to customers requests, employees of TTCLs have knowledge to answer
customers’ questions, TTCLs give customers individual attention, TTCLs have their

49
customers’ interest at heart and employees of TTCLs understand the specific needs of
their customers.
There is no so much difference between the scores of perceptions but are generally
lower than expectations. The gap scores are the difference between the perception
and expectation scores, and these gap scores measure service quality and hence
customer satisfaction. The more perceptions are close to expectations, the higher the
perceived level of quality. The largest gaps scores were employees of TTCLs have
knowledge to answer customers’ questions and Employees of TTCLs give customers
personal service.
Summarily, overall perceived service quality is low (-8.1) meaning the level of
service they receive is lower than what they expect indicating there is no satisfaction.
Parasuraman et al., (1985) suggested that when perceived service quality is high,
then it will lead to increase in customer satisfaction. He supports the fact that service
quality leads to customer satisfaction and this is in line with Saravana & Rao, (2007,
p.436) and Lee et al., (2000, p.226) acknowledge that customer satisfaction is based
upon the level of service quality provided by the service provider. This is a good
ground for asserting whether customers are satisfied with service quality in TTCL or
not since the average perception score is low. A higher perception also indicates
higher satisfaction as service quality and satisfaction are positively related (Fen &
Lian, 2005, p.59-60). This could be possibly because of either the under delivering
of services to customers or the over promising of TTCL to customers on their
services.

50
4.4 Service Quality Dimensions that Brings Satisfaction in TTCL
Table 4.3: Average Gap Score on Expectations and Perceptions
Dimension Statement
Expectation
Score in
Percentage
Perception
Score in
Percentage
Gap Score
in
Percentage
Overall
Gap
Score
Average
Gap
Score
Tangibles TA1 4 2 -2
TA2 5 3 -2
TA3 5 3 -2
TA4 4 3 -1 -7 -1.75
Reliability RL1 4 3 -1
RL2 4 2 -1
RL3 5 4 -1
RL4 3 1 -2
RL5 2 1 -1 -9 -1.8
Responsivenes
s RS1 4 2 -2
RS2 4 3 -1
RS3 5 5 0
RS4 5 5 0 -3 -0.75
Assurance AS1 4 3 -1
AS2 5 4 -1
AS3 4 2 -1
AS4 5 1 -4 -8 -2
Empathy EM1 5 4 -1
EM2 5 3 -2
EM3 5 1 -4
EM4 5 4 -1
EM5 5 4 -1 -9 -1.8
-8.1
Source: Field data (2013)
The gap score analysis in table 4.2 enable us to find out how customers perceive

51
service quality in TTCL and try to identify what dimensions of service quality
customers satisfied with. Also table 4.3 is the extension of table 4.2 which tried to
show the average score for each service quality dimensions. According to
Parasuraman et al., (1985, p.48) the higher (more positive) the perception (P) minus
expectation (E) score, the higher the perceived service quality and thereby leading to
a higher level of customer satisfaction. In this regard, the gap scores were calculated
based on the difference between the customers’ perceptions and expectations of
services offered by TTCL.
In general, it was found that, customers’ perceptions of service quality offered by
TTCL did not meet their expectations (all gaps scores the dimensions are negative).
Descriptions of dimensions reported as follows;
i) Responsiveness (RN)
Responsiveness obtained a gap score of (-3) with an average gap score of (-
0.75).customers expect more in TTCL on Employees make information easily
obtainable by customers, employees give prompt services to customers, employees
are always willing to help customers and employees are never too busy to respond
to customers requests.
ii) Tangibles (TA)
Average customers are unsatisfied with the level of services offered by TTCL.It was
reported to have highest overall gap score which is (-7) and average gap score of (-
1.75).Customers are not satisfied with TTCL services, they should have up-to-date
equipments and physical facilities should virtually appealing, employees should be
52
well dressed and appear neat and physical environment of the TTCL should be clean.
iii) Empathy (EM)
It had gap score of (-9) with smaller average gap score of (-1.8).To this extent TTCL
should give customers individual attention, operating hours of TTCLs should be
convenient to customers, employees of TTCL should give customers personal
service and employees of TTCLs should understand the specific needs of their
customers.
iv) Reliability (RL)
Reliability obtained gap score of (-9) and it had an average of gap score of (1.8)
which means that TTCL is expected to be more reliable to satisfy the customers in;
when they promise to do something by a certain time, they do it, when customer has
a problem, they should show sincere interest in solving the problem, TTCLs perform
the service right the first time, should provide their services at the time they promise
to do so and keep their records accurately.
v) Assurance (AS)
Assurance obtained (-8) gap score and average gap score of (-2).The findings reveal
that customer are not satisfied with the behavior of employees instill confidence in
customers, customers feel safe in their transactions with the employees, employees
should be polite to customers and employees of TTCLs should have knowledge to
answer customers’ questions.
From results obtained from in Table 4.4, it is seen that customers perceive service

53
quality as poor in all dimensions meaning their expectations fall short of they
experience in TTCL. In this regard, customers are not satisfied with any dimension
of service quality. All the dimensions show a gap between expected service and
perceived service and this means that TTCL need to make improvements in all
dimensions in order to close gaps that could lead to increased customer satisfaction.
Table 4.4: Ranked Service Quality Dimensions and its Average Score
Ranking Dimensions Average scores
1 Responsiveness -0.75
2 Tangibles -1.75
3 Empathy -1.8
4 Reliability -1.8
5 Assurance -2
Source: Field data (2012)
4.5 Factors Hindering Customer Satisfaction in TTCL
The respondents were asked on factors hindering customer satisfaction levels for
different products and services provided by TTCL. 79.5% of the respondents said
they were using TTCL or had used it before. The products and services under
scrutiny were network coverage, voucher availability, flexibility, air time charges,
phones/handset prices and customer care.
4.5.1 Network Coverage
Network coverage is one of the major causes of customer dissatisfaction among the
TTCL customers. Majority of the respondents said network coverage is a major

54
cause of concern when moving away from the major cities and townships to small
towns and rural areas.
Table 4.5: Network Coverage Satisfaction
Satisfaction Level Frequency Percent
NOT SATISFIED 98 50.5
SATISFIED 47 23.5
VERY SATISFIED 11 5.5
Source: Field data (2012)
This was pointed out by more than half of the respondents (50.5%). The most
interesting thing is that for landlines, TTCL has the widest coverage in the country,
reaching every district in the country and many rural areas. Moreover, other mobile
operators in the country are using TTCL network towers to reach people in many
rural areas but TTCL itself is still unavailable in many rural areas. 23.5% of the
respondents said they were satisfied with TTCL network coverage and 5.5% were
very satisfied. The following figure shows the satisfaction level in network coverage;

55
Figure 4.3: Network Coverage
Source: Field data (2012)
4.5.2 Voucher Availability
Voucher availability is another primary concern of TTCL users. As one of the
reasons for customer dissatisfaction, vouchers are only available in urban centers and
big shops or mini supermarkets in rural areas. According to the respondents, voucher
availability is a problem in many rural areas. This requires pre-purchasing enough
vouchers if the customer is travelling to rural areas in fear of not getting the service
in rural areas.
Table 4.6: Voucher Availability
SATISFACTION LEVEL FREQUENCY PERCENT
NOT SATISFIED 71 39.5
SATISFIED 46 23
VERY SATISFIED 34 17
Source: Field data (2012)
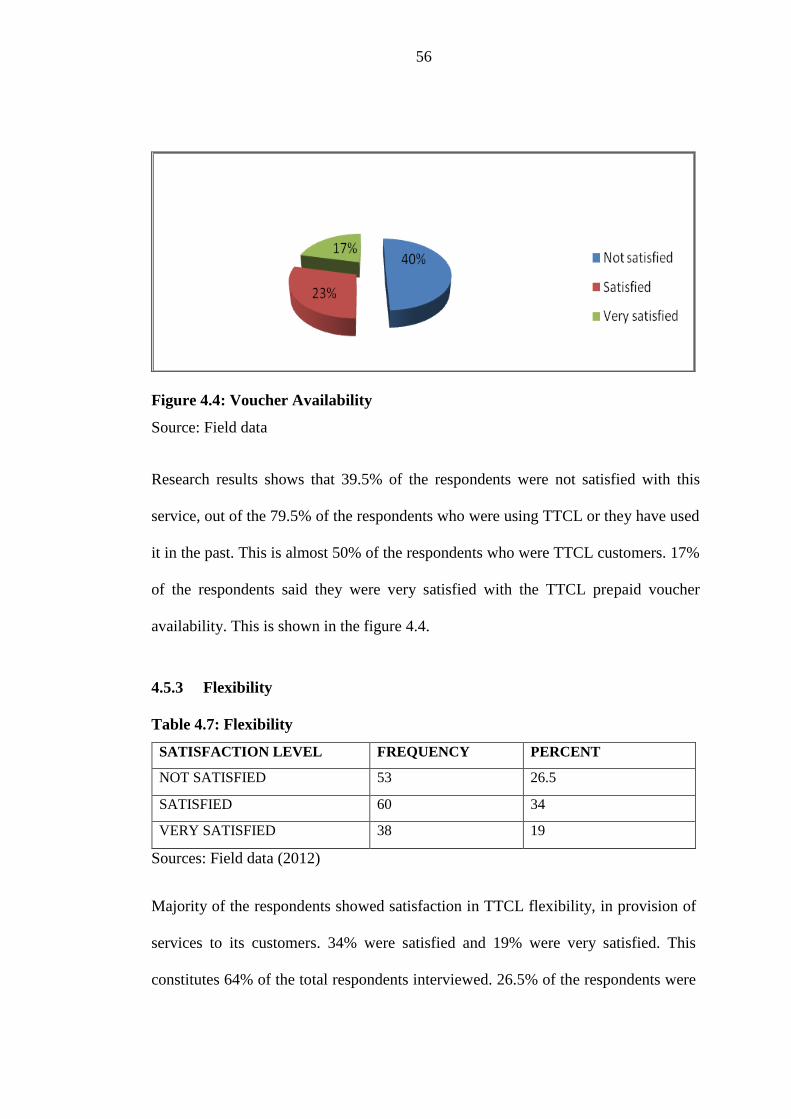
56
Figure 4.4: Voucher Availability
Source: Field data
Research results shows that 39.5% of the respondents were not satisfied with this
service, out of the 79.5% of the respondents who were using TTCL or they have used
it in the past. This is almost 50% of the respondents who were TTCL customers. 17%
of the respondents said they were very satisfied with the TTCL prepaid voucher
availability. This is shown in the figure 4.4.
4.5.3 Flexibility
Table 4.7: Flexibility
SATISFACTION LEVEL FREQUENCY PERCENT
NOT SATISFIED 53 26.5
SATISFIED 60 34
VERY SATISFIED 38 19
Sources: Field data (2012)
Majority of the respondents showed satisfaction in TTCL flexibility, in provision of
services to its customers. 34% were satisfied and 19% were very satisfied. This
constitutes 64% of the total respondents interviewed. 26.5% of the respondents were

57
not satisfied with TTCL flexibility citing lack of innovations and embracing new
services for its customers as the major cause of dissatisfaction in this category. Lack
of mobile banking services from TTCL was noted as another factor for the lack of
flexibility in TTCL mobile services.
Figure 4.5: TTCL Flexibility in Service Delivery
Source: Field data (2012)
4.5.4 Air Time Charges
Table 4.8: Air Time Charges Satisfaction
Satisfaction Level Frequency Percent
Not Satisfied 17 54.5
Satisfied 10.1 8.5
Very Satisfied 33 16.5
Sources: Field data (2012)
According to the respondents in this research. 54.5% of the total respondents
interviewed said they were not satisfied (8.5%) or very satisfied (16.5%) with the air
time charges. Despite other dissatisfactions from the users, lower tariffs are one of
the major points the customers look for before accepting to TTCL services. This
presented in the Figure 4.6.

58
Figure 4.6: Air Time Satisfactions
Sources: Field data (2012)
4.5.5 Phones or Handset Prices
Cell phones sold by mobile operators in the country are always being sold on
promotional basis, which make them the cheapest phones available in the market.
According to the research results, majority of the respondents were satisfied with the
handset prices provided by TTCL mobile.
Table 4.9: Handsets Prices Satisfaction
Satisfaction Level Frequency Percent
Not Satisfied 10 5
Satisfied 131 65.5
Very Satisfied 10 9
Source: Field data (2012)
65.5% of the respondents were satisfied with the prices and 9% were very satisfied
while 5% are not satisfied with prices of cell phones. Mobile operators in the country
have been selling cheap cell phones to their customers and non customers, as a
means of attracting more customers and retaining the old ones. In most cases, these
handsets will only operate with SIM cards of that particular operator, so limiting the

59
benefactors of those cheap handsets to using only their services. However, there
have been complaints that those handsets are counterfeit and do not last long as the
genuine ones which are also available in the market but with a different price tag.
Figure 4.7 represents handset price satisfaction:
4.5.6 Customer care
Figure 4.7: Handsets Prices Satsfaction
Source:Field data (2012)
Customer service, being a series of activities designed to enhance the level of
customer satisfaction, is a very important component for any telecom operators.
Table 4.10: Customer Care
SATISFACTION LEVEL FREQUENCY PERCENT
NOT SATISFIED 121 64.5
SATISFIED 8 4
VERY SATISFIED 22 22
Source: Field data (2012)
According to research findings, 64.5% of the respondents were not satisfied with
TTCL customer care, 11% were very satisfied and only 4% said they were satisfied
by TTCL customer care. Combining together the satisfied parties, 75% of the

60
respondents interviewed were either not satisfied or very satisfied with TTCL
customer care. In other words, as far as customer satisfaction is concerned. The
customer care department had not met customer expectations to a large extent as
shown in the figure 4.8.
Figure 4.8:Customer Care
Source: Field data (2012)
4.6 What Should be Done to Improve Customer Satisfaction in TTCL
The respondents were asked about what should be done to improve customer
satisfaction at TTCL. The responses are shown in the Table 4.11.
Table 4.11: Improve Mart of Customer Satisfaction in TTCL
S/No
What To Be Done
Frequency
Percent
1 Improve infrastructure for more
coverage in the rural areas
123 81.4
2 Embrace new technology and
innovations to improve company’s
flexibility
47 31.1

61
3 The company should lower prices of
products and services
144 95.3
4 The company should bring quality cell
phone for its customers
41 27.2
Source: Field data (2012)
Generally,about 81.4% customers comments that; TTCL should improve
infrastructure for more coverage in rural areas. TTCL is operating all over the
country but in the rural areas there is a problem of coverage, this makes the
customers to be dissatisfied in the quality of service. In Embracing new technology
and innovations to improve company’s flexibility, 31.1% suggest that, TTCL should
adopt new technology and innovation which is changing everyday in
telecommunication industries in order to deliver better service and hence customer
satisfaction.
In lowering prices of TTCL product and services, 95.3% comment that, the prices of
services lead to customers to be dissatisfied, therefore the changes in prices should
be taken into account for the customers to be satisfied with the product and services
delivered by TTCL. 27.2% of the respondents said that the quality of cell phone
which is provided by TTCL should be improved. Most of the cell phone are of low
quality and has limitations thus you cannot use the same hand set to other providers.

62

63
CHAPTER FIVE
5.0 SUMMARY, CONCLUSION AND RECOMMENDATIONS
5.1 Introduction
This chapter presents a summary of the findings, conclusion and recommendations
from the results obtained from the field survey. It also covers the limitation of the
study, implications (managerial and theoretical) and suggestions for further research
topics.
5.2 Summary of Findings
From the analysis carried out in order to answer research questions and hence fulfill
the purpose of the study that include; finding out how customers perceive TTCL
service quality, factors hindering customer satisfaction, identifying what dimensions
highly contribute to customer satisfaction and what should be done to improve
customer satisfaction for TTCL.
The findings from analysis reveal that the SERVQUAL model is not a better
instrument to measure service quality for TTCL business working environment. The
gap score analysis carried out, found that, the overall service quality is low as
perceived by TTCL customers and hence unsatisfactory customer satisfaction.
Customers have higher expectations than what they actually experience from TTCL
even though the difference is not significant. To answer the main research question
which is; how customers perceive service quality, the gap scores analysis carried out
provided answers to these questions. The overall perceived service quality is low as
expectations exceed perceptions; implying that customers demand more than what is

64
being offered to them. Due to such prevailing gap, it is clear that customers are not
satisfied. Further evaluation on the perceptions and expectations of the customers, it
has been observed that no dimension of service quality that contributes to customer
satisfaction. The findings on the factors hindering satisfaction for TTCL, it has been
found that most of customers were not happy with TTCL customer care service,
voucher availability, phones type and prices, airtime charges and flexibility.
Evidence from the study shows that, TTCL have to improve performance on all
dimensions of service quality in order to increase customer satisfaction as customers
expect more than what is being offered by TTCL. By improving customer service
quality means strengthening company competitive edge within the industry
5.3 Conclusion
The main purpose of this study was to assess service quality and customer
satisfaction using SERVQUAL model from TTCL current business set ups. It also
reveals how customers of TTCL perceive service quality, see how applicable the
SERVQUAL model in the context of TTCL using its dimensions to measure
service quality , factors hindering satisfaction in TTCL and what to be done to
improve customer satisfaction in TTCL. Knowing how customers perceive service
quality and being able to measure service quality will benefit management of service
organizations including TTCL. Measuring service quality helps management to
provide reliable data that can be used to monitor , maintain and improve service
quality. Findings show that TTCL customers expects more than what they perceive
therefore TTCL must strive hard to improve all the service quality dimensions for

65
improved customer satisfaction.
5.4 Implications of the Findings
General implication to management of TTCL is that they should focus on all
dimensions of service quality and make efforts to improve to have better
performance that would lead to higher perceived service quality and customer
satisfaction. TTCL should focus on improving service quality by investing in
equipment to enhance call quality , coverage, offer reasonable pricing , offer price
discounts, offer reasonable validity period and enhance customer care service
through intensive routine personnel training and provision of better customer-
friendly equipment to customer serving staff.
For improved service quality TTCL should not only rely on profit margins as a good
indicator of business performance. TTCL should also develop strategies that would
enhance customer’s perceptions capturing. The customer satisfaction strategy helps
companies to compare their performance against customer standards, compare
customer standards against internal process and identify opportunities for
improvement.
5.5 Recommendations
i. TTCL should conduct ongoing research on service quality and customer
satisfaction to understand the changing customers satisfaction levels
against offerings on what should be done and what strategies to be
implemented in order to achieve customer satisfaction goals.

66
ii. TTCL and other telecommunications operators should not just rely on
profit margins as good indicator of business performance, rather; they
should develop strategies that will assist them to capture customers’
perceptions on demand.
iii. Customer satisfaction strategy will help companies to compare their
performances against customer standards against internal processes,
industry benchmarks and identify opportunities for improvement.
iv. TTCL infrastructures like network towers should be improved. More
investment should be made in new modern technologies. On the customer
access levels fiber optic backbone networks are recommended for
improved service and reliability.
v. TTCL should provide more trainings about service quality to customer
serving staffs for more understanding of the offering as this has direct
impact to customers expectations
5.6 Limitations
There were some limitations associated with this study that need to be addressed.
The results obtained from this study cannot be generalized to a wide range of similar
situations concerning TTCL because of the non-probability sampling technique used
even though the methodology used in this study could be applied to these similar
situations. The issue of customers’ perceptions could be questioned because the
sample size considered constituted respondents from both government organization
and private organization therefore the expectation may differ significantly.

67
Finance, time and material resources needed for a larger sample size was inadequate
hence opted for small sample size. Due to low financial budget and other resources,
the sample size for this study was reduced to 175 respondents and the study area was
also confined to Dar es Salaam only.
The above limitations however are less significant compared to the importance of
carrying out this type of study. Such study should be carried out frequently in order
to monitor service quality and satisfaction levels of customers and hence apply
necessary adjustments for addressing the prevailing weaknesses.
5.7 Suggestions for Further Research
Further research should be carried out in order to enhance the understanding of the
concepts of service quality and customer satisfaction, how they are measured
because they are very important for service organizations in terms of profitability
and growth. A similar study could be conducted with a larger sample size so that
results could be generalized to a larger population. Similar study is recommended to
other areas including the impact of poor support to the customer satisfaction, the
impact of regulatory policies to customer satisfaction and the impact of customer
retention strategies to the customer satisfaction levels.

68
REFERENCES
Asubonteng, P. (1996). A critical review of service quality,Vol.10. The Journal of
service marketing , 6,p.62-81.
Buttle, F. (1996). review,critique, reseach agenda. European Journal of Marketing ,
Vol.30,Nnumber1,p.8-32.
Cronin, J. (1992). measuring service quality;a re-examination and extension. The
Journal of Marketing,Vol.56,Number 3, , 55-68.
deVaus, D. (2002). Surveys in social Research.(5th edn). London: Routledge.
Douglas, L. (2003). The expectation gap,nutrition &food science. Attitudes to service
quality , Vol.33 number 4 p.165-172.
Edvardsson. (1998). Service quality improvement. Managing service quality ,
Vol.8.Number 2,p.142-149.
Eshghi, A. (2008). Service quality and customer satisfaction. An imperical
investigation in India mobile Telecommunications services,Marketing
management journal , Vol 18,number 2,p.119-144.
Fen, Y. (2005). Antecedents of customer's re-patronage. Sunway Academic Journal ,
Vol.4,P.60-73.
Garvin, D. (1998). Managing quality. New York: Macmillan.
Ghylin, K.M., Green, B.D., Drury, C.G., Chen, J., Schulta, J.L., Uggirala, A.,
Abraham, J.K. & Lawson, T.A. (2006). Clarifying the dimensions of four
concepts of quality. Theoretical issues in economics science ,
Vol.9,Number1,p.73-94.

69
Gronroos, C. (1982). Aservice quality and its marketing implications. European
Journal of Marketing , Vol.18,Number 4,p.36-44.
Gummesson, E. (1994). service management. International Journal of service
Industry management , 77-96.
Haedie N. & Walsh P. (1994). Towards a better understanding of quality.
international Journal of quality and reliability management , Vol.11,p.53-63.
Johns, N. (1999). What is this thing called service? European journal of marketing ,
Vol.33,number 9/10,p.958-973.
Kumar, M., Kee, F.T. & Manshor, A.T. (2009). Determining the relative impotance
of critical factors in delivering service quality of banks. Managing service
quality , Vol.19,number 2,p.211-228.
Ladhari, R. (2009). A review of twenty years of SERVQUL research,. International
journal of quality and services science , Vol.1,Number 2.P.172-198.
Lee, H., Lee, Y. & Yoo, D. (2000). The determinants of perceived service quality
and its relationship with satisfaction. Journal of service marketing ,
Vol.14,Number 3,p.217-231.
Negi. (2009). Determining customer satisfaction through perceived service quality.
International jounal of mobile marketing , Vol.4,number 1:p.31-38.
Oliver, R. (1977). effect of expectation and disconfimation on post exposure product
evaluation. Journal of applied psychology , Vol.62,number 4,p.480-486.
Parasuraman, A., Zeithaml, VA. ,& Berry, L.L. (1985). Conceptual model of service
quality and it implications for future research. Journal of Marketing ,
Vol.49,p.41-50.

70
Parasuraman, A., Zeithaml, V.A., & Berry,L.L. (1988). SERVQUAL :a multiple
item scale for measuring perceptions of service quality. journal of retailing ,
Vol.64,Number 1,p.12.
Saunders, M., Lewis, P. and Thornhill, A. (2007). Research methods for business
students (5th edn). harlow: FT Prentice hall.
Wicks, A.M., & Roethlein, C.J. (2009). A satisfaction-Based defination of quality .
Journal of Business & Economics Studies , Vol.15,No.1,spring 2009,82-97.
Yi, Y. (1990). A critical review of customer satisfaction,in Zeithaml,V. Review of
marketing ,Amercan marketing association , 68-123.

71
PPENDIX
Questionnaires
These questionnaires are part of a research project and the study is to assess service
quality and customer satisfaction using SERVQUAL model. I would be happy if you
could help to answer the following questionnaires.
Thank you.

72
The questionnaire is in two parts, expectations and experience.
Expectations: This section deals with your opinion of TTCLs. Please, show the extent
to which you think TTCL ‘should’ possess the following features. We are interested
in knowing your expectations from ideal.
Instructions: Please rate how strongly you agree or disagree with each of the
following statements by placing a check mark in the appropriate box.
Statements Strongly
agree
Agree
Don’t
know
Disagree
Strongl
y
disagree
1. Ideal TTCL should have modern
equipments. [ ] [ ] [ ] [ ] [ ]
2. Their physical facilities (shelves,
customer service
counters, computers, lights) should be
visually appealing.
[ ] [ ] [ ] [ ] [ ]
3. Their employees should be well
dressed and appear
neat.
[ ] [ ] [ ] [ ] [ ]
4. When provider promises to do
something by a certain
time, they should do so.
[ ] [ ] [ ] [ ] [ ]
5.When a customer has a problem, a
provider should show
a sincere interest in solving it.
[ ] [ ] [ ] [ ] [ ]
6. Provider should perform the service
right the first time. [ ] [ ] [ ] [ ] [ ]
7.They should provide their services at
the time they
promise to do so.
[ ] [ ] [ ] [ ] [ ]

73
Statements Strongly
agree
Agree
Don’t
know
Disagree
Strongly
disagree
8. They should keep their records
accurately. [ ] [ ] [ ] [ ] [ ]
9. Employees should make information
easily obtainable by the customers. [ ] [ ] [ ] [ ] [ ]
10. Employees should give prompt service
to customers. [ ] [ ] [ ] [ ] [ ]
11. Employees are always willing to help
customers. [ ] [ ] [ ] [ ] [ ]
12. Employees in a TTCL should never be
too busy to respond to customers
‘requests.
[ ] [ ] [ ] [ ] [ ]
13. The behavior of employees in TTCL
should instill confidence in customers [ ] [ ] [ ] [ ] [ ]
14. Customers should be able to feel safe
in their transactions with Employees in
the counters.
[ ] [ ] [ ] [ ] [ ]
15. Their employees should be polite. [ ] [ ] [ ] [ ] [ ]
16. Employees of TTCL should have the
knowledge to answer customers’
questions.
[ ] [ ] [ ] [ ] [ ]
17. Provider should give customers
individual attention. [ ] [ ] [ ] [ ] [ ]
18. Their operating hours should be
convenient to all their customers. [ ] [ ] [ ] [ ] [ ]
19. Employees should give customers
personal service. [ ] [ ] [ ] [ ] [ ]
20. The employees should understand the
specific needs
of their customers.
[ ] [ ] [ ] [ ] [ ]

74
Perceptions: The following statements deal with the perceptions of service
experienced. Please, show the extent to which these statements reflect your
perception of service in TTCL
Put a cross (X) on your choice of answer.
Statements Strongly
agree
Agree
Don’t
know
Disagree
Strongly
disagree
1. TTCL customer service centers have up-
to-date equipments. [ ] [ ] [ ] [ ] [ ]
2. Physical facilities (like, computers,
brochures) are visually appealing. [ ] [ ] [ ] [ ] [ ]
3. Employees are well dressed and appear
neat. [ ] [ ] [ ] [ ] [ ]
4. When they promise to do something by a
certain time, they do. [ ] [ ] [ ] [ ] [ ]
5. When a customer has a problem, they
show a sincere interest in solving it. [ ] [ ] [ ] [ ] [ ]
6. Provider performs the service right the
first time. [ ] [ ] [ ] [ ] [ ]
7. TTCL provides the service at the time
they promised to do so. [ ] [ ] [ ] [ ] [ ]
8.Employees keep their records accurately [ ] [ ] [ ] [ ] [ ]
9.Employees make information easily
obtainable by customers [ ] [ ] [ ] [ ] [ ]
10. Employees give prompt service to
customers. [ ] [ ] [ ] [ ] [ ]
11. Employees are always willing to help
customers. [ ] [ ] [ ] [ ] [ ]
12. Employees are never too busy to respond
to customers requests. [ ] [ ] [ ] [ ] [ ]
13.The behavior of employees instill
confidence in customers
[ ] [ ] [ ] [ ] [ ]

75
Statements Strongly
agree
Agree
Don’t
know
Disagree
Strongly
disagree
14Customers feel safe in their transactions
with employees in the Customer service
counters.
[ ] [ ] [ ] [ ] [ ]
15. Employees are polite with customers. [ ] [ ] [ ] [ ] [ ]
16. Employees of TTCL have the knowledge
to answer
customers’ questions.
[ ] [ ] [ ] [ ] [ ]
17. Employees give customers individual
attention. [ ] [ ] [ ] [ ] [ ]
18. Their operating hours are convenient to
all their
customers.
[ ] [ ] [ ] [ ] [ ]
19. Employees give customers personal
service. [ ] [ ] [ ] [ ] [ ]
20. The employees understand the specific
need of their customer. [ ] [ ] [ ] [ ] [ ]
21. To what level are you satisfied in the following categories of TTCL services? *
Choose appropriate
Very Satisfied Satisfied Not Satisfied
Network Coverage
Vouchers availability
Flexibility (TTCL Mobile line is
fixed to its handset)
Air time charges (Price)
Price of TTCL Mobile Phones
TTCL Mobile Customer care
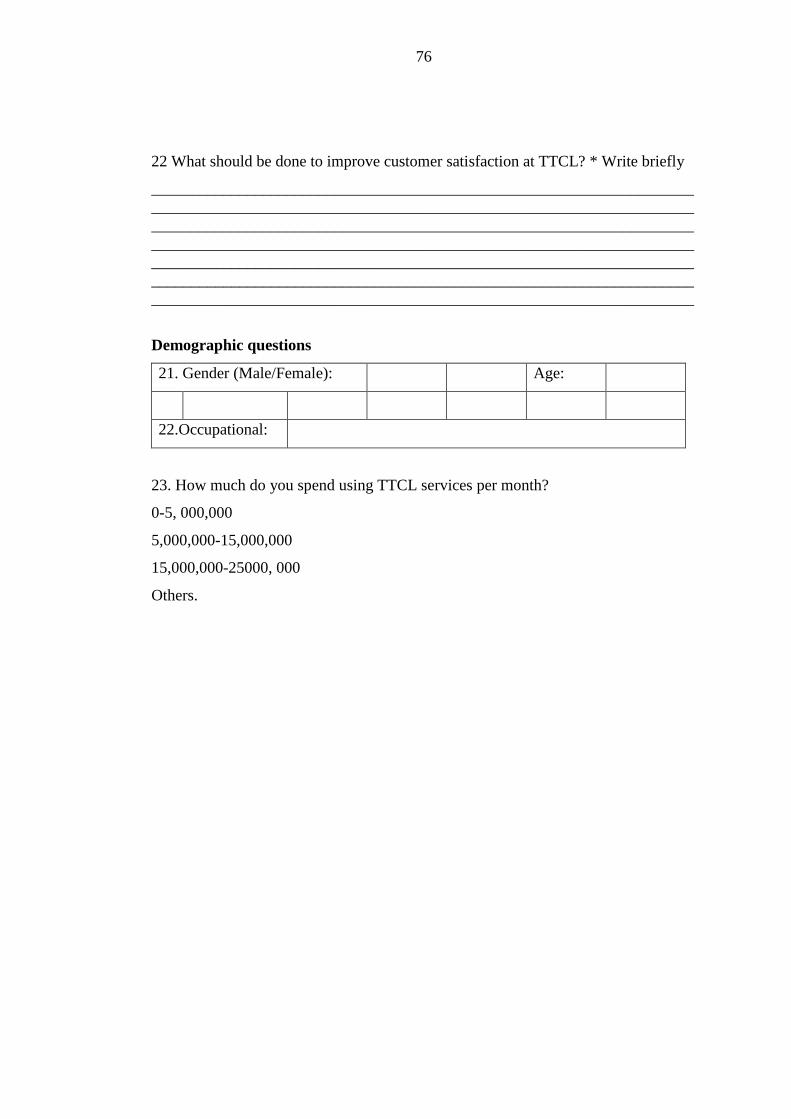
76
22 What should be done to improve customer satisfaction at TTCL? * Write briefly
____________________________________________________________________
____________________________________________________________________
____________________________________________________________________
____________________________________________________________________
____________________________________________________________________
____________________________________________________________________
____________________________________________________________________
Demographic questions
21. Gender (Male/Female): Age:
22.Occupational:
23. How much do you spend using TTCL services per month?
0-5, 000,000
5,000,000-15,000,000
15,000,000-25000, 000
Others.