The application of quantification techniques in proteomics ... · THE APPLICATION OF QUANTIFICATION...
26
THE APPLICATION OF QUANTIFICATION TECHNIQUES IN PROTEOMICS FOR BIOMEDICAL RESEARCH Eva Rodrı ´guez-Sua´rez 1 * and Anthony D. Whetton 2 1 Proteomic Unit, CIC bioGUNE, CIBERehd, ProteoRed, Derio, Spain 2 School of Cancer and Enabling Sciences, Manchester Academic Health Science Centre, University of Manchester, Manchester M20 3LJ, United Kingdom Received 7 June 2011; revised 9 February 2012; accepted 10 February 2012 Published online 30 July 2012 in Wiley Online Library (wileyonlinelibrary.com). DOI 10.1002/mas.21347 The systematic analysis of biological processes requires an understanding of the quantitative expression patterns of proteins, their interacting partners and their subcellular localization. This information was formerly difficult to accrue as the relative quan- tification of proteins relied on antibody-based methods and other approaches with low throughput. The advent of soft ionization techniques in mass spectrometry plus advances in separation technologies has aligned protein systems biology with messenger RNA, DNA, and microarray technologies to provide data on systems as opposed to singular protein entities. Another aspect of quantitative proteomics that increases its importance for the coming few years is the significant technical developments underway both for high pressure liquid chromatography and mass spectrum devices. Hence, robustness, reproducibility and mass accuracy are still improving with every new generation of instruments. Nonetheless, the methods employed require valida- tion and comparison to design fit for purpose experiments in advanced protein analyses. This review considers the newly developed systematic protein investigation methods and their value from the standpoint that relative or absolute protein quantification is required de rigueur in biomedical research. # 2012 Wiley Periodicals, Inc. Mass Spec Rev 32:1–26, 2013 Keywords: relative quantification; absolute quantification; isotopic labeling; label-free quantification; biomarker I. INTRODUCTION The identification and quantification of expressed proteins in cells, tissue and whole organisms, is one of the greatest challenges in the post-genomic era. The complete genomic sequencing of humans and a variety of animals and plants has enabled this process, but methods for protein identification and sequencing, increased sensitivity of mass spectrometers for peptide identification, plus the release of new software focused on the interpretation of mass spectrometric data for the relative and absolute quantification of proteins, has fostered the opportunity to develop high throughput protein analyses. This is encapsulated in the term proteomics, which is defined as the study of the proteome of a cell or tissue at a given time, where the proteome is defined as the total protein complement (Wilkins, 1996). The most widely used mass spectrometric strategy for in-depth protein identification is called shotgun proteomics. It is based on digesting proteins into peptides and sequencing them using liquid chromatography coupled to tandem mass spectrometry (LC-MS/MS) and automated database searching (Yates et al., 1995). Search engines use the information gener- ated by LC-MS/MS to identify peptides sequences from tan- dem mass spectra data. Hence, a combination of peptide intact mass and the masses of the associated fragments is used to identify peptides grouped in databases of protein sequences. Large-scale quantitative proteomics produces a volume of data that previously would have taken decades to analyze with classical biochemical methods. There has been rapid progress in protein relative quantification in complex samples over the past two decades. Protein quantification began by comparison of the spot patterns of two-dimensional polyacrylamide gel electrophoresis (2D-PAGE). The use of dyes to stain and thereby relatively quantify protein-containing spots was an ab- solute requirement. Dyes such as Coomassie Blue offered very limited dynamic range of detection (approximately 1 log). The use of fluorescent staining overcame both this issue and the lower sensitivity of Coomassie Blue (Hart et al., 2003; Martin et al., 2003; Steinberg et al., 2003; Ge et al., 2004). Fluorescent two-dimensional differential gel electrophoresis (2D-DIGE) allows the derivatization of two different protein mixture samples with fluorophores, which could then be mixed and then run on a single 2D-gel. Then, the 2DE is imaged using different excitation and emission wavelengths, and the different images obtained can be used to quantify the protein changes from sample to sample (U ¨ nlu ¨ et al., 1997; Rabilloud, 2002; Alban et al., 2003). The possibility of run- ning two different samples on the same gel minimizes the problem of reproducibility from gel to gel reducing also the number of gels that must be run to make comparisons between samples. However, many proteins such as hydrophobic mem- brane proteins or low abundance proteins, fail to be detected by 2D-PAGE and one protein spot can contain more than one protein. On the other hand, post-translationally modified pro- teins can be separated into their different forms on 2D gels, as can proteolyzed proteins. This offers opportunities some of the gel-free methods below do not in terms of discovering new regulatory events in biosystems (Boumahrou et al., 2011; Leung et al., 2011; Pitarch et al., 2011; Yu et al., 2011). Contract grant sponsor: Leukaemia Lymphoma Research; Contract grant sponsor: Cancer Research UK; Contract grant sponsor: CIBER- ehd and ProteoRed. *Correspondence to: Eva Rodrı ´guez-Sua ´rez, Proteomics Unit, CIC bioGUNE, Technology Park, Bldg. 800 Derio, Bizkaia 48160, Spain. E-mail: [email protected] Mass Spectrometry Reviews, 2013, 32, 1–26 # 2012 by Wiley Periodicals, Inc.
Transcript of The application of quantification techniques in proteomics ... · THE APPLICATION OF QUANTIFICATION...
THE APPLICATION OF QUANTIFICATION TECHNIQUES INPROTEOMICS FOR BIOMEDICAL RESEARCH
Eva Rodrıguez-Suarez1* and Anthony D. Whetton2
1Proteomic Unit, CIC bioGUNE, CIBERehd, ProteoRed, Derio, Spain2School of Cancer and Enabling Sciences, Manchester Academic HealthScience Centre, University of Manchester, Manchester M20 3LJ,United Kingdom
Received 7 June 2011; revised 9 February 2012; accepted 10 February 2012
Published online 30 July 2012 in Wiley Online Library (wileyonlinelibrary.com). DOI 10.1002/mas.21347
The systematic analysis of biological processes requires anunderstanding of the quantitative expression patterns of proteins,their interacting partners and their subcellular localization. Thisinformation was formerly difficult to accrue as the relative quan-tification of proteins relied on antibody-based methods and otherapproaches with low throughput. The advent of soft ionizationtechniques in mass spectrometry plus advances in separationtechnologies has aligned protein systems biology with messengerRNA, DNA, and microarray technologies to provide data onsystems as opposed to singular protein entities. Another aspectof quantitative proteomics that increases its importance for thecoming few years is the significant technical developmentsunderway both for high pressure liquid chromatography andmass spectrum devices. Hence, robustness, reproducibility andmass accuracy are still improving with every new generation ofinstruments. Nonetheless, the methods employed require valida-tion and comparison to design fit for purpose experiments inadvanced protein analyses. This review considers the newlydeveloped systematic protein investigation methods andtheir value from the standpoint that relative or absolute proteinquantification is required de rigueur in biomedical research.# 2012 Wiley Periodicals, Inc. Mass Spec Rev 32:1–26, 2013
Keywords: relative quantification; absolute quantification;isotopic labeling; label-free quantification; biomarker
I. INTRODUCTION
The identification and quantification of expressed proteinsin cells, tissue and whole organisms, is one of the greatestchallenges in the post-genomic era. The complete genomicsequencing of humans and a variety of animals and plants hasenabled this process, but methods for protein identificationand sequencing, increased sensitivity of mass spectrometersfor peptide identification, plus the release of new softwarefocused on the interpretation of mass spectrometric datafor the relative and absolute quantification of proteins, hasfostered the opportunity to develop high throughput proteinanalyses. This is encapsulated in the term proteomics, which
is defined as the study of the proteome of a cell or tissue at agiven time, where the proteome is defined as the total proteincomplement (Wilkins, 1996).
The most widely used mass spectrometric strategy forin-depth protein identification is called shotgun proteomics. Itis based on digesting proteins into peptides and sequencingthem using liquid chromatography coupled to tandem massspectrometry (LC-MS/MS) and automated database searching(Yates et al., 1995). Search engines use the information gener-ated by LC-MS/MS to identify peptides sequences from tan-dem mass spectra data. Hence, a combination of peptide intactmass and the masses of the associated fragments is used toidentify peptides grouped in databases of protein sequences.
Large-scale quantitative proteomics produces a volume ofdata that previously would have taken decades to analyze withclassical biochemical methods. There has been rapid progressin protein relative quantification in complex samples over thepast two decades. Protein quantification began by comparisonof the spot patterns of two-dimensional polyacrylamide gelelectrophoresis (2D-PAGE). The use of dyes to stain andthereby relatively quantify protein-containing spots was an ab-solute requirement. Dyes such as Coomassie Blue offered verylimited dynamic range of detection (approximately 1 log).The use of fluorescent staining overcame both this issue andthe lower sensitivity of Coomassie Blue (Hart et al., 2003;Martin et al., 2003; Steinberg et al., 2003; Ge et al., 2004).Fluorescent two-dimensional differential gel electrophoresis(2D-DIGE) allows the derivatization of two different proteinmixture samples with fluorophores, which could then bemixed and then run on a single 2D-gel. Then, the 2DE isimaged using different excitation and emission wavelengths,and the different images obtained can be used to quantify theprotein changes from sample to sample (Unlu et al., 1997;Rabilloud, 2002; Alban et al., 2003). The possibility of run-ning two different samples on the same gel minimizes theproblem of reproducibility from gel to gel reducing also thenumber of gels that must be run to make comparisons betweensamples. However, many proteins such as hydrophobic mem-brane proteins or low abundance proteins, fail to be detectedby 2D-PAGE and one protein spot can contain more than oneprotein. On the other hand, post-translationally modified pro-teins can be separated into their different forms on 2D gels,as can proteolyzed proteins. This offers opportunities some ofthe gel-free methods below do not in terms of discoveringnew regulatory events in biosystems (Boumahrou et al., 2011;Leung et al., 2011; Pitarch et al., 2011; Yu et al., 2011).
Contract grant sponsor: Leukaemia Lymphoma Research; Contract
grant sponsor: Cancer Research UK; Contract grant sponsor: CIBER-
ehd and ProteoRed.
*Correspondence to: Eva Rodrıguez-Suarez, Proteomics Unit, CIC
bioGUNE, Technology Park, Bldg. 800 Derio, Bizkaia 48160, Spain.
E-mail: [email protected]
Mass Spectrometry Reviews, 2013, 32, 1–26# 2012 by Wiley Periodicals, Inc.
In the last decade, most of the proteomic quantificationstudies have moved from 2D-PAGE technology to gel-freequantification approaches. Obtaining accurate quantificationof protein profiles is an essential element in these proteomicanalyses (Rifai et al., 2006; Conrad et al., 2008; Choi et al.,2010; Qualtieri et al., 2010; Richardson et al., 2010; Schwam-born et al., 2010; Tjalsma, 2010). Equally important in thisprocess of quantification is rigorous methods for sample repli-cation to generate accuracy and precision. Related to this isthe limitation imposed by sample analyte dynamic range. Adynamic range of 106 for the proteins present in a human cellline offers great challenges for the measurement and quantifi-cation of low abundance proteins (Corthals et al., 2000).This situation can be even worse in biofluids in which proteinssuch as albumin can impose a dynamic range ofapproximately 1010 (Anderson & Anderson, 2002). This rangeissue cannot be overcome by any of the existing quantificationtechniques demanding sample fractionation and/or enrichmentfor specific proteins or a subset of proteins. In fact, it has beendescribed that the electrospray ionization (ESI) approach,the most widely used ionization technique to link the chro-matographic phase to the spectrometric phase, has a dynamicrange of 3–4 orders of magnitude limited by ion suppression(Zook & Bruins, 1997; Tang et al., 2004). For that reason,there are experimental approaches for sample pre-fractionationor proteome fractionation.
The review will therefore consider the sample as a com-plex mixture, and how this affects accurate determination ofprotein relative and absolute quantification. We will also con-sider the methods presently available for relative and absolutequantification on multiple proteins to derive systematicallyinformation on biomedical or biological material. It goeswithout saying that each approach has its strengths and weak-nesses, which will be highlighted within the course of thisreview.
II. PROCESSING BIOLOGICAL MATERIAL TOENABLE PROTEIN RELATIVE QUANTIFICATION
Shotgun proteomics is the most common strategy to overcomerelative and absolute protein quantification by proteomicapproaches. As this method relies on protein digestion, thesample complexity can become exceedingly large and it iscrucial to prepare the samples in a reproducible and uniform
fashion to make the quantification process comparable acrossdifferent samples and different experiments. The preparationof a sample for performing quantification shotgun based prote-omics covers four important steps: protein level fractionation,sample preparation, sample digestion, and peptide level frac-tionation which will be briefly discussed in this section.
A. Protein Level Fractionation
Prior to the relative quantification of proteomic samples, thetissue or biofluid must be lysed, fractionated and digested pre-ceding mass spectrometry analysis as shown in Figure 1. Thisis in part because even the ‘‘fastest’’ and most sensitive massspectrometers, which can acquire several tandem MS within asecond, are overwhelmed by the number of peptides, presentin a sample derived from a complex organism. Therefore,without protein fractionation, only a portion of the proteinspresent (high abundance proteins) would be identified peranalysis (Aebersold, 2003). Hence, a way to deal with thisdynamic range issue, is to fractionate the sample prior to di-gestion, focusing the study on a particular organelle (Jianget al., 2005; Foster et al., 2006; Gilchrist et al., 2006; Yinget al., 2006), or on a subset of proteins of interest which sharean specific post-translational modification such as phosphory-lation (Dephoure et al., 2008; Lee et al., 2010) or ubiquitina-tion (Shirran & Botting, 2010; Xu et al., 2010; Shi et al.,2011), or on a common substrate (Hemming et al., 2009).Thus, in plasma proteomics, depletion of highly abundant pro-teins is one of the most effective and commonly used strate-gies to enhance the detection sensitivity of low abundanceproteins (Anderson & Hunter, 2006; Keshishian et al., 2007;Kuhn et al., 2009).
B. Sample Preparation
Sample preparation is a critical step in a proteomics studyand can significantly influence the overall sensitivity of theanalysis for a given mass spectrometric platform. Hence, theimportance of sample preparation has been underlie in thedevelopment of new generation surfactants (Chen et al.,2007). Also, a ‘‘universal sample preparation method for pro-teome analysis’’ named filter-aided sample preparation method(FASP) has also been developed. FASP allows the solubiliza-tion of the proteins in SDS followed by urea exchange on a
FIGURE 1. Scheme of the principal quantitative proteomic approaches.
& RODRIGUEZ-SUAREZ AND WHETTON
2 Mass Spectrometry Reviews DOI 10.1002/mas
standard filter device allowing deeper proteome coverage,again with the aim of identifying and relatively quantifyinglow abundance proteins (Wisniewski et al., 2009, 2010).
C. Sample Digestion
As it has been pointed out before, shotgun proteomics is thecore proteomics method used today. Although other proteaseshave been used in proteomics experiments to increase thecoverage of the proteome such as Lys-C, Lys-N, or pepsin(Raijmakers et al., 2010; Taouatas et al., 2010; Lopez-Ferreret al., 2011; Walther & Mann, 2011), trypsin is the enzymeused in the vast majority of the proteomic studies due to itshigh substrate cleavage site specificity and also the result ofthe digestion of proteins with this protease is a pool of pepti-des with basic sites at both the N- and C-termini. Thisincreases the efficiency of the ionization process. Also, differ-ent digestion protocols have been optimized to increase theeffectiveness and reproducibility of the enzymatic reactionsuch mixtures of organic solvents and water (Russell et al.,2001; Strader et al., 2005), sonication or application of pres-sure to the sample during the proteolytic process (Carreiraet al., 2008; Lee et al., 2011). In addition, the combinationof multiple endoproteases in the same proteome analysis is agood strategy to deepen the proteome coverage due to thecomplementarily of the different enzymes which rendersdifferent peptides likely to be identified (Gauci et al., 2009;Helbig et al., 2010).
D. Peptide Level Fractionation
As previously mentioned, the reduction of sample complexityis essential in proteomics as the high abundance proteins canmask detection of the lower abundant proteins. To circumventthese limitations preparative peptide chromatography priorto LC-MS/MS analysis is the most widespread proteomicfractionation method. Peptide strong cation exchange (SCX),2D reversed phase–reversed phase (RP–RP) chromatographyor hydrophilic interaction chromatography (HILIC) helpsto reduce sample complexity, and to increase dramatically pro-teome coverage (Alpert, 1990; Chalkley et al., 2005; Gilaret al., 2005; Lau et al., 2011). Furthermore, the combinationof consecutive chromatographic steps to simplify sample com-plexity has been termed multidimensional protein identifica-tion technology (MudPIT) (Washburn et al., 2001). Anotherfractionation approach takes advantage of the atypical pres-ence of some amino acids. Hence, cysteine is a rare aminoacid but it is present in more than 90% of human proteins andits presence can constitute an advantage to simplify proteinsamples using methods like diagonal chromatography (Miseta& Csutora, 2000). Gevaert et al. developed a method to isolatesets of representative peptides with combined fractional-diagonalchromatography (COFRADIC) (Gevaert et al., 2003; Sandraet al., 2007).
The method of stable isotope standards and capture byanti-peptide antibodies (SISCAPA) was developed by Ander-son et al. using peptide-based antibodies to enrich targetedlow abundance peptides (Anderson et al., 2004; Hoofnagleet al., 2008). Another common approach for reducing thedynamic range of a complex mixture of proteins is sampleequalization (Righetti et al., 2005, 2006, 2010; Righetti &
Boschetti, 2008). This method uses combinatorial peptidelibraries to generate a complex set of bead-immobilizedligands, each of which is able to bind, with variable affinity, asmall subset of proteins in the analyte.
III. RELATIVE QUANTIFICATION TECHNIQUES
At the turn of the century, proteomics has been increasinglyapplied to the relative and absolute quantification of proteinsin complex samples such as cells, tissues or body fluids usinga number of techniques (see Fig. 1 for examples). Here weconsider those techniques in detail but in large part, the work-flows are extemporizations around the procedures shown inFigure 2.
A. Metabolic Labeling
Metabolic labeling for protein relative quantification requiresthe incorporation of stable isotope labels during the process ofcellular metabolism and during protein synthesis. Quantifica-tion via metabolic labeling circumvents sample handling re-producibility issues as samples can be mixed very early in thepreparative procedure. In addition, simultaneous measurementof ion intensities for two isotopomeric peptides in the samechromatographic run eliminates variations on performance ofliquid chromatography and mass spectrometry. Thus, differen-ces in amounts of injected sample and ion-suppression effectof co-eluting peptides do not contribute to error generation.For large-scale experiments stable isotope labeling in cellculture (SILAC) allows the in vivo incorporation of specificamino acids into all proteins via growth in the appropriate iso-topomeric essential amino acids for 5/6 cell passages (Ong,2002; Zhu et al., 2002). Therefore, cells are grown in medialacking one or several standard essential amino acids but sup-plemented with non-radioactive isotopically labeled forms ofthose amino acids. Whilst the assumption that stable isotopelabeling does not alter the physicochemical properties of apeptide is generally valid, it has been observed that deuteratedpeptides show small but significant retention time differencesin RP-LC compared to their non-deuterated counterparts(Zhang et al., 2001). Protein populations are mixed directlyafter harvesting and mass spectrometric identification is verystraightforward as it is possible to distinguish between the nor-mal and the isotopically labeled amino acid incorporation.This approach was first described for growing yeast in medi-um that was more than 96% enriched in 15N (Oda et al.,1999).
In the most commonly used approach for SILAC the me-dium contains 13C6-arginine and 13C6-lysine, which ensuresthat all tryptic products (except the C-terminal peptide) carryat least one labeled amino acid. However, in the case of yeastand several other microorganisms, arginine interconversion toproline can be problematic; this issue can be resolved by alter-ing experimental conditions, informatics analyses or evendeleting the enzymes necessary for amino acid conversion(Ong et al., 2003; Gruhler, 2005; Van Hoof et al., 2007; Bichoet al., 2010). In addition, by the time of planning the experi-ment it is worth to remember that without a complete labeling,the comparative analysis will bias the expression ratios. Inprinciple, any of the 20 amino acids could be used as tag forlabeling proteins but, of course, essential amino acids are the
QUANTIFICATION TECHNIQUES IN PROTEOMICS &
Mass Spectrometry Reviews DOI 10.1002/mas 3
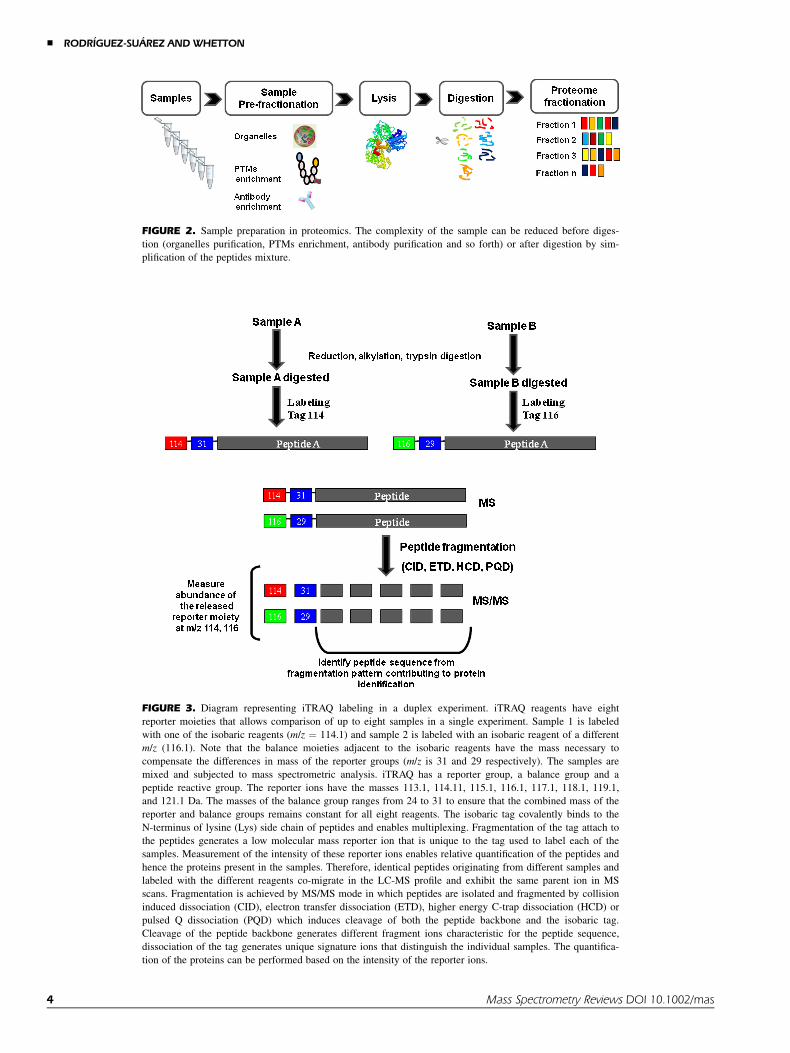
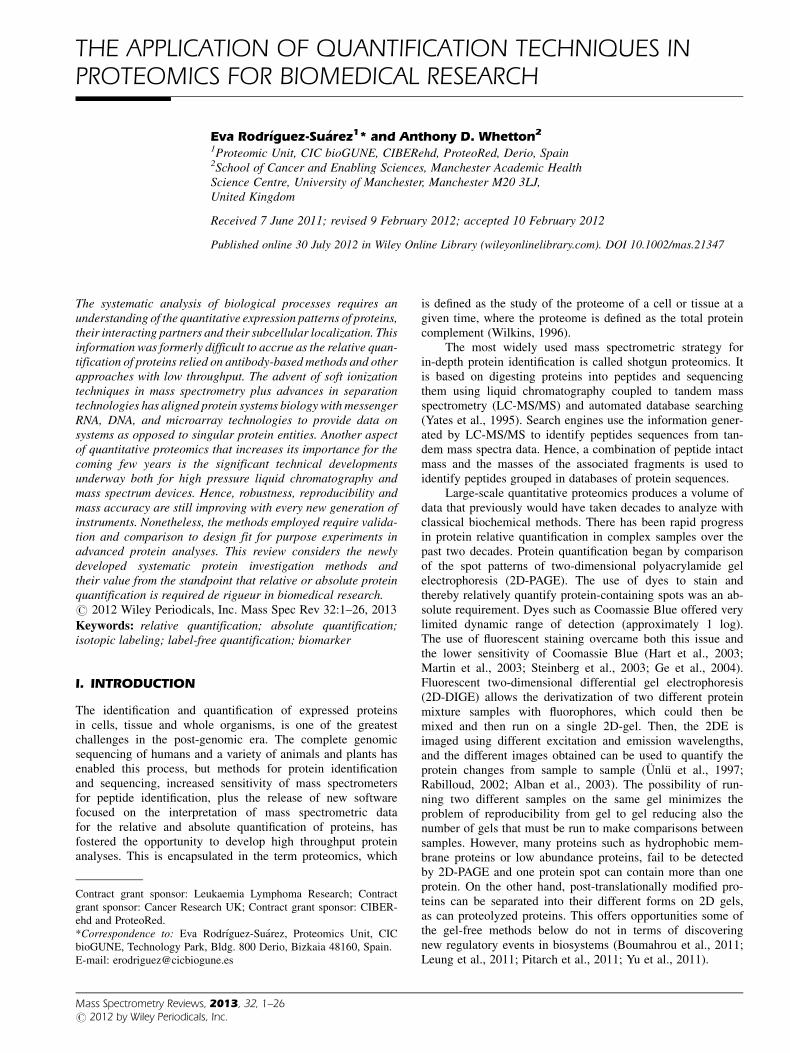
FIGURE 2. Sample preparation in proteomics. The complexity of the sample can be reduced before diges-
tion (organelles purification, PTMs enrichment, antibody purification and so forth) or after digestion by sim-
plification of the peptides mixture.
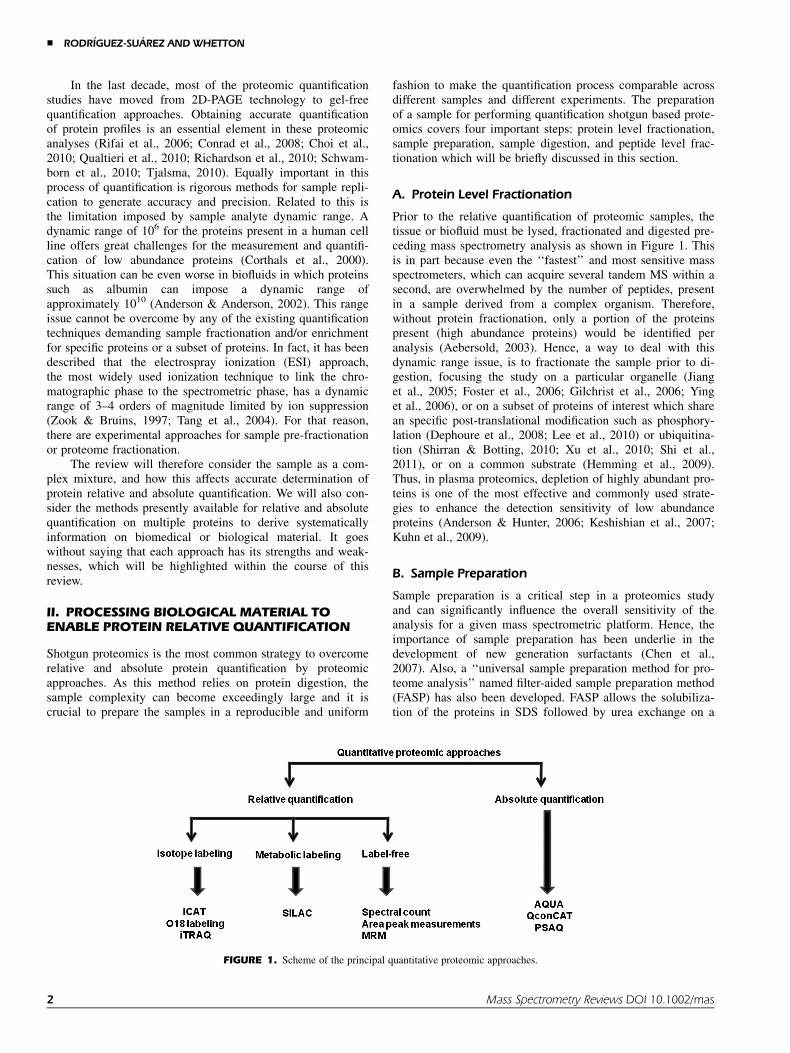
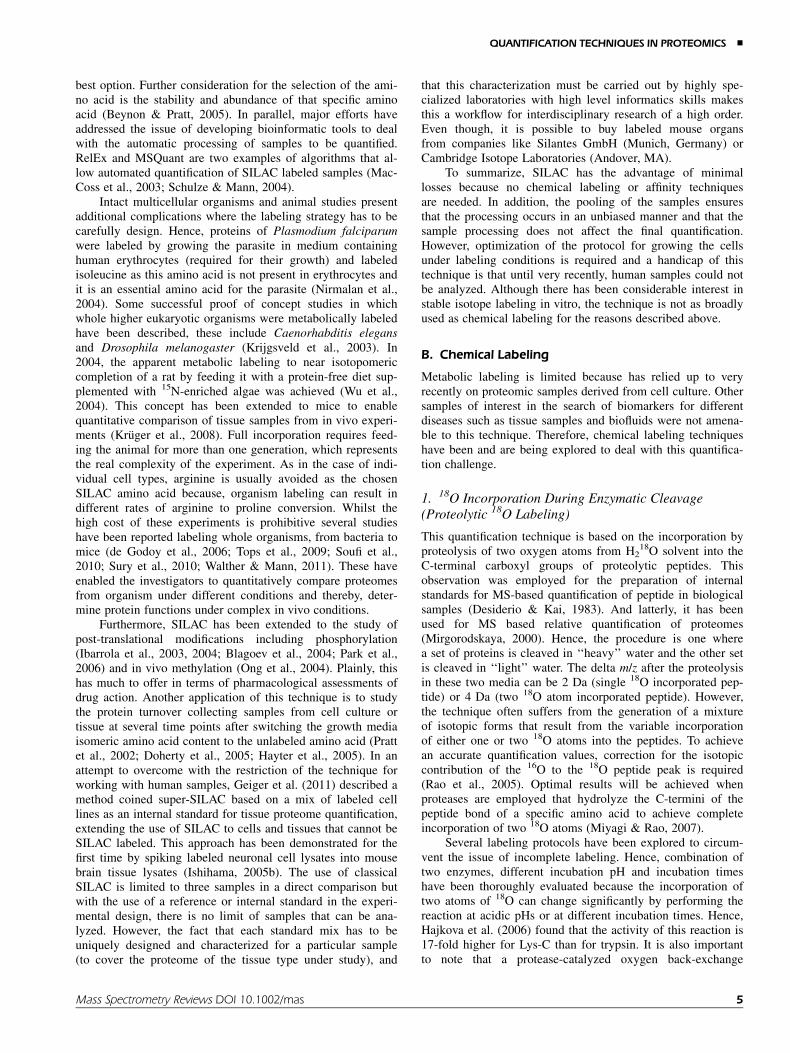
FIGURE 3. Diagram representing iTRAQ labeling in a duplex experiment. iTRAQ reagents have eight
reporter moieties that allows comparison of up to eight samples in a single experiment. Sample 1 is labeled
with one of the isobaric reagents (m/z ¼ 114.1) and sample 2 is labeled with an isobaric reagent of a different
m/z (116.1). Note that the balance moieties adjacent to the isobaric reagents have the mass necessary to
compensate the differences in mass of the reporter groups (m/z is 31 and 29 respectively). The samples are
mixed and subjected to mass spectrometric analysis. iTRAQ has a reporter group, a balance group and a
peptide reactive group. The reporter ions have the masses 113.1, 114.11, 115.1, 116.1, 117.1, 118.1, 119.1,
and 121.1 Da. The masses of the balance group ranges from 24 to 31 to ensure that the combined mass of the
reporter and balance groups remains constant for all eight reagents. The isobaric tag covalently binds to the
N-terminus of lysine (Lys) side chain of peptides and enables multiplexing. Fragmentation of the tag attach to
the peptides generates a low molecular mass reporter ion that is unique to the tag used to label each of the
samples. Measurement of the intensity of these reporter ions enables relative quantification of the peptides and
hence the proteins present in the samples. Therefore, identical peptides originating from different samples and
labeled with the different reagents co-migrate in the LC-MS profile and exhibit the same parent ion in MS
scans. Fragmentation is achieved by MS/MS mode in which peptides are isolated and fragmented by collision
induced dissociation (CID), electron transfer dissociation (ETD), higher energy C-trap dissociation (HCD) or
pulsed Q dissociation (PQD) which induces cleavage of both the peptide backbone and the isobaric tag.
Cleavage of the peptide backbone generates different fragment ions characteristic for the peptide sequence,
dissociation of the tag generates unique signature ions that distinguish the individual samples. The quantifica-
tion of the proteins can be performed based on the intensity of the reporter ions.
& RODRIGUEZ-SUAREZ AND WHETTON
4 Mass Spectrometry Reviews DOI 10.1002/mas
best option. Further consideration for the selection of the ami-no acid is the stability and abundance of that specific aminoacid (Beynon & Pratt, 2005). In parallel, major efforts haveaddressed the issue of developing bioinformatic tools to dealwith the automatic processing of samples to be quantified.RelEx and MSQuant are two examples of algorithms that al-low automated quantification of SILAC labeled samples (Mac-Coss et al., 2003; Schulze & Mann, 2004).
Intact multicellular organisms and animal studies presentadditional complications where the labeling strategy has to becarefully design. Hence, proteins of Plasmodium falciparumwere labeled by growing the parasite in medium containinghuman erythrocytes (required for their growth) and labeledisoleucine as this amino acid is not present in erythrocytes andit is an essential amino acid for the parasite (Nirmalan et al.,2004). Some successful proof of concept studies in whichwhole higher eukaryotic organisms were metabolically labeledhave been described, these include Caenorhabditis elegansand Drosophila melanogaster (Krijgsveld et al., 2003). In2004, the apparent metabolic labeling to near isotopomericcompletion of a rat by feeding it with a protein-free diet sup-plemented with 15N-enriched algae was achieved (Wu et al.,2004). This concept has been extended to mice to enablequantitative comparison of tissue samples from in vivo experi-ments (Kruger et al., 2008). Full incorporation requires feed-ing the animal for more than one generation, which representsthe real complexity of the experiment. As in the case of indi-vidual cell types, arginine is usually avoided as the chosenSILAC amino acid because, organism labeling can result indifferent rates of arginine to proline conversion. Whilst thehigh cost of these experiments is prohibitive several studieshave been reported labeling whole organisms, from bacteria tomice (de Godoy et al., 2006; Tops et al., 2009; Soufi et al.,2010; Sury et al., 2010; Walther & Mann, 2011). These haveenabled the investigators to quantitatively compare proteomesfrom organism under different conditions and thereby, deter-mine protein functions under complex in vivo conditions.
Furthermore, SILAC has been extended to the study ofpost-translational modifications including phosphorylation(Ibarrola et al., 2003, 2004; Blagoev et al., 2004; Park et al.,2006) and in vivo methylation (Ong et al., 2004). Plainly, thishas much to offer in terms of pharmacological assessments ofdrug action. Another application of this technique is to studythe protein turnover collecting samples from cell culture ortissue at several time points after switching the growth mediaisomeric amino acid content to the unlabeled amino acid (Prattet al., 2002; Doherty et al., 2005; Hayter et al., 2005). In anattempt to overcome with the restriction of the technique forworking with human samples, Geiger et al. (2011) described amethod coined super-SILAC based on a mix of labeled celllines as an internal standard for tissue proteome quantification,extending the use of SILAC to cells and tissues that cannot beSILAC labeled. This approach has been demonstrated for thefirst time by spiking labeled neuronal cell lysates into mousebrain tissue lysates (Ishihama, 2005b). The use of classicalSILAC is limited to three samples in a direct comparison butwith the use of a reference or internal standard in the experi-mental design, there is no limit of samples that can be ana-lyzed. However, the fact that each standard mix has to beuniquely designed and characterized for a particular sample(to cover the proteome of the tissue type under study), and
that this characterization must be carried out by highly spe-cialized laboratories with high level informatics skills makesthis a workflow for interdisciplinary research of a high order.Even though, it is possible to buy labeled mouse organsfrom companies like Silantes GmbH (Munich, Germany) orCambridge Isotope Laboratories (Andover, MA).
To summarize, SILAC has the advantage of minimallosses because no chemical labeling or affinity techniquesare needed. In addition, the pooling of the samples ensuresthat the processing occurs in an unbiased manner and that thesample processing does not affect the final quantification.However, optimization of the protocol for growing the cellsunder labeling conditions is required and a handicap of thistechnique is that until very recently, human samples could notbe analyzed. Although there has been considerable interest instable isotope labeling in vitro, the technique is not as broadlyused as chemical labeling for the reasons described above.
B. Chemical Labeling
Metabolic labeling is limited because has relied up to veryrecently on proteomic samples derived from cell culture. Othersamples of interest in the search of biomarkers for differentdiseases such as tissue samples and biofluids were not amena-ble to this technique. Therefore, chemical labeling techniqueshave been and are being explored to deal with this quantifica-tion challenge.
1. 18O Incorporation During Enzymatic Cleavage(Proteolytic 18O Labeling)
This quantification technique is based on the incorporation byproteolysis of two oxygen atoms from H2
18O solvent into theC-terminal carboxyl groups of proteolytic peptides. Thisobservation was employed for the preparation of internalstandards for MS-based quantification of peptide in biologicalsamples (Desiderio & Kai, 1983). And latterly, it has beenused for MS based relative quantification of proteomes(Mirgorodskaya, 2000). Hence, the procedure is one wherea set of proteins is cleaved in ‘‘heavy’’ water and the other setis cleaved in ‘‘light’’ water. The delta m/z after the proteolysisin these two media can be 2 Da (single 18O incorporated pep-tide) or 4 Da (two 18O atom incorporated peptide). However,the technique often suffers from the generation of a mixtureof isotopic forms that result from the variable incorporationof either one or two 18O atoms into the peptides. To achievean accurate quantification values, correction for the isotopiccontribution of the 16O to the 18O peptide peak is required(Rao et al., 2005). Optimal results will be achieved whenproteases are employed that hydrolyze the C-termini of thepeptide bond of a specific amino acid to achieve completeincorporation of two 18O atoms (Miyagi & Rao, 2007).
Several labeling protocols have been explored to circum-vent the issue of incomplete labeling. Hence, combination oftwo enzymes, different incubation pH and incubation timeshave been thoroughly evaluated because the incorporation oftwo atoms of 18O can change significantly by performing thereaction at acidic pHs or at different incubation times. Hence,Hajkova et al. (2006) found that the activity of this reaction is17-fold higher for Lys-C than for trypsin. It is also importantto note that a protease-catalyzed oxygen back-exchange
QUANTIFICATION TECHNIQUES IN PROTEOMICS &
Mass Spectrometry Reviews DOI 10.1002/mas 5
reaction will occur when the two digests are mixed, unless theprotease is completely inactivated before sample mixing (Staeset al., 2004). To help to overcome this ambiguity, a protocolwith inverse 18O-labeling has been described (Wang et al.,2001). Significant advances in the technique were also achiev-ed by decoupling the 18O labeling from the digestion step(Yao et al., 2003) or by immobilizing the trypsin (Sevinskyet al., 2007; Mirza et al., 2008).
On a different front major efforts have been undertakento address the issue of developing bioinformatics tools to dealwith the incomplete labeling of samples to be quantified.There are several software packages that allowed interpreta-tion of the data from 18O-labeling experiments in an automat-ed fashion. Hence, Matching automatically calculates thesample ratio but it is not linked to a search engine so theidentified peptides and its spectrum have to be imported be-fore quantification (Fernandez-de-Cossio et al., 2004). Halli-gan et al. (2005) developed a software named Zoom-Quantthat quantifies data derived from an ion trap instrument(Thermo Fisher Scientific, Foster City, MA) and it is linkedwith the database search engine SEQUEST. Another computa-tional tool which quantifies 18O labeling samples in an auto-mated fashion is STEM, which is linked to the databasesearch tool Mascot (Shinkawa et al., 2005). Furthermore, algo-rithms to measure the 18O labeling efficiency of each ofthe quantified peptide pairs have also been described (Ramos-Fernandez et al., 2007) as well as several models of correctionfor sources of variance at the scan, peptide, and protein levels(Jorge et al., 2009).
The major use of 18O labeling techniques have been incomparative proteomics. The first proteomic application ofthis technique was for comparing two serotypes of Adenovirus(Yao et al., 2001). This labeling technique has also been usedto compare proteomes of cells and tissues (Zang et al., 2004)and to analyze protein post-translation modifications such asphosphorylation (Gevaert et al., 2005; Dave et al., 2009; Leeet al., 2009).
Overall, the reproducibility of the 18O labeling reaction isnot simple as several parameters can modify the addition ofone or two 18O atoms and a standard protocol of general ap-plicability is still lacking. Considering that the reagent needed(18O-labeled water) is extremely stable and cheap, this tech-nique is not among the most popular proteomics techniquesdue to two major drawbacks: first, labeling takes place late inthe overall analytical process, introducing several opportuni-ties for technical variation; second, variable incorporation of18O atoms is an important source of inaccurate assessment.Without hesitate, to overcome these drawbacks and achieve astandardize protocol for 18O labeling would turn this approachin one of the gold standards of proteomic quantification.
2. Isobaric Tags for Relative Quantification
Isobaric tag-based methods permit simultaneous determinationof both the identity and relative abundances of peptide pairsusing a peptide-fragmentation-based analysis (Thompson,2003). Tandem mass tags (TMTs) consist of a reactive group,balance and a reporter group. Peptides derivatized with TMTsare indistinguishable in the LC-MS dimension but upon frag-mentation low mass MS/MS ions are generated, which can berelated to the original samples prior to mixture and used for
quantification (Dayon et al., 2008). iTRAQ, a further develop-ment of the TMTs, gives multiple reporter ions in a lowermass region, therefore, the reporter ions from iTRAQ haveless overlap with the most intense peptide fragmentation ions;and this method is suited for relative quantification (Rosset al., 2004) (see Fig. 3 for a typical workflow). An iTRAQlabeling kit with the isobaric reagents has been commercial-ized by AB SCIEX Instruments and currently allows compari-son of up to eight different samples (Ueda et al., 2010;Bewley et al., 2011). iTRAQ labeling is based on the sameprinciples as TMTs and its main advantage compared with allthe other quantification techniques is that up to eight samplescan be analyzed simultaneously. This reduces MS analysistime, the sample amount required for the experiment andincreases the confidence in peptide identification. Because thepeptides with the same precursor ion but different reporterions fragment at the same time, a higher intensity of the pep-tide precursor and product ions is achieved. Therefore, iTRAQis being widely used by the scientific community for compara-tive protein quantification in different cell lines and tissuetypes. Furthermore, the fact that this method is suitable forbiomedical studies makes it extremely attractive for biomarkerdiscovery.
Despite all its advantages, it has been described that thelow mass of the reporter ions makes the iTRAQ reagentincompatible with most ion traps due to these instruments’low mass cut-off. This limitation can be overcome by pulsedQ dissociation (PQD) or higher energy C-trap dissociation(HCD); both facilitate iTRAQ analysis on these instrumenttypes improving the stabilization of low m/z fragments (Griffinet al., 2007; Olsen et al., 2007). However, it has been reportedthat PQD suffers from poor fragmentation efficiency (Bant-scheff et al., 2008). Hence, new analytical strategies havebeen published showing that a combination of HCD and colli-sion activated dissociation (CAD) or HCD and CAD/ETDallow sensitive and accurate protein identification and quantifi-cation by iTRAQ labeling in ion trap instruments (Kocheret al., 2009; Mischerikow et al., 2010).
Even though quantitative applications of MALDI-TOFMS/MS present some additional challenges compared to ESImethods, numerous group have pursued analyses successfullyusing iTRAQ labeled samples with MALDI source employedfor peptide ionization (Ruppen et al., 2010; Besson et al.,2011; Fernandez-Puente et al., 2011). The reproducibility ofthe crystallization process matrix-analyte is not uniform acrossthe target surface, but this handicap can be overcome acquir-ing and averaging many single-shot spectra from several posi-tions within a given sample thereby gaining accuracy in thequantification (Duncan et al., 2008). Despite its handicaps, theeasy of use, low cost and possibility of analyzing the samplerepeatedly makes MALDI an attractive alternative as an ioni-zation method for iTRAQ quantification. Furthermore, a recentcomparison between ESI and MALDI iTRAQ quantificationshowed that reporter ions measured by MALDI MS/MS weremore accurate than those measured by ESI-MS/MS and thatby using MALDI for the ionization process, gave less under-estimates of protein expression levels (Shirran & Botting,2010).
In addition, the appropriate analysis of data obtained foriTRAQ-labeled samples is very important; the accuracy of thequantitative values obtained is highly dependent on the
& RODRIGUEZ-SUAREZ AND WHETTON
6 Mass Spectrometry Reviews DOI 10.1002/mas
quantitative algorithm and the statistical methods applied. Themost popular software to analyze iTRAQ labeled data is Pro-tein Pilot (AB SCIEX Instruments, Franklin, CA) but manyother have been developed. Although ProQUANT software,PEAKS-Q, MASCOT, Multi-Q and i-TRACKER/TandTRACKand are often used for the quantification of iTRAQ-labeledsamples, they have limitations (Shadforth et al., 2005; Linet al., 2006; Laderas et al., 2007; Yu et al., 2007). ProQUANTis only able to handle data from AB SCIEX Instruments.
i-TRACKER/TandTRACK are limited to peptide levelquantification and no protein level analysis is provided. Multi-Q provides quantification on the peptide and protein level butdoes not integrate identification and quantification of the pro-teins in the same software package. PEAKS-Q and MASCOThave good MS/MS search engines but they do not always pro-vide optimal quantitative iTRAQ results (Lacerda et al.,2008). The virtual expert mass spectrometry (VEMS) software(Matthiesen et al., 2005) has been updated to an integratedtool for database-dependent search of MS/MS spectra, quanti-fication and database storage for iTRAQ labeled samples.VEMS also corrects intensity values affected by saturation andcan integrate and summarize results from replica experiments(Rodrıguez-Suarez et al., 2010).
Despite iTRAQ’s analytical power for performing highthroughput quantitative experiments and its many advantagesmentioned above, iTRAQ labeling has some drawbacks thatmust be considered when analyzing the data derived from thisquantitative approach. The main weakness for iTRAQ quanti-fication data analysis are the impurities of specific isobariciTRAQ reagents and also the need for a relatively high intensi-ty of reporter ions (Bantscheff et al., 2007; Ow et al., 2010).Cross-label isotopic impurity is one of the factors liable toaffect the dynamic range achievable by iTRAQ and systemati-cally arises from manufacturer label reagents impurities andpeptide co-fragmentation (D’Ascenzo et al., 2008; Savitskiet al., 2010). The former is easily solved by using manufactur-er-supplied correction-enabling values but the latter is moreproblematic. Furthermore, despite the fact that quantificationin MS/MS mode should, in theory, provide a higher dynamicrange, because tandem MS spectra typically exhibit less signalcomplexity, it has been observed that matrix contribution andco-eluting peptides significantly limit the dynamic range, in-creasing the exhibited heterogeneity of variance, where thevariance is higher for low intensity signals (Ow et al., 2009;Burkhart et al., 2011). In addition, concerns have been raisedthat iTRAQ has lower accuracy when ratios tend towards one.This under-estimation has been reported across several MSplatforms and has been suggested to arise from co-eluting pep-tides which can be selected within the ion transmission win-dow and co-fragmented during CAD, resulting in product ionfragmentation components that do not exclusively belong tothe selected precursor (Hoopmann et al., 2007; Luethy et al.,2008). Nonetheless, to help to overcome these problems, atwo component error model which stabilizes the variance foran entire dataset across the full intensity range has been devel-oped by Karp et al. (2010).
Overall, iTRAQ is a well-established relative quantifica-tion approach, which has been widely used in comparativeproteomic studies, and biomarkers search (Guo et al., 2010;Dahlhaus et al., 2011; Sela et al., 2011; VanGuilder et al.,2011; Voisin et al., 2011; Leivonen et al., 2012). As an
example of multiplex studies, the 8-plex version of this ap-proach was used to evaluate the activity of six leukemogenictyrosine kinases and to evaluate protein expression changes insubjects subjected to immunoglobulin treatment for Alzheimerdisease among others (Choe et al., 2007; Pierce et al., 2008).In general and despite its limitations and drawbacks discussedabove, iTRAQ has become probably the most widespreadproteomic quantification technique used by proteomics com-munity over the last 8 years.
C. Label-Free Quantification
The majority of relative quantitative methods include isotopiclabeling of the samples, which requires multiple sample prepa-ration steps and can result in increased experimental variabili-ty. Label-free LC-MS quantification methods have beenintroduced to determine relative abundances of proteins be-tween multiple conditions because it is argued ESI providessignal responses that correlate linearly with increasing concen-tration (Voyksner & Lee, 1999; Chelius & Bondarenko, 2002).Certain label-free LC-MS-based strategies for the global pro-filing of complex protein mixtures are based on spectral count-ing or the number of MS/MS events observed for a specificprotein (Grossmann et al., 2010). The relative quantification ofpeptides can also be attained by direct evaluation of peakmeasurements (peak intensities and peak area measurements)(Bondarenko et al., 2002; Chelius & Bondarenko, 2002).More recently, data independent exact mass LC-MS strategieshave been described as an alternative to isotopically labeledand spectral counting based label-free LC-MS quantificationmethods (Radulovic et al., 2004; Silva et al., 2005, 2006a;Wang et al., 2006). In contrast to stable labeling methods, anobvious issue with label-free approaches based on peak inten-sity and area measurement is the experimental error derivedby run to run variations in LC performance, amounts ofinjected samples and ion suppression. The advantages and dis-advantages of these methods are further discussed below.
1. Spectral Count
Spectral count (SC), defined as the total number of spectraidentified for a protein, has gained popularity as a label-freerelative quantification approach. It is based on the empiricalobservation that the greater the molar quantity of a proteinpresent in a sample, the more the tandem MS spectra are col-lected for this protein in data-dependent acquisition. Eventual-ly, in a spike-in experiment the linear relationship across twoorders of magnitude between spectral counts and protein con-centration was demonstrated (Liu et al., 2004). Just prior SCwas established as a relative quantification metric, Allet et al.described a similar method of estimating protein abundancebased on summing the identification scores of every peptidefor a given protein (Allet, 2004). Later coined as peptidematch score summation (PMSS), this approach relates SC andproteins abundance weighting each peptide by its identificationscore (Colinge et al., 2004).
The most widespread proteomic measurement for SC isthe protein abundance index (PAI). It is calculated by dividingthe total number of proteolytic peptides within a protein bythe observed peptides (Rappsilber et al., 2002). Peptides usedfor calculating PAI value are not always unique for a single
QUANTIFICATION TECHNIQUES IN PROTEOMICS &
Mass Spectrometry Reviews DOI 10.1002/mas 7
protein (Zhang et al., 2006) hence, this index was later refinedto use the number of unique peptides and to be exponentiallymodified PAI (giving the term emPAI) because it was shownempirically it provided the best correlation with the proteinabundance within a mixture (Ishihama, 2005b). The emPAIvalue has also been used by commercial search engines suchas those supplied by Matrix Science to give a quantificationvalue of the proteins identified in a matrix of medium-to highcomplexity. Also, a free web application called EmPAI Calccalculates the emPAI from the protein identification resultsobtained by database search engines such as Mascot, allowingthe user to modify threshold scores (Shinoda et al., 2010).These approaches have been broadly used to compare prote-ome profiles by many investigators. For example, the emPAIstrategy was used by Beretta’s group to generate a semi-quantitative profile of proteins in murine liver and plasma (Laiet al., 2008), by Han et al. to evaluate pathological stagesof multiple sclerosis (Han et al., 2008), by Gramolini et al. tostudy cardiac ventricle isolated from a mouse model of cardio-myopathy (Gramolini et al., 2008) or by de Souza et al. todescribe proteomic differences between two closely relatedMycobacterium tuberculosis genotype strains (de Souza et al.,2010).
In the last years, researchers have exploited the possibili-ties of SC as an abundance index introducing modifications toimprove the accuracy of the quantification approach. Furtheradvances have been made by using computational models,which predict the peptides of a given protein with a higherprobability of being detected by the mass spectrometer andconsequently used for accurate quantification. For example,the SC method termed absolute protein expression (APEX)profiling sums the probability of observing each peptide andcorrects for the fact that not all the tryptic peptides are proteo-typic, based on amino acid number which is argued to bedirectly linked to their ionization efficiency (Mallick et al.,2007). In addition, this value is multiplied by the protein’sprobability to give confidence in protein identification (Luet al., 2007). APEX has been released as a free-open sourceapplication termed the APEX Quantitative Proteomics Tool(Braisted et al., 2008) and was applied to study the averagenumber of protein copies per cell in a cell population,for a large fraction of the proteome of the human pathogenLeptospira interrogan (Malmstrom et al., 2009).
SC has also been modified to take into consideration thenumber of residues in the protein under study. This variantof spectral counting is called normalized spectral abundancefactor (NSAF), calculated by dividing the SC value for a pro-tein by its length (Florens et al., 2006; Zybailov et al., 2006,2007). This metric has been applied in the study of rat livermembrane proteins, human protein interaction networks andmouse renal cortex proteins (Chick et al., 2008; Sardiu et al.,2008; Zhao et al., 2008). A newer metric includes the frag-ment ion intensity to give a normalized spectral index (SIN)and has been shown to reduce variability across samples, prob-ably due to its capacity to discern co-eluting peaks (Sardiu &Washburn, 2010). Furthermore, a good correlation betweenquantification using SIN and western blot analysis has beenreported in a study using lung tissue samples (Griffin et al.,2010). The method thus has application in discovering proteinchanges but as with all such studies, validation is required.The sensitivity and dynamic range the approach offers are,
as in iTRAQ experiments and other approaches, in need ofcareful consideration. Systematic analysis of protein networkchanges between samples using this approach is feasible withcaution because of its semi-quantitative nature.
Numerous studies have performed relative quantificationby SC and these confirm that the relative quantification of thepeptides can be achieved by comparison of peak intensity orpeak area measurements. Hence, an interesting study by Oldet al. reported that SC was more sensitive in detecting differ-ences in expression between proteins but that peak intensitymeasurements were more accurate than SC measurements(Old et al., 2005). However, SC is very useful within a narrowprotein dynamic range hence, once a higher protein concentra-tion is reached and the majority of the observable peptideshave been identified, the linear relationship between observedpeptides and protein concentration reaches an asymptotic lim-it. Inevitably, this biases detection towards the most abundantproteins and raises issues of dynamic range in detection(Ghaemmaghami et al., 2003). Hence, even when the methodhas a strong linear correlation, SC lacks sensitivity to detectsmall expression differences particularly among proteins witha low spectral count value. Furthermore, for lower resolutionmass spectrometers SC is said to be more accurate than ionsignal intensity quantification methods (Zybailov et al., 2005),however, for higher resolution instruments a better level ofperformance has been described basing the analysis on intensi-ty signals (Mueller et al., 2008). Thus, any biological experi-ment needs to determine its objectives and develop MSmethods on preferred outcomes from their experiment.
In conclusion, SC methods break down for low abun-dance proteins, which are a characteristic and sizeable portionof a proteomic samples and often the protein of interest forthe biomedical researchers. However, the increase in the speedfor performing MS/MS events of the latest generation massspectrometry instruments together with the development ofbetter algorithms to identify proteotypic peptides, shouldimprove the accuracy of spectral count measurements.
2. Peak Measurements Quantification
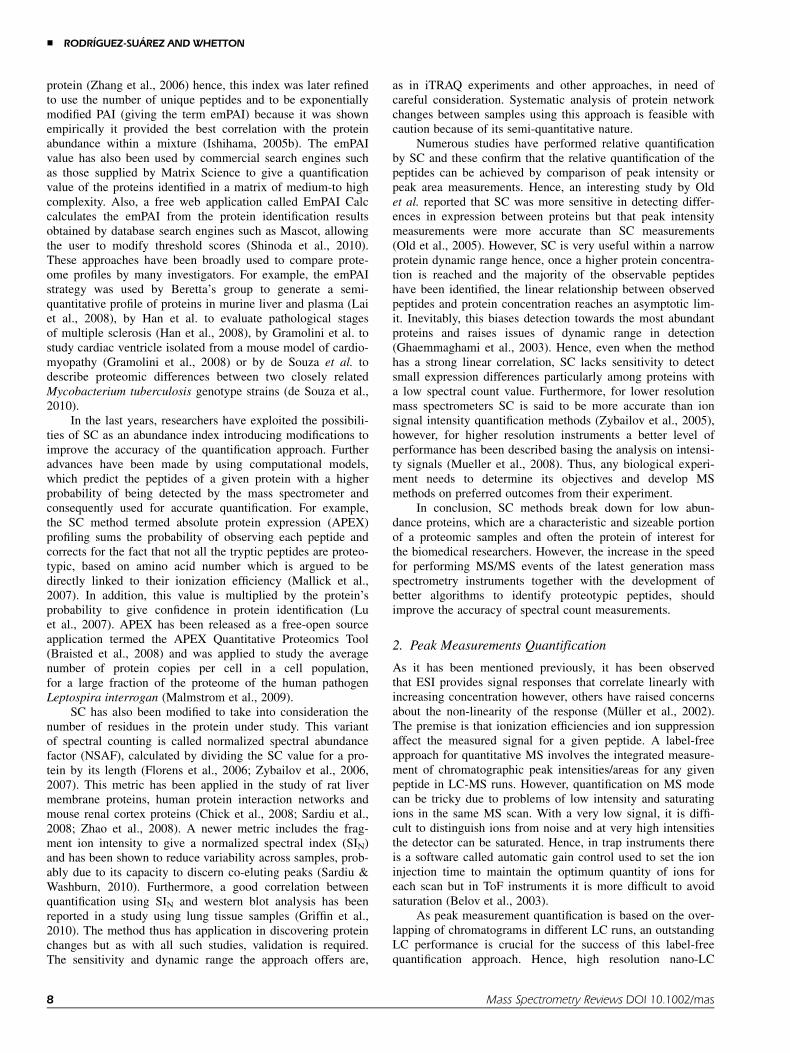
As it has been mentioned previously, it has been observedthat ESI provides signal responses that correlate linearly withincreasing concentration however, others have raised concernsabout the non-linearity of the response (Muller et al., 2002).The premise is that ionization efficiencies and ion suppressionaffect the measured signal for a given peptide. A label-freeapproach for quantitative MS involves the integrated measure-ment of chromatographic peak intensities/areas for any givenpeptide in LC-MS runs. However, quantification on MS modecan be tricky due to problems of low intensity and saturatingions in the same MS scan. With a very low signal, it is diffi-cult to distinguish ions from noise and at very high intensitiesthe detector can be saturated. Hence, in trap instruments thereis a software called automatic gain control used to set the ioninjection time to maintain the optimum quantity of ions foreach scan but in ToF instruments it is more difficult to avoidsaturation (Belov et al., 2003).
As peak measurement quantification is based on the over-lapping of chromatograms in different LC runs, an outstandingLC performance is crucial for the success of this label-freequantification approach. Hence, high resolution nano-LC
& RODRIGUEZ-SUAREZ AND WHETTON
8 Mass Spectrometry Reviews DOI 10.1002/mas
systems, where temperature or pressure fluctuations have to bestrictly controlled, high resolution columns, minimal dead vol-ume connections and avoidance of column saturation are someof the precautions which should be taken to perform a highquality label-free quantification experiment. Peptides usuallyelute from the LC column resulting in a signal across timewith a variable concentration and different charge states arefrequently measured for a specific peptide, resulting in signalsin different regions of the chromatogram for the same peptide.Hence, special attention must be taken with those peptides,which elute over a long period causing overlapping with co-eluting peptides. Furthermore, due to technical variations,there may be fluctuations in retention time (RT) if samples tobe compared are run on different columns. A further criticalstep is to pair or group peaks from one LC-MS profile withthe same peak/peptide in other profiles. The same peptidesacross the different chromatograms should share the same m/zand RT. Regular calibration of the mass spectrometer ensuresthat the m/z fluctuation is controlled, however, the RT valuesare more difficult to keep consistent for any specific molecularentity. Slight variations in the age of an LC column can causefluctuations in the RT. In addition, peptide elution peak widthwill increase at later elution times and for high intensity peakswill often display tailing. Thus, monitoring is required to min-imize peak width as much as possible during LC-MSacquisition.
After the acquisition of the data, computational methodsare required to enable time alignment, background subtraction,and intensity normalization which can account for proteinloading and electrospray differences (Wang et al., 2003). Theabove demonstrates with hopefully some clarity the analyticalchallenges of this kind of study for systems biology and dis-covery proteomics. Beyond the MS analysis lies the generationof information from data hence, once the alignment of thechromatograms has been achieved, normalization of the datais essential for improvement of the quantitative accuracy ofthe experiment. Hence, abundance normalization will correctfor bias due to sample loading, ionization efficiency fluctua-tions or carry-over. Numerous large-scale label-free quantita-tive proteomics studies have been performed in the last years,most of them focusing on the search of biomarkers for differ-ent diseases (Amon et al., 2010; Silvestrini et al., 2010; Cimaet al., 2011; Mao et al., 2011).
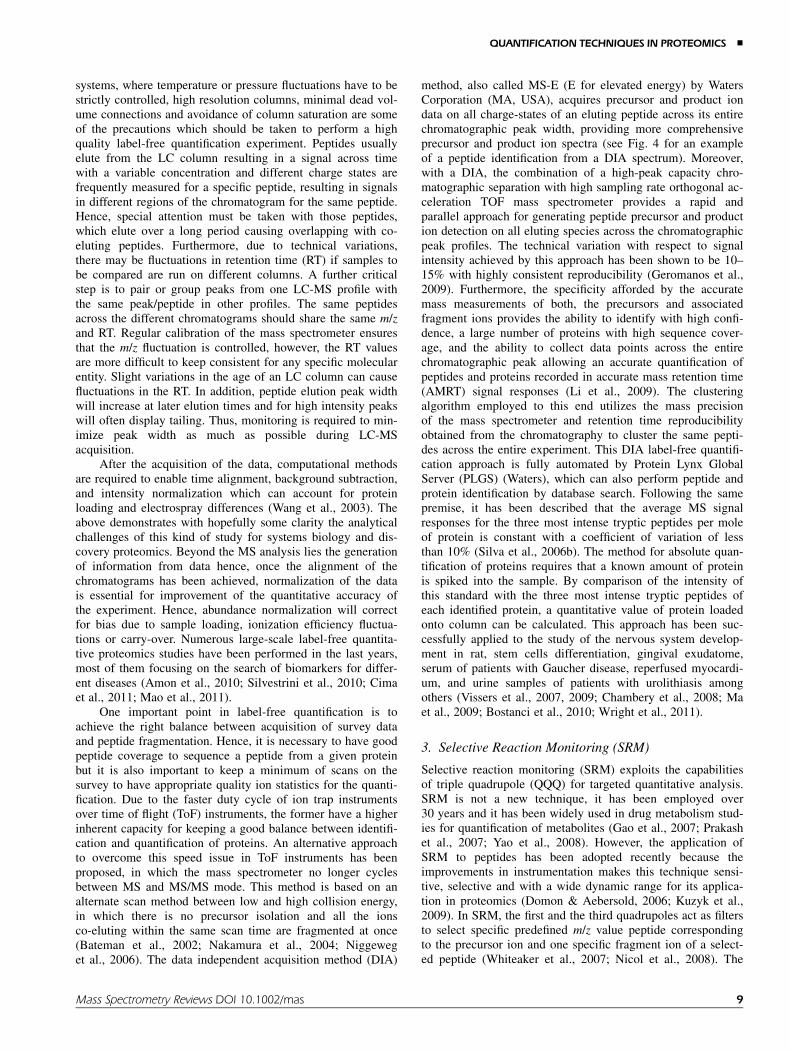
One important point in label-free quantification is toachieve the right balance between acquisition of survey dataand peptide fragmentation. Hence, it is necessary to have goodpeptide coverage to sequence a peptide from a given proteinbut it is also important to keep a minimum of scans on thesurvey to have appropriate quality ion statistics for the quanti-fication. Due to the faster duty cycle of ion trap instrumentsover time of flight (ToF) instruments, the former have a higherinherent capacity for keeping a good balance between identifi-cation and quantification of proteins. An alternative approachto overcome this speed issue in ToF instruments has beenproposed, in which the mass spectrometer no longer cyclesbetween MS and MS/MS mode. This method is based on analternate scan method between low and high collision energy,in which there is no precursor isolation and all the ionsco-eluting within the same scan time are fragmented at once(Bateman et al., 2002; Nakamura et al., 2004; Niggeweget al., 2006). The data independent acquisition method (DIA)
method, also called MS-E (E for elevated energy) by WatersCorporation (MA, USA), acquires precursor and product iondata on all charge-states of an eluting peptide across its entirechromatographic peak width, providing more comprehensiveprecursor and product ion spectra (see Fig. 4 for an exampleof a peptide identification from a DIA spectrum). Moreover,with a DIA, the combination of a high-peak capacity chro-matographic separation with high sampling rate orthogonal ac-celeration TOF mass spectrometer provides a rapid andparallel approach for generating peptide precursor and production detection on all eluting species across the chromatographicpeak profiles. The technical variation with respect to signalintensity achieved by this approach has been shown to be 10–15% with highly consistent reproducibility (Geromanos et al.,2009). Furthermore, the specificity afforded by the accuratemass measurements of both, the precursors and associatedfragment ions provides the ability to identify with high confi-dence, a large number of proteins with high sequence cover-age, and the ability to collect data points across the entirechromatographic peak allowing an accurate quantification ofpeptides and proteins recorded in accurate mass retention time(AMRT) signal responses (Li et al., 2009). The clusteringalgorithm employed to this end utilizes the mass precisionof the mass spectrometer and retention time reproducibilityobtained from the chromatography to cluster the same pepti-des across the entire experiment. This DIA label-free quantifi-cation approach is fully automated by Protein Lynx GlobalServer (PLGS) (Waters), which can also perform peptide andprotein identification by database search. Following the samepremise, it has been described that the average MS signalresponses for the three most intense tryptic peptides per moleof protein is constant with a coefficient of variation of lessthan 10% (Silva et al., 2006b). The method for absolute quan-tification of proteins requires that a known amount of proteinis spiked into the sample. By comparison of the intensity ofthis standard with the three most intense tryptic peptides ofeach identified protein, a quantitative value of protein loadedonto column can be calculated. This approach has been suc-cessfully applied to the study of the nervous system develop-ment in rat, stem cells differentiation, gingival exudatome,serum of patients with Gaucher disease, reperfused myocardi-um, and urine samples of patients with urolithiasis amongothers (Vissers et al., 2007, 2009; Chambery et al., 2008; Maet al., 2009; Bostanci et al., 2010; Wright et al., 2011).
3. Selective Reaction Monitoring (SRM)
Selective reaction monitoring (SRM) exploits the capabilitiesof triple quadrupole (QQQ) for targeted quantitative analysis.SRM is not a new technique, it has been employed over30 years and it has been widely used in drug metabolism stud-ies for quantification of metabolites (Gao et al., 2007; Prakashet al., 2007; Yao et al., 2008). However, the application ofSRM to peptides has been adopted recently because theimprovements in instrumentation makes this technique sensi-tive, selective and with a wide dynamic range for its applica-tion in proteomics (Domon & Aebersold, 2006; Kuzyk et al.,2009). In SRM, the first and the third quadrupoles act as filtersto select specific predefined m/z value peptide correspondingto the precursor ion and one specific fragment ion of a select-ed peptide (Whiteaker et al., 2007; Nicol et al., 2008). The
QUANTIFICATION TECHNIQUES IN PROTEOMICS &
Mass Spectrometry Reviews DOI 10.1002/mas 9
combination of the m/z values selected for the first and thethird quadrupoles is known as a transition. The non-scanningset-up of this mode of operation increases sensitivity by oneor two orders of magnitude and extends a linear response ofquantification to 4–5 orders of magnitude (Kirkpatrick et al.,2005). There are several thoughts to take into consideration
before performing a SRM experiment (reviewed by Langeet al., 2008b).
1. The proteins under study have to be selected, a subjec-tive step requiring prior knowledge of their biologicalinterest or potential change in levels between samples.
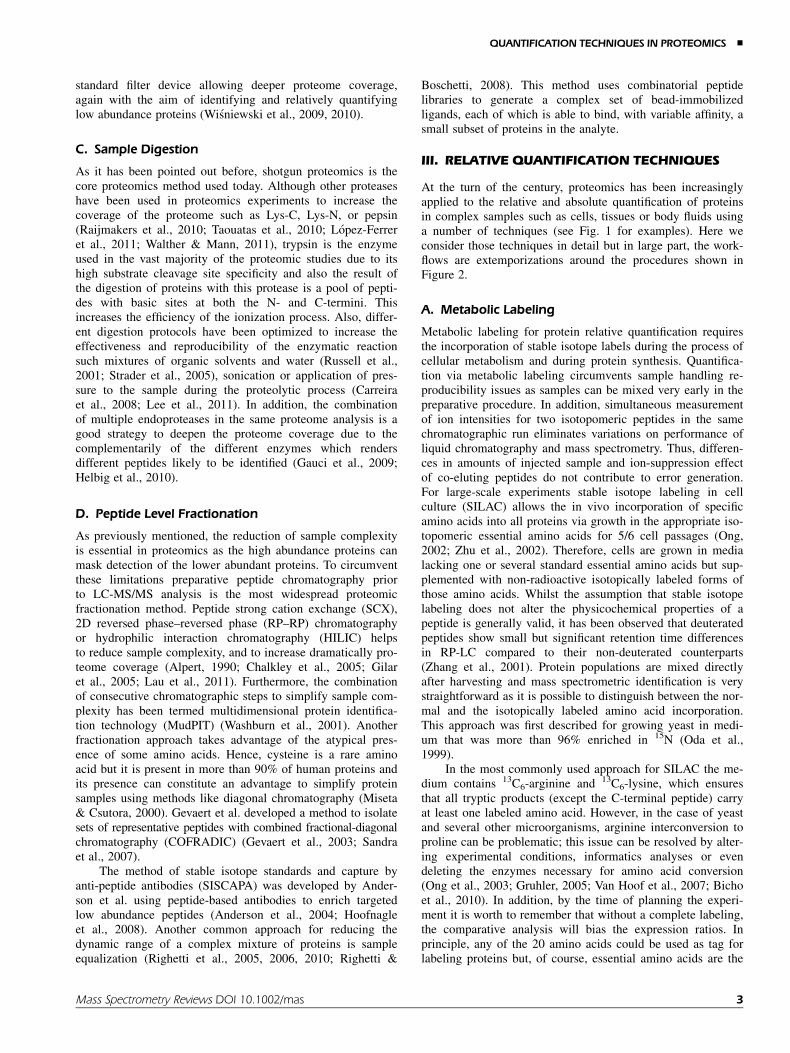
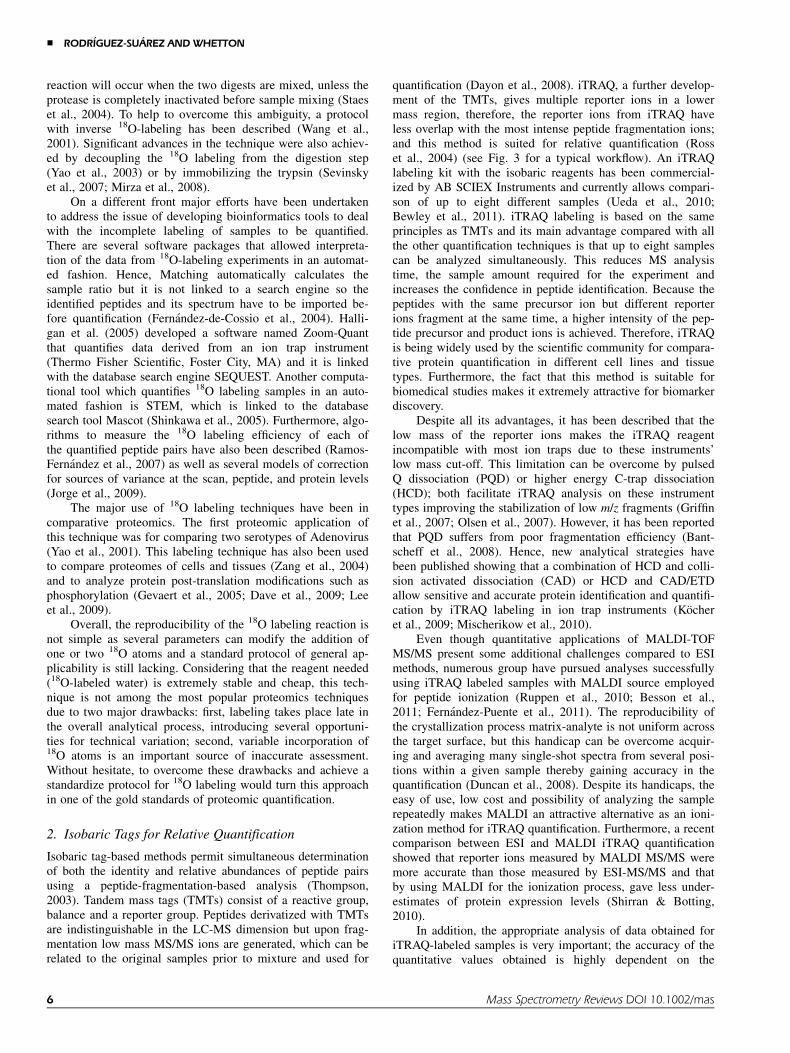
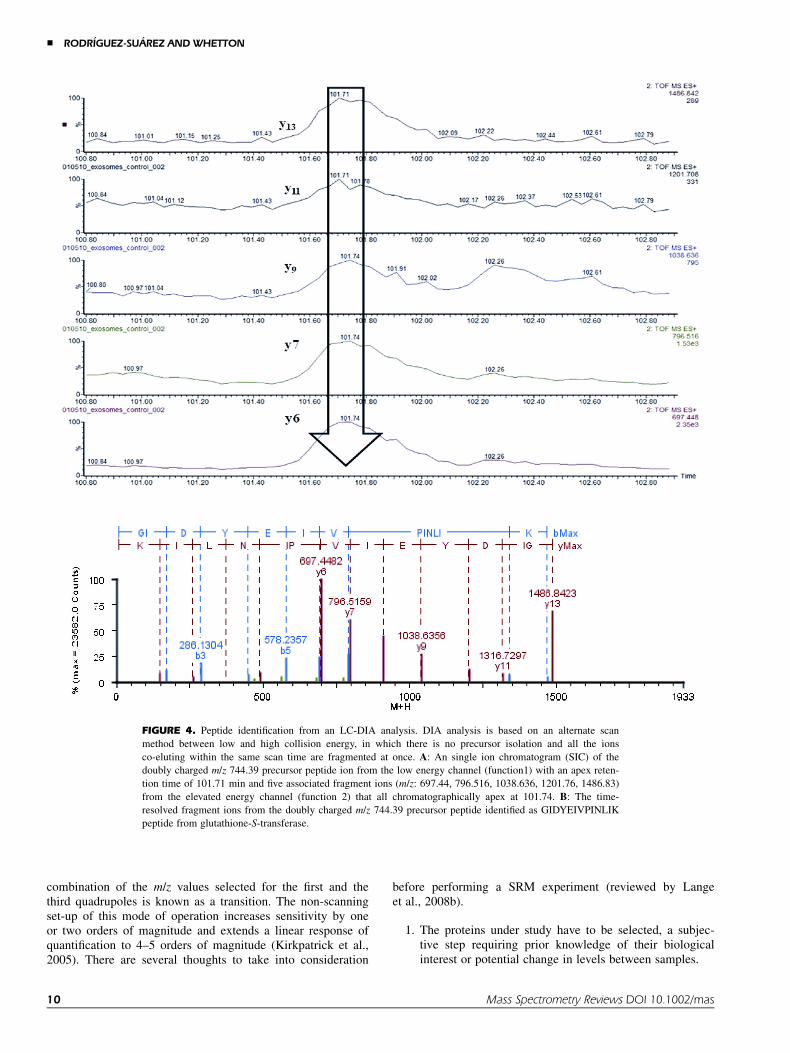
FIGURE 4. Peptide identification from an LC-DIA analysis. DIA analysis is based on an alternate scan
method between low and high collision energy, in which there is no precursor isolation and all the ions
co-eluting within the same scan time are fragmented at once. A: An single ion chromatogram (SIC) of the
doubly charged m/z 744.39 precursor peptide ion from the low energy channel (function1) with an apex reten-
tion time of 101.71 min and five associated fragment ions (m/z: 697.44, 796.516, 1038.636, 1201.76, 1486.83)
from the elevated energy channel (function 2) that all chromatographically apex at 101.74. B: The time-
resolved fragment ions from the doubly charged m/z 744.39 precursor peptide identified as GIDYEIVPINLIK
peptide from glutathione-S-transferase.
& RODRIGUEZ-SUAREZ AND WHETTON
10 Mass Spectrometry Reviews DOI 10.1002/mas
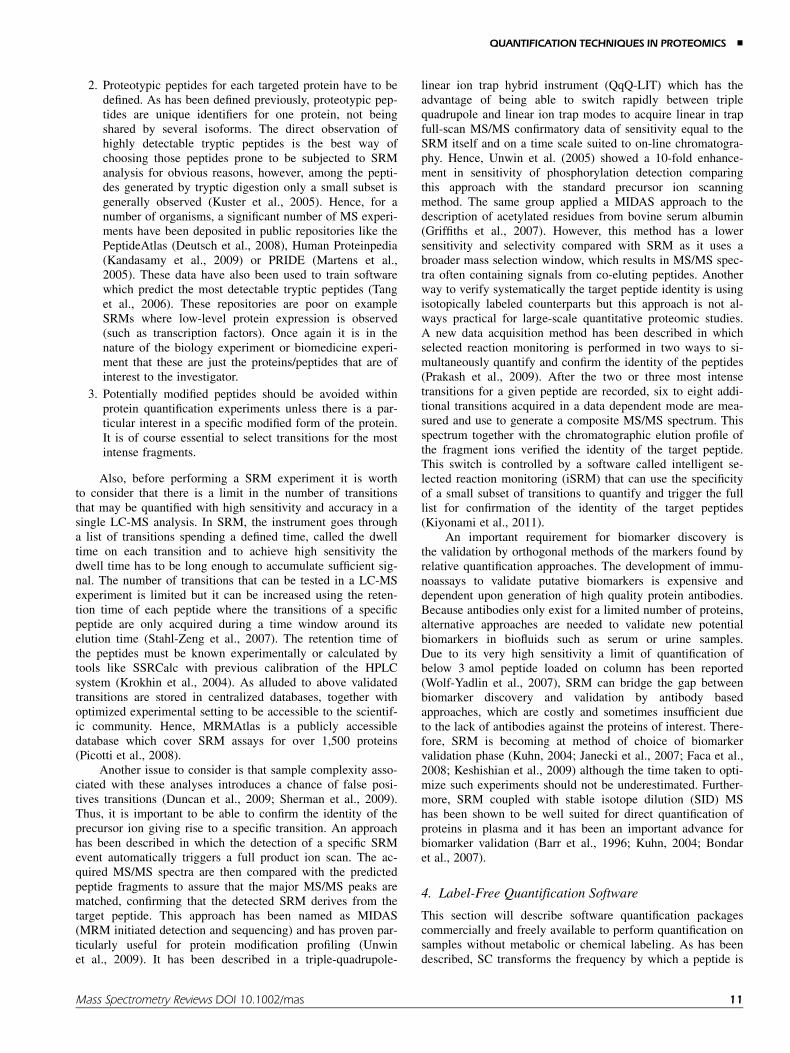
2. Proteotypic peptides for each targeted protein have to bedefined. As has been defined previously, proteotypic pep-tides are unique identifiers for one protein, not beingshared by several isoforms. The direct observation ofhighly detectable tryptic peptides is the best way ofchoosing those peptides prone to be subjected to SRManalysis for obvious reasons, however, among the pepti-des generated by tryptic digestion only a small subset isgenerally observed (Kuster et al., 2005). Hence, for anumber of organisms, a significant number of MS experi-ments have been deposited in public repositories like thePeptideAtlas (Deutsch et al., 2008), Human Proteinpedia(Kandasamy et al., 2009) or PRIDE (Martens et al.,2005). These data have also been used to train softwarewhich predict the most detectable tryptic peptides (Tanget al., 2006). These repositories are poor on exampleSRMs where low-level protein expression is observed(such as transcription factors). Once again it is in thenature of the biology experiment or biomedicine experi-ment that these are just the proteins/peptides that are ofinterest to the investigator.
3. Potentially modified peptides should be avoided withinprotein quantification experiments unless there is a par-ticular interest in a specific modified form of the protein.It is of course essential to select transitions for the mostintense fragments.
Also, before performing a SRM experiment it is worthto consider that there is a limit in the number of transitionsthat may be quantified with high sensitivity and accuracy in asingle LC-MS analysis. In SRM, the instrument goes througha list of transitions spending a defined time, called the dwelltime on each transition and to achieve high sensitivity thedwell time has to be long enough to accumulate sufficient sig-nal. The number of transitions that can be tested in a LC-MSexperiment is limited but it can be increased using the reten-tion time of each peptide where the transitions of a specificpeptide are only acquired during a time window around itselution time (Stahl-Zeng et al., 2007). The retention time ofthe peptides must be known experimentally or calculated bytools like SSRCalc with previous calibration of the HPLCsystem (Krokhin et al., 2004). As alluded to above validatedtransitions are stored in centralized databases, together withoptimized experimental setting to be accessible to the scientif-ic community. Hence, MRMAtlas is a publicly accessibledatabase which cover SRM assays for over 1,500 proteins(Picotti et al., 2008).
Another issue to consider is that sample complexity asso-ciated with these analyses introduces a chance of false posi-tives transitions (Duncan et al., 2009; Sherman et al., 2009).Thus, it is important to be able to confirm the identity of theprecursor ion giving rise to a specific transition. An approachhas been described in which the detection of a specific SRMevent automatically triggers a full product ion scan. The ac-quired MS/MS spectra are then compared with the predictedpeptide fragments to assure that the major MS/MS peaks arematched, confirming that the detected SRM derives from thetarget peptide. This approach has been named as MIDAS(MRM initiated detection and sequencing) and has proven par-ticularly useful for protein modification profiling (Unwinet al., 2009). It has been described in a triple-quadrupole-
linear ion trap hybrid instrument (QqQ-LIT) which has theadvantage of being able to switch rapidly between triplequadrupole and linear ion trap modes to acquire linear in trapfull-scan MS/MS confirmatory data of sensitivity equal to theSRM itself and on a time scale suited to on-line chromatogra-phy. Hence, Unwin et al. (2005) showed a 10-fold enhance-ment in sensitivity of phosphorylation detection comparingthis approach with the standard precursor ion scanningmethod. The same group applied a MIDAS approach to thedescription of acetylated residues from bovine serum albumin(Griffiths et al., 2007). However, this method has a lowersensitivity and selectivity compared with SRM as it uses abroader mass selection window, which results in MS/MS spec-tra often containing signals from co-eluting peptides. Anotherway to verify systematically the target peptide identity is usingisotopically labeled counterparts but this approach is not al-ways practical for large-scale quantitative proteomic studies.A new data acquisition method has been described in whichselected reaction monitoring is performed in two ways to si-multaneously quantify and confirm the identity of the peptides(Prakash et al., 2009). After the two or three most intensetransitions for a given peptide are recorded, six to eight addi-tional transitions acquired in a data dependent mode are mea-sured and use to generate a composite MS/MS spectrum. Thisspectrum together with the chromatographic elution profile ofthe fragment ions verified the identity of the target peptide.This switch is controlled by a software called intelligent se-lected reaction monitoring (iSRM) that can use the specificityof a small subset of transitions to quantify and trigger the fulllist for confirmation of the identity of the target peptides(Kiyonami et al., 2011).
An important requirement for biomarker discovery isthe validation by orthogonal methods of the markers found byrelative quantification approaches. The development of immu-noassays to validate putative biomarkers is expensive anddependent upon generation of high quality protein antibodies.Because antibodies only exist for a limited number of proteins,alternative approaches are needed to validate new potentialbiomarkers in biofluids such as serum or urine samples.Due to its very high sensitivity a limit of quantification ofbelow 3 amol peptide loaded on column has been reported(Wolf-Yadlin et al., 2007), SRM can bridge the gap betweenbiomarker discovery and validation by antibody basedapproaches, which are costly and sometimes insufficient dueto the lack of antibodies against the proteins of interest. There-fore, SRM is becoming at method of choice of biomarkervalidation phase (Kuhn, 2004; Janecki et al., 2007; Faca et al.,2008; Keshishian et al., 2009) although the time taken to opti-mize such experiments should not be underestimated. Further-more, SRM coupled with stable isotope dilution (SID) MShas been shown to be well suited for direct quantification ofproteins in plasma and it has been an important advance forbiomarker validation (Barr et al., 1996; Kuhn, 2004; Bondaret al., 2007).
4. Label-Free Quantification Software
This section will describe software quantification packagescommercially and freely available to perform quantification onsamples without metabolic or chemical labeling. As has beendescribed, SC transforms the frequency by which a peptide is
QUANTIFICATION TECHNIQUES IN PROTEOMICS &
Mass Spectrometry Reviews DOI 10.1002/mas 11
identified into a measure for peptide abundance. Scaffold(Proteome Software, Portland, OR) can accept data fromvarious search engines such as SEQUEST and MASCOTto perform quantification based on SC (Searle, 2010). Hence,Scaffold is, mainly, a data management program that can cal-culate SC values and classify proteins by functional category.On the other hand, Census is freely available software capableof quantifying labeled and label-free data (Park et al., 2008)whilst PepC is a well-established tool which performs statisti-cal analysis on the quantification of the samples based on SCand assessing data reproducibility (Heinecke et al., 2010).
Likewise, there are numerous commercial software usedfor label-free quantification based on peak measurements:SIEVE (Thermo Fisher Scientific) aligns the chromatogramsand identifies statistically significant differences between thepeak intensities of the different samples; Progenesis LC-MS(Nonlinear Dynamics, NE, Newcastle upon Tyre, UK) alignsthe chromatograms choosing one as reference standard set;multivariate analysis can also be performed by this software.Another commercially available package for intensity-basedlabel-free quantification is DeCyder MS Differential AnalysisSoftware, which is based on DeCyder, a widely used imageanalysis software tool for 2D gels analysis (Johansson et al.,2006). As it has been mentioned previously, PLGS (Waters)can perform label-free peak intensity based quantification andalso perform proteins identification by data base search.Among the freely available software, SpecArray was one ofthe first freely available software packages for label-free pro-tein quantification (Li et al., 2005). SpecArray is supportedonly on Linux operating platforms and does not have the capa-bility to process tandem MS data. MSQuant is a well-knownsoftware to analyze SILAC data but is also usable for label-free quantification (Mortensen et al., 2009). MSInspect quanti-fies isotope-labeled, label-free, and SRM data (Bellew et al.,2006). One pioneering software package is the trans-proteomicpipeline (TPP), which is a collection of more than 30 toolsapplicable to label-free or isotopic labeling quantitative dataanalysis (Keller et al., 2005).
As has been discussed through this review, with recentadvances in triples quadrupole instrumentation, SRM allowstargeted multiplexed quantitative analysis and is a valuabletool for the validation and verification of label-free and labeledquantitative proteomic experiments. Consequently, new soft-ware requirements have emerged to deal with the design ofthese kind of experiments. TIQAM (targeted identification forquantitative analysis by multiple reaction monitoring) integra-tes proteomics data from local experiments and for the PeptideAtlas database to select the best transitions (Lange et al.,2008b). In addition, several commercial solutions have beenreleased to support the setup of SRM assays for proteomics.These platform-specific tools include MRMPilot (AB SCIEXInstruments), SRM Workflow Software (Thermo FisherScientific), Verify E (Waters), and Optimizer (AgilentTechnologies).
These and other software tools are available to the scien-tific community to deal with the challenge of label-freequantification, however, assessing the multitude of algorithmsavailable in detail is beyond the scope of this review. Formore information, reviews specific to this area have been pub-lished recently (America & Cordewener, 2008; Vandenbogaertet al., 2008).
IV. ABSOLUTE QUANTIFICATION TECHNIQUES
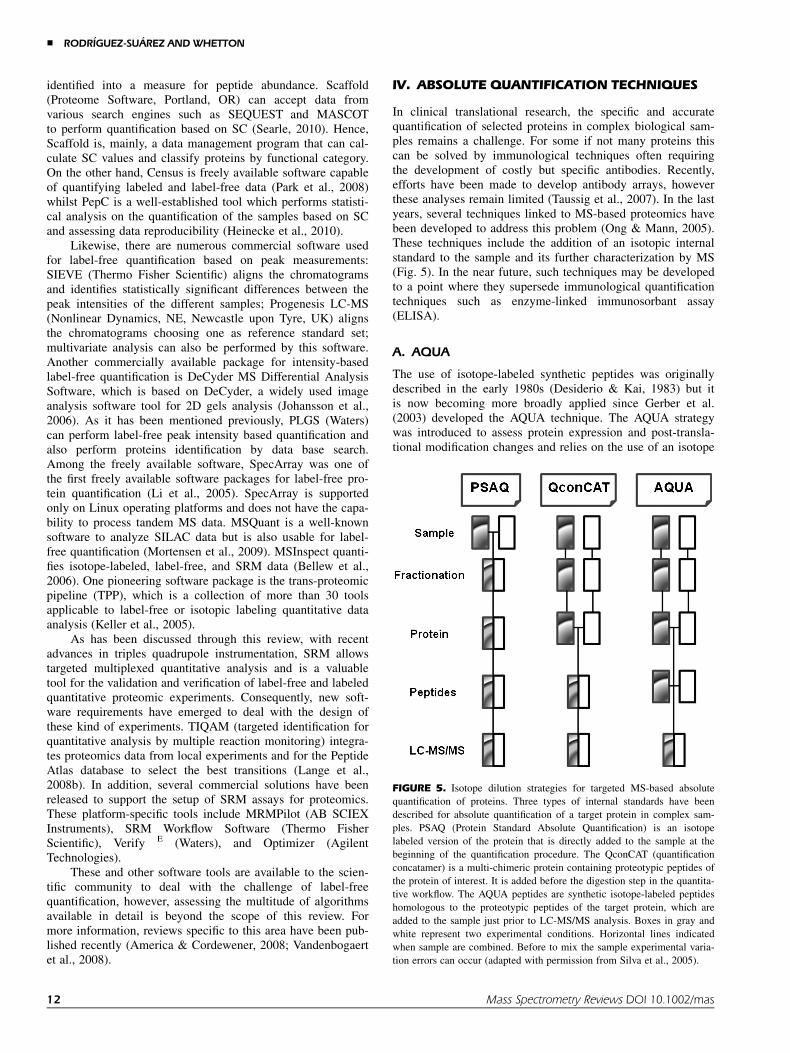
In clinical translational research, the specific and accuratequantification of selected proteins in complex biological sam-ples remains a challenge. For some if not many proteins thiscan be solved by immunological techniques often requiringthe development of costly but specific antibodies. Recently,efforts have been made to develop antibody arrays, howeverthese analyses remain limited (Taussig et al., 2007). In the lastyears, several techniques linked to MS-based proteomics havebeen developed to address this problem (Ong & Mann, 2005).These techniques include the addition of an isotopic internalstandard to the sample and its further characterization by MS(Fig. 5). In the near future, such techniques may be developedto a point where they supersede immunological quantificationtechniques such as enzyme-linked immunosorbant assay(ELISA).
A. AQUA
The use of isotope-labeled synthetic peptides was originallydescribed in the early 1980s (Desiderio & Kai, 1983) but itis now becoming more broadly applied since Gerber et al.(2003) developed the AQUA technique. The AQUA strategywas introduced to assess protein expression and post-transla-tional modification changes and relies on the use of an isotope
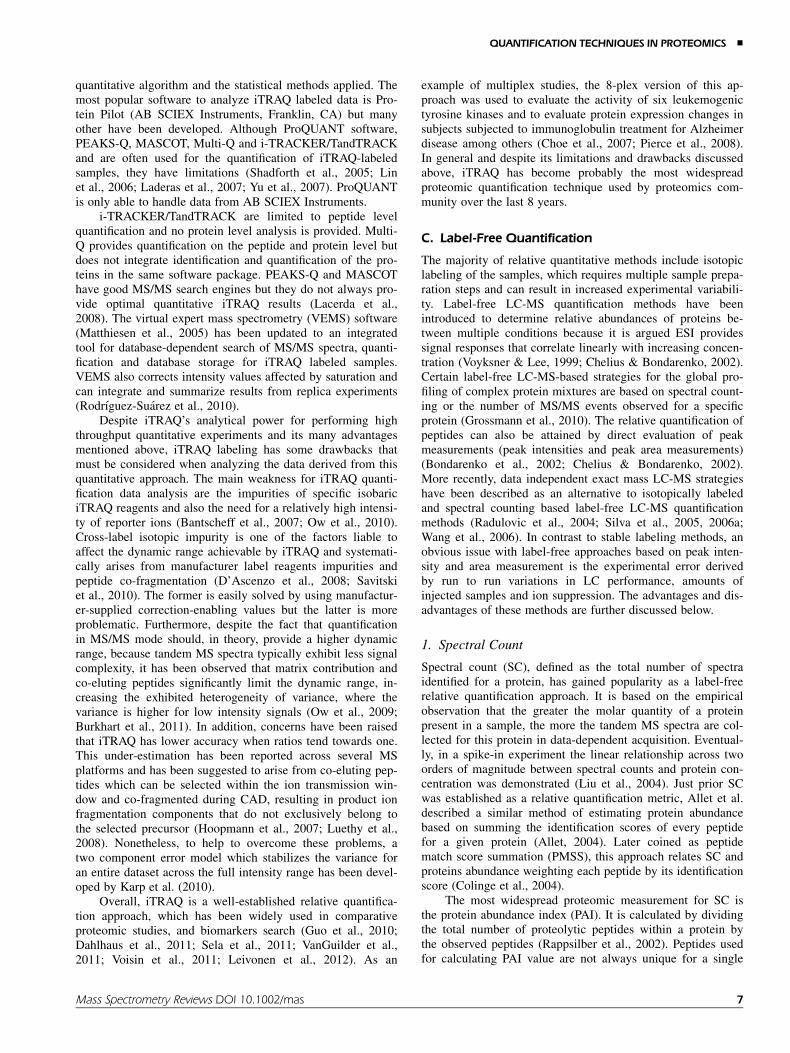
FIGURE 5. Isotope dilution strategies for targeted MS-based absolute
quantification of proteins. Three types of internal standards have been
described for absolute quantification of a target protein in complex sam-
ples. PSAQ (Protein Standard Absolute Quantification) is an isotope
labeled version of the protein that is directly added to the sample at the
beginning of the quantification procedure. The QconCAT (quantification
concatamer) is a multi-chimeric protein containing proteotypic peptides of
the protein of interest. It is added before the digestion step in the quantita-
tive workflow. The AQUA peptides are synthetic isotope-labeled peptides
homologous to the proteotypic peptides of the target protein, which are
added to the sample just prior to LC-MS/MS analysis. Boxes in gray and
white represent two experimental conditions. Horizontal lines indicated
when sample are combined. Before to mix the sample experimental varia-
tion errors can occur (adapted with permission from Silva et al., 2005).
& RODRIGUEZ-SUAREZ AND WHETTON
12 Mass Spectrometry Reviews DOI 10.1002/mas
labeled synthetic internal peptide standard that is introduced ata known concentration to cell lysates during digestion. Thesynthetic peptide and the native peptide share the same physi-cochemical properties, including chromatographic co-elution,ionization efficiency, and relative distribution of fragmentions, but are differentially detected in a mass spectrometer dueto their mass difference. Since the amount of internal standardis known and the ratio between amounts of internal standardcan be determined from the mass spectra, the analyte peptidecan be quantified. Therefore, the quantification is performed atthe peptide level rather that at the protein level. The isotopelabeled AQUA peptide and the unlabeled native peptide aremeasured by liquid chromatography selected reaction monitor-ing performed in a tandem MS instrument. In the other hand,to quantify PTMs like phosphorylation, two AQUA peptidescan be generated, a phosphorylated and a non-phosphorylatedinternal standard peptide. By comparing the amounts of thephosphorylated and non-phosphorylated versions of the pepti-des, the total expression of the proteins and the particularphosphorylation event can be quantified (Stemmann et al.,2001; Kirkpatrick et al., 2005).
AQUA is an absolute quantification technique thatrequires a knowledge of the peptide subjected to quantificationand is therefore developed with prior knowledge of the bio-marker protein in question or the phosphorylation event understudy. Therefore, this approach is complex when applied tolarge number of proteins, as each standard peptide would needto be chemically synthesized in stable-isotope-labeled formand independently quantified. For this reason, proteins of in-terest can be quantified with a single AQUA peptide (Chenget al., 2006). Another drawback of the AQUA approach is thatsince AQUA peptides are added at the latter stages of the ana-lytical process it is poorly compatible with sample fraction-ation strategies. Havlis et al. used 1DE to enrich for theprotein subjected to analysis performing the in-gel digestion inthe presence of the AQUA peptide, which is added to the gelpieces during the digestion process. They have shown that thisstep compromises the technique in respect of peptide recoveryefficiency from the in-gel digestion of the native peptide to beanalyzed affecting the quantification accuracy of the AQUAmethod (Havlis & Shevchenko, 2004). Another limitation is
the specificity of the spiked standard, as there could be multi-ple isobaric peptides present in the mixture, and the lack ofknowledge of the ionization efficiency of the proteolysis steprequired. Even so, the commercial availability and easy use ofAQUA peptides make them particularly attractive for the re-searcher, as does the growing need for absolute quantificationstrategies to develop inter-laboratory comparative analyses ofprotein concentration, far less feasible with relative quantifica-tion approaches.
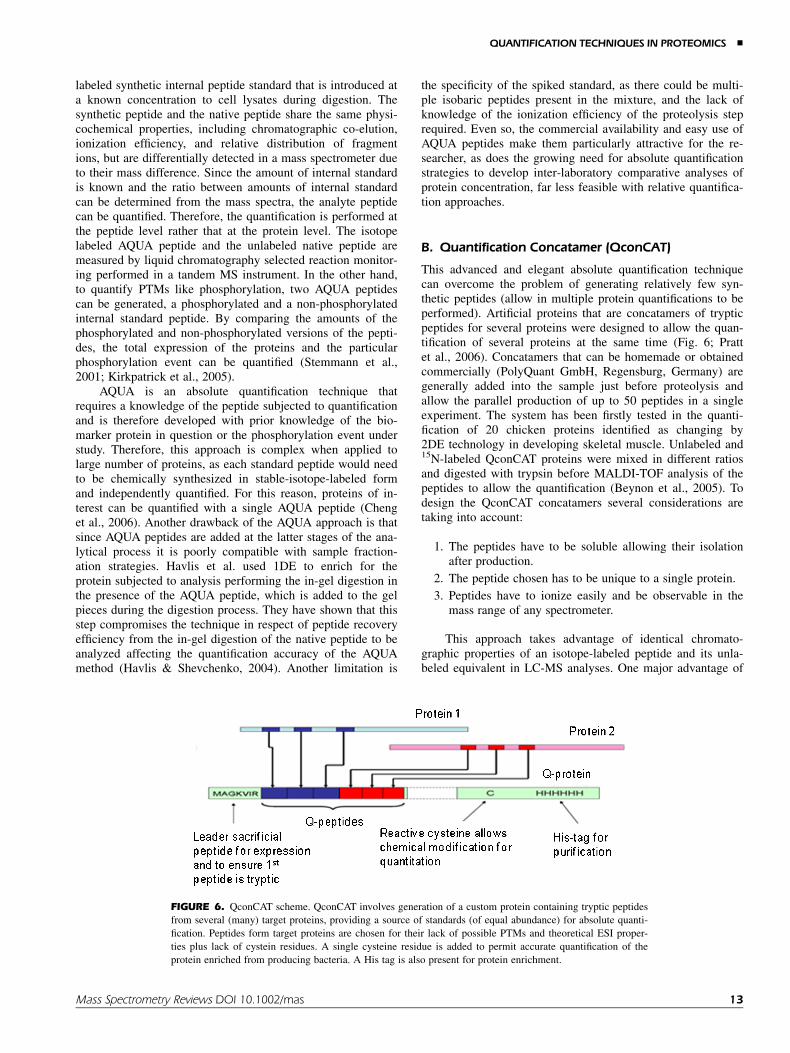
B. Quantification Concatamer (QconCAT)
This advanced and elegant absolute quantification techniquecan overcome the problem of generating relatively few syn-thetic peptides (allow in multiple protein quantifications to beperformed). Artificial proteins that are concatamers of trypticpeptides for several proteins were designed to allow the quan-tification of several proteins at the same time (Fig. 6; Prattet al., 2006). Concatamers that can be homemade or obtainedcommercially (PolyQuant GmbH, Regensburg, Germany) aregenerally added into the sample just before proteolysis andallow the parallel production of up to 50 peptides in a singleexperiment. The system has been firstly tested in the quanti-fication of 20 chicken proteins identified as changing by2DE technology in developing skeletal muscle. Unlabeled and15N-labeled QconCAT proteins were mixed in different ratiosand digested with trypsin before MALDI-TOF analysis of thepeptides to allow the quantification (Beynon et al., 2005). Todesign the QconCAT concatamers several considerations aretaking into account:
1. The peptides have to be soluble allowing their isolationafter production.
2. The peptide chosen has to be unique to a single protein.
3. Peptides have to ionize easily and be observable in themass range of any spectrometer.
This approach takes advantage of identical chromato-graphic properties of an isotope-labeled peptide and its unla-beled equivalent in LC-MS analyses. One major advantage of
FIGURE 6. QconCAT scheme. QconCAT involves generation of a custom protein containing tryptic peptides
from several (many) target proteins, providing a source of standards (of equal abundance) for absolute quanti-
fication. Peptides form target proteins are chosen for their lack of possible PTMs and theoretical ESI proper-
ties plus lack of cystein residues. A single cysteine residue is added to permit accurate quantification of the
protein enriched from producing bacteria. A His tag is also present for protein enrichment.
QUANTIFICATION TECHNIQUES IN PROTEOMICS &
Mass Spectrometry Reviews DOI 10.1002/mas 13
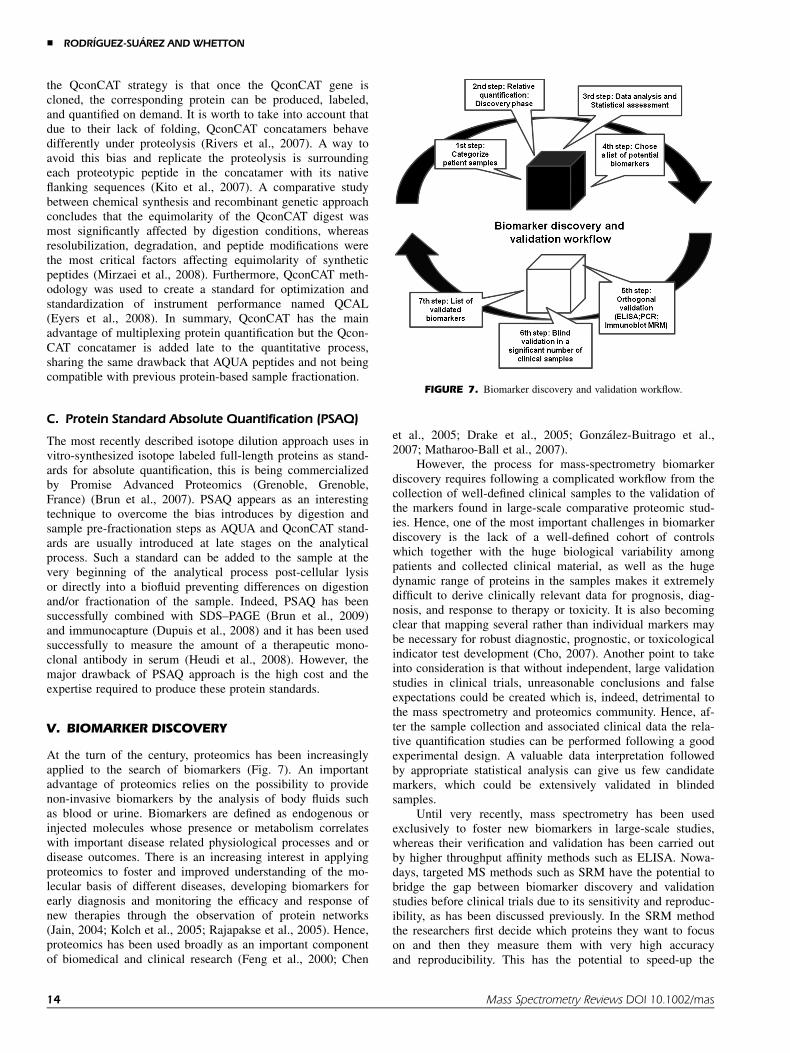
the QconCAT strategy is that once the QconCAT gene iscloned, the corresponding protein can be produced, labeled,and quantified on demand. It is worth to take into account thatdue to their lack of folding, QconCAT concatamers behavedifferently under proteolysis (Rivers et al., 2007). A way toavoid this bias and replicate the proteolysis is surroundingeach proteotypic peptide in the concatamer with its nativeflanking sequences (Kito et al., 2007). A comparative studybetween chemical synthesis and recombinant genetic approachconcludes that the equimolarity of the QconCAT digest wasmost significantly affected by digestion conditions, whereasresolubilization, degradation, and peptide modifications werethe most critical factors affecting equimolarity of syntheticpeptides (Mirzaei et al., 2008). Furthermore, QconCAT meth-odology was used to create a standard for optimization andstandardization of instrument performance named QCAL(Eyers et al., 2008). In summary, QconCAT has the mainadvantage of multiplexing protein quantification but the Qcon-CAT concatamer is added late to the quantitative process,sharing the same drawback that AQUA peptides and not beingcompatible with previous protein-based sample fractionation.
C. Protein Standard Absolute Quantification (PSAQ)
The most recently described isotope dilution approach uses invitro-synthesized isotope labeled full-length proteins as stand-ards for absolute quantification, this is being commercializedby Promise Advanced Proteomics (Grenoble, Grenoble,France) (Brun et al., 2007). PSAQ appears as an interestingtechnique to overcome the bias introduces by digestion andsample pre-fractionation steps as AQUA and QconCAT stand-ards are usually introduced at late stages on the analyticalprocess. Such a standard can be added to the sample at thevery beginning of the analytical process post-cellular lysisor directly into a biofluid preventing differences on digestionand/or fractionation of the sample. Indeed, PSAQ has beensuccessfully combined with SDS–PAGE (Brun et al., 2009)and immunocapture (Dupuis et al., 2008) and it has been usedsuccessfully to measure the amount of a therapeutic mono-clonal antibody in serum (Heudi et al., 2008). However, themajor drawback of PSAQ approach is the high cost and theexpertise required to produce these protein standards.
V. BIOMARKER DISCOVERY
At the turn of the century, proteomics has been increasinglyapplied to the search of biomarkers (Fig. 7). An importantadvantage of proteomics relies on the possibility to providenon-invasive biomarkers by the analysis of body fluids suchas blood or urine. Biomarkers are defined as endogenous orinjected molecules whose presence or metabolism correlateswith important disease related physiological processes and ordisease outcomes. There is an increasing interest in applyingproteomics to foster and improved understanding of the mo-lecular basis of different diseases, developing biomarkers forearly diagnosis and monitoring the efficacy and response ofnew therapies through the observation of protein networks(Jain, 2004; Kolch et al., 2005; Rajapakse et al., 2005). Hence,proteomics has been used broadly as an important componentof biomedical and clinical research (Feng et al., 2000; Chen
et al., 2005; Drake et al., 2005; Gonzalez-Buitrago et al.,2007; Matharoo-Ball et al., 2007).
However, the process for mass-spectrometry biomarkerdiscovery requires following a complicated workflow from thecollection of well-defined clinical samples to the validation ofthe markers found in large-scale comparative proteomic stud-ies. Hence, one of the most important challenges in biomarkerdiscovery is the lack of a well-defined cohort of controlswhich together with the huge biological variability amongpatients and collected clinical material, as well as the hugedynamic range of proteins in the samples makes it extremelydifficult to derive clinically relevant data for prognosis, diag-nosis, and response to therapy or toxicity. It is also becomingclear that mapping several rather than individual markers maybe necessary for robust diagnostic, prognostic, or toxicologicalindicator test development (Cho, 2007). Another point to takeinto consideration is that without independent, large validationstudies in clinical trials, unreasonable conclusions and falseexpectations could be created which is, indeed, detrimental tothe mass spectrometry and proteomics community. Hence, af-ter the sample collection and associated clinical data the rela-tive quantification studies can be performed following a goodexperimental design. A valuable data interpretation followedby appropriate statistical analysis can give us few candidatemarkers, which could be extensively validated in blindedsamples.
Until very recently, mass spectrometry has been usedexclusively to foster new biomarkers in large-scale studies,whereas their verification and validation has been carried outby higher throughput affinity methods such as ELISA. Nowa-days, targeted MS methods such as SRM have the potential tobridge the gap between biomarker discovery and validationstudies before clinical trials due to its sensitivity and reproduc-ibility, as has been discussed previously. In the SRM methodthe researchers first decide which proteins they want to focuson and then they measure them with very high accuracyand reproducibility. This has the potential to speed-up the
FIGURE 7. Biomarker discovery and validation workflow.
& RODRIGUEZ-SUAREZ AND WHETTON
14 Mass Spectrometry Reviews DOI 10.1002/mas
validation and verification process. But, unfortunately, al-though this workflow can be amenable to work with tissuesamples, most of the know biomarkers in blood occur at verylow abundance and would not be revealed by large-scaleproteomic techniques. Hence, some researchers use previousstudies in the literature such as those generating large tran-scriptomic datasets to define a set of candidate biomarkers, asthese studies can shed light on a specific pathway which couldbe a candidate source of biomarkers for follow-up experiments(Vogelstein & Kinzler, 2004; Harris & McCormick, 2010).Furthermore, if a pathway changes regarding transcriptomedata, SRM on targeted proteins can clarify if these mRNAchanges are being translate to protein changes. Theseapproaches are of significant value but it is important to re-member that mRNA is an intermediate in changes in cell phe-notype and the production of new proteins depends on severalprocesses involved in their regulation such as mRNA transla-tion rate, protein degradation rate, post-translational modifica-tions or alternative splicing. Numerous studies suggested aweak concordance between mRNA changes and protein levels(Harris et al., 2004; Maziarz et al., 2005; Khositseth et al.,2011), hence, although transcriptomics gives greater coveragethan proteomics due to its greater dynamic range, proteomicscan identify splice variants and post-translation modifications(PTMs) plus true protein levels which inevitably plays an im-portant role in protein function and consequently, in pathologi-cal stages (Pritsker & Lemischka, 2006; Unwin et al., 2006).Obviously, many proteomic changes would not therefore bereflected as transcriptome changes and the proteome analysisadds biological information and a deeper knowledge of thebiosystem under study. Therefore, despite the caveats de-scribed for both methodologies, both approaches can be usedas complementary source of information to understand dis-eases and shotgun protein profiling methods can be used toguide the interpretation of microarray data validating theresults of a transcriptomic study.
Another promising approach, which is being currently ex-plored, is the identification of cancer biomarkers of serum forauto-antibodies against tumor proteins (Anderson et al., 2010;Wright et al., 2010). Also, the use of disease models likeknock-out mice, can shed light on several diseases at differentpathological stages, and provided a well control cohort ofstudy without the challenging of the huge variability that offerhuman samples (Kelly-Spratt et al., 2008). Alternatively, sev-eral studies have found that secreted proteins of tumor cells incell culture can be an excellent source of biomarkers (Volmeret al., 2005; Kulasingam & Diamandis, 2007).
Despite all the challenging behind a biomarker study,mass spectrometry remains at the core of the expanding effortto deal with disease-driven studies. Therefore, recently, in anattempt to avoid the invasive procedure required for diagnosisof Trisomy 21 that carries a risk of miscarriage, mass spec-trometry and proteomics was applied for the discovery of newputative biomarkers for Trisomy 21 through quantitative SRMassays in maternal serum (Lopez et al., 2010). Also, proteomictechnologies together with bioinformatics have been used toidentify molecular signatures of individual tumors (Gulmannet al., 2006). A set of biomarkers have been reported for myri-ad of diseases: cardiovascular diseases (Anderson, 2005), pros-tate cancer (Fan et al., 2010), rheumatoid arthritis (Kuhn,2004), ovarian cancer (Visintin et al., 2008), hepatocellular
carcinoma (Chaerkady et al., 2008), lymphoma (Kamperet al., 2011), sclerosis (Carlsson et al., 2011), colorectal cancer(Murakoshi et al., 2011), lung cancer (Ostroff et al., 2010),Alzheimer (Craig-Schapiro et al., 2011), ischemia (Stapelset al., 2010).
Despite all these efforts, conversion of a putative bio-marker to general use in the clinic changing diagnostic prac-tice or disease management is a relatively rare event. Theabove review has significance in enabling identification of thepathway best suited to obtaining the desired outcome, robustmarkers of medical and veterinary value.
VI. PROGRESS TO DATE AND FUTURECHALLENGES
Over the last few years, mass spectrometry has improvedgreatly in sensitivity and accuracy and thus proteomicsevolved from having difficulties in identifying just a few pro-teins in a mixture to correctly assign more than 2,500 proteinswithin a single LC-MS/MS run. The substantial progress madein instrumentation coupled with improvements in databasesearching and data curation has led to a rapid movement ofthe field from qualitative to quantitative proteomics. Some ofthe key features requested to a mass spectrometer include res-olution, mass measurement accuracy (MMA), attomole sensi-tivity, and fast spectral acquisition rates.
Hence, lower resolution instruments have been replacedby hybrid Fourier transform MS technology (FTMS), includ-ing linear trap quadrupole (Syka, 2004) and LTQ-Orbitrap(Olsen et al., 2005). Commercially, the Orbitrap analyzer wasfirst introduced in 2005 in a hybrid instrument and it has be-come a major instrument in shotgun proteomics experiments(Syka, 2004). The combination of a low resolution linear iontrap with a high resolution analyzer makes this instrument ex-tremely attractive for performing accurate shotgun quantitativeproteomic experiments, offering versatile fragmentation modesdepending on the analytical problem (McAlister et al., 2008;McAlister et al., 2011). Additionally, the combination of aquadrupole mass filter with the Orbitrap analyzer has beenestablished and shows a substantial increase in speed forproteomic analyses (Michalski et al., 2011). Also, the recentlyintroduced triple ToF platform (TripleTOFTM 5600, ABSCIEX Instruments) has an impressive increase in sensitivityand dynamic range as compared to its predecessors (A. Whet-ton, unpublished observations). This instrument claims toachieve 4 orders of linear dynamic range in accurate quantifi-cation and as a result is considered the first accurate mass,high resolution system of his kind operating with the speedand sensitivity of a TOF MS and quantification capabilitiessimilar to a triple quadrupole MS (Andrews et al., 2011).
But the current offer in new mass spectrometry instru-ments still does not exceed the sensitivity on quantificationrequired for some of the validation biomarker experiments re-quired by the biomedicine, life science and proteomic researchcommunities and neither reaches the dynamic range powerrequired to perform complex studies of biomarkers in bodyfluids such as plasma or urine. Hence, a study using massspectrometry and isotopic labeling claimed to monitor changesin the abundance of yeast proteins from 50,000 moleculesper cell to 5,000 molecules per cell. For the most abundantproteins the coverage was really high (up to 60%) but for
QUANTIFICATION TECHNIQUES IN PROTEOMICS &
Mass Spectrometry Reviews DOI 10.1002/mas 15
the 75% of the proteome that is present at fewer than 5,000molecules per cell, only 8% of the proteins were detected(Washburn et al., 2003). Nowadays, the most sensitive massspectrometry method is SRM on a triple quadrupole (QQQ)platform which allows quantification of protein in plasma witha dynamic range of 4–5 orders of magnitude and a sensitivityof 1 mg/mL (Surinova et al., 2010). Unfortunately, SRM is notpowerful enough by itself as the aim of plasma proteome anal-ysis is to study proteins with a concentration under 100 ng/mL. However, important improvements on these techniquesare being achieved. Thus, Picotti et al. measure the power ofthis analytical approach selecting a set of 100 target proteinsbased on a previous list of absolute proteins abundances ofSaccharomyces cerevisiae generated by orthogonal methods.These target proteins were evenly distributed across all levelsof cellular abundance from 1.3E6 to 41 copies per cell. Hence,covering a dynamic range of 4.5 orders of magnitude it wasdemonstrated that SRM-based proteomics has the power toreliably detect proteins down to a concentration of 50 copiesper cell in a S. cerevisiae protease digest without a previouspre-fractionation of the sample (Picotti et al., 2009).
Another strategy adopted to overcome this dynamic rangeissue is immunodepletion or enrichment techniques. The sevenmost abundant proteins in serum (albumin, immunoglobulinsboth large and small chains, transferrin, a-macroglobulin, anti-trypsin, and haptoglobulin) already amount to 90% of the totalserum proteins and it is known that some additional 30 pro-teins are present in the greater than mg/mL range (Zolg &Langen, 2004). Furthermore, one study estimated that 22 pro-teins comprise approximately 99% of plasma protein content.The remaining 1% of the total plasma proteome has a dynam-ic range of 107-fold and all putative biomarkers are expectedto be in this sub-proteome (Tirumalai et al., 2003). Conse-quently, high abundance protein removal is just the first stepto reduce proteome complexity in plasma and further fraction-ation steps must be required to achieve the desirable substrateof the plasma proteome to identify real biomarkers (Zolg,2006). To reduce the sample complexity isolation of a sub-proteome based on protein modification like glycosylation hasbeen also explored (Zhang et al., 2003). Furthermore, SRManalysis of glycoproteins in plasma has reached levels ofdetection of 5 ng/mL. In 2005 a novel affinity approach wasintroduced (ProteoMiner (Bio-Rad, Berkeley, CA) or Equaliz-er beads), which reduces the dynamic range of the proteomewith a large and diverse library of hexapeptides bound to achromatographic support. Despite some reported issues withthis emerging technology (Keidel et al., 2010), others havefound similar performance after comparing both strategies,obtaining partially overlapping results (Millioni et al., 2011).An alternative to the depletion strategies is to increase the gra-dients length with high resolution coupled to an instrumentwith fast sequencing speed (Thakur et al., 2011).
Overall, the final stage of any quantitative proteomicanalysis is to draw a biological conclusion from a numericresult. Therefore, combined efforts of bioinformaticians, bio-logists, and biomedical researchers have taken place to devel-op strategies and applications to help researchers to answerbiological questions through taking this data as a starting pointwhilst not becoming overwhelmed by the amount of informa-tion. There are numerous software packages to order proteo-mic datasets. These are based on gene ontology, pathway
analysis and interaction networks as well as dataset publicrepositories (Dennis et al., 2003; Mi et al., 2005; Kanehisaet al., 2008; Vizcaıno et al., 2009). Hence, with the abilityof mass spectrometers to analyze complex samples, softwaredevelopment plays a crucial role and must be a dynamicprocess, which should be expanded together with technicaladvances in the instrumentation.
VII. CONCLUSIONS
The methods described above are crucial in the discovery andvalidation phases of biomarkers and information for systemat-ic understanding of biological systems. Overall, the complexnature of proteomics experiments requires more effectivetranslation into understanding and measuring the differencesbetween the healthy and diseased organism. It is worth recap-ping some of the issues that make this an off traveled roadwith many pitfalls. MS now has a capacity to identify andquantify proteins in complex mixtures. However, dynamicrange issues mean we often measure the same higher abun-dance proteins and lower abundance proteins remain un-ana-lyzed. Simple profiling of biofluids which contain complexmixtures is not very successful approach, hence it is importantto fractionate the sample prior to analysis otherwise the mostabundant proteins obscure signals from less abundant ones.The corollary of this is that errors are generated in fraction-ation procedures. Therefore, candidate biomarkers will need tobe identified with the best available methods balancing accura-cy, precision, multiplexing, and opportunities for orthogonalvalidation (Aebersold et al., 2005). The above methods offeropportunities for relatively stable platforms and the field hasadvanced markedly in the last 10 years. Nevertheless, the be-lief that measuring low abundance proteins with off the shelfSRM transitions in multiple samples with high accuracy iseasy and achievable in many laboratories is presently distinct-ly challengeable. The above techniques do offer huge opportu-nities and we have pointed out these and pitfalls also.
Overall, continued improvement of technologies andmethods to determine the abundance of proteins holds a greatpromise for the future study of human disease towards person-alized medicine and a systematic understanding of physiologyand pathology at the molecular level.
VIII. ABBREVIATIONS
2D-DIGE two-dimensional differential gel electrophoresis2D-PAGE two-dimensional polyacrylamide gel electrophoresisAMRT accurate mass retention timeAPEX absolute protein expressionCAD collisionally activated dissociationCOFRADIC combined fractional-diagonal chromatographyDIA data independent acquisition methodELISA enzyme-linked immunosorbant assayemPAI exponentially modified protein abundance indexESI electrospray ionizationETD electron transfer dissociationFASP filter-aided sample preparation methodFTMS Fourier transform MSHCD higher energy C-trap dissociationHPLC high performance liquid chromatographyICAT isotope-coded affinity tag
& RODRIGUEZ-SUAREZ AND WHETTON
16 Mass Spectrometry Reviews DOI 10.1002/mas
iSRM intelligent selected reaction monitoringiTRAQ isobaric tag for relative and absolute quantitationLC-MS/MS liquid chromatography tandem mass spectrometryMMA mass measurement accuracyMIDAS MRM initiated detection and sequencingMRM multiple reaction monitoringMudPIT multidimensional protein identification technologyNSAF normalized spectral abundance factorPA protein abundance indexPLGS protein lynx global serverPMSS peptide match score summationPQD pulsed Q dissociationPSAQ protein standard absolute quantitationPTMs post-translation modificationsQconCAT quantification concatamerQQQ triple quadrupoleQqQ-LIT triple-quadrupole-linear ion trap hybrid
instrumentRP reversed phase (chromatography)RT retention timesSC spectral countSIC single ion chromatogramSCX strong cation exchangeSDS sodium dodecyl sulfateSID stable isotope dilutionSIL stable isotopic labelingSILAC stable isotope labeling by amino acids in cell
cultureSIN normalized spectral indexSISCAPA stable isotope standards and capture by anti-
peptide antibodiesSRM selective reaction monitoringTIQAM targeted identification for quantitative analysis
by multiple reaction monitoringTMTs tandem mass tagsToF time of flightTPP trans-proteomic pipelineUPLC ultra performance liquid chromatography
ACKNOWLEDGMENTS
Work in the authors’ laboratories is supported by LeukaemiaLymphoma Research, Cancer Research UK, CIBERehd andProteoRed.
REFERENCES
Aebersold R. 2003. Constellations in a cellular universe. Nature 422:115–
116.
Aebersold R, Anderson L, Caprioli R, Druker B, Hartwell L, Smith R.
2005. Perspective: A program to improve protein biomarker discov-
ery for cancer. J Proteome Res 4:1104–1109.
Alban A, David SO, Bjorkesten L, Andersson C, Sloge E, Lewis S, Currie
I. 2003. A novel experimental design for comparative two-dimen-
sional gel analysis: Two-dimensional difference gel electrophoresis
incorporating a pooled internal standard. Proteomics 3:36–44.
Allet N. 2004. In vitro and in silico processes to identify differentially
expressed proteins. Proteomics 4:2333–2351.
Alpert AJ. 1990. Hydrophilic-interaction chromatography for the separa-
tion of peptides, nucleic acids and other polar compounds.
J Chromatogr A 499:177–196.
America AHP, Cordewener JHG. 2008. Comparative LC-MS: A landscape
of peaks and valleys. Proteomics 8:731–749.
Amon LM, Law W, Fitzgibbon MP, Gross JA, O’Briant K, Peterson A,
Drescher C, Martin DB, McIntosh M. 2010. Integrative proteomic
analysis of serum and peritoneal fluids helps identify proteins that
are up-regulated in serum of women with ovarian cancer. PLoS ONE
5:e11137.
Anderson L. 2005. Candidate-based proteomics in the search for biomark-
ers of cardiovascular disease. J Physiology 563:23–60.
Anderson NL, Anderson NG. 2002. The human plasma proteome. Mol
Cell Proteomics 1:845–867.
Anderson L, Hunter CL. 2006. Quantitative mass spectrometric multiple
reaction monitoring assays for major plasma proteins. Mol Cell Pro-
teomics 5:573–588.
Anderson NL, Anderson NG, Haines LR, Hardie DB, Olafson RW,
Pearson TW. 2004. Mass spectrometric quantitation of peptides and
proteins using stable isotope standards and capture by anti-peptide
antibodies (SISCAPA). J Proteome Res 3:235–244.
Anderson KS, Wong J, Vitonis A, Crum CP, Sluss PM, LaBaer J, Cramer
D. 2010. p53 autoantibodies as potential detection and prognostic
biomarkers in serous ovarian cancer. Cancer Epidemiol Biomarkers
Prev 19:859–868.
Andrews GL, Simons BL, Young JB, Hawkridge AM, Muddiman DC.
2011. Performance characteristics of a new hybrid quadrupole time-
of-flight tandem mass spectrometer (TripleTOF 5600). Anal Chem
83:5442–5446.
Bantscheff M, Schirle M, Sweetman G, Rick J, Kuster B. 2007. Quantita-
tive mass spectrometry in proteomics: A critical review. Anal Bioa-
nalytical Chemistry 389:1017–1031.
Bantscheff M, Boesche M, Eberhard D, Matthieson T, Sweetman G,
Kuster B. 2008. Robust and sensitive iTRAQ quantification on an
LTQ orbitrap mass spectrometer. Mol Cell Proteomics 7:1702–1713.
Barr J, Maggio V, Patterson D, Jr., Cooper G, Henderson L, Turner W,
Smith S, Hannon W, Needham L, Sampson E. 1996. Isotope dilu-
tion—mass spectrometric quantification of specific proteins: Model
application with apolipoprotein A-I. Clin Chem 42:1676–1682.
Bateman RH, Carruthers R, Hoyes JB, Jones C, Langridge JI, Millar A,
Vissers JPC. 2002. A novel precursor ion discovery method on a
hybrid quadrupole orthogonal acceleration time-of-flight (Q-TOF)
mass spectrometer for studying protein phosphorylation. J Am Soc
Mass Spectrom 13:792–803.
Bellew M, Coram M, Fitzgibbon M, Igra M, Randolph T, Wang P, May
D, Eng J, Fang R, Lin C, Chen J, Goodlett D, Whiteaker J, Paulo-
vich A, McIntosh M. 2006. A suite of algorithms for the comprehen-
sive analysis of complex protein mixtures using high-resolution LC-
MS. Bioinformatics 22:1902–1909.
Belov ME, Rakov VS, Nikolaev EN, Goshe MB, Anderson GA, Smith
RD. 2003. Initial implementation of external accumulation liquid
chromatography/electrospray ionization Fourier transform ion cyclo-
tron resonance with automated gain control. Rapid Commun Mass
Spectrom 17:627–636.
Besson D, Pavageau A-H, Valo I, Bourreau A, Belanger A, Eymerit-Morin
C, Mouliere A, Chassevent A, Boisdron-Celle M, Morel A, Solassol
J, Campone M, Gamelin E, Barre B, Coqueret O, Guette C. 2011.
A quantitative proteomic approach of the different stages of colorec-
tal cancer establishes OLFM4 as a new nonmetastatic tumor marker.
Mol Cell Proteomics 10(12):M111.009712.
Bewley MA, Pham TK, Marriott HM, Noirel J, Chu H-P, Ow SY, Ryaza-
nov AG, Read RC, Whyte MKB, Chain B, Wright PC, Dockrell DH.
2011. Proteomic evaluation and validation of cathepsin D regulated
proteins in macrophages exposed to Streptococcus pneumoniae. Mol
Cell Proteomics 10(6):M111.008193.
Beynon RJ, Pratt JM. 2005. Metabolic labeling of proteins for proteomics.
Mol Cell Proteomics 4:857–872.
Beynon RJ, Doherty MK, Pratt JM, Gaskell SJ. 2005. Multiplexed abso-
lute quantification in proteomics using artificial QCAT proteins of
concatenated signature peptides. Nat Methods 2:587–589.
QUANTIFICATION TECHNIQUES IN PROTEOMICS &
Mass Spectrometry Reviews DOI 10.1002/mas 17
Bicho CC, de Lima Alves F, Chen ZA, Rappsilber J, Sawin KE. 2010.
A genetic engineering solution to the ‘‘arginine conversion problem’’
in stable isotope labeling by amino acids in cell culture (SILAC).
Mol Cell Proteomics 9:1567–1577.
Blagoev B, Ong SE, Kratchmarova I, Mann M. 2004. Temporal analysis
of phosphotyrosine-dependent signaling networks by quantitative
proteomics. Nat Biotechnol 22:1139–1145.
Bondar OP, Barnidge DR, Klee EW, Davis BJ, Klee GG. 2007. LC-MS/
MS quantification of Zn-{alpha}2 glycoprotein: A potential serum
biomarker for prostate cancer. Clin Chem 53:673–678.
Bondarenko PV, Chelius D, Shaler TA. 2002. Identification and relative
quantitation of protein mixtures by enzymatic digestion followed by
capillary reversed-phase liquid chromatography—Tandem mass spec-
trometry. Anal Chem 74:4741–4749.
Bostanci N, Heywood W, Mills K, Parkar M, Nibali L, Donos N. 2010.
Application of label-free absolute quantitative proteomics in human
gingival crevicular fluid by LC/MSE (gingival exudatome). J Prote-
ome Res 9:2191–2199.
Boumahrou N, Bevilacqua C, Beauvallet C, Miranda G, Andrei S,
Rebours E, Panthier J-J, Bellier S, Martin P. 2011. Evolution of ma-
jor milk proteins in Mus musculus and Mus spretus mouse species:
A genoproteomic analysis. BMC Genomics 12:80.
Braisted J, Kuntumalla S, Vogel C, Marcotte E, Rodrigues A, Wang R,
Huang S-T, Ferlanti E, Saeed A, Fleischmann R, Peterson S, Pieper
R. 2008. The APEX Quantitative Proteomics Tool: Generating pro-
tein quantitation estimates from LC-MS/MS proteomics results.
BMC Bioinformatics 9:529.
Brun V, Dupuis A, Adrait A, Marcellin M, Thomas D, Court M, Vande-
nesch F, Garin J. 2007. Isotope-labeled protein standards. Mol Cell
Proteomics 6:2139–2149.
Brun V, Masselon C, Garin J, Dupuis A. 2009. Isotope dilution strategies
for absolute quantitative proteomics. J Proteomics 72:740–749.
Burkhart JM, Vaudel M, Zahedi RP, Martens L, Sickmann A. 2011.
iTRAQ protein quantification: A quality-controlled workflow. Proteo-
mics 11:1125–1134.
Carlsson A, Wuttge DM, Ingvarsson J, Bengtsson AA, Sturfelt G, Borre-
baeck CAK, Wingren C. 2011. Serum protein profiling of systemic
lupus erythematosus and systemic sclerosis using recombinant anti-
body microarrays. Mol Cell Proteomics 10(5):M110.005033.
Carreira RJ, Rial-Otero R, Lopez-Ferrer D, Lodeiro C, Capelo JL. 2008.
Ultrasonic energy as a new tool for fast isotopic 18O labeling of
proteins for mass spectrometry-based techniques: Preliminary results.
Talanta 76:400–406.
Chaerkady R, Harsha HC, Nalli A, Gucek M, Vivekanandan P, Akhtar J,
Cole RN, Simmers J, Schulick RD, Singh S, Torbenson M, Pandey
A, Thuluvath PJ. 2008. A quantitative proteomic approach for identi-
fication of potential biomarkers in hepatocellular carcinoma. J Prote-
ome Res 7:4289–4298.
Chalkley RJ, Baker PR, Huang L, Hansen KC, Allen NP, Rexach M,
Burlingame AL. 2005. Comprehensive analysis of a multidimension-
al liquid chromatography mass spectrometry dataset acquired on a
quadrupole selecting, quadrupole collision cell, time-of-flight mass
spectrometer. Mol Cell Proteomics 4:1194–1204.
Chambery A, Colucci-D’Amato L, Vissers JPC, Scarpella S, Langridge JI,
Parente A. 2008. Proteomic profiling of proliferating and differenti-
ated neural mes-c-myc A1 cell line from mouse embryonic mesen-
cephalon by LC�MS. J Proteome Res 8:227–238.
Chelius D, Bondarenko PV. 2002. Quantitative profiling of proteins in
complex mixtures using liquid chromatography and mass spectrome-
try. J Proteome Res 1:317–323.
Chen R, Pan S, Brentnall TA, Aebersold R. 2005. Proteomic profiling of
pancreatic cancer for biomarker discovery. Mol Cell Proteomics
4:523–533.
Chen EI, Cociorva D, Norris JL, Yates JR. 2007. Optimization of mass
spectrometry-compatible surfactants for shotgun proteomics. J Prote-
ome Res 6:2529–2538.
Cheng D, Hoogenraad CC, Rush J, Ramm E, Schlager MA, Duong DM,
Xu P, Wijayawardana SR, Hanfelt J, Nakagawa T, Sheng M, Peng J.
2006. Relative and absolute quantification of postsynaptic density
proteome isolated from rat forebrain and cerebellum. Mol Cell Prote-
omics 5:1158–1170.
Chick JM, Haynes PA, Bjellqvist B, Baker MS. 2008. A Combination
of immobilised ph gradients improves membrane proteomics.
J Proteome Res 7:4974–4981.
Cho W. 2007. Contribution of oncoproteomics to cancer biomarker dis-
covery. Mol Cancer 6:25.
Choe L, D’Ascenzo M, Relkin NR, Pappin D, Ross P, Williamson B,
Guertin S, Pribil P, Lee KH. 2007. 8-Plex quantitation of changes in
cerebrospinal fluid protein expression in subjects undergoing intrave-
nous immunoglobulin treatment for Alzheimer’s disease. Proteomics
7:3651–3660.
Choi YS, Choe LH, Lee KH. 2010. Recent cerebrospinal fluid biomarker
studies of Alzheimer’s disease. Expert Rev Proteomics 7:919–929.
Cima I, Schiess R, Wild P, Kaelin M, Schuffler P, Lange V, Picotti P,
Ossola R, Templeton A, Schubert O, Fuchs T, Leippold T, Wyler S,
Zehetner J, Jochum W, Buhmann J, Cerny T, Moch H, Gillessen S,
Aebersold R, Krek W. 2011. Cancer genetics-guided discovery of
serum biomarker signatures for diagnosis and prognosis of prostate
cancer. Proc Natl Acad Sci 108:3342–3347.
Colinge J, Chiappe D, Lagache S, Moniatte M, Bougueleret L. 2004.
Differential proteomics via probabilistic peptide identification scores.
Anal Chem 77:596–606.
Conrad D, Goyette J, Thomas P. 2008. Proteomics as a method for early
detection of cancer: A review of proteomics, exhaled breath conden-
sate, and lung cancer screening. J Gen Intern Med 23:78–84.
Corthals GL, Wasinger VC, Hochstrasser DF, Sanchez J-C. 2000. The
dynamic range of protein expression: A challenge for proteomic
research. Electrophoresis 21:1104–1115.
Craig-Schapiro R, Kuhn M, Xiong C, Pickering EH, Liu J, Misko TP,
Perrin RJ, Bales KR, Soares H, Fagan AM, Holtzman DM. 2011.
Multiplexed immunoassay panel identifies novel CSF biomarkers
for Alzheimer’s disease diagnosis and prognosis. PLoS ONE 6:
e18850.
Dahlhaus M, Wan Li K, van der Schors RC, Saiepour MH, van Nierop P,
Heimel JA, Hermans JM, Loos M, Smit AB, Levelt CN. 2011. The
Synaptic proteome during development and plasticity of the mouse
visual cortex. Mol Cell Proteomics 10(5):M110.005413.
D’Ascenzo M, Choe L, Lee KH. 2008. iTRAQPak: An R based analysis
and visualization package for 8-plex isobaric protein expression
data. Briefings Funct Genomics Proteomics 7:127–135.
Dave KA, Whelan F, Bindloss C, Furness SGB, Chapman-Smith A,
Whitelaw ML, Gorman JJ. 2009. Sulfonation and phosphorylation of
regions of the dioxin receptor susceptible to methionine modifica-
tions. Mol Cell Proteomics 8:706–719.
Dayon L, Hainard A, Licker V, Turck N, Kuhn K, Hochstrasser DF, Bur-
khard PR, Sanchez J-C. 2008. Relative quantification of proteins in
human cerebrospinal fluids by MS/MS using 6-plex isobaric tags.
Anal Chem 80:2921–2931.
de Godoy L, Olsen J, de Souza G, Li G, Mortensen P, Mann M. 2006.
Status of complete proteome analysis by mass spectrometry: SILAC
labeled yeast as a model system. Genome Biol 7:R50.
de Souza GA, Fortuin S, Aguilar D, Pando RH, McEvoy CRE, van Helden
PD, Koehler CJ, Thiede B, Warren RM, Wiker HG. 2010. Using a
label-free proteomics method to identify differentially abundant pro-
teins in closely related hypo- and hypervirulent clinical mycobacteri-
um tuberculosis Beijing isolates. Mol Cell Proteomics 9:2414–2423.
Dennis G, Sherman B, Hosack D, Yang J, Gao W, Lane HC, Lempicki R.
2003. DAVID: Database for annotation, visualization, and integrated
discovery. Genome Biol 4:P3.
Dephoure N, Zhou C, Villen J, Beausoleil SA, Bakalarski CE, Elledge SJ,
Gygi SP. 2008. A quantitative atlas of mitotic phosphorylation. Proc
Natl Acad Sci 105:10762–10767.
& RODRIGUEZ-SUAREZ AND WHETTON
18 Mass Spectrometry Reviews DOI 10.1002/mas
Desiderio DM, Kai M. 1983. Preparation of stable isotope-incorporated
peptide internal standards for field desorption mass spectrometry
quantification of peptides in biologic tissue. Biomed Mass Spectrom
10:471.
Deutsch EW, Lam H, Aebersold R. 2008. PeptideAtlas: A resource for
target selection for emerging targeted proteomics workflows. EMBO
Rep 9:429–434.
Doherty MK, Whitehead C, McCormack H, Gaskell SJ, Beynon RJ.
2005. Proteome dynamics in complex organisms: Using stable
isotopes to monitor individual protein turnover rates. Proteomics
5:522–533.
Domon B, Aebersold R. 2006. Mass spectrometry and protein analysis.
Science 312:212–217.
Drake RR, Cazares LH, Semmes OJ, Wadsworth JT. 2005. Serum, salivary
and tissue proteomics for discovery of biomarkers for head and neck
cancers. Expert Rev Mol Diagn 5:93–100.
Duncan MW, Roder H, Hunsucker SW. 2008. Quantitative matrix-assisted
laser desorption/ionization mass spectrometry. Briefings Funct Geno-
mics Proteomics 7:355–370.
Duncan MW, Yergey AL, Patterson SD. 2009. Quantifying proteins by
mass spectrometry: The selectivity of SRM is only part of the prob-
lem. Proteomics 9:1124–1127.
Dupuis A, Hennekinne J-A, Garin J, Brun V. 2008. Protein Standard Ab-
solute Quantification (PSAQ) for improved investigation of staphylo-
coccal food poisoning outbreaks. Proteomics 8:4633–4636.
Eyers C, Simpson D, Wong S, Beynon R, Gaskell S. 2008. QCAL—A
novel standard for assessing instrument conditions for proteome
analysis. J Am Soc Mass Spectrom 19:1275–1280.
Faca VM, Song KS, Wang H, Zhang Q, Krasnoselsky AL, Newcomb LF,
Plentz RR, Gurumurthy S, Redston MS, Pitteri SJ, Pereira-Faca SR,
Ireton RC, Katayama H, Glukhova V, Phanstiel D, Brenner DE,
Anderson MA, Misek D, Scholler N, Urban ND, Barnett MJ, Edel-
stein C, Goodman GE, Thornquist MD, McIntosh MW, DePinho
RA, Bardeesy N, Hanash SM. 2008. A mouse to human search for
plasma proteome changes associated with pancreatic tumor develop-
ment. PLoS Med 5:e123.
Fan Y, Murphy TB, Byrne JC, Brennan L, Fitzpatrick JM, Watson RWG.
2010. Applying random forests to identify biomarker panels in serum
2D-DIGE data for the detection and staging of prostate cancer.
J Proteome Res 10:1361–1373.
Feng JT, Shang S, Beretta L. 2000. Proteomics for the early detection and
treatment of hepatocellular carcinoma. Oncogene 25:3810–3817.
Fernandez-de-Cossio J, Gonzalez LJ, Satomi Y, Betancourt L, Ramos Y,
Huerta V, Besada V, Padron G, Minamino N, Takao T. 2004. Auto-
mated interpretation of mass spectra of complex mixtures by match-
ing of isotope peak distributions. Rapid Commun Mass Spectrom
18:2465–2472.
Fernandez-Puente P, Mateos J, Fernandez-Costa C, Oreiro N, Fernandez-
Lopez C, Ruiz-Romero C, Blanco FJ. 2011. Identification of a panel
of novel serum osteoarthritis biomarkers. J Proteome Res 10:5095–
5101.
Florens L, Carozza MJ, Swanson SK, Fournier M, Coleman MK, Work-
man JL, Washburn MP. 2006. Analyzing chromatin remodeling com-
plexes using shotgun proteomics and normalized spectral abundance
factors. Methods 40:303–311.
Foster LJ, de Hoog CL, Zhang Y, Zhang Y, Xie X, Mootha VK, Mann M.
2006. A mammalian organelle map by protein correlation profiling.
Cell 125:187–199.
Gao H, Materne OL, Howe DL, Brummel CL. 2007. Method for rapid
metabolite profiling of drug candidates in fresh hepatocytes using
liquid chromatography coupled with a hybrid quadrupole linear ion
trap. Rapid Commun Mass Spectrom 21:3683–3693.
Gauci S, Helbig AO, Slijper M, Krijgsveld J, Heck AJR, Mohammed S.
2009. Lys-N and trypsin cover complementary parts of the phospho-
proteome in a refined SCX-based approach. Anal Chem 81:4493–
4501.
Ge Y, Rajkumar L, Guzman RC, Nandi S, Patton WF, Agnew BJ. 2004.
Multiplexed fluorescence detection of phosphorylation, glycosy-
lation, and total protein in the proteomic analysis of breast cancer
refractoriness. Proteomics 4:3464–3467.
Geiger T, Wisniewski JR, Cox J, Zanivan S, Kruger M, Ishihama Y, Mann
M. 2011. Use of stable isotope labeling by amino acids in cell cul-
ture as a spike-in standard in quantitative proteomics. Nat Protoc
6:147–157.
Gerber SA, Rush J, Stemman O, Kirschner MW, Gygi SP. 2003. Absolute
quantification of proteins and phosphoproteins from cell lysates by
tandem MS. Proc Natl Acad Sci USA 100:6940–6945.
Geromanos SJ, Vissers JPC, Silva JC, Dorschel CA, Li GZ, Gorenstein
MV, Bateman RH, Langridge JI. 2009. The detection, correlation,
and comparison of peptide precursor and product ions from data
independent LC-MS with data dependant LC-MS/MS. Proteomics
9:1683–1695.
Gevaert K, Goethals M, Martens L, Van Damme J, Staes A, Thomas GR,
Vandekerckhove J. 2003. Exploring proteomes and analyzing protein
processing by mass spectrometric identification of sorted N-terminal
peptides. Nat Biotech 21:566–569.
Gevaert K, Staes A, Van Damme J, De Groot S, Hugelier K, Demol H,
Martens L, Goethals M, Vandekerckhove J. 2005. Global phospho-
proteome analysis on human HepG2 hepatocytes using reversed-
phase diagonal LC. Proteomics 5:3589–3599.
Ghaemmaghami S, Huh W-K, Bower K, Howson RW, Belle A, Dephoure
N, O’Shea EK, Weissman JS. 2003. Global analysis of protein
expression in yeast. Nature 425:737–741.
Gilar M, Olivova P, Daly AE, Gebler JC. 2005. Two-dimensional separa-
tion of peptides using RP-RP-HPLC system with different pH in first
and second separation dimensions. J Sep Sci 28:1694–1703.
Gilchrist A, Au CE, Hiding J, Bell AW, Fernandez-Rodriguez J, Lesimple
S, Nagaya H, Roy L, Gosline SJC, Hallett M, Paiement J, Kearney
Robert E, Nilsson T, Bergeron JJM. 2006. Quantitative proteomics
analysis of the secretory pathway. Cell 127:1265–1281.
Gonzalez-Buitrago JM, Ferreira L, Lorenzo I. 2007. Urinary proteomics.
Clin Chim Acta 375:49–56.
Gramolini AO, Kislinger T, Alikhani-Koopaei R, Fong V, Thompson NJ,
Isserlin R, Sharma P, Oudit GY, Trivieri MG, Fagan A, Kannan A,
Higgins DG, Huedig H, Hess G, Arab S, Seidman JG, Seidman CE,
Frey B, Perry M, Backx PH, Liu PP, MacLennan DH, Emili A.
2008. Comparative proteomics profiling of a phospholamban mutant
mouse model of dilated cardiomyopathy reveals progressive intracel-
lular stress responses. Mol Cell Proteomics 7:519–533.
Griffin TJ, Xie H, Bandhakavi S, Popko J, Mohan A, Carlis JV, Higgins
L. 2007. iTRAQ reagent-based quantitative proteomic analysis on a
linear ion trap mass spectrometer. J Proteome Res 6:4200–4209.
Griffin NM, Yu J, Long F, Oh P, Shore S, Li Y, Koziol JA, Schnitzer JE.
2010. Label-free, normalized quantification of complex mass spec-
trometry data for proteomic analysis. Nat Biotech 28:83–89.
Griffiths JR, Unwin RD, Evans CA, Leech SH, Corfe BM, Whetton AD.
2007. The application of a hypothesis-driven strategy to the sensitive
detection and location of acetylated lysine residues. J Am Soc Mass
Spectrom 18:1423–1428.
Grossmann J, Roschitzki B, Panse C, Fortes C, Barkow-Oesterreicher S,
Rutishauser D, Schlapbach R. 2010. Implementation and evaluation
of relative and absolute quantification in shotgun proteomics with
label-free methods. J Proteomics 73:1740–1746.
Gruhler A. 2005. Quantitative phosphoproteomics applied to the yeast
pheromone signaling pathway. Mol Cell Proteomics 4:310–327.
Gulmann C, Sheehan KM, Kay EW, Liotta LA, Petricoin EF. 2006. Ar-
ray-based proteomics: Mapping of protein circuitries for diagnostics,
prognostics, and therapy guidance in cancer. J Pathol 208:595–606.
Guo T, Zhu Y, Gan CS, Lee SS, Zhu J, Wang H, Li X, Christensen J,
Huang S, Kon OL, Sze SK. 2010. Quantitative proteomics discloses
MET expression in mitochondria as a direct target of MET kinase
inhibitor in cancer cells. Mol Cell Proteomics 9:2629–2641.
QUANTIFICATION TECHNIQUES IN PROTEOMICS &
Mass Spectrometry Reviews DOI 10.1002/mas 19
Hajkova D, Rao KCS, Miyagi M. 2006. pH dependency of the carboxyl
oxygen exchange reaction catalyzed by lysyl endopeptidase and tryp-
sin. J Proteome Res 5:1667–1673.
Halligan B, Slyper R, Twigger S, Hicks W, Olivier M, Greene A. 2005.
ZoomQuant: An application for the quantitation of stable isotope
labeled peptides. J Am Soc Mass Spectrom 16:302–306.
Han MH, Hwang S-I, Roy DB, Lundgren DH, Price JV, Ousman SS, Fer-
nald GH, Gerlitz B, Robinson WH, Baranzini SE, Grinnell BW,
Raine CS, Sobel RA, Han DK, Steinman L. 2008. Proteomic analy-
sis of active multiple sclerosis lesions reveals therapeutic targets.
Nature 451:1076–1081.
Harris TJR, McCormick F. 2010. The molecular pathology of cancer. Nat
Rev Clin Oncol 7:251–265.
Harris MN, Ozpolat B, Abdi F, Gu S, Legler A, Mawuenyega KG, Tirado-
Gomez M, Lopez-Berestein G, Chen X. 2004. Comparative proteo-
mic analysis of all-trans-retinoic acid treatment reveals systematic
posttranscriptional control mechanisms in acute promyelocytic
leukemia. Blood 104:1314–1323.
Hart C, Schulenberg B, Steinberg TH, Leung W-Y, Patton WF. 2003.
Detection of glycoproteins in polyacrylamide gels and on electro-
blots using Pro-Q Emerald 488 dye, a fluorescent periodate Schiff-
base stain. Electrophoresis 24:588–598.
Havlis J, Shevchenko A. 2004. Absolute quantification of proteins in
solutions and in polyacrylamide gels by mass spectrometry. Anal
Chem 76:3029–3036.
Hayter JR, Doherty MK, Whitehead C, McCormack H, Gaskell SJ,
Beynon RJ. 2005. The subunit structure and dynamics of the 20S
proteasome in chicken skeletal muscle. Mol Cell Proteomics 4:
1370–1381.
Heinecke NL, Pratt BS, Vaisar T, Becker L. 2010. PepC: Proteomics
software for identifying differentially expressed proteins based on
spectral counting. Bioinformatics 26:1574–1575.
Helbig AO, Gauci S, Raijmakers R, van Breukelen B, Slijper M,
Mohammed S, Heck AJR. 2010. Profiling of N-acetylated protein
termini provides in-depth insights into the N-terminal nature of the
proteome. Mol Cell Proteomics 9:928–939.
Hemming ML, Elias JE, Gygi SP, Selkoe DJ. 2009. Identification of b-secretase (BACE1) substrates using quantitative proteomics. PLoS
ONE 4:e8477.
Heudi O, Barteau S, Zimmer D, Schmidt J, Bill K, Lehmann N, Bauer C,
Kretz O. 2008. Towards absolute quantification of therapeutic mono-
clonal antibody in serum by LC�MS/MS using isotope-labeled
antibody standard and protein cleavage isotope dilution mass spec-
trometry. Anal Chem 80:4200–4207.
Hoofnagle AN, Becker JO, Wener MH, Heinecke JW. 2008. Quantification
of thyroglobulin, a low-abundance serum protein, by immunoaffinity
peptide enrichment and tandem mass spectrometry. Clin Chem 54:
1796–1804.
Hoopmann MR, Finney GL, MacCoss MJ. 2007. High-speed data reduc-
tion, feature detection, and MS/MS spectrum quality assessment of
shotgun proteomics data sets using high-resolution mass spectrome-
try. Anal Chem 79:5620–5632.
Ibarrola N, Kalume DE, Gronborg M, Iwahori A, Pandey A. 2003.
A proteomic approach for quantitation of phosphorylation using
stable isotope labeling in cell culture. Anal Chem 75:6043–6049.
Ibarrola N, Molina H, Iwahori A, Pandey A. 2004. A novel proteomic
approach for specific identification of tyrosine kinase substrates
using [13C]tyrosine. J Biol Chem 279:15805–15813.
Ishihama Y. 2005a. Exponentially modified protein abundance index
(emPAI) for estimation of absolute protein amount in proteomics by
the number of sequenced peptides per protein. Mol Cell Proteomics
4(9):1265–1272.
Ishihama Y. 2005b. Quantitative mouse brain proteomics using culture-
derived isotope tags as internal standards. Nat Biotechnol 23:617–
621.
Jain K. 2004. Role of pharmacoproteomics in the development of person-
alized medicine. Pharmacogenomics 5:331–336.
Janecki DJ, Bemis KG, Tegeler TJ, Sanghani PC, Zhai L, Hurley TD,
Bosron WF, Wang M. 2007. A multiple reaction monitoring method
for absolute quantification of the human liver alcohol dehydrogenase
ADH1C1 isoenzyme. Anal Biochem 369:18–26.
Jiang X-S, Dai J, Sheng Q-H, Zhang L, Xia Q-C, Wu J-R, Zeng R. 2005.
A comparative proteomic strategy for subcellular proteome research.
Mol Cell Proteomics 4:12–34.
Johansson C, Samskog J, Sundstrom L, Wadensten H, Bjorkesten L,
Flensburg J. 2006. Differential expression analysis of Escherichia
coli proteins using a novel software for relative quantitation of LC-
MS/MS data. Proteomics 6:4475–4485.
Jorge I, Navarro P, Martınez-Acedo P, Nunez E, Serrano H, Alfranca A,
Redondo JM, Vazquez J. 2009. Statistical model to analyze quantita-
tive proteomics data obtained by 18O/16O labeling and linear ion
trap mass spectrometry. Mol Cell Proteomics 8:1130–1149.
Kamper P, Ludvigsen M, Bendix K, Hamilton-Dutoit S, Rabinovich GA,
Møller MB, Nyengaard JR, Honore B, d’Amore F. 2011. Proteomic
analysis identifies galectin-1 as a predictive biomarker for relapsed/
refractory disease in classical Hodgkin lymphoma. Blood 117(24):
6638–6649.
Kandasamy K, Keerthikumar S, Goel R, Mathivanan S, Patankar N,
Shafreen B, Renuse S, Pawar H, Ramachandra YL, Acharya PK,
Ranganathan P, Chaerkady R, Keshava Prasad TS, Pandey A. 2009.
Human proteinpedia: A unified discovery resource for proteomics
research. Nucleic Acids Res 37:D773–D781.
Kanehisa M, Araki M, Goto S, Hattori M, Hirakawa M, Itoh M, Katayama
T, Kawashima S, Okuda S, Tokimatsu T, Yamanishi Y. 2008. KEGG
for linking genomes to life and the environment. Nucleic Acids Res
36:D480–D484.
Karp NA, Huber W, Sadowski PG, Charles PD, Hester SV, Lilley KS.
2010. Addressing accuracy and precision issues in iTRAQ quantita-
tion. Mol Cell Proteomics 9:1885–1897.
Keidel E-M, Ribitsch D, Lottspeich F. 2010. Equalizer technology—Equal
rights for disparate beads. Proteomics 10:2089–2098.
Keller A, Eng J, Zhang N, Li X-j, Aebersold R. 2005. A uniform proteo-
mics MS/MS analysis platform utilizing open XML file formats.
Mol Syst Biol 1:2005.0017.
Kelly-Spratt KS, Kasarda AE, Igra M, Kemp CJ. 2008. A mouse model
repository for cancer biomarker discovery. J Proteome Res 7:3613–
3618.
Keshishian H, Addona T, Burgess M, Kuhn E, Carr SA. 2007. Quantita-
tive, multiplexed assays for low abundance proteins in plasma by
targeted mass spectrometry and stable isotope dilution. Mol Cell
Proteomics 6:2212–2229.
Keshishian H, Addona T, Burgess M, Mani DR, Shi X, Kuhn E, Sabatine
MS, Gerszten RE, Carr SA. 2009. Quantification of cardiovascular
biomarkers in patient plasma by targeted mass spectrometry and sta-
ble isotope dilution. Mol Cell Proteomics 8:2339–2349.
Khositseth S, Pisitkun T, Slentz DH, Wang G, Hoffert JD, Knepper MA,
Yu M-J. 2011. Quantitative protein and mRNA profiling shows selec-
tive post-transcriptional control of protein expression by vasopressin
in kidney cells. Mol Cell Proteomics 10(1):M110.004036.
Kirkpatrick DS, Gerber SA, Gygi SP. 2005. The absolute quantification
strategy: A general procedure for the quantification of proteins and
post-translational modifications. Methods 35:265–273.
Kito K, Ota K, Fujita T, Ito T. 2007. A synthetic protein approach toward
accurate mass spectrometric quantification of component stoichiome-
try of multiprotein complexes. J Proteome Res 6:792–800.
Kiyonami R, Schoen A, Prakash A, Peterman S, Zabrouskov V, Picotti P,
Aebersold R, Huhmer A, Domon B. 2011. Increased selectivity, ana-
lytical precision, and throughput in targeted proteomics. Mol Cell
Proteomics 10(2):M110.002931.
Kocher T, Pichler P, Schutzbier M, Stingl C, Kaul A, Teucher N, Hasen-
fuss G, Penninger JM, Mechtler K. 2009. High precision quantitative
proteomics using iTRAQ on an LTQ Orbitrap: A new mass spectro-
metric method combining the benefits of all. J Proteome Res 8:
4743–4752.
& RODRIGUEZ-SUAREZ AND WHETTON
20 Mass Spectrometry Reviews DOI 10.1002/mas
Kolch W, Mischak H, Pitt AR. 2005. The molecular make-up of a tumour:
Proteomics in cancer research. Clin Sci 108:369–383.
Krijgsveld J, Ketting RF, Mahmoudi T, Johansen J, Artal-Sanz M,
Verrijzer CP, Plasterk RHA, Heck AJR. 2003. Metabolic labeling of
C. elegans and D. melanogaster for quantitative proteomics. Nat
Biotech 21:927–931.
Krokhin OV, Craig R, Spicer V, Ens W, Standing KG, Beavis RC, Wilkins
JA. 2004. An improved model for prediction of retention times of
tryptic peptides in ion pair reversed-phase HPLC. Mol Cell Proteo-
mics 3:908–919.
Kruger M, Moser M, Ussar S, Thievessen I, Luber CA, Forner F, Schmidt
S, Zanivan S, Fassler R, Mann M. 2008. SILAC mouse for quantita-
tive proteomics uncovers kindlin-3 as an essential factor for red
blood cell function. Cell 134:353–364.
Kuhn E. 2004. Quantification of C-reactive protein in the serum of
patients with rheumatoid arthritis using multiple reaction monitoring
mass spectrometry and 13C-labeled peptide standards. Proteomics
4:1175–1186.
Kuhn E, Addona T, Keshishian H, Burgess M, Mani DR, Lee RT, Sabatine
MS, Gerszten RE, Carr SA. 2009. Developing multiplexed assays for
troponin I and interleukin-33 in plasma by peptide immunoaffinity
enrichment and targeted mass spectrometry. Clin Chem 55:1108–
1117.
Kulasingam V, Diamandis EP. 2007. Proteomics analysis of conditioned
media from three breast cancer cell lines. Mol Cell Proteomics
6:1997–2011.
Kuster B, Schirle M, Mallick P, Aebersold R. 2005. Scoring proteomes
with proteotypic peptide probes. Nat Rev Mol Cell Biol 6:577–
583.
Kuzyk MA, Smith D, Yang J, Cross TJ, Jackson AM, Hardie DB, Ander-
son NL, Borchers CH. 2009. Multiple reaction monitoring-based,
multiplexed, absolute quantitation of 45 proteins in human plasma.
Mol Cell Proteomics 8:1860–1877.
Lacerda CMR, Xin L, Rogers I, Reardon KF. 2008. Analysis of iTRAQ
data using mascot and peaks quantification algorithms. Briefings
Funct Genomics Proteomics 7:119–126.
Laderas T, Bystrom C, McMillen D, Fan G, McWeeney S. 2007. Tand-
TRAQ: An open-source tool for integrated protein identification and
quantitation. Bioinformatics 23:3394–3396.
Lai KKY, Kolippakkam D, Beretta L. 2008. Comprehensive and quantita-
tive proteome profiling of the mouse liver and plasma. Hepatology
47:1043–1051.
Lange V, Malmstrom JA, Didion J, King NL, Johansson BP, Schafer J,
Rameseder J, Wong C-H, Deutsch EW, Brusniak M-Y, Buhlmann P,
Bjorck L, Domon B, Aebersold R. 2008a. Targeted Quantitative
analysis of streptococcus pyogenes virulence factors by multiple
reaction monitoring. Mol Cell Proteomics 7:1489–1500.
Lange V, Picotti P, Domon B, Aebersold R. 2008b. Selected reaction mon-
itoring for quantitative proteomics: A tutorial. Mol Syst Biol 4:222.
Lau E, Lam MPY, Siu SO, Kong RPW, Chan WL, Zhou Z, Huang J, Lo
C, Chu IK. 2011. Combinatorial use of offline SCX and online RP-
RP liquid chromatography for iTRAQ-based quantitative proteomics
applications. Mol BioSyst 7:1399–1408.
Lee H-J, Na K, Kwon M-S, Kim H, Kim KS, Paik Y-K. 2009. Quantita-
tive analysis of phosphopeptides in search of the disease biomarker
from the hepatocellular carcinoma specimen. Proteomics 9:3395–
3408.
Lee CF, Griffiths S, Rodrıguez-Suarez E, Pierce A, Unwin RD, Jaworska
E, Evans CA, Gaskell SJ, Whetton AD. 2010. Assessment of down-
stream effectors of BCR/ABL protein tyrosine kinase using com-
bined proteomic approaches. Proteomics 10:3321–3342.
Lee B, Lopez-Ferrer D, Kim BC, Na HB, Park YI, Weitz KK, Warner
MG, Hyeon T, Lee S-W, Smith RD, Kim J. 2011. Rapid and efficient
protein digestion using trypsin-coated magnetic nanoparticles under
pressure cycles. Proteomics 11:309–318.
Leivonen S-K, Rokka A, Ostling P, Kohonen P, Corthals GL, Kallioniemi
O , Perala M . 2012. Identification of miR-193b targets in breast
cancer cells and systems biological analysis of their functional im-
pact. Mol Cell Proteomics 10(7):M110.005322.
Leung WKC, Ching AKK, Chan AWH, Poon TCW, Mian H, Wong AST,
To KF, Wong N. 2011. A novel interplay between oncogenic PFTK1
protein kinase and tumor suppressor TAGLN2 in the control of liver
cancer cell motility. Oncogene 3; 30(44):4464–4475.
Li X-j, Yi EC, Kemp CJ, Zhang H, Aebersold R. 2005. A software suite
for the generation and comparison of peptide arrays from sets of
data collected by liquid chromatography-mass spectrometry. Mol
Cell Proteomics 4:1328–1340.
Li G-Z, Vissers JPC, Silva JC, Golick D, Gorenstein MV, Geromanos SJ.
2009. Database searching and accounting of multiplexed precursor
and product ion spectra from the data independent analysis of simple
and complex peptide mixtures. Proteomics 9:1696–1719.
Lin W-T, Hung W-N, Yian Y-H, Wu K-P, Han C-L, Chen Y-R, Chen Y-J,
Sung T-Y, Hsu W-L. 2006. Multi-Q: A fully automated tool for mul-
tiplexed protein quantitation. J Proteome Res 5:2328–2338.
Liu H, Sadygov RG, Yates JR. 2004. A model for random sampling and
estimation of relative protein abundance in shotgun proteomics. Anal
Chem 76:4193–4201.
Lopez MF, Kuppusamy R, Sarracino DA, Prakash A, Athanas M, Krastins
B, Rezai T, Sutton JN, Peterman S, Nicolaides K. 2010. Mass spec-
trometric discovery and selective reaction monitoring (SRM) of
putative protein biomarker candidates in first trimester trisomy 21
maternal serum. J Proteome Res 10(1):133–142.
Lopez-Ferrer D, Petritis K, Robinson EW, Hixson KK, Tian Z, Lee JH,
Lee S-W, Tolic N, Weitz KK, Belov ME, Smith RD, Pasa-Tolic L.
2011. Pressurized pepsin digestion in proteomics. Mol Cell Proteo-
mics 10(2):M110.001479.
Lu P, Vogel C, Wang R, Yao X, Marcotte EM. 2007. Absolute protein
expression profiling estimates the relative contributions of transcrip-
tional and translational regulation. Nat Biotech 25:117–124.
Luethy R, Kessner DE, Katz JE, MacLean B, Grothe R, Kani K, Faca V,
Pitteri S, Hanash S, Agus DB, Mallick P. 2008. Precursor-ion mass
re-estimation improves peptide identification on hybrid instruments.
J Proteome Res 7:4031–4039.
Ma D, Chan MK, Lockstone HE, Pietsch SR, Jones DNC, Cilia J,
Hill MD, Robbins MJ, Benzel IM, Umrania Y, Guest PC, Levin Y,
Maycox PR, Bahn S. 2009. Antipsychotic treatment alters protein
expression associated with presynaptic function and nervous system
development in rat frontal cortex. J Proteome Res 8:3284–3297.
MacCoss MJ, Wu CC, Liu H, Sadygov R, Yates JR. 2003. A correlation
algorithm for the automated quantitative analysis of shotgun proteo-
mics data. Anal Chem 75:6912–6921.
Mallick P, Schirle M, Chen SS, Flory MR, Lee H, Martin D, Ranish J,
Raught B, Schmitt R, Werner T, Kuster B, Aebersold R. 2007.
Computational prediction of proteotypic peptides for quantitative
proteomics. Nat Biotech 25:125–131.
Malmstrom J, Beck M, Schmidt A, Lange V, Deutsch EW, Aebersold R.
2009. Proteome-wide cellular protein concentrations of the human
pathogen Leptospira interrogans. Nature 460:762–765.
Mao L, Yang P, Hou S, Li F, Kijlstra A. 2011. Label-free proteomics
reveals decreased expression of CD18 and AKNA in peripheral
CD4þ T cells from patients with Vogt-Koyanagi-Harada syndrome.
PLoS ONE 6:e14616.
Martens L, Hermjakob H, Jones P, Adamski M, Taylor C, States D,
Gevaert K, Vandekerckhove J, Apweiler R. 2005. PRIDE: The prote-
omics identifications database. Proteomics 5:3537–3545.
Martin K, Steinberg TH, Cooley LA, Gee KR, Beechem JM, Patton WF.
2003. Quantitative analysis of protein phosphorylation status and
protein kinase activity on microarrays using a novel fluorescent
phosphorylation sensor dye. Proteomics 3:1244–1255.
Matharoo-Ball B, Ball G, Rees R. 2007. Clinical proteomics: Discovery of
cancer biomarkers using mass spectrometry and bioinformatics
approaches—A prostate cancer perspective. Vaccine 25:B110–B121.
Matthiesen R, Trelle MB, Højrup P, Bunkenborg J, Jensen ON. 2005.
VEMS 3.0: Algorithms and computational tools for tandem mass
QUANTIFICATION TECHNIQUES IN PROTEOMICS &
Mass Spectrometry Reviews DOI 10.1002/mas 21
spectrometry based identification of post-translational modifications
in proteins. J Proteome Res 4:2338–2347.
Maziarz M, Chung C, Drucker DJ, Emili A. 2005. Integrating global
proteomic and genomic expression profiles generated from islet acells. Mol Cell Proteomics 4:458–474.
McAlister GC, Berggren WT, Griep-Raming J, Horning S, Makarov A,
Phanstiel D, Stafford G, Swaney DL, Syka JEP, Zabrouskov V, Coon
JJ. 2008. A proteomics grade electron transfer dissociation-enabled
hybrid linear ion trap-orbitrap mass spectrometer. J Proteome Res
7:3127–3136.
McAlister GC, Phanstiel DH, Brumbaugh J, Westphall MS, Coon JJ.
2011. Higher-energy collision-activated dissociation without a dedi-
cated collision cell. Mol Cell Proteomics 10(5):O111.009456.
Mi H, Lazareva-Ulitsky B, Loo R, Kejariwal A, Vandergriff J, Rabkin S,
Guo N, Muruganujan A, Doremieux O, Campbell MJ, Kitano H,
Thomas PD. 2005. The PANTHER database of protein families,
subfamilies, functions and pathways. Nucleic Acids Res 33:D284–
D288.
Michalski A, Damoc E, Hauschild J-P, Lange O, Wieghaus A, Makarov
A, Nagaraj N, Cox J, Mann M, Horning S. 2011. Mass spectrome-
try-based proteomics using Q Exactive, a high-performance benchtop
quadrupole Orbitrap mass spectrometer. Mol Cell Proteomics
10(9):M111.011015.
Millioni R, Tolin S, Puricelli L, Sbrignadello S, Fadini GP, Tessari P, Arri-
goni G. 2011. High abundance proteins depletion vs low abundance
proteins enrichment: Comparison of methods to reduce the plasma
proteome complexity. PLoS ONE 6:e19603.
Mirgorodskaya OA. 2000. Quantitation of peptides and proteins by
matrix-assisted laser desorption/ionization mass spectrometry using
(18)O-labeled internal standards. Rapid Commun Mass Spectrom
14:1226–1232.
Mirza SP, Greene AS, Olivier M. 2008. 18O labeling over a coffee break:
A rapid strategy for quantitative proteomics. J Proteome Res
7:3042–3048.
Mirzaei H, McBee JK, Watts J, Aebersold R. 2008. Comparative evalua-
tion of current peptide production platforms used in absolute quanti-
fication in proteomics. Mol Cell Proteomics 7:813–823.
Mischerikow N, van Nierop P, Li KW, Bernstein H-G, Smit AB, Heck
AJR, Altelaar AFM. 2010. Gaining efficiency by parallel quantifica-
tion and identification of iTRAQ-labeled peptides using HCD
and decision tree guided CID/ETD on an LTQ Orbitrap. Analyst
135:2643–2652.
Miseta A, Csutora P. 2000. Relationship between the occurrence of cyste-
ine in proteins and the complexity of organisms. Mol Biol Evol
17:1232–1239.
Miyagi M, Rao KCS. 2007. Proteolytic 18O-labeling strategies for quanti-
tative proteomics. Mass Spectrom Rev 26:121–136.
Mortensen P, Gouw JW, Olsen JV, Ong S-E, Rigbolt KTG, Bunkenborg J,
Cox J, Jr., Foster LJ, Heck AJR, Blagoev B, Andersen JS, Mann M.
2009. MSQuant, an open source platform for mass spectrometry-
based quantitative proteomics. J Proteome Res 9:393–403.
Mueller LN, Brusniak M-Y, Mani DR, Aebersold R. 2008. An assessment
of software solutions for the analysis of mass spectrometry based
quantitative proteomics data. J Proteome Res 7:51–61.
Muller C, Schafer P, Stortzel M, Vogt S, Weinmann W. 2002. Ion suppres-
sion effects in liquid chromatography-electrospray-ionisation trans-
port-region collision induced dissociation mass spectrometry with
different serum extraction methods for systematic toxicological anal-
ysis with mass spectra libraries. J Chromatogr B 773:47–52.
Murakoshi Y, Honda K, Sasazuki S, Ono M, Negishi A, Matsubara J,
Sakuma T, Kuwabara H, Nakamori S, Sata N, Nagai H, Ioka T,
Okusaka T, Kosuge T, Shimahara M, Yasunami Y, Ino Y, Tsuchida
A, Aoki T, Tsugane S, Yamada T. 2011. Plasma biomarker discovery
and validation for colorectal cancer by quantitative shotgun mass
spectrometry and protein microarray. Cancer Sci 102:630–638.
Nakamura T, Dohmae N, Takio K. 2004. Characterization of a digested
protein complex with quantitative aspects: An approach based on
accurate mass chromatographic analysis with Fourier transform-ion
cyclotron resonance mass spectrometry. Proteomics 4:2558–2566.
Nicol GR, Han M, Kim J, Birse CE, Brand E, Nguyen A, Mesri M,
FitzHugh W, Kaminker P, Moore PA, Ruben SM, He T. 2008. Use
of an immunoaffinity-mass spectrometry-based approach for the
quantification of protein biomarkers from serum samples of lung
cancer patients. Mol Cell Proteomics 7:1974–1982.
Niggeweg R, Kocher T, Gentzel M, Buscaino A, Taipale M, Akhtar A,
Wilm M. 2006. A general precursor ion-like scanning mode on
quadrupole-TOF instruments compatible with chromatographic sepa-
ration. Proteomics 6:41–53.
Nirmalan N, Sims PFG, Hyde JE. 2004. Quantitative proteomics of the
human malaria parasite Plasmodium falciparum and its application
to studies of development and inhibition. Mol Microbiol 52:1187–
1199.
Oda Y, Huang K, Cross FR, Cowburn D, Chait BT. 1999. Accurate quanti-
tation of protein expression and site-specific phosphorylation. Proc
Natl Acad Sci USA 96:6591–6596.
Old WM, Meyer-Arendt K, Aveline-Wolf L, Pierce KG, Mendoza A, Sev-
insky JR, Resing KA, Ahn NG. 2005. Comparison of label-free
methods for quantifying human proteins by shotgun proteomics. Mol
Cell Proteomics 4:1487–1502.
Olsen JV, de Godoy LMF, Li G, Macek B, Mortensen P, Pesch R,
Makarov A, Lange O, Horning S, Mann M. 2005. Parts per million
mass accuracy on an orbitrap mass spectrometer via lock mass injec-
tion into a C-trap. Mol Cell Proteomics 4:2010–2021.
Olsen JV, Macek B, Lange O, Makarov A, Horning S, Mann M. 2007.
Higher-energy C-trap dissociation for peptide modification analysis.
Nat Methods 4:709–712.
Ong SE. 2002. Stable isotope labeling by amino acids in cell culture,
SILAC, as a simple and accurate approach to expression proteomics.
Mol Cell Proteomics 1:376–386.
Ong S-E, Mann M. 2005. Mass spectrometry-based proteomics turns
quantitative. Nat Chem Biol 1:252–262.
Ong SE, Kratchmarova I, Mann M. 2003. Properties of 13C-substituted
arginine in stable isotope labeling by amino acids in cell culture
(SILAC). J Proteome Res 2:173–181.
Ong SE, Mittler G, Mann M. 2004. Identifying and quantifying in vivo
methylation sites by heavy methyl SILAC. Nat Methods 1:119–126.
Ostroff RM, Bigbee WL, Franklin W, Gold L, Mehan M, Miller YE, Pass
HI, Rom WN, Siegfried JM, Stewart A, Walker JJ, Weissfeld JL,
Williams S, Zichi D, Brody EN. 2010. Unlocking biomarker discov-
ery: Large scale application of aptamer proteomic technology for
early detection of lung cancer. PLoS ONE 5:e15003.
Ow SY, Salim M, Noirel J, Evans C, Rehman I, Wright PC. 2009. iTRAQ
underestimation in simple and complex mixtures: ‘‘The good, the
bad and the ugly’’. J Proteome Res 8:5347–5355.
Ow SY, Noirel J, Salim M, Evans C, Watson R, Wright PC. 2010. Balanc-
ing robust quantification and identification for iTRAQ: Application
of UHR-ToF MS. Proteomics 10:2205–2213.
Park K-S, Mohapatra DP, Misonou H, Trimmer JS. 2006. Graded regula-
tion of the Kv2.1 potassium channel by variable phosphorylation.
Science 313:976–979.
Park SK, Venable JD, Xu T, Yates JR. 2008. A quantitative analysis soft-
ware tool for mass spectrometry-based proteomics. Nat Methods
5:319–322.
Picotti P, Lam H, Campbell D, Deutsch EW, Mirzaei H, Ranish J, Domon
B, Aebersold R. 2008. A database of mass spectrometric assays for
the yeast proteome. Nat Methods 5:913–914.
Picotti P, Bodenmiller B, Mueller LN, Domon B, Aebersold R. 2009. Full
dynamic range proteome analysis of S. cerevisiae by targeted proteo-
mics. Cell 138:795–806.
Pierce A, Unwin RD, Evans CA, Griffiths S, Carney L, Zhang L, Jaworska
E, Lee C-F, Blinco D, Okoniewski MJ, Miller CJ, Bitton DA,
Spooncer E, Whetton AD. 2008. Eight-channel iTRAQ enables com-
parison of the activity of six leukemogenic tyrosine kinases. Mol
Cell Proteomics 7:853–863.
& RODRIGUEZ-SUAREZ AND WHETTON
22 Mass Spectrometry Reviews DOI 10.1002/mas
Pitarch A, Nombela C, Gil C. 2011. Prediction of the clinical outcome in
invasive candidiasis patients based on molecular fingerprints of five
anti-candida antibodies in serum. Mol Cell Proteomics 10(1):M110.
004010.
Prakash C, Shaffer CL, Nedderman A. 2007. Analytical strategies for
identifying drug metabolites. Mass Spectrom Rev 26:340–369.
Prakash A, Tomazela DM, Frewen B, MacLean B, Merrihew G, Peterman
S, MacCoss MJ. 2009. Expediting the development of targeted SRM
assays: Using data from shotgun proteomics to automate method
development. J Proteome Res 8:2733–2739.
Pratt JM, Petty J, Riba-Garcia I, Robertson DHL, Gaskell SJ, Oliver SG,
Beynon RJ. 2002. Dynamics of protein turnover, a missing dimen-
sion in proteomics. Mol Cell Proteomics 1:579–591.
Pratt JM, Simpson DM, Doherty MK, Rivers J, Gaskell SJ, Beynon RJ.
2006. Multiplexed absolute quantification for proteomics using
concatenated signature peptides encoded by QconCAT genes. Nat
Protoc 1:1029–1043.
Pritsker M, Lemischka IR. 2006. Alternative splicing increases complexity
of stem cell transcriptome. Cell Cycle 5:347–351.
Qualtieri A, Urso E, Pera ML, Sprovieri T, Bossio S, Gambardella A,
Quattrone A. 2010. Proteomic profiling of cerebrospinal fluid in
Creutzfeldt–Jakob disease. Expert Rev Proteomics 7:907–917.
Rabilloud T. 2002. Two-dimensional gel electrophoresis in proteomics:
Old, old fashioned, but it still climbs up the mountains. Proteomics
2:3–10.
Radulovic D, Jelveh S, Ryu S, Hamilton TG, Foss E, Mao Y, Emili A.
2004. Informatics platform for global proteomic profiling and bio-
marker discovery using liquid chromatography-tandem mass spec-
trometry. Mol Cell Proteomics 3:984–997.
Raijmakers R, Neerincx P, Mohammed S, Heck AJR. 2010. Cleavage spe-
cificities of the brother and sister proteases Lys-C and Lys-N. Chem
Commun 46:8827–8829.
Rajapakse JC, Duan K-B, Kiang Yeo W. 2005. Proteomic cancer classifi-
cation with mass spectrometry data. Am J Pharmacogenomics 5:
281–292.
Ramos-Fernandez A, Lopez-Ferrer D, Vazquez J. 2007. Improved method
for differential expression proteomics using trypsin-catalyzed 18O la-
beling with a correction for labeling efficiency. Mol Cell Proteomics
6:1274–1286.
Rao KCS, Carruth RT, Miyagi M. 2005. Proteolytic 18O labeling by pep-
tidyl-Lys metalloendopeptidase for comparative proteomics. J Prote-
ome Res 4:507–514.
Rappsilber J, Ryder U, Lamond AI, Mann M. 2002. Large-scale proteomic
analysis of the human spliceosome. Genome Res 12:1231–1245.
Richardson MR, Lai X, Witzmann FA, Yoder MC. 2010. Venous and arte-
rial endothelial proteomics: Mining for markers and mechanisms of
endothelial diversity. Expert Rev Proteomics 7:823–831.
Rifai N, Gillette MA, Carr SA. 2006. Protein biomarker discovery
and validation: The long and uncertain path to clinical utility. Nat
Biotech 24:971–983.
Righetti PG, Boschetti E. 2008. The ProteoMiner and the FortyNiners:
Searching for gold nuggets in the proteomic arena. Mass Spectrom
Rev 27:596–608.
Righetti PG, Castagna A, Antonioli P, Boschetti E. 2005. Prefractionation
techniques in proteome analysis: The mining tools of the third
millennium. Electrophoresis 26:297–319.
Righetti PG, Boschetti E, Lomas L, Citterio A. 2006. Protein EqualizerTM
Technology: The quest for a ‘‘democratic proteome’’. Proteomics
6:3980–3992.
Righetti PG, Boschetti E, Kravchuk AV, Fasoli E. 2010. The proteome
buccaneers: How to unearth your treasure chest via combinatorial
peptide ligand libraries. Expert Rev Proteomics 7:373–385.
Rivers J, Simpson DM, Robertson DHL, Gaskell SJ, Beynon RJ. 2007.
Absolute multiplexed quantitative analysis of protein expression
during muscle development using QconCAT. Mol Cell Proteomics
6:1416–1427.
Rodrıguez-Suarez E, Gubb E, Alzueta IF, Falcon-Perez JM, Amorim A,
Elortza F, Matthiesen R. 2010. Virtual expert mass spectrometrist:
iTRAQ tool for database-dependent search, quantitation and result
storage. Proteomics 10:1545–1556.
Ross PL, Huang YN, Marchese JN, Williamson B, Parker K, Hattan S,
Khainovski N, Pillai S, Dey S, Daniels S, Purkayastha S, Juhasz P,
Martin S, Bartlet-Jones M, He F, Jacobson A, Pappin DJ. 2004.
Multiplexed protein quantitation in Saccharomyces cerevisiae using
amine-reactive isobaric tagging reagents. Mol Cell Proteomics
3:1154–1169.
Ruppen I, Grau L, Orenes-Pinero E, Ashman K, Gil M, Algaba F, Bell-
munt J, Sanchez-Carbayo M. 2010. Differential protein expression
profiling by iTRAQ-two-dimensional LC-MS/MS of human bladder
cancer EJ138 cells transfected with the metastasis suppressor KiSS-1
gene. Mol Cell Proteomics 9:2276–2291.
Russell WK, Park Z-Y, Russell DH. 2001. Proteolysis in mixed organic—
Aqueous solvent systems: Applications for peptide mass mapping
using mass spectrometry. Anal Chem 73:2682–2685.
Sandra K, Verleysen K, Labeur C, Vanneste L, D’Hondt F, Thomas G,
Kas K, Gevaert K, Vandekerckhove J, Sandra P. 2007. Combination
of COFRADIC and high temperature—Extended column length
conventional liquid chromatography: A very efficient way to
tackle complex protein samples, such as serum. J Sep Sci 30:658–
668.
Sardiu ME, Washburn MP. 2010. Enriching quantitative proteomics with
SIN. Nat Biotech 28:40–42.
Sardiu ME, Cai Y, Jin J, Swanson SK, Conaway RC, Conaway JW,
Florens L, Washburn MP. 2008. Probabilistic assembly of human
protein interaction networks from label-free quantitative proteomics.
Proc Natl Acad Sci 105:1454–1459.
Savitski M, Fischer F, Mathieson T, Sweetman G, Lang M, Bantscheff M.
2010. Targeted data acquisition for improved reproducibility and
robustness of proteomic mass spectrometry assays. J Am Soc Mass
Spectrom 21:1668–1679.
Schulze WX, Mann M. 2004. A novel proteomic screen for peptide-
protein interactions. J Biol Chem 279:10756–10764.
Schwamborn K, Gaisa NT, Henkel C. 2010. Tissue and serum proteomic
profiling for diagnostic and prognostic bladder cancer biomarkers.
Expert Rev Proteomics 7:897–906.
Searle BC. 2010. Scaffold: A bioinformatic tool for validating MS/MS-
based proteomic studies. Proteomics 10:1265–1269.
Sela I, Milman Krentsis I, Shlomai Z, Sadeh M, Dabby R, Argov Z,
Ben-Bassat H, Mitrani-Rosenbaum S. 2011. The proteomic profile of
hereditary inclusion body myopathy. PLoS ONE 6:e16334.
Sevinsky JR, Brown KJ, Cargile BJ, Bundy JL, Stephenson JL. 2007.
Minimizing back exchange in 18O/16O quantitative proteomics
experiments by incorporation of immobilized trypsin into the initial
digestion step. Anal Chem 79:2158–2162.
Shadforth I, Dunkley T, Lilley K, Bessant C. 2005. i-Tracker: For quanti-
tative proteomics using iTRAQTM. BMC Genomics 6:145.
Sherman J, McKay MJ, Ashman K, Molloy MP. 2009. How specific is my
SRM?: The issue of precursor and product ion redundancy. Proteo-
mics 9:1120–1123.
Shi Y, Chan DW, Jung SY, Malovannaya A, Wang Y, Qin J. 2011.
A dataset of human endogenous ubiquitination sites. Mol Cell Prote-
omics 10(5):M110.002089.
Shinkawa T, Taoka M, Yamauchi Y, Ichimura T, Kaji H, Takahashi N,
Isobe T. 2005. STEM: A software tool for large-scale proteomic data
analyses. J Proteome Res 4:1826–1831.
Shinoda K, Tomita M, Ishihama Y. 2010. emPAI Calc—For the estimation
of protein abundance from large-scale identification data by liquid
chromatography-tandem mass spectrometry. Bioinformatics 26:576–
577.
Shirran SL, Botting CH. 2010. A comparison of the accuracy of iTRAQ
quantification by nLC-ESI MSMS and nLC-MALDI MSMS meth-
ods. J Proteomics 73:1391–1403.
QUANTIFICATION TECHNIQUES IN PROTEOMICS &
Mass Spectrometry Reviews DOI 10.1002/mas 23
Silva JC, Denny R, Dorschel CA, Gorenstein M, Kass IJ, Li G-Z,
McKenna T, Nold MJ, Richardson K, Young P, Geromanos S. 2005.
Quantitative proteomic analysis by accurate mass retention time
pairs. Anal Chem 77:2187–2200.
Silva JC, Denny R, Dorschel C, Gorenstein MV, Li G-Z, Richardson K,
Wall D, Geromanos SJ. 2006a. Simultaneous qualitative and quanti-
tative analysis of the Escherichia coli proteome. Mol Cell Proteo-
mics 5:589–607.
Silva JC, Gorenstein MV, Li G-Z, Vissers JPC, Geromanos SJ. 2006b.
Absolute quantification of proteins by LCMSE. Mol Cell Proteomics
5:144–156.
Silvestrini F, Lasonder E, Olivieri A, Camarda G, van Schaijk B, Sanchez
M, Younis Younis S, Sauerwein R, Alano P. 2010. Protein export
marks the early phase of gametocytogenesis of the human malaria
parasite Plasmodium falciparum. Mol Cell Proteomics 9:1437–1448.
Soufi B, Kumar C, Gnad F, Mann M, Mijakovic I, Macek B. 2010. Stable
isotope labeling by amino acids in cell culture (SILAC) applied to
quantitative proteomics of Bacillus subtilis. J Proteome Res 9:3638–
3646.
Staes A, Demol H, Van Damme J, Martens L, Vandekerckhove J, Gevaert
K. 2004. Global differential non-gel proteomics by quantitative and
stable labeling of tryptic peptides with oxygen-18. J Proteome Res
3:786–791.
Stahl-Zeng J, Lange V, Ossola R, Eckhardt K, Krek W, Aebersold R,
Domon B. 2007. High sensitivity detection of plasma proteins by
multiple reaction monitoring of N-glycosites. Mol Cell Proteomics
6:1809–1817.
Stapels M, Piper C, Yang T, Li M, Stowell C, Xiong Z-g, Saugstad J,
Simon RP, Geromanos S, Langridge J, Lan J-q, Zhou A. 2010. Poly-
comb group proteins as epigenetic mediators of neuroprotection in
ischemic tolerance. Sci Signal 3:ra15.
Steinberg TH, Agnew BJ, Gee KR, Leung W-Y, Goodman T, Schulenberg
B, Hendrickson J, Beechem JM, Haugland RP, Patton WF.
2003. Global quantitative phosphoprotein analysis using Multiplexed
Proteomics technology. Proteomics 3:1128–1144.
Stemmann O, Zou H, Gerber SA, Gygi SP, Kirschner MW. 2001. Dual
inhibition of sister chromatid separation at metaphase. Cell 107:715–
726.
Strader MB, Tabb DL, Hervey WJ, Pan C, Hurst GB. 2005. Efficient and
specific trypsin digestion of microgram to nanogram quantities of
proteins in organic–aqueous solvent systems. Anal Chem 78:125–
134.
Surinova S, Schiess R, Huttenhain R, Cerciello F, Wollscheid B, Aeber-
sold R. 2010. On the development of plasma protein biomarkers.
J Proteome Res 10:5–16.
Sury MD, Chen J-X, Selbach M. 2010. The SILAC fly allows for accurate
protein quantification in vivo. Mol Cell Proteomics 9:2173–2183.
Syka JE. 2004. Novel linear quadrupole ion trap/FT mass spectrometer:
Performance characterization and use in the comparative analysis of
histone H3 post-translational modifications. J Proteome Res 3:621–
626.
Tang K, Page JS, Smith RD. 2004. Charge competition and the linear
dynamic range of detection in electrospray ionization mass spec-
trometry. J Am Soc Mass Spectrom 15:1416–1423.
Tang H, Arnold RJ, Alves P, Xun Z, Clemmer DE, Novotny MV, Reilly
JP, Radivojac P. 2006. A computational approach toward label-free
protein quantification using predicted peptide detectability. Bioinfor-
matics 22:e481–e488.
Taouatas N, Heck AJR, Mohammed S. 2010. Evaluation of metalloendo-
peptidase Lys-N protease performance under different sample han-
dling conditions. J Proteome Res 9:4282–4288.
Taussig MJ, Stoevesandt O, Borrebaeck CAK, Bradbury AR, Cahill D,
Cambillau C, de Daruvar A, Dubel S, Eichler J, Frank R, Gibson TJ,
Gloriam D, Gold L, Herberg FW, Hermjakob H, Hoheisel JD, Joos
TO, Kallioniemi O, Koegl M, Konthur Z, Korn B, Kremmer E, Kro-
bitsch S, Landegren U, van der Maarel S, McCafferty J, Muylder-
mans S, Nygren P-A, Palcy S, Pluckthun A, Polic B, Przybylski M,
Saviranta P, Sawyer A, Sherman DJ, Skerra A, Templin M, Ueffing
M, Uhlen M. 2007. ProteomeBinders: Planning a European resource
of affinity reagents for analysis of the human proteome. Nat Methods
4:13–17.
Thakur SS, Geiger T, Chatterjee B, Bandilla P, Frohlich F, Cox J, Mann
M. 2011. Deep and highly sensitive proteome coverage by LC-MS/
MS without prefractionation. Mol Cell Proteomics 10(8):
M110.003699.
Thompson A. 2003. Tandem mass tags: A novel quantification strategy for
comparative analysis of complex protein mixtures by MS/MS. Anal
Chem 75:1895–1904.
Tirumalai RS, Chan KC, Prieto DA, Issaq HJ, Conrads TP, Veenstra TD.
2003. Characterization of the low molecular weight human serum
proteome. Mol Cell Proteomics 2:1096–1103.
Tjalsma H. 2010. Identification of biomarkers for colorectal cancer
through proteomics-based approaches. Expert Rev Proteomics 7:
879–895.
Tops BBJ, Gauci S, Heck AJR, Krijgsveld J. 2009. Worms from Venus
and Mars: Proteomics profiling of sexual differences in Caenorhab-
ditis elegans using in vivo 15N isotope labeling. J Proteome Res
9:341–351.
Ueda K, Takami S, Saichi N, Daigo Y, Ishikawa N, Kohno N, Katsumata
M, Yamane A, Ota M, Sato T-A, Nakamura Y, Nakagawa H. 2010.
Development of serum glycoproteomic profiling technique; simulta-
neous identification of glycosylation sites and site-specific quantifica-
tion of glycan structure changes. Mol Cell Proteomics 9:1819–1828.
Unlu M, Morgan ME, Minden JS. 1997. Difference gel electrophoresis. A
single gel method for detecting changes in protein extracts. Electro-
phoresis 18:2071–2077.
Unwin RD, Griffiths JR, Leverentz MK, Grallert A, Hagan IM, Whetton
AD. 2005. Multiple reaction monitoring to identify sites of protein
phosphorylation with high sensitivity. Mol Cell Proteomics 4:1134–
1144.
Unwin RD, Smith DL, Blinco D, Wilson CL, Miller CJ, Evans CA, Jawor-
ska E, Baldwin SA, Barnes K, Pierce A, Spooncer E, Whetton AD.
2006. Quantitative proteomics reveals posttranslational control as a
regulatory factor in primary hematopoietic stem cells. Blood 107:
4687–4694.
Unwin RD, Griffiths JR, Whetton AD. 2009. A sensitive mass spectromet-
ric method for hypothesis-driven detection of peptide post-transla-
tional modifications: Multiple reaction monitoring-initiated detection
and sequencing (MIDAS). Nat Protoc 4:870–877.
Van Hoof D, Pinkse MWH, Oostwaard DW-V, Mummery CL, Heck AJR,
Krijgsveld J. 2007. An experimental correction for arginine-to-
proline conversion artifacts in SILAC-based quantitative proteomics.
Nat Methods 4:677–678.
Vandenbogaert M, Li-Thiao-Te S, Kaltenbach H-M, Zhang R, Aittokallio
T, Schwikowski B. 2008. Alignment of LC-MS images, with appli-
cations to biomarker discovery and protein identification. Proteomics
8:650–672.
VanGuilder HD, Bixler GV, Kutzler L, Brucklacher RM, Bronson SK,
Kimball SR, Freeman WM. 2011. Multi-modal proteomic analysis
of retinal protein expression alterations in a rat model of diabetic
retinopathy. PLoS ONE 6:e16271.
Visintin I, Feng Z, Longton G, Ward DC, Alvero AB, Lai Y, Tenthorey J,
Leiser A, Flores-Saaib R, Yu H, Azori M, Rutherford T, Schwartz
PE, Mor G. 2008. Diagnostic markers for early detection of ovarian
cancer. Clin Cancer Res 14:1065–1072.
Vissers JPC, Langridge JI, Aerts JMFG. 2007. Analysis and quantification
of diagnostic serum markers and protein signatures for Gaucher dis-
ease. Mol Cell Proteomics 6:755–766.
Vissers JPC, Pons S, Hulin A, Tissier R, Berdeaux A, Connolly JB, Lan-
gridge JI, Geromanos SJ, Ghaleh B. 2009. The use of proteome sim-
ilarity for the qualitative and quantitative profiling of reperfused
myocardium. J Chromatogr B 877:1317–1326.
Vizcaıno JA, Cote R, Reisinger F, Foster JM, Mueller M, Rameseder J,
Hermjakob H, Martens L. 2009. A guide to the proteomics identi-
& RODRIGUEZ-SUAREZ AND WHETTON
24 Mass Spectrometry Reviews DOI 10.1002/mas
fications database proteomics data repository. Proteomics 9: 4276–
4283.
Vogelstein B, Kinzler KW. 2004. Cancer genes and the pathways they
control. Nat Med 10:789–799.
Voisin SN, Krakovska O, Matta A, DeSouza LV, Romaschin AD, Colgan
TJ, Siu KWM. 2011. Identification of novel molecular targets for
endometrial cancer using a drill-down LC-MS/MS approach with
iTRAQ. PLoS ONE 6:e16352.
Volmer MW, Stuhler K, Zapatka M, Schoneck A, Klein-Scory S, Schmie-
gel W, Meyer HE, Schwarte-Waldhoff I. 2005. Differential proteome
analysis of conditioned media to detect Smad4 regulated secreted
biomarkers in colon cancer. Proteomics 5:2587–2601.
Voyksner RD, Lee H. 1999. Investigating the use of an octupole ion guide
for ion storage and high-pass mass filtering to improve the quantita-
tive performance of electrospray ion trap mass spectrometry. Rapid
Commun Mass Spectrom 13:1427–1437.
Walther DM, Mann M. 2011. Accurate quantification of more than 4000
mouse tissue proteins reveals minimal proteome changes during
aging. Mol Cell Proteomics 10(2):M110.004523.
Wang YK, Ma Z, Quinn DF, Fu EW. 2001. Inverse 18O labeling mass
spectrometry for the rapid identification of marker/target proteins.
Anal Chem 73:3742–3750.
Wang W, Zhou H, Lin H, Roy S, Shaler TA, Hill LR, Norton S, Kumar P,
Anderle M, Becker CH. 2003. Quantification of proteins and metab-
olites by mass spectrometry without isotopic labeling or spiked
standards. Anal Chem 75:4818–4826.
Wang G, Wu WW, Zeng W, Chou C-L, Shen R-F. 2006. Label-free
protein quantification using LC-coupled ion trap or FT mass spec-
trometry: Reproducibility, linearity, and application with complex
proteomes. J Proteome Res 5:1214–1223.
Washburn MP, Wolters D, Yates JR. 2001. Large-scale analysis of the
yeast proteome by multidimensional protein identification technolo-
gy. Nat Biotech 19:242–2247.
Washburn MP, Ulaszek RR, Yates JR. 2003. Reproducibility of quantita-
tive proteomic analyses of complex biological mixtures by multidi-
mensional protein identification technology. Anal Chem 75:5054.
Whiteaker JR, Zhang H, Zhao L, Wang P, Kelly-Spratt KS, Ivey RG, Pien-
ing BD, Feng L-C, Kasarda E, Gurley KE, Eng JK, Chodosh LA,
Kemp CJ, McIntosh MW, Paulovich AG. 2007. Integrated pipeline
for mass spectrometry-based discovery and confirmation of biomark-
ers demonstrated in a mouse model of breast cancer. J Proteome Res
6:3962–3975.
Wilkins MR. 1996. Progress with proteome projects: Why all proteins
expressed by a genome should be identified and how to do it. Bio-
technol Genet Eng Rev 13:19–50.
Wisniewski JR, Zougman A, Mann M. 2009. Combination of FASP and
StageTip-based fractionation allows in-depth analysis of the hippo-
campal membrane proteome. J Proteome Res 8:5674–5678.
Wisniewski JR, Nagaraj N, Zougman A, Gnad F, Mann M. 2010. Brain
phosphoproteome obtained by a FASP-based method reveals plasma
membrane protein topology. J Proteome Res 9:3280–3289.
Wolf-Yadlin A, Hautaniemi S, Lauffenburger DA, White FM. 2007. Multi-
ple reaction monitoring for robust quantitative proteomic analysis of
cellular signaling networks. Proc Natl Acad Sci 104:5860–5865.
Wright C, Sibani S, Trudgian D, Fischer R, Kessler B, LaBaer J, Bowness
P. 2010. Detection of multiple autoantibodies in patients with anky-
losing spondylitis using nucleic acid programmable protein arrays.
Mol Cell Proteomics M900384-MCP200.
Wright CA, Howles S, Trudgian DC, Kessler BM, Reynard JM, Noble JG,
Hamdy FC, Turney BW. 2011. Label-free quantitative proteomics
reveals differentially regulated proteins influencing urolithiasis. Mol
Cell Proteomics 10(8):M110.005686.
Wu CC, MacCoss MJ, Howell KE, Matthews DE, Yates JRI. 2004. Meta-
bolic labeling of mammalian organisms with stable isotopes for
quantitative proteomic analysis. Anal Chem 76:4951–4959.
Xu G, Paige JS, Jaffrey SR. 2010. Global analysis of lysine ubiquitination
by ubiquitin remnant immunoaffinity profiling. Nat Biotech 28:868–873.
Yao X, Freas A, Ramirez J, Demirev PA, Fenselau C. 2001. Proteolytic18O labeling for comparative proteomics: Model studies with two
serotypes of adenovirus. Anal Chem 73:2836–2842.
Yao X, Afonso C, Fenselau C. 2003. Dissection of proteolytic 18O label-
ing: Endoprotease-catalyzed 16O-to-18O exchange of truncated pep-
tide substrates. J Proteome Res 2:147–152.
Yao M, Ma L, Humphreys WG, Zhu M. 2008. Rapid screening and char-
acterization of drug metabolites using a multiple ion monitoring-de-
pendent MS/MS acquisition method on a hybrid triple quadrupole-
linear ion trap mass spectrometer. J Mass Spectrom 43:1364–1375.
Yates JR, Eng JK, McCormack AL, Schieltz D. 1995. Method to correlate
tandem mass spectra of modified peptides to amino acid sequences
in the protein database. Anal Chem 67:1426–1436.
Ying W, Jiang Y, Guo L, Hao Y, Zhang Y, Wu S, Zhong F, Wang J, Shi R,
Li D, Wan P, Li X, Wei H, Li J, Wang Z, Xue X, Cai Y, Zhu Y,
Qian X, He F. 2006. A dataset of human fetal liver proteome identi-
fied by subcellular fractionation and multiple protein separation and
identification technology. Mol Cell Proteomics 5:1703–1707.
Yu C-Y, Tsui Y-H, Yian Y-H, Sung T-Y, Hsu W-L. 2007. The Multi-Q
web server for multiplexed protein quantitation. Nucleic Acids Res
35:W707–W712.
Yu Y, Shen H, Yu H, Zhong F, Zhang Y, Zhang C, Zhao J, Li H, Chen J,
Liu Y, Yang P. 2011. Systematic proteomic analysis of human hepo-
tacellular carcinoma cells reveals molecular pathways and networks
involved in metastasis. Mol BioSyst 7:1908–1916.
Zang L, Toy DP, Hancock WS, Sgroi DC, Karger BL. 2004. Proteomic
analysis of ductal carcinoma of the breast using laser capture micro-
dissection, LC�MS, and 16O/18O isotopic labeling. J Proteome Res
3:604–612.
Zhang R, Sioma CS, Wang S, Regnier FE. 2001. Fractionation of isotopi-
cally labeled peptides in quantitative proteomics. Anal Chem 73:
5142–5149.
Zhang H, Li X-j, Martin DB, Aebersold R. 2003. Identification and quan-
tification of N-linked glycoproteins using hydrazide chemistry, stable
isotope labeling and mass spectrometry. Nat Biotech 21:660–666.
Zhang B, VerBerkmoes NC, Langston MA, Uberbacher E, Hettich RL,
Samatova NF. 2006. Detecting differential and correlated protein ex-
pression in label-free shotgun proteomics. J Proteome Res 5:2909–
2918.
Zhao Y, Denner L, Haidacher S, LeJeune W, Tilton R. 2008. Comprehen-
sive analysis of the mouse renal cortex using two-dimensional
HPLC—Tandem mass spectrometry. Proteome Sci 6:15.
Zhu H, Pan S, Gu S, Bradbury EM, Chen X. 2002. Amino acid residue
specific stable isotope labeling for quantitative proteomics. Rapid
Commun Mass Spectrom 16:2115–2123.
Zolg W. 2006. The proteomic search for diagnostic biomarkers. Mol Cell
Proteomics 5:1720–1726.
Zolg JW, Langen H. 2004. How industry is approaching the search for
new diagnostic markers and biomarkers. Mol Cell Proteomics
3:345–354.
Zook DR, Bruins AP. 1997. On cluster ions, ion transmission, and linear
dynamic range limitations in electrospray (ionspray) mass spectrom-
etry. Int J Mass Spectrom Ion Processes 162:129–147.
Zybailov B, Coleman MK, Florens L, Washburn MP. 2005. Correlation of
relative abundance ratios derived from peptide ion chromatograms
and spectrum counting for quantitative proteomic analysis using sta-
ble isotope labeling. Anal Chem 77:6218–6224.
Zybailov B, Mosley AL, Sardiu ME, Coleman MK, Florens L, Washburn
MP. 2006. Statistical analysis of membrane proteome expression
changes in Saccharomyces cerevisiae. J Proteome Res 5:2339–2347.
Zybailov BL, Florens L, Washburn MP. 2007. Quantitative shotgun prote-
omics using a protease with broad specificity and normalized spec-
tral abundance factors. Mol BioSyst 3:354–360.
QUANTIFICATION TECHNIQUES IN PROTEOMICS &
Mass Spectrometry Reviews DOI 10.1002/mas 25
Eva Rodrıguez Suarez, PhD is currently a Senior Expert of Mass Spectrometry in CIC bio-
GUNE, Spain. She obtained her PhD in the Michael Barber Center for Mass Spectrometry
(UMIST) in 2006, investigating the role of phosphorylation in leukemogenic cells. Afterwards,
she moved to CIC bioGUNE where she was involved in establishing a state of the art mass
spectrometry facility for designing and developing qualitative and quantitative mass spectrometric
studies in collaboration with biotechnological companies and scientific groups of CICbioGUNE.
Her current postdoctoral projects are focused on the application of proteomic strategies to bio-
medical research.
Professor Anthony D. Whetton is currently the Head of School for Cancer and Enabling Scien-
ces at Manchester University. In cancer research Manchester was the leading university in the UK
in the Research Assessment Exercise 2008. He is past Director of the Leukaemia Research Fund
Cellular Development Unit and is now Director of the Leukaemia Lymphoma Research Mass
Spectrometry Unit based at the Wolfson Molecular Imaging Centre, Christie Hospital. He
obtained a PhD in signal transduction research and biophysical chemistry from UMIST followed
by a move into the field of experimental haematology, with 2 years postdoctoral research in the
laboratory of Professor Michael Dexter. He left this position to take up a lectureship at UMIST in
1984 where he became the Professor of Cell Biology in 1995 and Head of Department in 2001.
He then joined the School of Medicine at Manchester University in 2003 as Professor of Cancer
Cell Biology, based at the Christie Hospital. Here he established a state of the art biological mass
spectrometry facility for stem cell and leukemia research. He is currently systematically defining
the downstream proteomic and phosphoproteomic effects of the protein tyrosine kinases associat-
ed with myeloproliferative disorders and myeloid leukemias to discover common mechanisms for
leukemic transformation. He is also Adjunct Professor in the Department of Gene and Cell Medi-
cine at Mount Sinai School of Medicine in New York, USA where he works with the Black
Family Stem Cell Institute, using proteomics to define embryonic stem cell differentiation
control.
& RODRIGUEZ-SUAREZ AND WHETTON
26 Mass Spectrometry Reviews DOI 10.1002/mas


![ProCon – Proteomics Conversion Tool · With ProCon you can convert proteomics identification and quantification results into HUPO standard formats [1, 2], which can be used to upload](https://static.fdocuments.us/doc/165x107/601b565d5f4f7e573f0e913f/procon-a-proteomics-conversion-tool-with-procon-you-can-convert-proteomics-identification.jpg)