
The Application of Advanced Anomaly Detection to Tail ... 201201 AAD HUMS DATA... · Safety...
140
Safety Regulation Group CAA PAPER 2012/01 The Application of Advanced Anomaly Detection to Tail Rotor HUMS Data Based on a report prepared for the CAA by GE Aviation Systems Limited www.caa.co.uk
Transcript of The Application of Advanced Anomaly Detection to Tail ... 201201 AAD HUMS DATA... · Safety...
Safety Regulation Group CAA PAPER 2012/01 The Application of Advanced Anomaly Detection to Tail Rotor HUMS Data Based on a report prepared for the CAA by GE Aviation Systems Limited
www.caa.co.uk

Safety Regulation Group CAA PAPER 2012/01 The Application of Advanced Anomaly Detection to Tail Rotor HUMS Data Based on a report prepared for the CAA by GE Aviation Systems Limited
December 2012

© Civil Aviation Authority 2012 All rights reserved. Copies of this publication may be reproduced for personal use, or for use within a company or organisation, but may not otherwise be reproduced for publication. To use or reference CAA publications for any other purpose, for example within training material for students, please contact the CAA at the address below for formal agreement. ISBN 978 0 11792 794 0 Published December 2012 Enquiries regarding the content of this publication should be addressed to: Flight Operations 2, Safety Regulation Group, Civil Aviation Authority, Aviation House, Gatwick Airport South, West Sussex, RH6 0YR. This document is available in electronic format at www.caa.co.uk/publications
Table of Contents
List of Tables ................................................................................................................................vi
List of Figures .............................................................................................................................. vii
Foreword .......................................................................................................................................ix
Glossary ........................................................................................................................................ x
Executive Summary .....................................................................................................................xi
Report 1 Introduction .................................................................................................................... 1
2 Application of AAD to HUMS TR Data ......................................................................... 3 2.1 HUMS Advanced Anomaly Detection .............................................................................. 3 2.1.1 Data pre-processing and modelling ................................................................................. 3 2.1.2 Generating anomaly alerts and diagnostic information ................................................... 4 2.2 HUMS TR data ................................................................................................................ 5 2.3 Data acquired for the research ........................................................................................ 6 2.3.1 Accident/incident data ..................................................................................................... 6 2.3.2 Database of TR data for model building and maintenance related fault investigation ... 6 2.3.3 Database of TR maintenance data .................................................................................. 7
3 Accident/Incident Data Analysis .................................................................................. 8 3.1 Summary of accident/incident details .............................................................................. 8 3.1.1 Canadian Forces Bell 412 (Griffon), CH146420 ............................................................. 8 3.1.2 Super Puma, 9M-STT ...................................................................................................... 9 3.1.3 Super Puma, G-PUMH .................................................................................................... 9 3.2 Accident/incident AAD results ....................................................................................... 11 3.2.1 Canadian Forces Bell 412 (Griffon), CH146420 ........................................................... 11 3.2.2 Super Puma, 9M-STT .................................................................................................... 26 3.2.3 Super Puma, G-PUMH .................................................................................................. 43
4 Maintenance Data Analysis ........................................................................................ 50 4.1 Bristow IHUMS data ...................................................................................................... 50 4.2 Anomaly models incorporating phase ........................................................................... 61 4.2.1 Clustering of Component Fit lives ................................................................................. 61 4.2.2 Linear tracks and vector differences ............................................................................. 62 4.2.3 Fitness Score values dominated by amplitude values only .......................................... 69 4.3 Anomaly models using different input harmonics .......................................................... 70 4.3.1 Data processing techniques used ................................................................................. 70 4.4 Anomaly models incorporating trend analysis ............................................................... 75 4.4.1 Data processing techniques used ................................................................................. 75 4.4.2 Trend models ................................................................................................................. 77 4.4.3 Trend model summary ................................................................................................. 107 4.5 Combining TR and Gearbox databases ...................................................................... 111 4.6 Further analysis of CF AHUMS™ TR data ................................................................. 116
5 Conclusions and Recommendations ...................................................................... 124 5.1 Conclusions ................................................................................................................. 124 5.2 Recommendations ....................................................................................................... 126
6 References and Acknowledgement ......................................................................... 128
CAA Paper 2012/01 Application of AAD to Tail Rotor HUMS Data
December 2012 Contents Page vi
List of Tables Table 2-1: HUMS Tail Rotor Data ................................................................................................ 6 Table 3-1: Ranked Orders of Significance for Minimum Fitness Score: Univariate Models ..... 23 Table 3-2: Ranked Orders of Significance for Minimum Fitness Score: Multivariate Models ... 25 Table 3-3: Ranked Trend Detection Results for Model Both 1&5T ........................................... 26 Table 3-4: Ranked Orders of Significance for Minimum Fitness Score: EuroHUMS™ Axial
Vibration Models ....................................................................................................... 40 Table 3-5: Ranked Orders of Significance for Minimum Fitness Score: EuroHUMS™ Radial
Vibration Models ....................................................................................................... 41 Table 3-6: Ranked Orders of Significance for Minimum Fitness Score: EuroHUMS™
Combined Axial and Radial Vibration Models .......................................................... 42 Table 3-7: Ranked Trend Detection Results for Model Both 1469T ......................................... 42 Table 3-8: Ranked Orders of Significance for Minimum Fitness Score: IHUMS TGB SO1
Model ........................................................................................................................ 45 Table 3-9: Ranked Trend Detection Results for TGB SO1 Model ............................................. 47 Table 3-10: IHUMS Gearbox SO1 Running Rank Correlation between Absolute Model
Rankings and Trend Model Rankings: Top 20 Aircraft Ranked by Absolute Model 49 Table 4-1: Extract Example of Maintenance Actions Aligned with Acquisitions and
Creation of “Life” Line ............................................................................................... 52 Table 4-2: Maintenance Actions for Identified Features of Aircraft G-TIGE .............................. 56 Table 4-3: Maintenance Actions for Identified features of Aircraft G-TIGF ............................... 58 Table 4-4: Maintenance Actions for Identified Features of Aircraft G-TIGC .............................. 60 Table 4-5: Maintenance Actions Performed after Significant Fitness Score Values ................. 67 Table 4-6: IHUMS Tail Rotor Model Alerts 1T Radial Model ..................................................... 72 Table 4-7: IHUMS Tail Rotor Model Alerts 2T, 3T & 4T Radial Model ...................................... 73 Table 4-8: Alerts and Associated Maintenance Actions 1T Harmonic, Anomaly Model
Derived from Raw Harmonic Amplitudes ................................................................. 81 Table 4-9: Alerts and Associated Maintenance Actions Combined 1T/2T/3T/4T/5T/10T
Harmonics, Anomaly Models Derived from Individual Raw Harmonic Amplitudes .. 83 Table 4-10: Alerts and Associated Maintenance Actions 1T Harmonic, Anomaly Model
Derived from SG Smoothed Harmonic Amplitudes .................................................. 94 Table 4-11: Alerts and Associated Maintenance Actions Combined 1T/2T/3T/4T/5T/10T
Harmonics, Anomaly Models Derived from Individual SG Smoothed Harmonic Amplitudes ................................................................................................................ 95
Table 4-12: Alerts and Associated Maintenance Actions 1T Harmonic, Anomaly Model Derived from Trended Harmonic Amplitudes ......................................................... 103
Table 4-13: Alerts and Associated Maintenance Actions Combined 1T/2T/3T/4T/5T/10T Harmonics, Anomaly Models Derived from Individual Trended Harmonic Amplitudes .............................................................................................................. 104
Table 4-14: Alerts Identified by all Approaches ......................................................................... 109 Table 4-15: Alert and Associated Maintenance Summary Across Models ............................... 110 Table 4-16: Alerts and Associated Maintenance Actions Combined Gearbox and 1T
Harmonic, Anomaly Model Derived from Raw Harmonic Amplitudes .................... 113 Table 4-17: Alerts and Associated Maintenance Actions Combined Gearbox and 1T
Harmonic, Anomaly Model Derived from SG Smoothed Harmonic Amplitudes .... 114 Table 4-18: Alerts and Associated Maintenance Actions Combined Gearbox 1T Harmonic,
Anomaly Model Derived from Trended Harmonic Amplitudes ............................... 115 Table 4-19: Fitness Score Rankings for Axial and Radial CF412 Anomaly Models ................. 117 Table 4-20: Top 20 Running Rank Correlation between Axial and Radial CF412 Anomaly
Models Ordered by Axial Rank: Top 20 ................................................................. 119
CAA Paper 2012/01 Application of AAD to Tail Rotor HUMS Data
December 2012 Contents Page vii
List of Figures Figure 2-1: Advanced Anomaly Detection Process ................................................................. 5 Figure 2-2: Frequency of Maintenance Action Types .............................................................. 7 Figure 3-1: TR Blade Failure .................................................................................................... 8 Figure 3-2: TR Pitch Change Spider ........................................................................................ 9 Figure 3-3: TR Flapping Hinge Retainer ................................................................................ 10 Figure 3-4: CF412 Radial Vib 1T for Aircraft 46420............................................................... 12 Figure 3-5: CF412 Radial Vib 2T for Aircraft 46420............................................................... 13 Figure 3-6: CF412 Radial Vib 3T for Aircraft 46420............................................................... 13 Figure 3-7: CF412 Radial Vib 4T for Aircraft 46420............................................................... 14 Figure 3-8: CF412 Radial Vib 5T for Aircraft 46420............................................................... 14 Figure 3-9: CF412 Radial Vib 6T for Aircraft 46420............................................................... 15 Figure 3-10: CF412 Radial Vib 7T for Aircraft 46420............................................................... 15 Figure 3-11: CF412 Radial Vib 8T for Aircraft 46420............................................................... 16 Figure 3-12: CF412 Radial Vib 9T for Aircraft 46420............................................................... 16 Figure 3-13: CF412 Axial Vib 1T for Aircraft 46420 ................................................................. 17 Figure 3-14: CF412 Axial Vib 2T for Aircraft 46420 ................................................................. 17 Figure 3-15: CF412 Axial Vib 3T for Aircraft 46420 ................................................................. 18 Figure 3-16: CF412 Axial Vib 4T for Aircraft 46420 ................................................................. 18 Figure 3-17: CF412 Axial Vib 5T for Aircraft 46420 ................................................................. 19 Figure 3-18: CF412 Axial Vib 6T for Aircraft 46420 ................................................................. 19 Figure 3-19: CF412 Axial Vib 7T for Aircraft 46420 ................................................................. 20 Figure 3-20: CF412 Axial Vib 8T for Aircraft 46420 ................................................................. 20 Figure 3-21: CF412 Axial Vib 9T for Aircraft 46420 ................................................................. 21 Figure 3-22: CF412 Gearbox SO1 for Aircraft 46420 .............................................................. 21 Figure 3-23: Aircraft 9M-STT: Tail Rotor NORM Axial Signal Averages ................................. 27 Figure 3-24: EuroHUMS™ Radial Vib 1T for Aircraft 9M-STT ................................................ 28 Figure 3-25: EuroHUMS™ Radial Vib 2T for Aircraft 9M-STT ................................................ 28 Figure 3-26: EuroHUMS™ Radial Vib 3T for Aircraft 9M-STT ................................................ 29 Figure 3-27: EuroHUMS™ Radial Vib 4T for Aircraft 9M-STT ................................................ 29 Figure 3-28: EuroHUMS™ Radial Vib 5T for Aircraft 9M-STT ................................................ 30 Figure 3-29: EuroHUMS™ Radial Vib 6T for Aircraft 9M-STT ................................................ 30 Figure 3-30: EuroHUMS™ Radial Vib 7T for Aircraft 9M-STT ................................................ 31 Figure 3-31: EuroHUMS™ Radial Vib 8T for Aircraft 9M-STT ................................................ 31 Figure 3-32: EuroHUMS™ Radial Vib 9T for Aircraft 9M-STT ................................................ 32 Figure 3-33: EuroHUMS™ Axial Vib 1T for Aircraft 9M-STT ................................................... 32 Figure 3-34: EuroHUMS™ Axial Vib 2T for Aircraft 9M-STT ................................................... 33 Figure 3-35: EuroHUMS™ Axial Vib 3T for Aircraft 9M-STT ................................................... 33 Figure 3-36: EuroHUMS™ Axial Vib 4T for Aircraft 9M-STT ................................................... 34 Figure 3-37: EuroHUMS™ Axial Vib 5T for Aircraft 9M-STT ................................................... 34 Figure 3-38: EuroHUMS™ Axial Vib 6T for Aircraft 9M-STT ................................................... 35 Figure 3-39: EuroHUMS™ Axial Vib 7T for Aircraft 9M-STT ................................................... 35 Figure 3-40: EuroHUMS™ Axial Vib 8T for Aircraft 9M-STT ................................................... 36 Figure 3-41: EuroHUMS™ Axial Vib 9T for Aircraft 9M-STT ................................................... 36 Figure 3-42: EuroHUMS™ Gearbox SO1 for Aircraft 9M-STT ................................................ 37 Figure 3-43: EuroHUMS™ Gearbox SO2 for Aircraft 9M-STT ................................................ 37 Figure 3-44: IHUMS Published Gearbox SO1 Output for Aircraft G-PUMH ............................ 43 Figure 3-45: IHUMS Published Composite TR vibration for Aircraft G-PUMH ........................ 44 Figure 3-46: IHUMS Gearbox SO1 for Aircraft G-PUMH ......................................................... 45 Figure 3-47: IHUMS Gearbox SO1 Anomaly Model Fitness Score for Aircraft G-PUMH ....... 45 Figure 3-48: IHUMS Gearbox SO1 Absolute Model Rankings vs. Trend Model Rankings ..... 48 Figure 3-49: IHUMS Gearbox SO1 Running Rank Correlation between Absolute Model
Rankings and Trend Model Rankings ................................................................. 48
CAA Paper 2012/01 Application of AAD to Tail Rotor HUMS Data
December 2012 Contents Page viii
Figure 4-1: Example of Maintenance Action Indicator Line (Life Line) and Corresponding 1T Amplitude for Component Fit 47 ..................................................................... 53 Figure 4-2: Maintenance Actions on G-TIGE 2T IHUMS Cruise Database ........................... 55 Figure 4-3: Maintenance Actions on G-TIGE 3T IHUMS Cruise Database ........................... 55 Figure 4-4: Maintenance Actions on G-TIGE 4T IHUMS Cruise Database ........................... 56 Figure 4-5: Maintenance Actions on G-TIGF 2T IHUMS Cruise Database ........................... 57 Figure 4-6: Maintenance Actions on G-TIGF 3T IHUMS Cruise Database ........................... 57 Figure 4-7: Maintenance Actions on G-TIGF SO1 IHUMS Gearbox Database .................... 58 Figure 4-8: Maintenance Actions on G-TIGC 2T IHUMS Cruise Database .......................... 59 Figure 4-9: Maintenance Actions on G-TIGC 4T IHUMS Cruise Database .......................... 59 Figure 4-10: Maintenance Actions on G-TIGC 5T IHUMS Cruise Database .......................... 60 Figure 4-11: Component Fit 76 1T Amplitude and Phase ....................................................... 61 Figure 4-12: Component Fit 76 1T Amplitude and Phase ....................................................... 61 Figure 4-13: Component Fit 16 and Component Fit 66 1T Amplitude and Phase (Data are
coloured according to their life value) .................................................................. 62 Figure 4-14: Component Fit 41 10T Amplitude ........................................................................ 63 Figure 4-15: Component Fit 41 10T Amplitude and Phase ..................................................... 63 Figure 4-16: Component Fit 41 10T Amplitude and Phase Tracking Acquisitions .................. 64 Figure 4-17: Component Fit 41 10T Amplitude and Phase Tracking Acquisitions Through
Individual Lifetimes .............................................................................................. 64 Figure 4-18: Component Fit 41 10T Differences in Vector Magnitudes .................................. 65 Figure 4-19: Component Fit 41 10T Linear Track Length ........................................................ 66 Figure 4-20: Component Fit 41 1T Differences in Vector Magnitudes .................................... 67 Figure 4-21: Component Fit 41 1T Magnitude of Vector Differences ...................................... 68 Figure 4-22: Component Fit 41 1T Amplitudes ........................................................................ 68 Figure 4-23: Component Fit 41 1T Amplitudes and Phases .................................................... 69 Figure 4-24: Extract of (negative) 1T Amplitudes and Fitness Score Values .......................... 70 Figure 4-25: Trending Component Fit Amplitudes ................................................................... 76 Figure 4-26: Alerts for 1/2/3T Harmonics from Amplitude Anomaly Model ............................. 78 Figure 4-27: Alerts for 4/5/6T Harmonics from Amplitude Anomaly Models ........................... 79 Figure 4-28: Combined Alerts for 1/2/3/4/5/6T Harmonics from Amplitude Anomaly
Models .................................................................................................................. 80 Figure 4-29: Alerts for 1/2/3T Harmonics from SG Smoothed Amplitude Anomaly Model ..... 91 Figure 4-30: Alerts for 4/5/10T Harmonics from SG Smoothed Amplitude Anomaly Model ... 92 Figure 4-31: Combined Alerts for 1/2/3/4/5/6T Harmonics from SG Smoothed Amplitude
Anomaly Models .................................................................................................. 93 Figure 4-32: 1T Harmonic for Component Fit 66 (SG smoothed amplitude result) ................. 93 Figure 4-33: 1T Harmonic for Component Fit 90 (SG smoothed amplitude result) ................. 93 Figure 4-34: Alerts for 1/2/3T Harmonics from Trended Amplitude Anomaly Model ............. 100 Figure 4-35: Alerts for 4/5/10T Harmonics from Trended Amplitude Anomaly Model ........... 101 Figure 4-36: Combined Alerts for 1/2/3/4/5/6T Harmonics from Trended Amplitude
Anomaly Models ................................................................................................ 102 Figure 4-37: Average Axial Model Ranking vs. Average Radial Model Ranking for CF412
Anomaly Models ................................................................................................ 118 Figure 4-38: Running Rank Correlation between Axial and Radial CF412 Anomaly Models
Ordered by Axial Rank ....................................................................................... 118 Figure 4-39: Minimum Fitness Score Values for CF412 Anomaly Models ............................ 120 Figure 4-40: Component Fit 112 1T Harmonic ...................................................................... 120 Figure 4-41: Component Fit 152 2/3/4/5/6T Harmonics ........................................................ 121 Figure 4-42: Component Fit 172 2/3/4/5/6T Harmonics ........................................................ 121 Figure 4-43: Component Fit 332 1T Harmonic ...................................................................... 122 Figure 4-44: Component Fit 442 1T Harmonic ...................................................................... 123 Figure 4-45: Component 442 Fit 2/3/4/5/6T Harmonics ........................................................ 123
CAA Paper 2012/01 Application of AAD to Tail Rotor HUMS Data
December 2012 Contents Page ix
Foreword The research reported in this paper was funded by the Safety Regulation Group of the UK Civil Aviation Authority (CAA) and Oil & Gas UK, and was performed by GE Aviation (GE). The work follows on from the review of the state of the art regarding the extension of HUMS to rotor health monitoring published in CAA Paper 2008/05. The objective of the study reported here was to demonstrate the application of the advanced anomaly detection (AAD) methods successfully developed and applied to HUMS transmission data by GE (see CAA Paper 2011/01) to the rotor system data already routinely collected on in-service helicopters. In view of the findings published in CAA Paper 2008/05, the scope of this work was restricted to tail rotor systems. The CAA accepts the findings of this study, and notes the following points:
1. Using AAD it is possible to detect tail rotor defects in Vibration Health Monitoring (VHM) data, but warnings are unlikely to be much in advance of the end of the flight preceding the ‘failure’ flight. On-board, post-flight indications would therefore be required for such a scheme to be effective.
2. Both axial and radial accelerometer data is required for effective detection of tail rotor
defects.
3. Tail rotor VHM data was found to be particularly susceptible to instrumentation problems. A low noise, high reliability VHM system is required for effective tail rotor health monitoring.
4. Better results might be obtained by:
a. analyzing VHM data captured during unsteady flight conditions; b. measuring vibration data on board the tail rotor rather than in the fuselage.
These concepts could usefully be investigated.
CAA believes applying VHM directly to rotors is a worthwhile area of research, and encourages the development of these systems. The CAA is committed to supporting such programmes where possible and is participating in the AgustaWestland Rotorcraft Technology Validation Programme (RTVP) which contains a significant section on rotor HUMS. Although it will likely not be possible to release the results of this programme into the public domain, given the costs and facilities required for the work that needs to be performed, CAA believes that this represents the best way forward at this time. Safety Regulation Group December 2012
CAA Paper 2012/01 Application of AAD to Tail Rotor HUMS Data
December 2012 Contents Page x
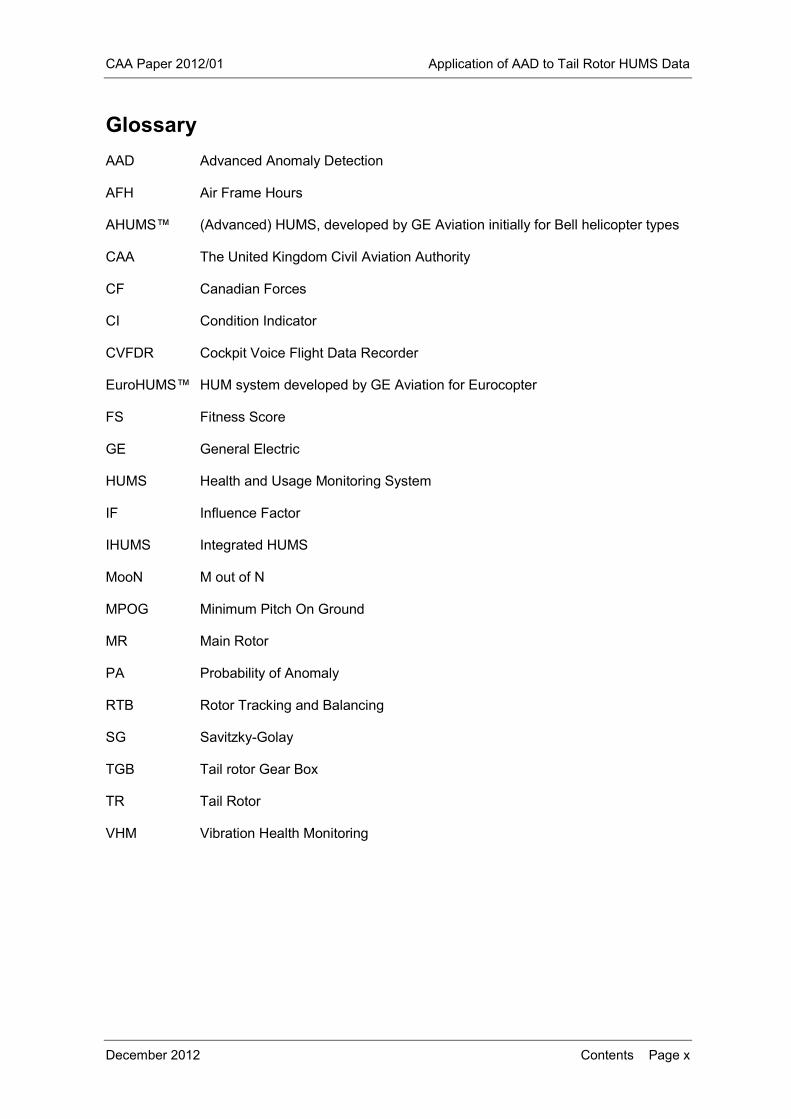
Glossary
AAD Advanced Anomaly Detection
AFH Air Frame Hours
AHUMS™ (Advanced) HUMS, developed by GE Aviation initially for Bell helicopter types
CAA The United Kingdom Civil Aviation Authority
CF Canadian Forces
CI Condition Indicator
CVFDR Cockpit Voice Flight Data Recorder
EuroHUMS™ HUM system developed by GE Aviation for Eurocopter
FS Fitness Score
GE General Electric
HUMS Health and Usage Monitoring System
IF Influence Factor
IHUMS Integrated HUMS
MooN M out of N
MPOG Minimum Pitch On Ground
MR Main Rotor
PA Probability of Anomaly
RTB Rotor Tracking and Balancing
SG Savitzky-Golay
TGB Tail rotor Gear Box
TR Tail Rotor
VHM Vibration Health Monitoring
CAA Paper 2012/01 Application of AAD to Tail Rotor HUMS Data
December 2012 Executive Summary Page xi
Executive Summary
Under an extension to Contract No. 841, GE Aviation conducted a helicopter rotor HUMS study to review the status of rotor health monitoring research, and also accidents caused by rotor system failures (Reference [2]). This study identified two Main Rotor (MR) failure cases and three Tail Rotor (TR) cases for which HUMS data were available. In neither of the MR cases (a MR blade failure and a cracked blade yoke) was there any evidence in the currently acquired HUMS data of fault-induced changes that could have provided warning of the failure. However, in all three TR cases an investigation performed after the incident or accident revealed some fault-related information in the HUMS vibration data. It was therefore concluded that there may be potential to improve airworthiness through the application of new analysis techniques such as Advanced Anomaly Detection (AAD) to HUMS TR vibration data. Under a further extension to Contract No. 841, GE Aviation has applied its AAD technology to HUMS vibration data from three TR-related accidents and incidents, and also a database of historical Bristow 332L IHUMS data, to evaluate the potential airworthiness and maintenance benefits that could be obtained. The analysis consisted of three primary elements; anomaly modelling of single and multiple TR harmonics, merging data from different acquisitions stored in different database tables (e.g. to allow TR axial and radial data to be modelled together), and automated trend analysis. A blade failure occurred on the two bladed TR of a Bell 412 helicopter. Several anomaly models built with different combinations of vibration harmonics responded to the fault. While a univariate model responded to the specific characteristics of this individual fault, fusing multiple TR harmonics in an anomaly model also gave a clear fault indication. A trend detection algorithm also showed that the period immediately prior to the accident could be identified as part of a trend. The results indicated that a TR AAD alert could have been triggered on the flight prior to a refuelling stop that occurred before the final flight. A failure occurred on one of the arms of the pitch change spider on the 5 bladed TR of a Super Puma. Multiple anomaly models were built using axial and radial TR data and all models clearly responded to the failure. In this case, the frequencies could be predicted from knowledge of the failure mode. The trend detection algorithm identified a clear trend on the aircraft immediately prior to the accident. The results show that a TR alert could have been triggered after the first flight of the day of the accident, with the failure occurring on the second flight. The third incident involved a Super Puma with a cracked flapping hinge retainer on one of the 5 TR blades. The available accident data was limited although an anomaly model built using recreated tail rotor gearbox data was able to identify the accident aircraft as anomalous. In this case the existing IHUMS had triggered an alert, but a subsequent maintenance inspection failed to identify the developing flapping hinge retainer crack. The Bristow Super Puma TR ‘maintenance study’ (analysing maintenance-related TR faults) used IHUMS data that was limited to radial measurements only, but included both amplitude and phase. According to the maintenance data, there were repeated occurrences of similar faults, however the TR vibration data showed trends in different TR harmonics, and it was not possible to identify any consistent pattern between the harmonics in the TR vibration data and particular fault types. However instrumentation faults could affect all harmonics. Nevertheless, results showed that the outputs from anomaly models combining amplitude and phase information were primarily dependent on magnitude rather than phase. Therefore it was concluded that using the phase data did not provide any improvement in the ability to detect TR faults. The analysis indicated that multiple TR harmonics can be combined in a single model to provide a general fault detection capability, while a separate 1T model remains useful to identify balance issues.
CAA Paper 2012/01 Application of AAD to Tail Rotor HUMS Data
December 2012 Executive Summary Page xii
Some limited further analysis was performed on the Bell 412 HUMS TR data. Anomaly models were built on processed vibration harmonics from the radial and axial accelerometers. It was concluded from this short anomaly modelling exercise that TR faults appear to be generally more visible in the axial dataset rather than the radial. Cross correlating axial and radial data sets can help to distinguish between instrumentation errors and potential faults. The report makes a number of recommendations. It is recommended that, when implementing an AAD capability for the helicopter rotor drive system, AAD models are also included for the TR. Consideration should be given to the application of appropriate data pre- and post processing techniques to enhance the AAD results. Pre-processing may include the use of techniques to identify data trends and the careful use of smoothing techniques if data is noisy. Post-processing can include anomaly model output trend identification and severity assessment. TR Vibration Health Monitoring (VHM) may provide a late indication of a potential TR hub or blade failure. Therefore, where possible, HUMS data should be downloaded and reviewed between flights. For system upgrades and future systems, consideration should be given to the feasibility of providing on-ground post flight indications of MR and TR vibration monitoring alerts on a Multi-Functional Display in the cockpit. It is recommended that, for TR VHM, the measurement set is standardised where possible. Data should be acquired from both radial and axial accelerometers and should, as a minimum, include measurements at Minimum Pitch on Ground (MPOG) and in normal cruise of all significant harmonics. VHM can provide TR health information, however instrumentation problems can cause a significant number of false alarms. Providing high reliability instrumentation and the elimination of signal noise should be key requirements for the design and installation of accelerometers and wiring harnesses for TR VHM.
Consideration should be given to further research into health monitoring techniques that would be applicable to both the MR and TR. This could include areas such as the investigation of the potential use of vibration data acquired during unsteady flight conditions, and the investigation of the emergent rotating-frame sensing technologies including data transfer from the rotor system to the non-rotating fuselage equipment.
CAA Paper 2012/01 Application of AAD to Tail Rotor HUMS Data
December 2012 Introduction Page 1
Report
1 Introduction
Health and Usage Monitoring Systems (HUMS), incorporating comprehensive rotor drive system Vibration Health Monitoring (VHM), have contributed significantly to improving the safety of rotorcraft operations. However, experience has also shown that, while HUMS has a good success rate in detecting defects, not all defect related trends or changes in HUMS data are adequately detected using current threshold setting methods. Earlier research conducted as part of the CAA’s main rotor gearbox seeded defect test programme demonstrated the potential for improving fault detection performance by applying unsupervised machine learning techniques, such as clustering, to seeded fault test data. Therefore in 2004 the CAA commissioned a further programme of work titled “Intelligent Management of Helicopter Vibration Health Monitoring Data: Application of Advanced Analysis Techniques In-Service” (CAA Contract No. 841). Under this contract GE Aviation developed and trialled an Advanced Anomaly Detection (AAD) system for analysing HUMS rotor drive system VHM Condition Indicators (CIs). The work was carried out in partnership with Bristow Helicopters, analysing IHUMS data from Bristow’s European AS332L fleet. The results are presented in Reference [1]. Under an extension to Contract No. 841, GE Aviation conducted a helicopter rotor HUMS study to review the status of rotor health monitoring research, and also accidents caused by rotor system failures (Reference [2]). This was motivated by the perception that, whilst rotor drive system VHM is a mature technology and an integral part of a helicopter HUMS, the same cannot be said for rotor system health monitoring, despite the fact that the numbers of helicopter accidents caused by rotor failures and drive system failures are comparable. Although rotor vibration is monitored by HUM systems and used for rotor tracking and balancing purposes (RTB), there are currently few recognised techniques for the detection and diagnosis of rotor fault induced vibration. Previous research work conducted in the area was on a largely theoretical, analytical basis, and was considered to have shown some potential, but there was no further development towards a working demonstration or a practical rotor monitoring system. The accident analysis performed for the rotor HUMS study identified two Main Rotor (MR) failure cases and three Tail Rotor (TR) cases for which HUMS data was available. In neither of the MR cases (an S76 main rotor blade failure and a cracked 332L blade yoke) was there any evidence in the currently acquired HUMS data of fault-induced changes that could have provided warning of the failure. Therefore, whilst previous theoretical analysis indicates some potential for providing airworthiness benefits from improved monitoring techniques based on rotor vibration and blade track measurements, it is likely that some MR failures will remain undetectable. In all three TR cases an investigation performed after the incident or accident revealed some fault-related information in the HUMS vibration data. In one case, an increase in 1/rev vibration had triggered a HUMS alert, but this was misdiagnosed, resulting in incorrect maintenance being performed. In the other two cases there were increases in vibration harmonics for which thresholds are not currently set. It was therefore concluded that the greatest potential to improve airworthiness is through the application of AAD to HUMS TR vibration data.
CAA Paper 2012/01 Application of AAD to Tail Rotor HUMS Data
December 2012 Introduction Page 2
Under a further extension to Contract No. 841, GE Aviation was funded to research the application of its AAD technology to in-service HUMS TR vibration data, and evaluate the potential airworthiness and maintenance benefits that could be obtained. The objectives of the work were to: 1 Build anomaly models on HUMS data from three TR-related accidents and
incidents to assess the ability of the models to detect the different TR failure mechanisms causing these incidents and accidents, and the warning times that could be provided.
2 In addition, analyse a database of historical Bristow 332L IHUMS data and
correlate anomaly model outputs with TR faults and maintenance actions recorded in Bristow’s 332L maintenance database to assess the ability of the anomaly models to provide a better indication of faults resulting in TR maintenance actions.
The results of the TR research work are presented in this report. Section 2 describes the application of AAD to HUMS TR data and also describes the data acquired for the research. The results of the accident and incident data analysis are presented in Section 3, and the results of the analysis of faults resulting in maintenance are presented in Section 4. Finally, conclusions and recommendations from the research work are given in Section 5.
CAA Paper 2012/01 Application of AAD to Tail Rotor HUMS Data
December 2012 Report Page 3
2 Application of AAD to HUMS TR data
This section introduces the HUMS AAD capability that was developed for CAA Contract No. 841, together with the TR data that has been analysed in this work.
2.1 HUMS Advanced Anomaly Detection
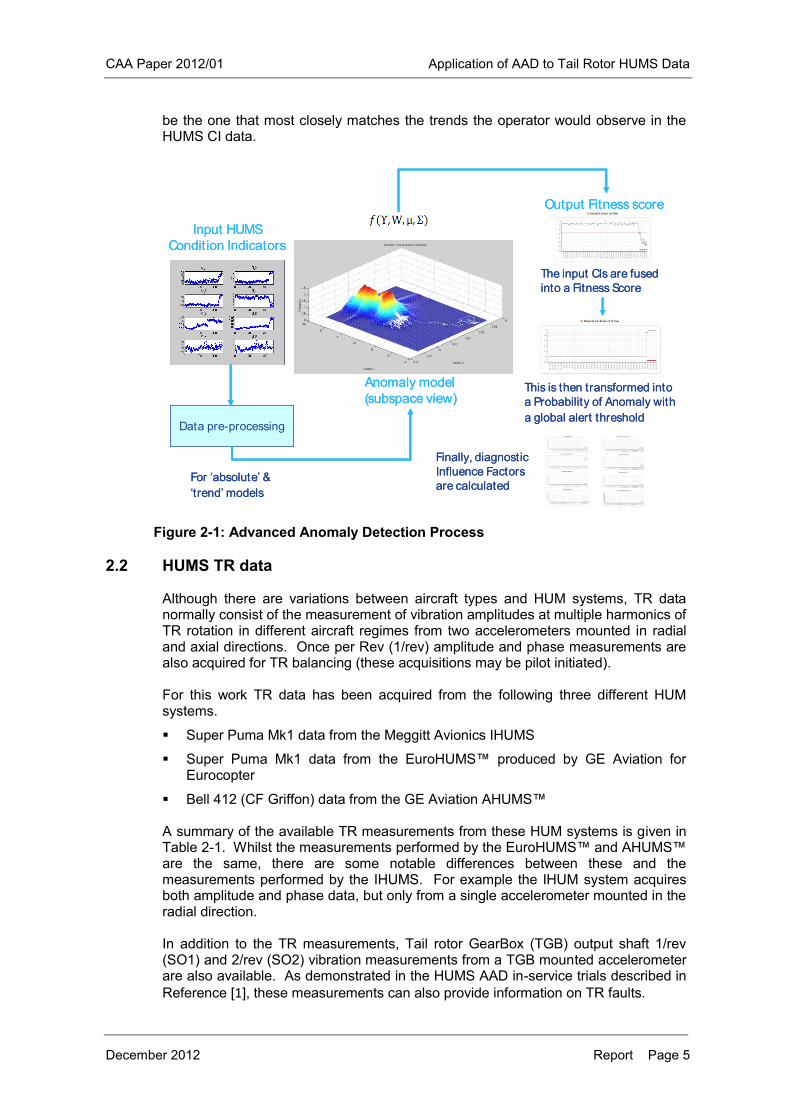
A brief overview is presented here of GE Aviation’s HUMS AAD capability that has been applied to the acquired HUMS TR data. The key elements of the AAD process are illustrated in Figure 2-1. A full description of this process is presented in Reference [1].
2.1.1 Data pre-processing and modelling
Different pre-processing is applied to the input HUMS CI data to enable two types of model to be built for each monitored component (e.g. a gear, shaft or bearing): an ‘absolute’ and a ‘trend’ model. The absolute models identify combined CI values that are anomalous in absolute terms, whereas the trend models identify anomalous combined CI trends, irrespective of the absolute values of the indicators. The pre-processing for the absolute models can vary according to the modelling requirements. In some cases no pre-processing may be applied. For the rotor drive system analysis described in Reference [1] a median filter was applied to remove up to two successive outliers in the time series data. For some of the TR data analysis described in later sections of this report a smoothing algorithm was applied to characterise the underlying behaviour of what could be ‘noisy’ data (i.e. where there may be significant point-to-point variability). For the rotor drive system trend models a ‘moving median difference’ algorithm was applied to extract trend information. Following each new acquisition, the median of the time history was re-calculated and subtracted from the newly acquired value to provide a normalised value. This technique reduced the impact of early post-installation trends, because the normalised value would gradually recover back to the median base line level. Prior to model building, using either available maintenance information or the results of an analysis of step changes in the data, the training data set is divided up into separate ‘Component Fits’. A Component Fit is a combination of a particular assembly (e.g. a gearbox) installed in a particular aircraft for a particular time period. If the assembly is removed for maintenance, then installed in a different aircraft, it is given a different Component Fit ID. Using the pre-processed data for selected combinations of HUMS CIs, anomaly models were constructed for each monitored component. The anomaly models are based on Gaussian Mixture Models (GMMs, which are a type of probabilistic cluster model), and provide detailed density mappings of the data. They are specifically designed for anomaly detection, and are not standard mixture models. The clusters in a model can rotate to represent correlations between CIs. This does not have a large impact on the anomalies detected for the type of data being analysed here, but it does allow more diagnostic information to be derived from the model, such as a de-correlation between CIs. The models are then adapted so that they reject any abnormalities existing in the training data. A carefully designed automatic ‘model adaptation’ process detects regions in the model’s cluster space that are not representative of normal behaviour,
CAA Paper 2012/01 Application of AAD to Tail Rotor HUMS Data
December 2012 Report Page 4
then removes the associated clusters. The adaptation process is complex, but is controlled by a simple tuning parameter. The final model provides a poor fit to samples in the training data that are outliers. A significant amount of effort was expended developing the novel automated model adaptation process, as this is key to the successful building of models using in-service data containing various unknown anomalies. The resulting models are sophisticated statistical representations of the data generated from in-service experience, fusing sets of CIs (i.e. vibration features) to reduce a complex data picture into a single parameter time history called a ‘Fitness Score’ (FS) trace. The FS measures the degree of abnormality in the input data and mirrors the shape of any significant data trends. It represents a ‘goodness of fit’ criterion, indicating how well data fits a model of normality. Therefore the FS has a decreasing trend as data becomes increasingly abnormal. Another novel feature of the modelling process is that this does not require data to be categorised as training, test or validation (which is a common practice in data modelling to ensure that built models will generalise to data not used for training). All data can contribute to a model, and the standard procedure for building a model is to use all available historical data apart from cases that are known a-priori to be anomalous. This also has the advantage that online model updates can be performed as new data are acquired. The ability to update models is important, particularly for a new aircraft type where data is initially limited.
2.1.2 Generating anomaly alerts and diagnostic information
Alert thresholds can be, and sometimes are, set on the anomaly model FS outputs. The disadvantage of this approach is that these thresholds are model-specific, as FS values vary between models. Therefore the FS output can be converted into a ‘Probability of Anomaly’ (PA) value, which is a normalised probability measure that ranges between 0 and 1. For each model there is a PA distribution which is an extreme value distribution. An FS value is passed to the PA distribution and a PA value is returned. Most FS values will return a PA of 0 because most acquisitions will be normal. The PA distribution is built using a model-based prediction of outlying data. The PA values provide a measure that is normalised across models, which allows model outputs to be compared. An alerting threshold can be defined using the PA values, which greatly simplifies the threshold setting process. A default PA threshold is normally applied that is common to all models and components (the FS equivalent of this PA threshold will be different for each model). The default threshold for an individual model, however, can be changed if it is considered that the alert rate is too high or low. Diagnostic information about an anomaly model and its inputs (i.e. HUMS CIs) can be provided by another type of model prediction known as ‘Influence Factors’ (IFs). There are different types of IF, each type producing a different view on a model or input variable. An acquisition will generate a single IF predicted value for each CI used to train a model. IF time histories provide information regarding the influence of HUMS CIs on the fused Fitness Score. These traces are not the same as plots of CIs as they are assessing the contribution of individual CIs to a statistical measure of abnormality. Unlike CIs, IFs are normalised and can be directly compared. Although multiple types of IF are generated for GE Aviation’s internal use, with each type being designed to provide different information about a model or an input feature, normally only one type of IF would be presented to the operator. This would
CAA Paper 2012/01 Application of AAD to Tail Rotor HUMS Data
December 2012 Report Page 5
be the one that most closely matches the trends the operator would observe in the HUMS CI data.
Figure 2-1: Advanced Anomaly Detection Process
2.2 HUMS TR data
Although there are variations between aircraft types and HUM systems, TR data normally consist of the measurement of vibration amplitudes at multiple harmonics of TR rotation in different aircraft regimes from two accelerometers mounted in radial and axial directions. Once per Rev (1/rev) amplitude and phase measurements are also acquired for TR balancing (these acquisitions may be pilot initiated). For this work TR data has been acquired from the following three different HUM systems.
Super Puma Mk1 data from the Meggitt Avionics IHUMS
Super Puma Mk1 data from the EuroHUMS™ produced by GE Aviation for Eurocopter
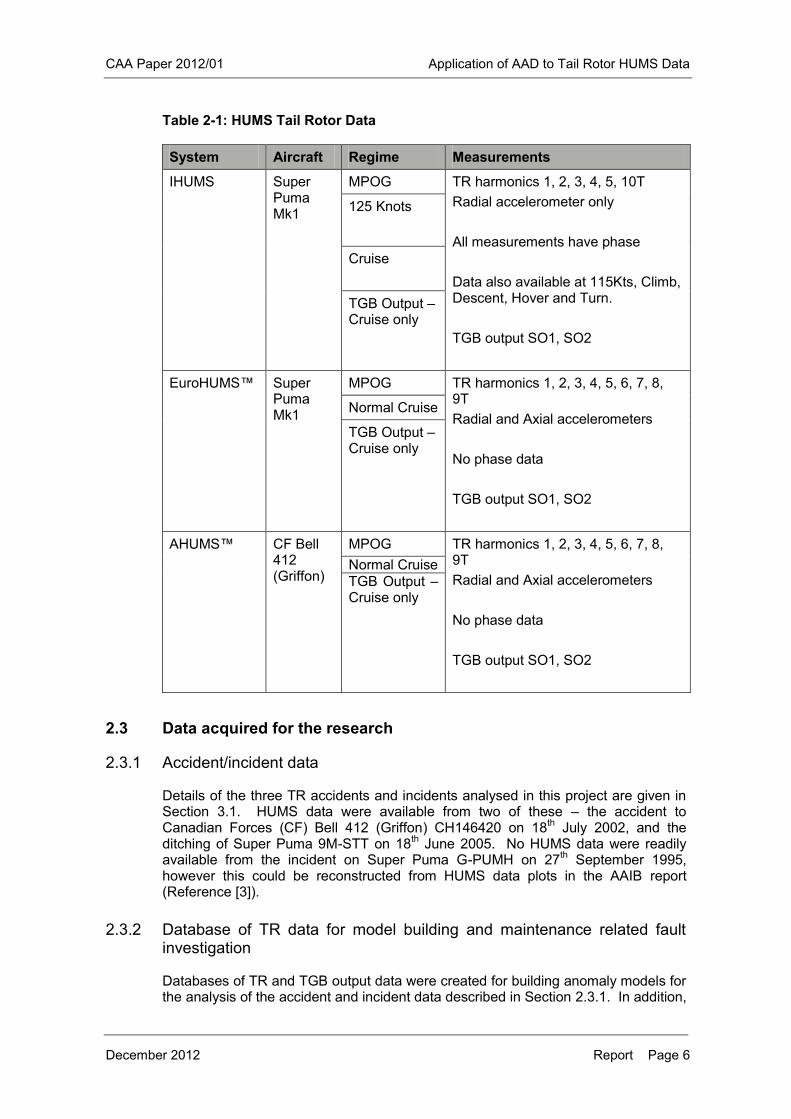
Bell 412 (CF Griffon) data from the GE Aviation AHUMS™ A summary of the available TR measurements from these HUM systems is given in Table 2-1. Whilst the measurements performed by the EuroHUMS™ and AHUMS™ are the same, there are some notable differences between these and the measurements performed by the IHUMS. For example the IHUM system acquires both amplitude and phase data, but only from a single accelerometer mounted in the radial direction. In addition to the TR measurements, Tail rotor GearBox (TGB) output shaft 1/rev (SO1) and 2/rev (SO2) vibration measurements from a TGB mounted accelerometer are also available. As demonstrated in the HUMS AAD in-service trials described in Reference [1], these measurements can also provide information on TR faults.
Input HUMS Condition Indicators
Data pre-processing
Output Fitness score
Anomaly model(subspace view)
The input CIs are fused into a Fitness Score
This is then transformed into a Probability of Anomaly with a global alert threshold
For ‘absolute’ & ‘trend’ models
Finally, diagnostic Influence Factors are calculated
CAA Paper 2012/01 Application of AAD to Tail Rotor HUMS Data
December 2012 Report Page 6
Table 2-1: HUMS Tail Rotor Data
System Aircraft Regime Measurements
IHUMS Super Puma Mk1
MPOG TR harmonics 1, 2, 3, 4, 5, 10T Radial accelerometer only All measurements have phase Data also available at 115Kts, Climb, Descent, Hover and Turn. TGB output SO1, SO2
125 Knots
Cruise
TGB Output – Cruise only
EuroHUMS™ Super Puma Mk1
MPOG TR harmonics 1, 2, 3, 4, 5, 6, 7, 8, 9T Radial and Axial accelerometers No phase data TGB output SO1, SO2
Normal Cruise
TGB Output – Cruise only
AHUMS™ CF Bell 412 (Griffon)
MPOG TR harmonics 1, 2, 3, 4, 5, 6, 7, 8, 9T Radial and Axial accelerometers No phase data TGB output SO1, SO2
Normal Cruise TGB Output – Cruise only
2.3 Data acquired for the research
2.3.1 Accident/incident data
Details of the three TR accidents and incidents analysed in this project are given in Section 3.1. HUMS data were available from two of these – the accident to Canadian Forces (CF) Bell 412 (Griffon) CH146420 on 18th July 2002, and the ditching of Super Puma 9M-STT on 18th June 2005. No HUMS data were readily available from the incident on Super Puma G-PUMH on 27th September 1995, however this could be reconstructed from HUMS data plots in the AAIB report (Reference [3]).
2.3.2 Database of TR data for model building and maintenance related fault investigation
Databases of TR and TGB output data were created for building anomaly models for the analysis of the accident and incident data described in Section 2.3.1. In addition,
CAA Paper 2012/01 Application of AAD to Tail Rotor HUMS Data
December 2012 Report Page 7
the database of Bristow Super Puma IHUMS data were also used to investigate TR faults causing maintenance actions. The CF Bell 412 (Griffon) AHUMS™ database contained data from 51 aircraft in the period of June 2006 to December 2007. The Super Puma EuroHUMS™ database contained data from 25 aircraft, covering a range of dates. The Bristow Super Puma IHUMS database contained data from 20 aircraft, starting between August 2005 and September 2006, and including data up to the end of December 2008.
2.3.3 Database of TR maintenance data
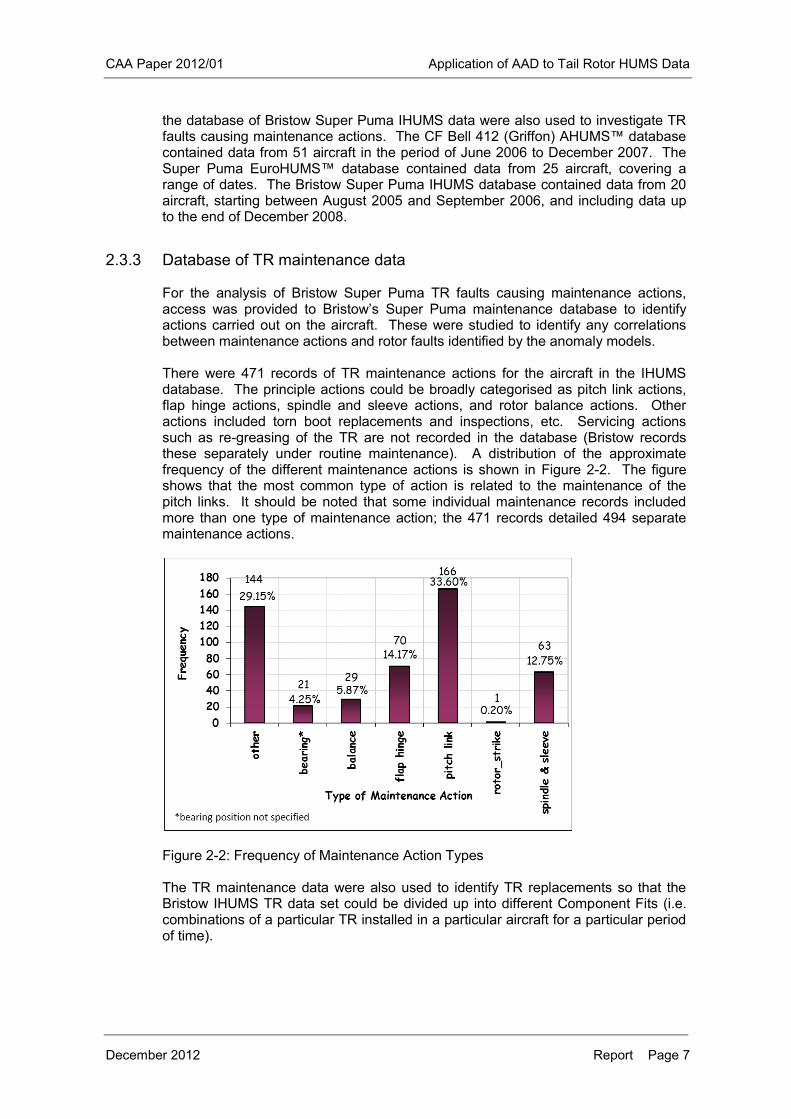
For the analysis of Bristow Super Puma TR faults causing maintenance actions, access was provided to Bristow’s Super Puma maintenance database to identify actions carried out on the aircraft. These were studied to identify any correlations between maintenance actions and rotor faults identified by the anomaly models. There were 471 records of TR maintenance actions for the aircraft in the IHUMS database. The principle actions could be broadly categorised as pitch link actions, flap hinge actions, spindle and sleeve actions, and rotor balance actions. Other actions included torn boot replacements and inspections, etc. Servicing actions such as re-greasing of the TR are not recorded in the database (Bristow records these separately under routine maintenance). A distribution of the approximate frequency of the different maintenance actions is shown in Figure 2-2. The figure shows that the most common type of action is related to the maintenance of the pitch links. It should be noted that some individual maintenance records included more than one type of maintenance action; the 471 records detailed 494 separate maintenance actions.
Figure 2-2: Frequency of Maintenance Action Types The TR maintenance data were also used to identify TR replacements so that the Bristow IHUMS TR data set could be divided up into different Component Fits (i.e. combinations of a particular TR installed in a particular aircraft for a particular period of time).
CAA Paper 2012/01 Application of AAD to Tail Rotor HUMS Data
December 2012 Report Page 8
3 Accident/Incident Data Analysis
3.1 Summary of accident/incident details
3.1.1 Canadian Forces Bell 412 (Griffon), CH146420
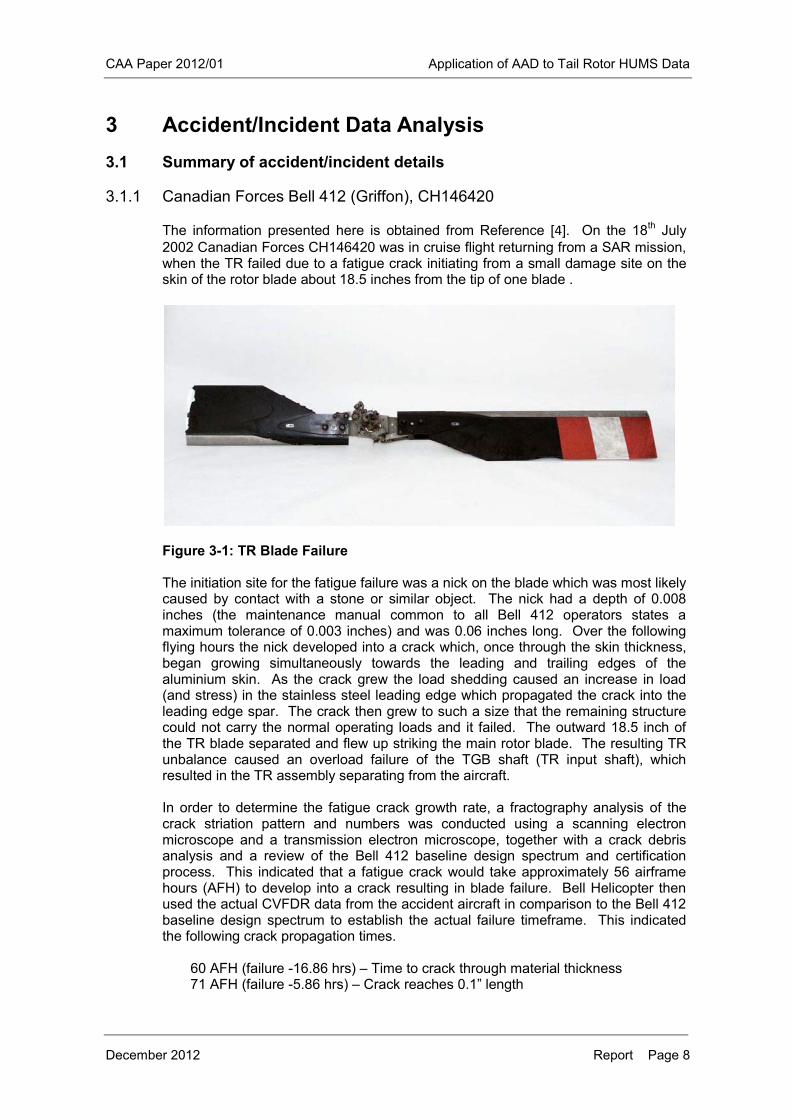
The information presented here is obtained from Reference [4]. On the 18th July 2002 Canadian Forces CH146420 was in cruise flight returning from a SAR mission, when the TR failed due to a fatigue crack initiating from a small damage site on the skin of the rotor blade about 18.5 inches from the tip of one blade .
Figure 3-1: TR Blade Failure
The initiation site for the fatigue failure was a nick on the blade which was most likely caused by contact with a stone or similar object. The nick had a depth of 0.008 inches (the maintenance manual common to all Bell 412 operators states a maximum tolerance of 0.003 inches) and was 0.06 inches long. Over the following flying hours the nick developed into a crack which, once through the skin thickness, began growing simultaneously towards the leading and trailing edges of the aluminium skin. As the crack grew the load shedding caused an increase in load (and stress) in the stainless steel leading edge which propagated the crack into the leading edge spar. The crack then grew to such a size that the remaining structure could not carry the normal operating loads and it failed. The outward 18.5 inch of the TR blade separated and flew up striking the main rotor blade. The resulting TR unbalance caused an overload failure of the TGB shaft (TR input shaft), which resulted in the TR assembly separating from the aircraft. In order to determine the fatigue crack growth rate, a fractography analysis of the crack striation pattern and numbers was conducted using a scanning electron microscope and a transmission electron microscope, together with a crack debris analysis and a review of the Bell 412 baseline design spectrum and certification process. This indicated that a fatigue crack would take approximately 56 airframe hours (AFH) to develop into a crack resulting in blade failure. Bell Helicopter then used the actual CVFDR data from the accident aircraft in comparison to the Bell 412 baseline design spectrum to establish the actual failure timeframe. This indicated the following crack propagation times.
60 AFH (failure -16.86 hrs) – Time to crack through material thickness 71 AFH (failure -5.86 hrs) – Crack reaches 0.1” length
CAA Paper 2012/01 Application of AAD to Tail Rotor HUMS Data
December 2012 Report Page 9
74.5 AFH (failure -2.36 hrs) - Crack reaches 0.25” length 75.3 AFH (failure -1.56 hrs) – Crack reaches Critical Length of 4.14” 76.86 AFH – Complete Blade Failure
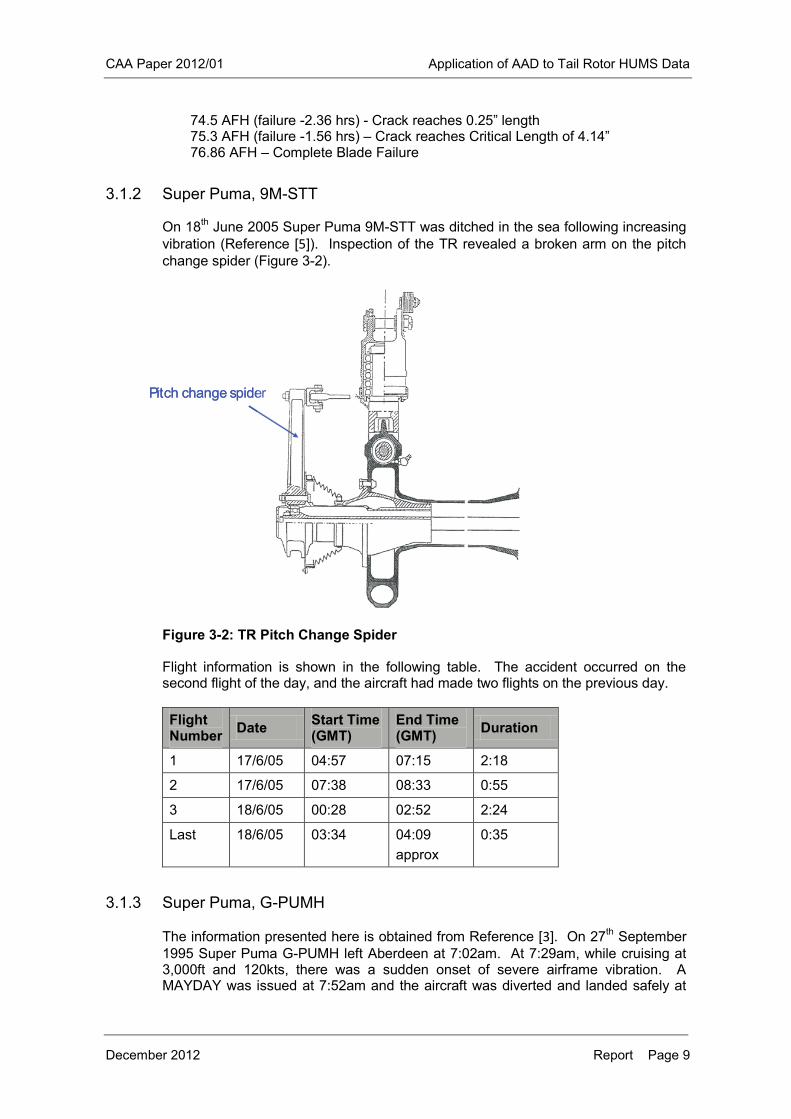
3.1.2 Super Puma, 9M-STT
On 18th June 2005 Super Puma 9M-STT was ditched in the sea following increasing vibration (Reference [5]). Inspection of the TR revealed a broken arm on the pitch change spider (Figure 3-2).
Figure 3-2: TR Pitch Change Spider
Flight information is shown in the following table. The accident occurred on the second flight of the day, and the aircraft had made two flights on the previous day. Flight Number Date Start Time
(GMT) End Time (GMT) Duration
1 17/6/05 04:57 07:15 2:18
2 17/6/05 07:38 08:33 0:55
3 18/6/05 00:28 02:52 2:24
Last 18/6/05 03:34 04:09 approx
0:35
3.1.3 Super Puma, G-PUMH
The information presented here is obtained from Reference [3]. On 27th September 1995 Super Puma G-PUMH left Aberdeen at 7:02am. At 7:29am, while cruising at 3,000ft and 120kts, there was a sudden onset of severe airframe vibration. A MAYDAY was issued at 7:52am and the aircraft was diverted and landed safely at
Pitch change spiderPitch change spider
CAA Paper 2012/01 Application of AAD to Tail Rotor HUMS Data
December 2012 Report Page 10
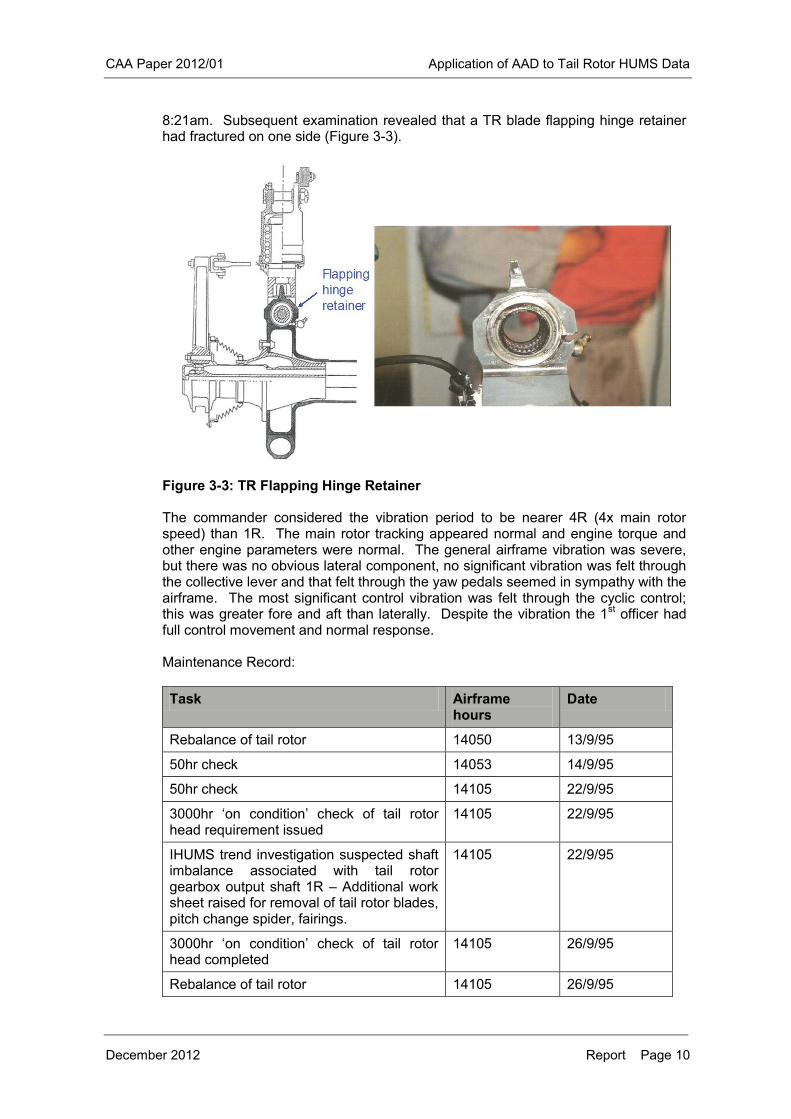
8:21am. Subsequent examination revealed that a TR blade flapping hinge retainer had fractured on one side (Figure 3-3).
Figure 3-3: TR Flapping Hinge Retainer
The commander considered the vibration period to be nearer 4R (4x main rotor speed) than 1R. The main rotor tracking appeared normal and engine torque and other engine parameters were normal. The general airframe vibration was severe, but there was no obvious lateral component, no significant vibration was felt through the collective lever and that felt through the yaw pedals seemed in sympathy with the airframe. The most significant control vibration was felt through the cyclic control; this was greater fore and aft than laterally. Despite the vibration the 1st officer had full control movement and normal response. Maintenance Record: Task Airframe
hours Date
Rebalance of tail rotor 14050 13/9/95
50hr check 14053 14/9/95
50hr check 14105 22/9/95
3000hr ‘on condition’ check of tail rotor head requirement issued
14105 22/9/95
IHUMS trend investigation suspected shaft imbalance associated with tail rotor gearbox output shaft 1R – Additional work sheet raised for removal of tail rotor blades, pitch change spider, fairings.
14105 22/9/95
3000hr ‘on condition’ check of tail rotor head completed
14105 26/9/95
Rebalance of tail rotor 14105 26/9/95
CAA Paper 2012/01 Application of AAD to Tail Rotor HUMS Data
December 2012 Report Page 11
During the 50 flying hours before the incident, some vibration in the vertical plane of the TR was recorded by the IHUM system; it did not exceed the alert threshold until 22/9/95. Only 25 minutes was logged between 22nd and 26th Sept. The IHUMS indications were attributed by the engineer involved to slight ‘free play’ in the TR gearbox shaft bearings. The vibration was temporarily resolved by rebalancing. Final separation of the fracture face and the onset of severe vibration occurred about 27 minutes into the incident flight. After the incident the TGB was examined and it was observed that the flapping hinge retainer at the blue blade position had fractured on one side in the plane of the greasing point, and had opened up under centrifugal loads by approximately 6-7mm. The surfaces of the fracture showed some corrosion and markings typical of fatigue progression. Evidence of rotation of the bushes in the bore indicated that the flapping moments had not been eliminated by the flap bearing; the only way for this to happen was if the flap bearing became stiff. The unresolved flapping moments would have induced stresses in the flapping hinge retainer, which the shaft was unable to withstand. The crack had clear evidence of growth by fatigue over most of its length from an origin close to one end, on the inside face of the bore. There was corrosion pitting that was about 7-10 microns in depth in the region of the origin, 7mm from one end. The total crack length was 67mm, having propagated in a slow stable manner in both directions from the origin. The remaining material had failed in a ductile rupture mode. When the crack extended to the external surface and reached 50mm in length it would have started to open up significantly under centrifugal loads, causing the observed increased vibration on IHUMS. With the aircraft shut down and centrifugal loads removed the crack closed up again. Crack length was estimated at 54mm at the time the IHUMS data began to show a divergent trend. The IHUMS triggered an alert 5 flight hours before the incident. At the last rebalancing the effect of the undetected crack was eliminated by increasing the weights on the opposite blades. During the incident flight the crack progressed to a length where the remaining material fractured, causing severe vibration.
3.2 Accident/incident AAD results
3.2.1 Canadian Forces Bell 412 (Griffon), CH146420
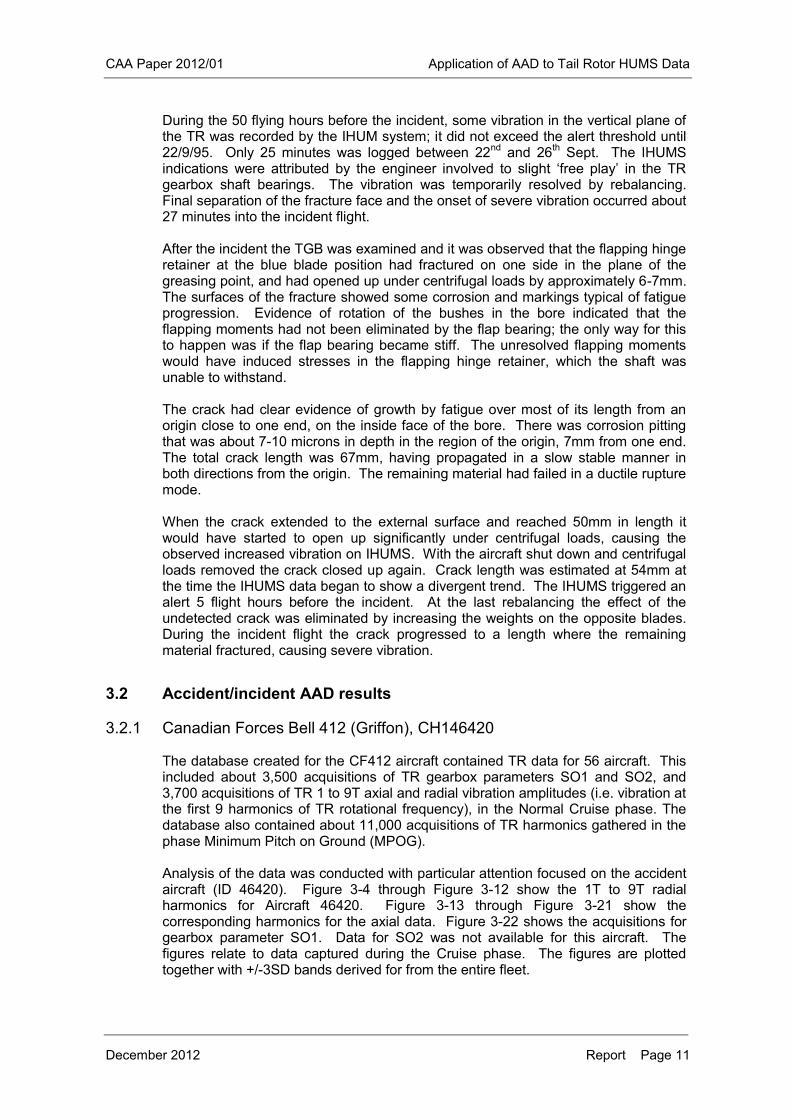
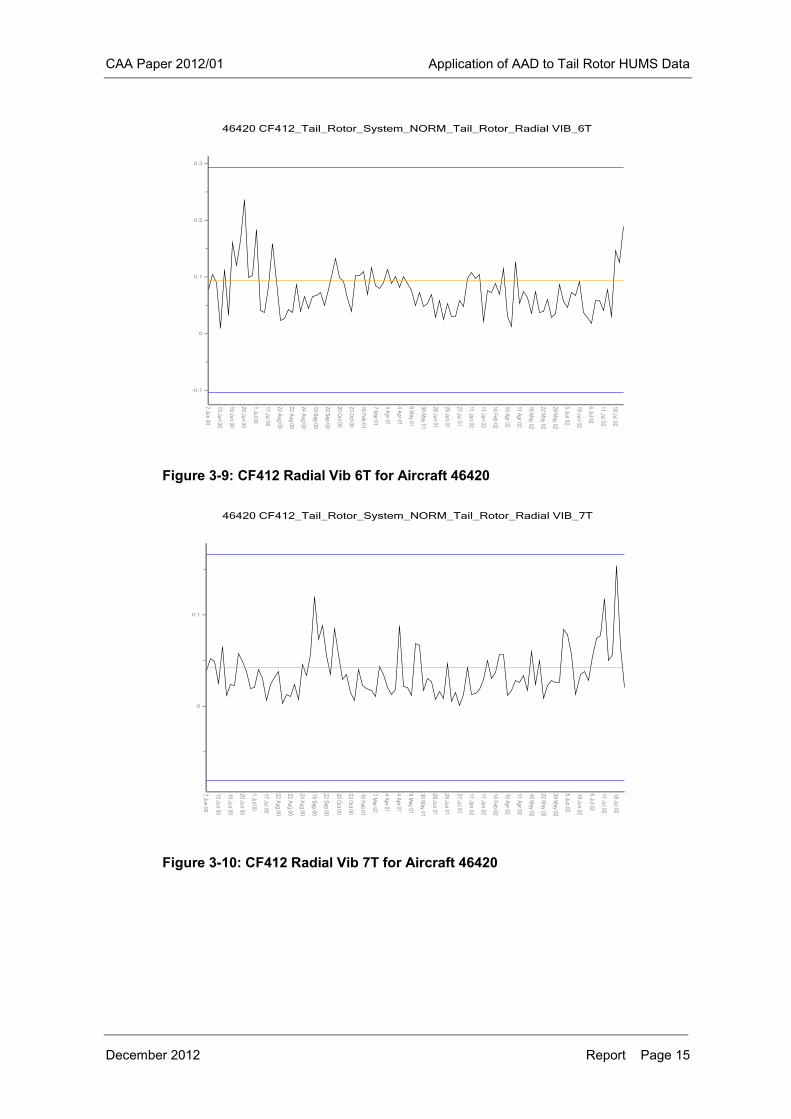
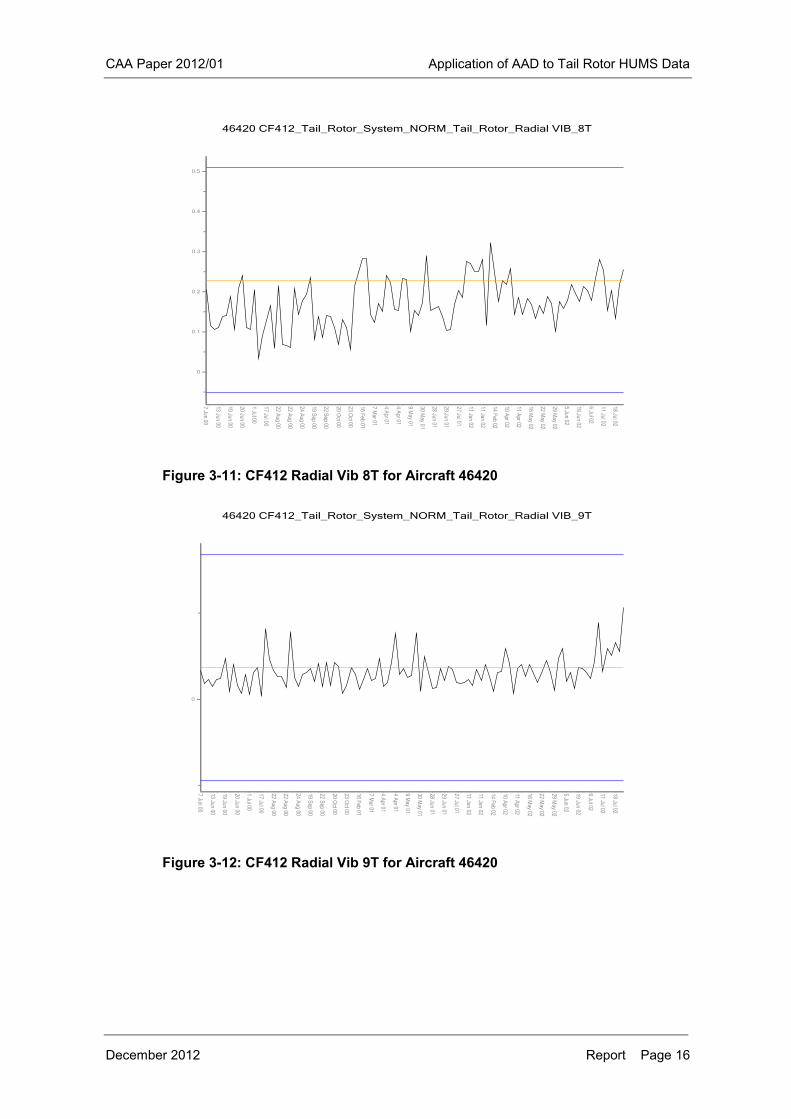
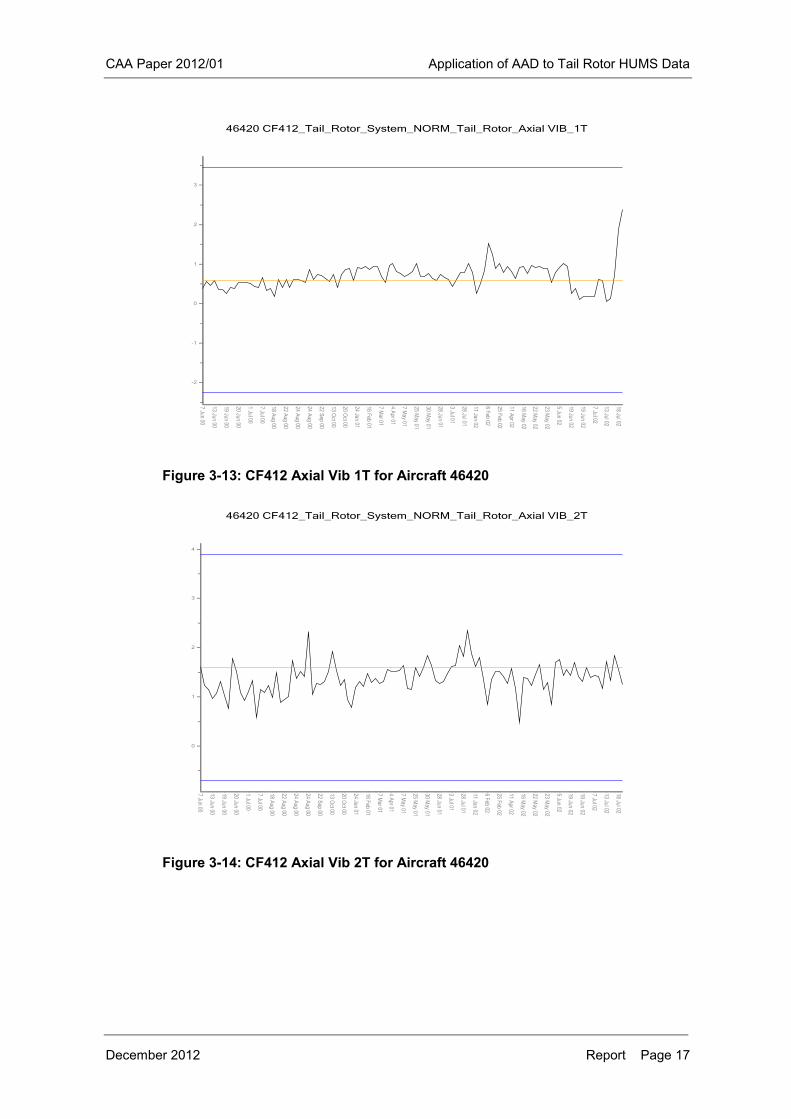
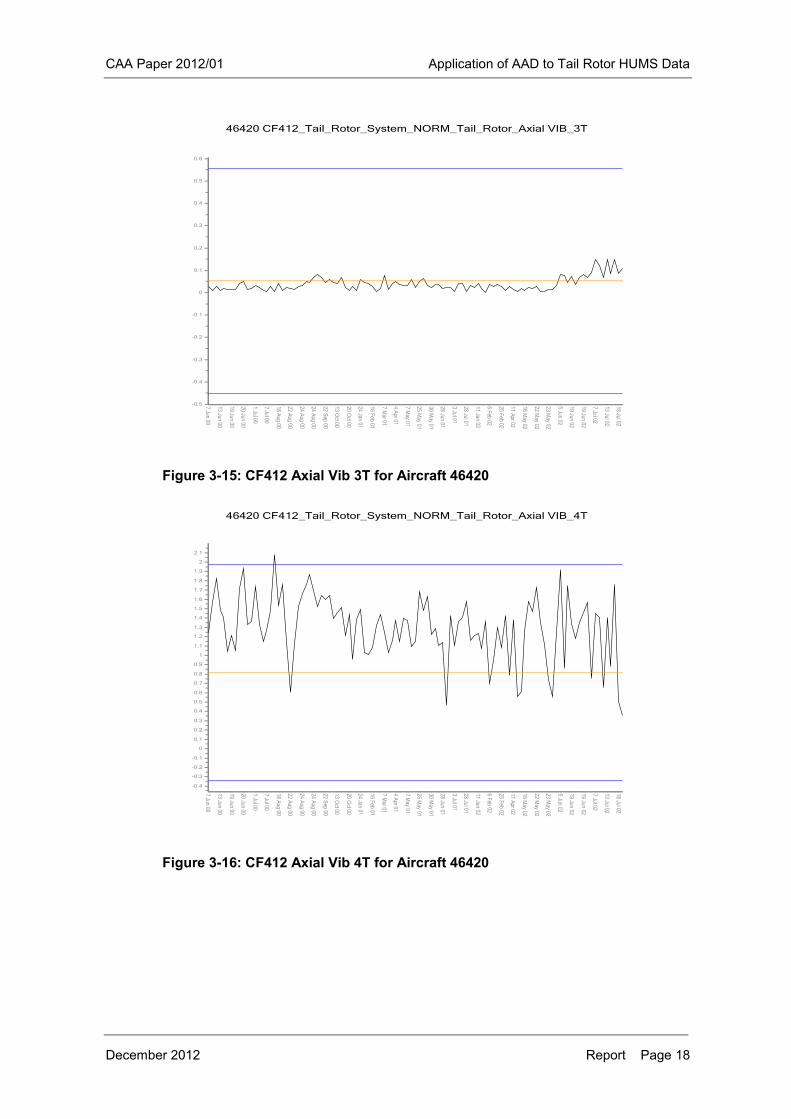
The database created for the CF412 aircraft contained TR data for 56 aircraft. This included about 3,500 acquisitions of TR gearbox parameters SO1 and SO2, and 3,700 acquisitions of TR 1 to 9T axial and radial vibration amplitudes (i.e. vibration at the first 9 harmonics of TR rotational frequency), in the Normal Cruise phase. The database also contained about 11,000 acquisitions of TR harmonics gathered in the phase Minimum Pitch on Ground (MPOG). Analysis of the data was conducted with particular attention focused on the accident aircraft (ID 46420). Figure 3-4 through Figure 3-12 show the 1T to 9T radial harmonics for Aircraft 46420. Figure 3-13 through Figure 3-21 show the corresponding harmonics for the axial data. Figure 3-22 shows the acquisitions for gearbox parameter SO1. Data for SO2 was not available for this aircraft. The figures relate to data captured during the Cruise phase. The figures are plotted together with +/-3SD bands derived for from the entire fleet.
CAA Paper 2012/01 Application of AAD to Tail Rotor HUMS Data
December 2012 Report Page 12
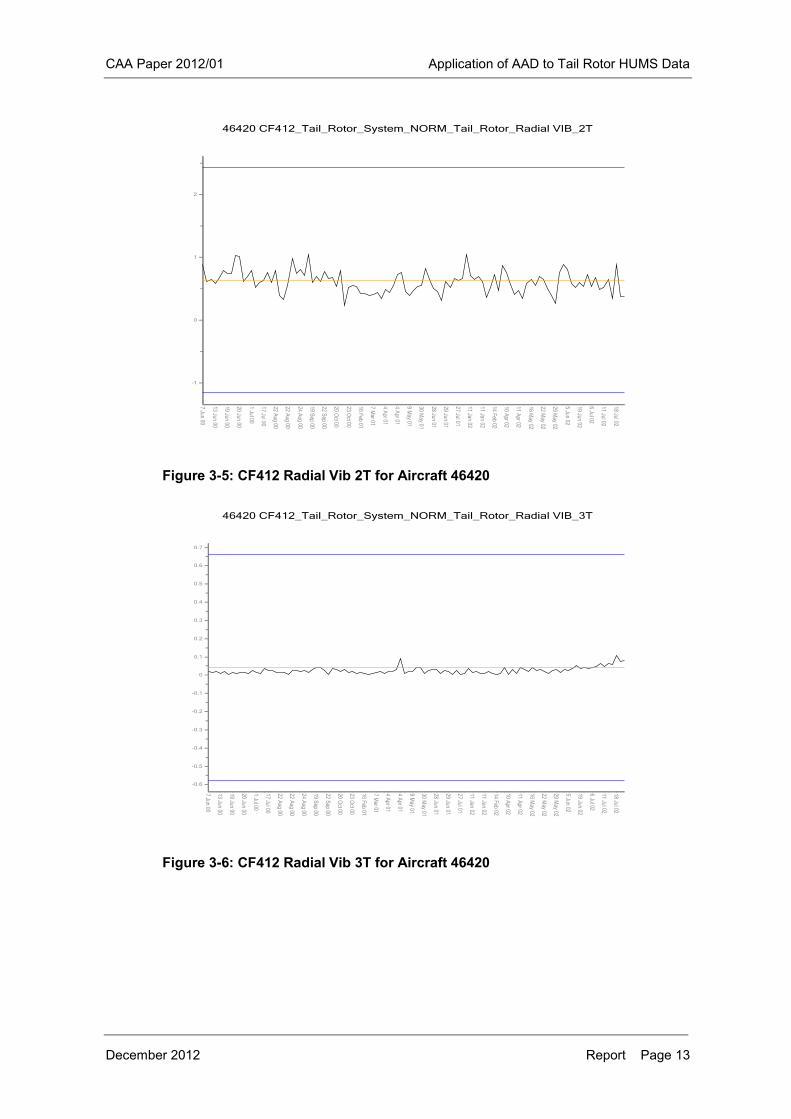
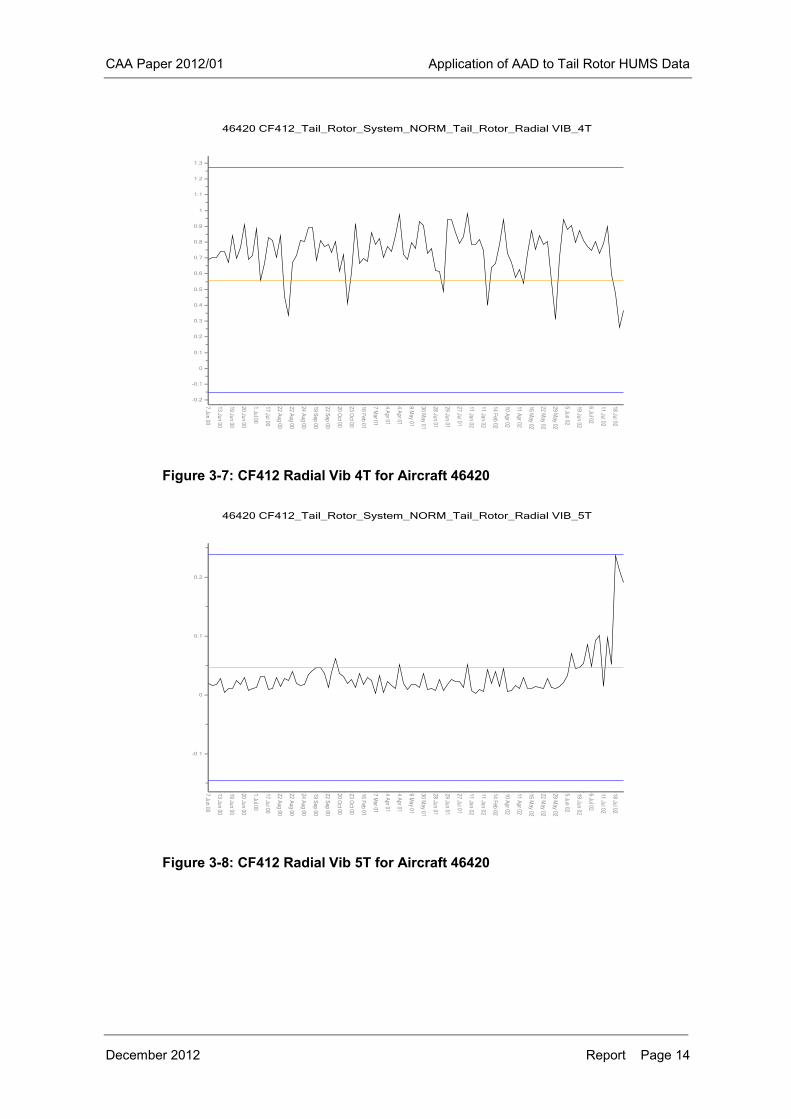
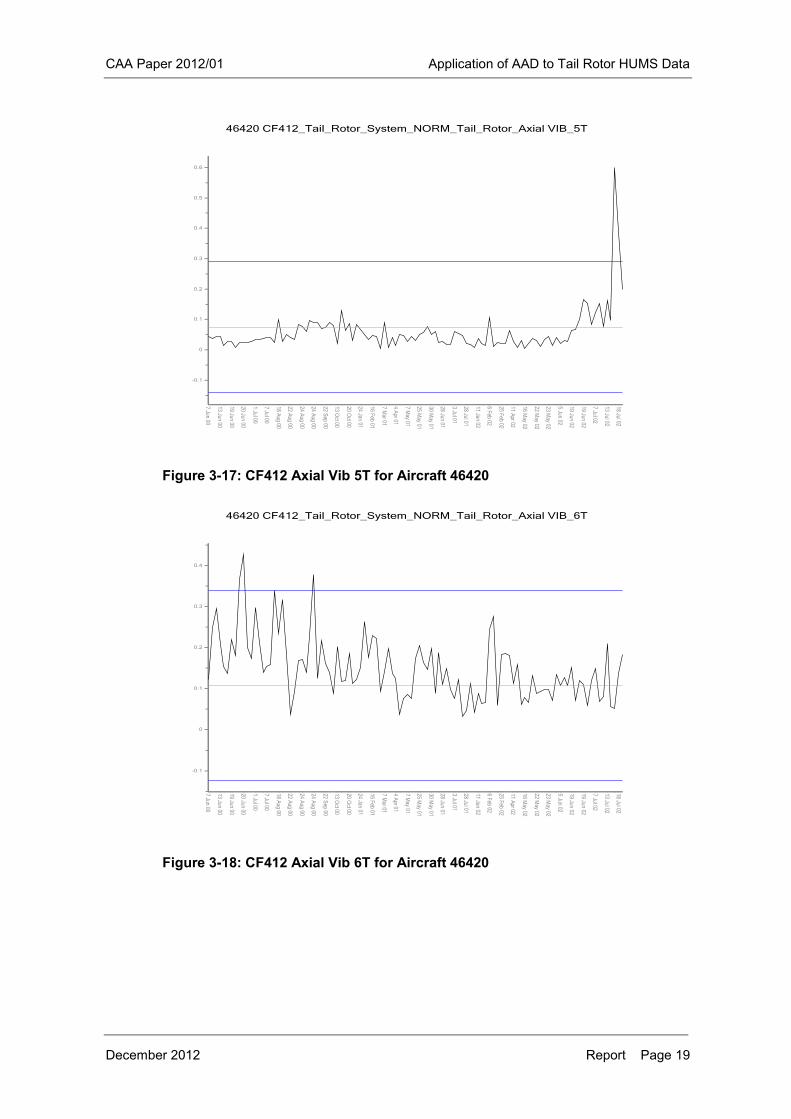
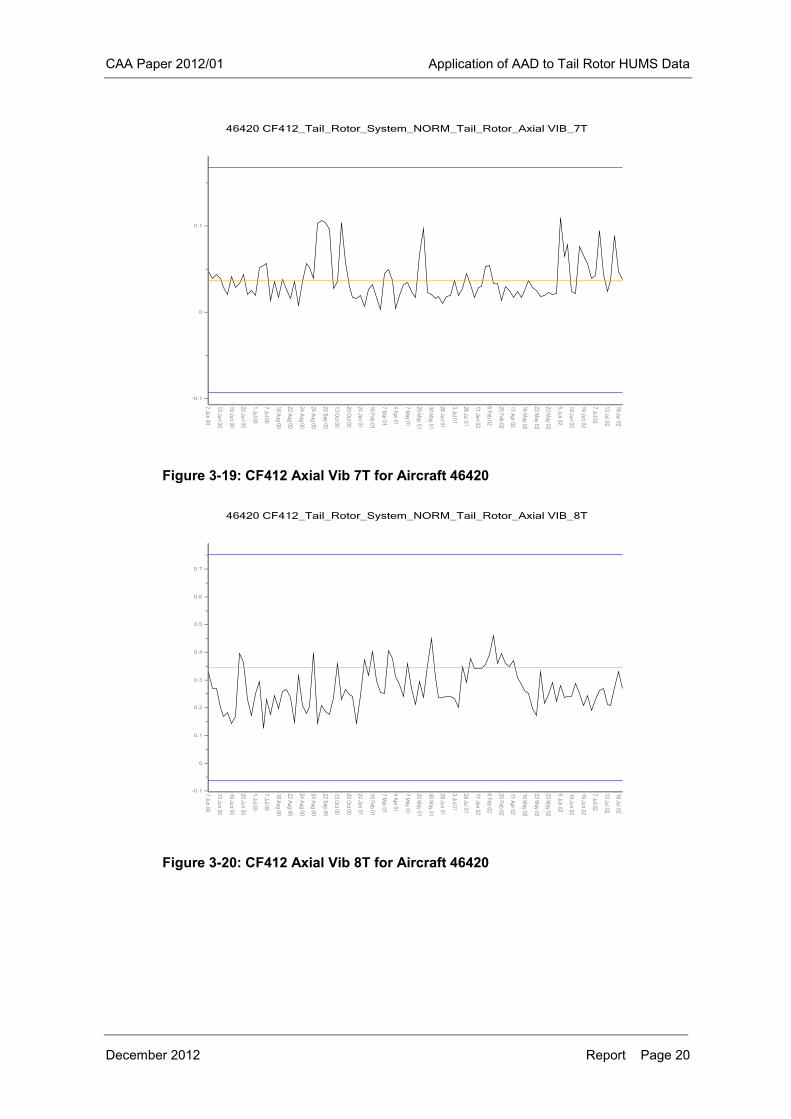
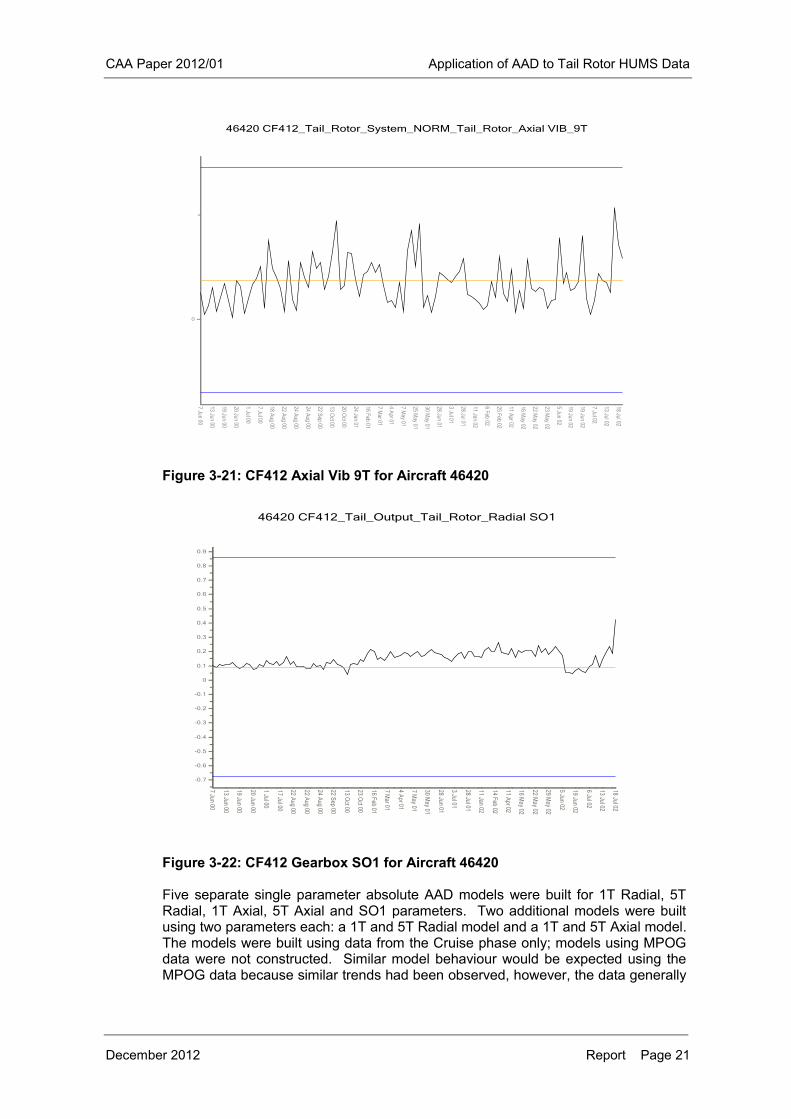
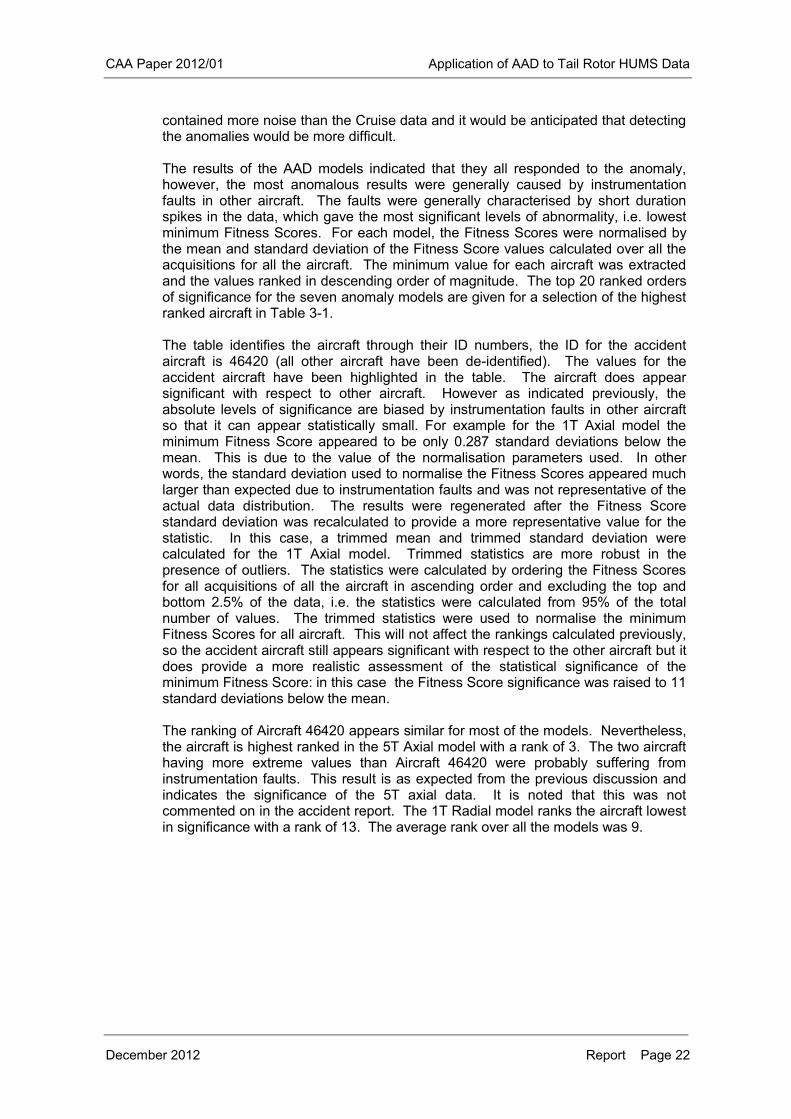
The clearest failure related trends were in the 1T and 5T axial and radial vibration together with the gearbox SO1 measurements. Trends were observed in both the Cruise phase and the MPOG phase. Figure 3-22 shows a trend in the SO1 values starting on 19th June just prior to the accident. Figure 3-4 shows a step change in the 1T radial data on 23rd October 2000. Since the next acquisition is not until 24th January 2001 it may be that maintenance actions were performed during this time. The amplitude values then remain fairly constant but at an elevated level until the 5th June; the values are at the high end of the envelope of acquisitions for this parameter (although the 3SD lines have been distorted by the presence of spikes in other aircraft acquisitions). Another step change is then also observed on the 19th June and therefore may indicate further maintenance actions. However, from about the 6th July the amplitude of the harmonic is seen to start trending up. An initial peak is reached on the 7th July before falling back but then the trend continues over the next six acquisitions until the 18th July. Similar behaviour is observed in the 1T axial data, although the step change on the 23rd October is not clear (Figure 3-13). Nevertheless, the amplitude values are higher in the period February to June than the preceding period. The step change on the 19th June is clear and whilst a peak is again observed on the 7th July the value is not significant. The continuing trend up to the 18th July is more significant in the axial data than the radial data. This would be expected as the radial measurements can be affected by both TR unbalance and component faults, whereas axial measurements are in the axis of the thrust generated loadings and could exercise faults. The most significant trends are observed in the 5th harmonic. Figure 3-8 shows the 5T radial measurements where a trend is seen to begin around the 29th May and generally increases until the end of the acquisition period. A significant jump in values is seen on the 18th July where values reach three standard deviations above the mean. Again, similar behaviour is observed in the axial measurements but with the trend appearing significantly stronger (Figure 3-17). It would be expected that increased vibration would be observed in the 1T data as a result of deflection of the blade. However, the 5T trend could not be predicted and is believed to be due to excitation of a blade bending mode, as the frequencies of the blade modes would decrease as the crack developed.
Figure 3-4: CF412 Radial Vib 1T for Aircraft 46420
CAA Paper 2012/01 Application of AAD to Tail Rotor HUMS Data
December 2012 Report Page 13
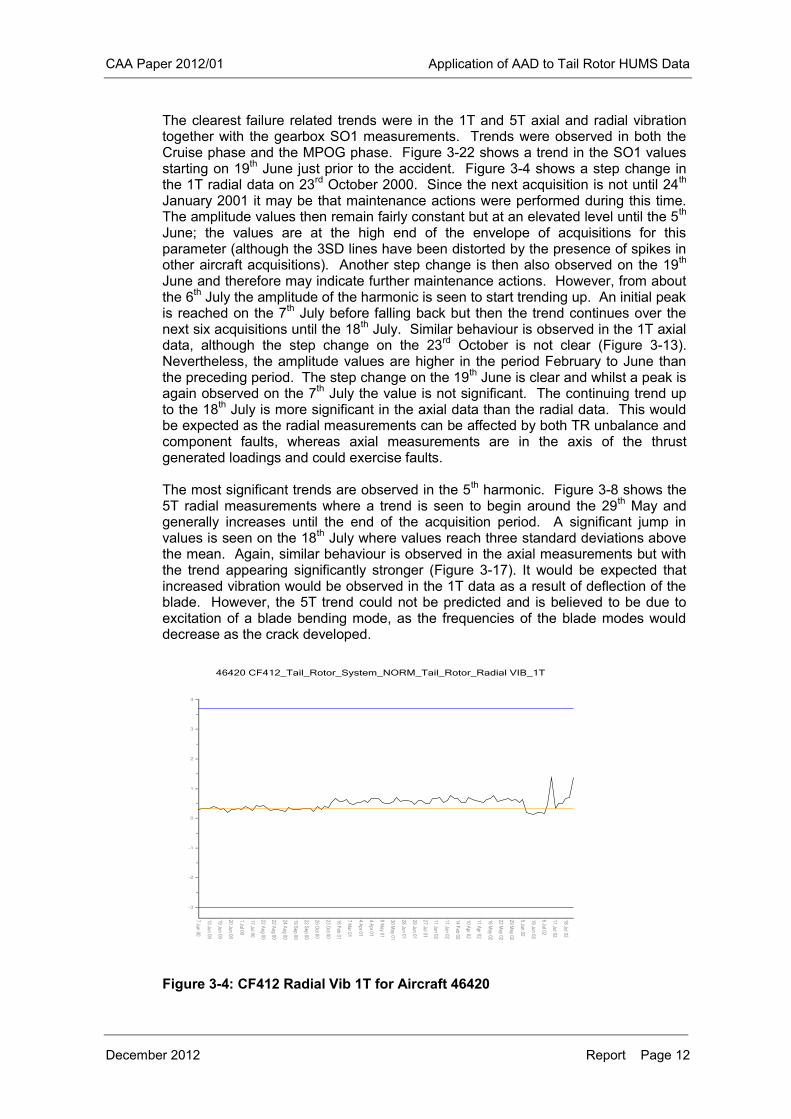
Figure 3-5: CF412 Radial Vib 2T for Aircraft 46420
Figure 3-6: CF412 Radial Vib 3T for Aircraft 46420
CAA Paper 2012/01 Application of AAD to Tail Rotor HUMS Data
December 2012 Report Page 14
Figure 3-7: CF412 Radial Vib 4T for Aircraft 46420
Figure 3-8: CF412 Radial Vib 5T for Aircraft 46420
CAA Paper 2012/01 Application of AAD to Tail Rotor HUMS Data
December 2012 Report Page 15
Figure 3-9: CF412 Radial Vib 6T for Aircraft 46420
Figure 3-10: CF412 Radial Vib 7T for Aircraft 46420
CAA Paper 2012/01 Application of AAD to Tail Rotor HUMS Data
December 2012 Report Page 16
Figure 3-11: CF412 Radial Vib 8T for Aircraft 46420
Figure 3-12: CF412 Radial Vib 9T for Aircraft 46420
CAA Paper 2012/01 Application of AAD to Tail Rotor HUMS Data
December 2012 Report Page 17
Figure 3-13: CF412 Axial Vib 1T for Aircraft 46420
Figure 3-14: CF412 Axial Vib 2T for Aircraft 46420
CAA Paper 2012/01 Application of AAD to Tail Rotor HUMS Data
December 2012 Report Page 18
Figure 3-15: CF412 Axial Vib 3T for Aircraft 46420
Figure 3-16: CF412 Axial Vib 4T for Aircraft 46420
CAA Paper 2012/01 Application of AAD to Tail Rotor HUMS Data
December 2012 Report Page 19
Figure 3-17: CF412 Axial Vib 5T for Aircraft 46420
Figure 3-18: CF412 Axial Vib 6T for Aircraft 46420
CAA Paper 2012/01 Application of AAD to Tail Rotor HUMS Data
December 2012 Report Page 20
Figure 3-19: CF412 Axial Vib 7T for Aircraft 46420
Figure 3-20: CF412 Axial Vib 8T for Aircraft 46420
CAA Paper 2012/01 Application of AAD to Tail Rotor HUMS Data
December 2012 Report Page 21
Figure 3-21: CF412 Axial Vib 9T for Aircraft 46420
Figure 3-22: CF412 Gearbox SO1 for Aircraft 46420
Five separate single parameter absolute AAD models were built for 1T Radial, 5T Radial, 1T Axial, 5T Axial and SO1 parameters. Two additional models were built using two parameters each: a 1T and 5T Radial model and a 1T and 5T Axial model. The models were built using data from the Cruise phase only; models using MPOG data were not constructed. Similar model behaviour would be expected using the MPOG data because similar trends had been observed, however, the data generally
CAA Paper 2012/01 Application of AAD to Tail Rotor HUMS Data
December 2012 Report Page 22
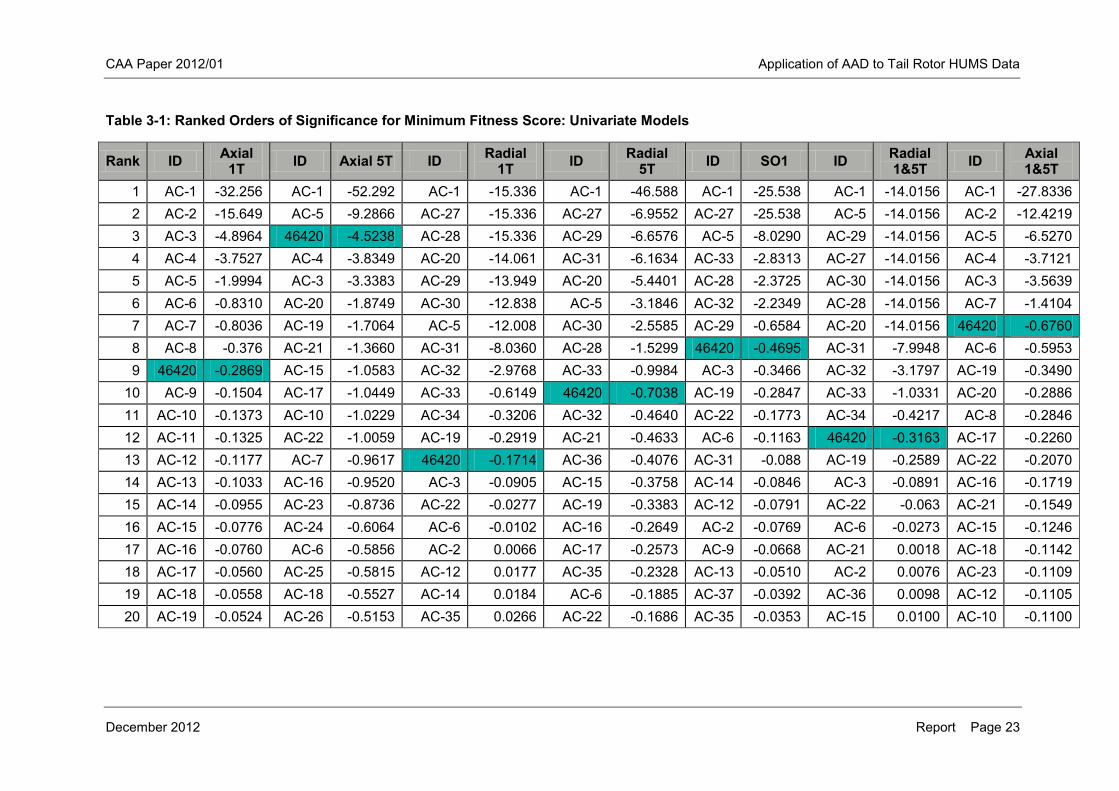
contained more noise than the Cruise data and it would be anticipated that detecting the anomalies would be more difficult. The results of the AAD models indicated that they all responded to the anomaly, however, the most anomalous results were generally caused by instrumentation faults in other aircraft. The faults were generally characterised by short duration spikes in the data, which gave the most significant levels of abnormality, i.e. lowest minimum Fitness Scores. For each model, the Fitness Scores were normalised by the mean and standard deviation of the Fitness Score values calculated over all the acquisitions for all the aircraft. The minimum value for each aircraft was extracted and the values ranked in descending order of magnitude. The top 20 ranked orders of significance for the seven anomaly models are given for a selection of the highest ranked aircraft in Table 3-1. The table identifies the aircraft through their ID numbers, the ID for the accident aircraft is 46420 (all other aircraft have been de-identified). The values for the accident aircraft have been highlighted in the table. The aircraft does appear significant with respect to other aircraft. However as indicated previously, the absolute levels of significance are biased by instrumentation faults in other aircraft so that it can appear statistically small. For example for the 1T Axial model the minimum Fitness Score appeared to be only 0.287 standard deviations below the mean. This is due to the value of the normalisation parameters used. In other words, the standard deviation used to normalise the Fitness Scores appeared much larger than expected due to instrumentation faults and was not representative of the actual data distribution. The results were regenerated after the Fitness Score standard deviation was recalculated to provide a more representative value for the statistic. In this case, a trimmed mean and trimmed standard deviation were calculated for the 1T Axial model. Trimmed statistics are more robust in the presence of outliers. The statistics were calculated by ordering the Fitness Scores for all acquisitions of all the aircraft in ascending order and excluding the top and bottom 2.5% of the data, i.e. the statistics were calculated from 95% of the total number of values. The trimmed statistics were used to normalise the minimum Fitness Scores for all aircraft. This will not affect the rankings calculated previously, so the accident aircraft still appears significant with respect to the other aircraft but it does provide a more realistic assessment of the statistical significance of the minimum Fitness Score: in this case the Fitness Score significance was raised to 11 standard deviations below the mean. The ranking of Aircraft 46420 appears similar for most of the models. Nevertheless, the aircraft is highest ranked in the 5T Axial model with a rank of 3. The two aircraft having more extreme values than Aircraft 46420 were probably suffering from instrumentation faults. This result is as expected from the previous discussion and indicates the significance of the 5T axial data. It is noted that this was not commented on in the accident report. The 1T Radial model ranks the aircraft lowest in significance with a rank of 13. The average rank over all the models was 9.
CAA Paper 2012/01 Application of AAD to Tail Rotor HUMS Data
December 2012 Report Page 23
Table 3-1: Ranked Orders of Significance for Minimum Fitness Score: Univariate Models
Rank ID Axial 1T ID Axial 5T ID Radial
1T ID Radial 5T ID SO1 ID Radial
1&5T ID Axial 1&5T
1 AC-1 -32.256 AC-1 -52.292 AC-1 -15.336 AC-1 -46.588 AC-1 -25.538 AC-1 -14.0156 AC-1 -27.8336 2 AC-2 -15.649 AC-5 -9.2866 AC-27 -15.336 AC-27 -6.9552 AC-27 -25.538 AC-5 -14.0156 AC-2 -12.4219 3 AC-3 -4.8964 46420 -4.5238 AC-28 -15.336 AC-29 -6.6576 AC-5 -8.0290 AC-29 -14.0156 AC-5 -6.5270 4 AC-4 -3.7527 AC-4 -3.8349 AC-20 -14.061 AC-31 -6.1634 AC-33 -2.8313 AC-27 -14.0156 AC-4 -3.7121 5 AC-5 -1.9994 AC-3 -3.3383 AC-29 -13.949 AC-20 -5.4401 AC-28 -2.3725 AC-30 -14.0156 AC-3 -3.5639 6 AC-6 -0.8310 AC-20 -1.8749 AC-30 -12.838 AC-5 -3.1846 AC-32 -2.2349 AC-28 -14.0156 AC-7 -1.4104 7 AC-7 -0.8036 AC-19 -1.7064 AC-5 -12.008 AC-30 -2.5585 AC-29 -0.6584 AC-20 -14.0156 46420 -0.6760 8 AC-8 -0.376 AC-21 -1.3660 AC-31 -8.0360 AC-28 -1.5299 46420 -0.4695 AC-31 -7.9948 AC-6 -0.5953 9 46420 -0.2869 AC-15 -1.0583 AC-32 -2.9768 AC-33 -0.9984 AC-3 -0.3466 AC-32 -3.1797 AC-19 -0.3490
10 AC-9 -0.1504 AC-17 -1.0449 AC-33 -0.6149 46420 -0.7038 AC-19 -0.2847 AC-33 -1.0331 AC-20 -0.2886 11 AC-10 -0.1373 AC-10 -1.0229 AC-34 -0.3206 AC-32 -0.4640 AC-22 -0.1773 AC-34 -0.4217 AC-8 -0.2846 12 AC-11 -0.1325 AC-22 -1.0059 AC-19 -0.2919 AC-21 -0.4633 AC-6 -0.1163 46420 -0.3163 AC-17 -0.2260 13 AC-12 -0.1177 AC-7 -0.9617 46420 -0.1714 AC-36 -0.4076 AC-31 -0.088 AC-19 -0.2589 AC-22 -0.2070 14 AC-13 -0.1033 AC-16 -0.9520 AC-3 -0.0905 AC-15 -0.3758 AC-14 -0.0846 AC-3 -0.0891 AC-16 -0.1719 15 AC-14 -0.0955 AC-23 -0.8736 AC-22 -0.0277 AC-19 -0.3383 AC-12 -0.0791 AC-22 -0.063 AC-21 -0.1549 16 AC-15 -0.0776 AC-24 -0.6064 AC-6 -0.0102 AC-16 -0.2649 AC-2 -0.0769 AC-6 -0.0273 AC-15 -0.1246 17 AC-16 -0.0760 AC-6 -0.5856 AC-2 0.0066 AC-17 -0.2573 AC-9 -0.0668 AC-21 0.0018 AC-18 -0.1142 18 AC-17 -0.0560 AC-25 -0.5815 AC-12 0.0177 AC-35 -0.2328 AC-13 -0.0510 AC-2 0.0076 AC-23 -0.1109 19 AC-18 -0.0558 AC-18 -0.5527 AC-14 0.0184 AC-6 -0.1885 AC-37 -0.0392 AC-36 0.0098 AC-12 -0.1105 20 AC-19 -0.0524 AC-26 -0.5153 AC-35 0.0266 AC-22 -0.1686 AC-35 -0.0353 AC-15 0.0100 AC-10 -0.1100
CAA Paper 2012/01 Application of AAD to Tail Rotor HUMS Data
December 2012 Report Page 24
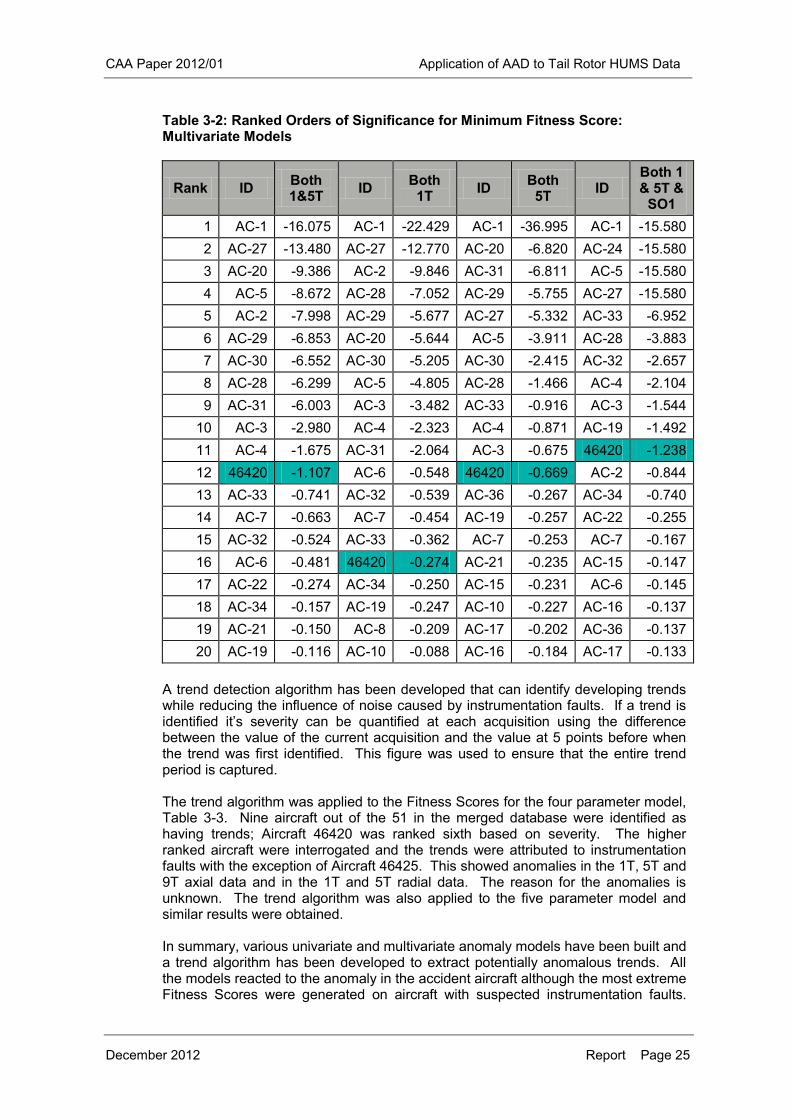
Radial and axial TR acquisitions were merged together using airframe hours. A window of 2 hours was placed on the merging criteria such that data from the radial and axial tables that were more than this period apart would not be joined. Data that did not consist of both a radial and an axial acquisition could not be used for subsequent anomaly model building and were excluded from the merged data set. This resulted in a loss of approximately 5% of the data (134 axial and 288 radial acquisitions), i.e. where individual acquisitions could not be related. However, no data was lost from the accident aircraft. Merging was also performed between the TR axial, TR radial and gearbox SO1 databases. This resulted in the loss of a higher proportion of the data: 937 Axial, 1091 Radial and 695 SO1 acquisitions could not be merged. This equates to approximately 30% of the available data and is due to the differing scheduling and priorities of the rotor and gearbox analyses. However, none was lost from the final portion of accident data. Anomaly models were built using the merged data. The models included two 2 parameter models, one 4 parameter model and a 5 parameter model. The models were: a 1T axial and 1T radial model (Both 1T), a 5T axial and 5T radial model (Both 5T), 1T axial, 1T radial, 5T axial and 5T radial (Both 1&5T) and a model that also used the gearbox input SO1 together with the four TR harmonics of interest (Both 1&5T & SO1). The models were trained and tested. The Fitness Score results for each model were normalised by the mean and standard deviations of all the Fitness Score values for that model and the minimum Fitness Score value was extracted for each aircraft. The top 20 ranked orders of significance for the four multivariate models are given for a selection of the highest ranked aircraft in Table 3-2. The rankings were similar to the results for the univariate models: the average ranking over the four models was slightly lower at Rank 13. Again, the levels of significance were biased by the presence of instrumentation errors so that the absolute level of significance appeared statistically small. In other words, the standard deviation used to normalise the Fitness Scores appears much larger than expected due to instrumentation faults and was not representative of the actual data distribution. The normalising parameters (mean and standard deviation) were re-calculated using 5% trimmed statistics to provide more representative values for the distribution. The minimum Fitness Scores for all aircraft from the five parameter model were extracted and normalised by the trimmed statistics. As indicated previously, this does not modify the ranking of the aircraft with respect to one another but does give a better representative value for the statistical significance of the results. In this case significance for Aircraft 46420 was raised from 1.238 standard deviations below the mean (see Table 3-2) to 24 standard deviations below the mean. This result simply indicates that the level of anomaly detected is more significant than it initially appears and that the anomaly was identified.
CAA Paper 2012/01 Application of AAD to Tail Rotor HUMS Data
December 2012 Report Page 25
Table 3-2: Ranked Orders of Significance for Minimum Fitness Score: Multivariate Models
Rank ID Both 1&5T ID Both
1T ID Both 5T ID
Both 1 & 5T &
SO1 1 AC-1 -16.075 AC-1 -22.429 AC-1 -36.995 AC-1 -15.580 2 AC-27 -13.480 AC-27 -12.770 AC-20 -6.820 AC-24 -15.580 3 AC-20 -9.386 AC-2 -9.846 AC-31 -6.811 AC-5 -15.580 4 AC-5 -8.672 AC-28 -7.052 AC-29 -5.755 AC-27 -15.580 5 AC-2 -7.998 AC-29 -5.677 AC-27 -5.332 AC-33 -6.952 6 AC-29 -6.853 AC-20 -5.644 AC-5 -3.911 AC-28 -3.883 7 AC-30 -6.552 AC-30 -5.205 AC-30 -2.415 AC-32 -2.657 8 AC-28 -6.299 AC-5 -4.805 AC-28 -1.466 AC-4 -2.104 9 AC-31 -6.003 AC-3 -3.482 AC-33 -0.916 AC-3 -1.544
10 AC-3 -2.980 AC-4 -2.323 AC-4 -0.871 AC-19 -1.492 11 AC-4 -1.675 AC-31 -2.064 AC-3 -0.675 46420 -1.238 12 46420 -1.107 AC-6 -0.548 46420 -0.669 AC-2 -0.844 13 AC-33 -0.741 AC-32 -0.539 AC-36 -0.267 AC-34 -0.740 14 AC-7 -0.663 AC-7 -0.454 AC-19 -0.257 AC-22 -0.255 15 AC-32 -0.524 AC-33 -0.362 AC-7 -0.253 AC-7 -0.167 16 AC-6 -0.481 46420 -0.274 AC-21 -0.235 AC-15 -0.147 17 AC-22 -0.274 AC-34 -0.250 AC-15 -0.231 AC-6 -0.145 18 AC-34 -0.157 AC-19 -0.247 AC-10 -0.227 AC-16 -0.137 19 AC-21 -0.150 AC-8 -0.209 AC-17 -0.202 AC-36 -0.137 20 AC-19 -0.116 AC-10 -0.088 AC-16 -0.184 AC-17 -0.133
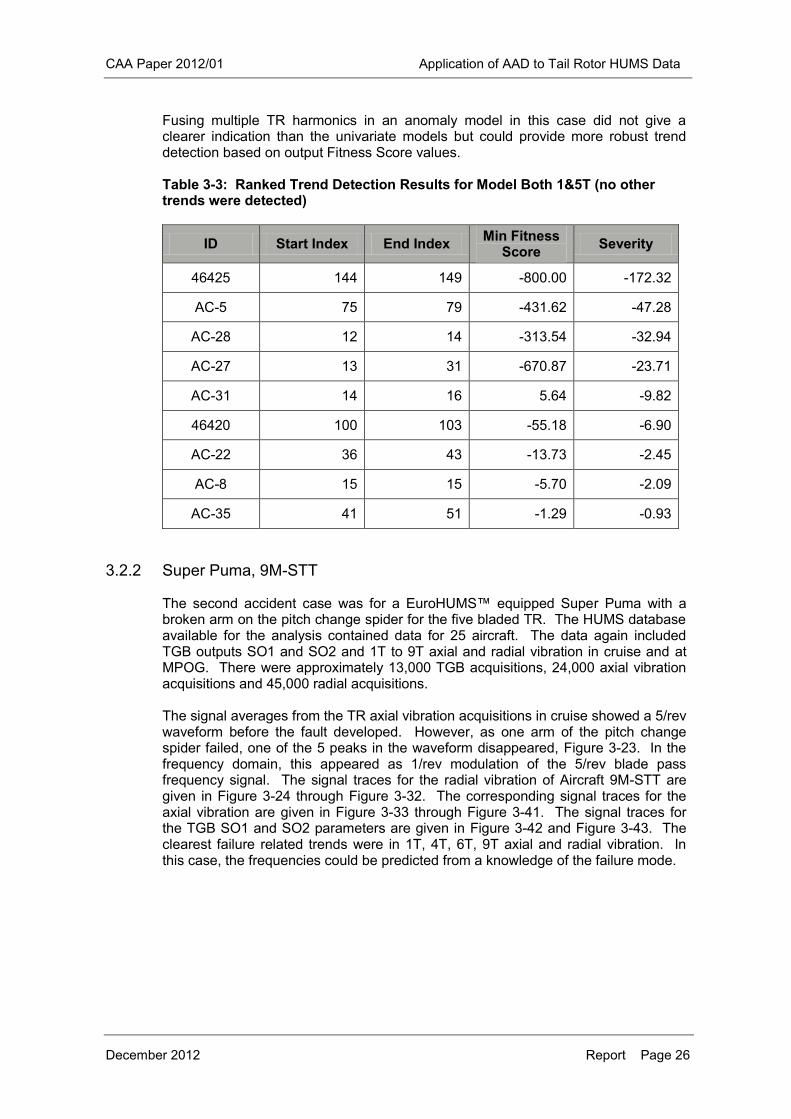
A trend detection algorithm has been developed that can identify developing trends while reducing the influence of noise caused by instrumentation faults. If a trend is identified it’s severity can be quantified at each acquisition using the difference between the value of the current acquisition and the value at 5 points before when the trend was first identified. This figure was used to ensure that the entire trend period is captured. The trend algorithm was applied to the Fitness Scores for the four parameter model, Table 3-3. Nine aircraft out of the 51 in the merged database were identified as having trends; Aircraft 46420 was ranked sixth based on severity. The higher ranked aircraft were interrogated and the trends were attributed to instrumentation faults with the exception of Aircraft 46425. This showed anomalies in the 1T, 5T and 9T axial data and in the 1T and 5T radial data. The reason for the anomalies is unknown. The trend algorithm was also applied to the five parameter model and similar results were obtained. In summary, various univariate and multivariate anomaly models have been built and a trend algorithm has been developed to extract potentially anomalous trends. All the models reacted to the anomaly in the accident aircraft although the most extreme Fitness Scores were generated on aircraft with suspected instrumentation faults.
CAA Paper 2012/01 Application of AAD to Tail Rotor HUMS Data
December 2012 Report Page 26
Fusing multiple TR harmonics in an anomaly model in this case did not give a clearer indication than the univariate models but could provide more robust trend detection based on output Fitness Score values.
Table 3-3: Ranked Trend Detection Results for Model Both 1&5T (no other trends were detected)
ID Start Index End Index Min Fitness Score Severity
46425 144 149 -800.00 -172.32
AC-5 75 79 -431.62 -47.28
AC-28 12 14 -313.54 -32.94
AC-27 13 31 -670.87 -23.71
AC-31 14 16 5.64 -9.82
46420 100 103 -55.18 -6.90
AC-22 36 43 -13.73 -2.45
AC-8 15 15 -5.70 -2.09
AC-35 41 51 -1.29 -0.93
3.2.2 Super Puma, 9M-STT
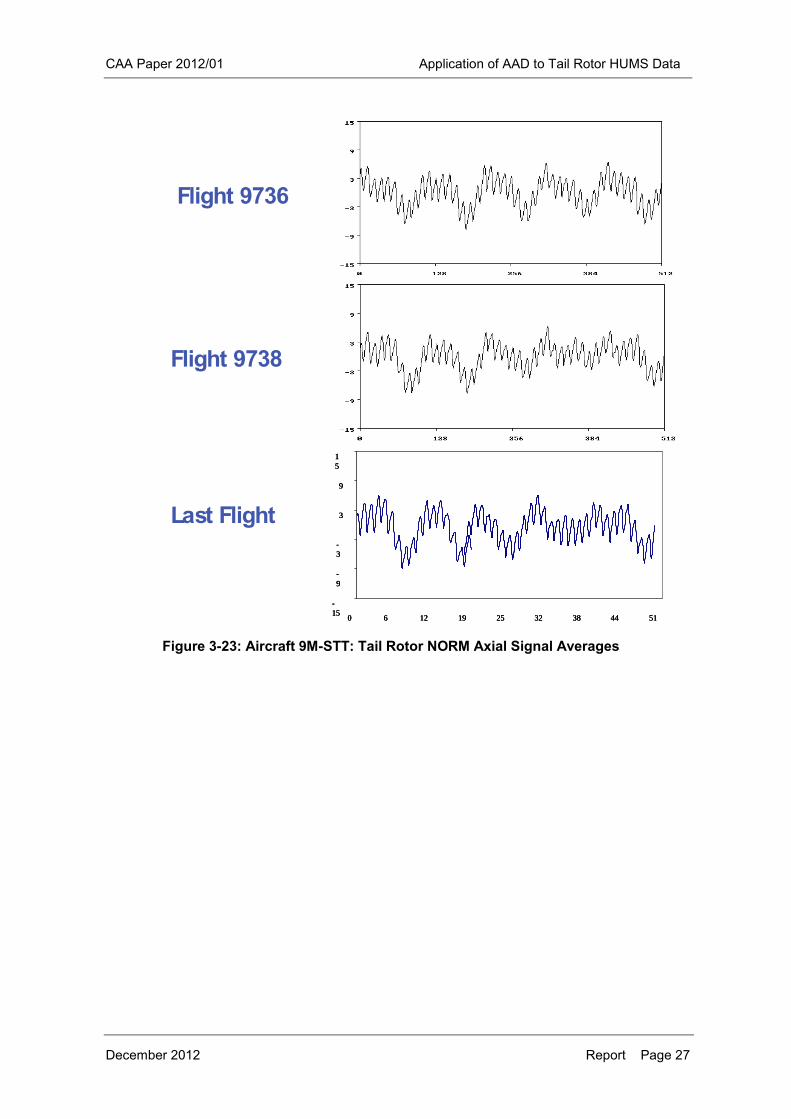
The second accident case was for a EuroHUMS™ equipped Super Puma with a broken arm on the pitch change spider for the five bladed TR. The HUMS database available for the analysis contained data for 25 aircraft. The data again included TGB outputs SO1 and SO2 and 1T to 9T axial and radial vibration in cruise and at MPOG. There were approximately 13,000 TGB acquisitions, 24,000 axial vibration acquisitions and 45,000 radial acquisitions. The signal averages from the TR axial vibration acquisitions in cruise showed a 5/rev waveform before the fault developed. However, as one arm of the pitch change spider failed, one of the 5 peaks in the waveform disappeared, Figure 3-23. In the frequency domain, this appeared as 1/rev modulation of the 5/rev blade pass frequency signal. The signal traces for the radial vibration of Aircraft 9M-STT are given in Figure 3-24 through Figure 3-32. The corresponding signal traces for the axial vibration are given in Figure 3-33 through Figure 3-41. The signal traces for the TGB SO1 and SO2 parameters are given in Figure 3-42 and Figure 3-43. The clearest failure related trends were in 1T, 4T, 6T, 9T axial and radial vibration. In this case, the frequencies could be predicted from a knowledge of the failure mode.
CAA Paper 2012/01 Application of AAD to Tail Rotor HUMS Data
December 2012 Report Page 27
Figure 3-23: Aircraft 9M-STT: Tail Rotor NORM Axial Signal Averages
-
15
-
9
-
3
3
9
1
5
0 6
4
12
8
19
2
25
6
32
0
38
4
44
8
51
2
-
15
-
9
-
3
3
9
1
5
0 6
4
12
8
19
2
25
6
32
0
38
4
44
8
51
2
-
15
-
9
-
3
3
9
1
5
0 6
4
12
8
19
2
25
6
32
0
38
4
44
8
51
2
Last Flight
Flight 9736
Flight 9738
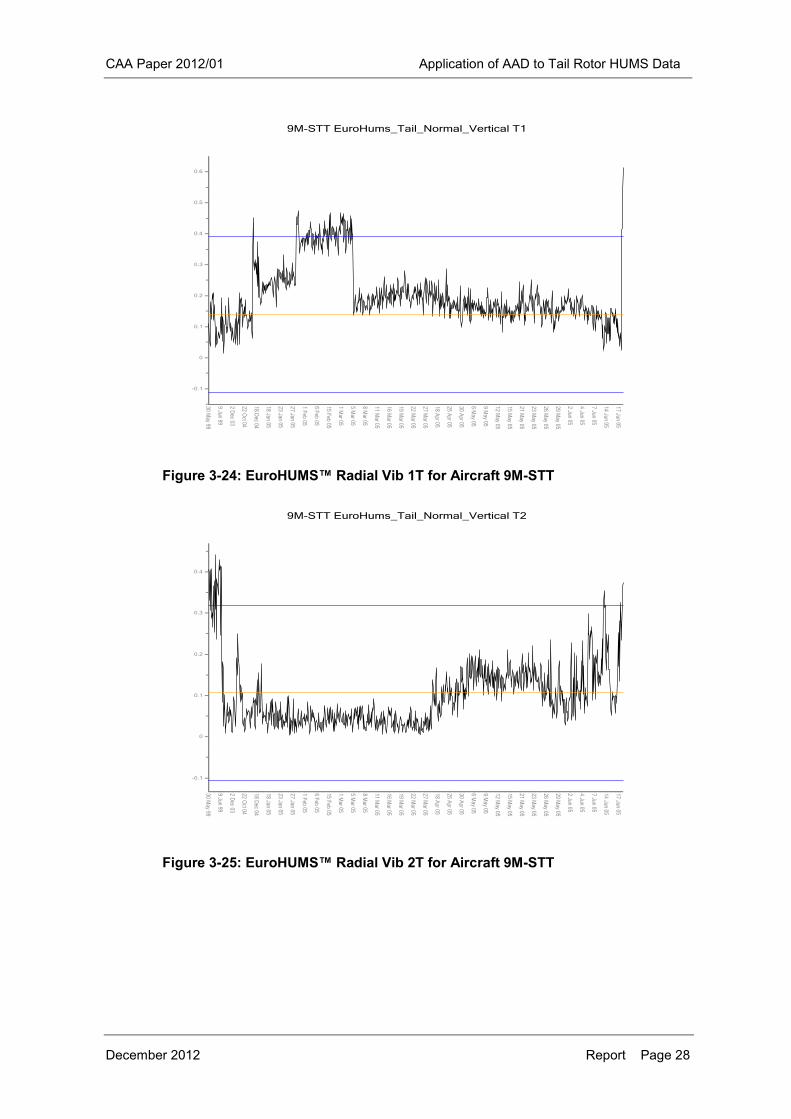
CAA Paper 2012/01 Application of AAD to Tail Rotor HUMS Data
December 2012 Report Page 28
Figure 3-24: EuroHUMS™ Radial Vib 1T for Aircraft 9M-STT
Figure 3-25: EuroHUMS™ Radial Vib 2T for Aircraft 9M-STT
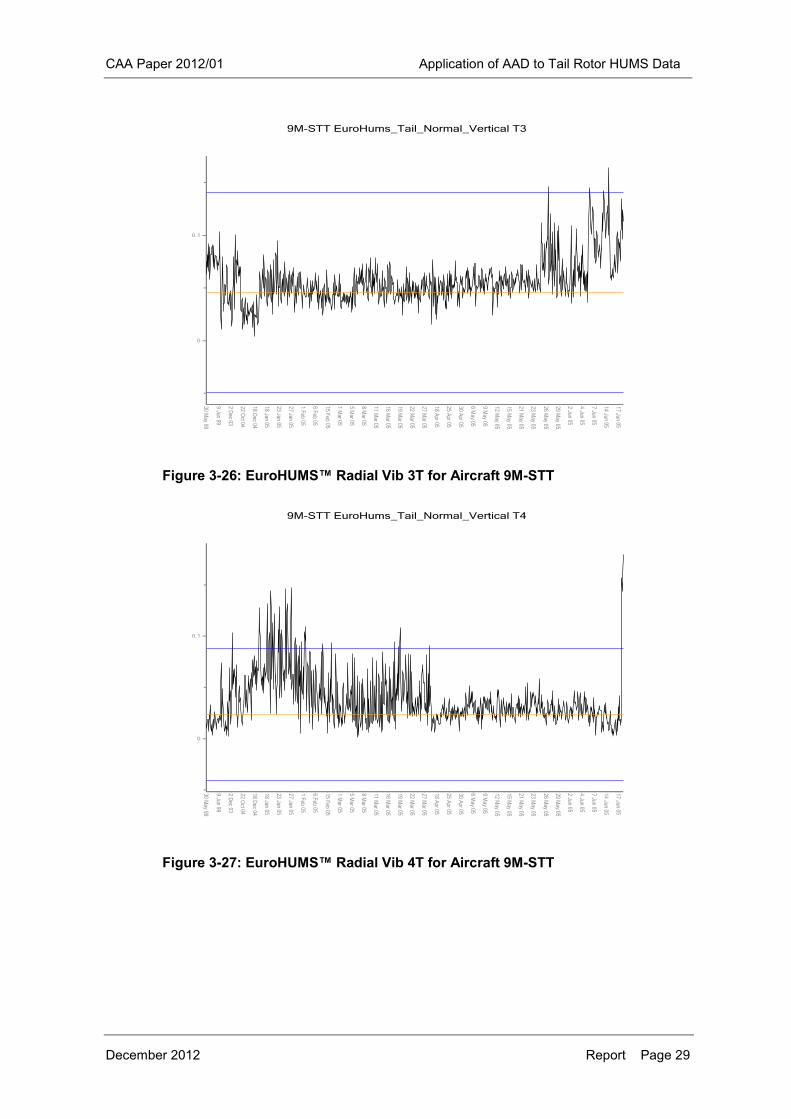
CAA Paper 2012/01 Application of AAD to Tail Rotor HUMS Data
December 2012 Report Page 29
Figure 3-26: EuroHUMS™ Radial Vib 3T for Aircraft 9M-STT
Figure 3-27: EuroHUMS™ Radial Vib 4T for Aircraft 9M-STT
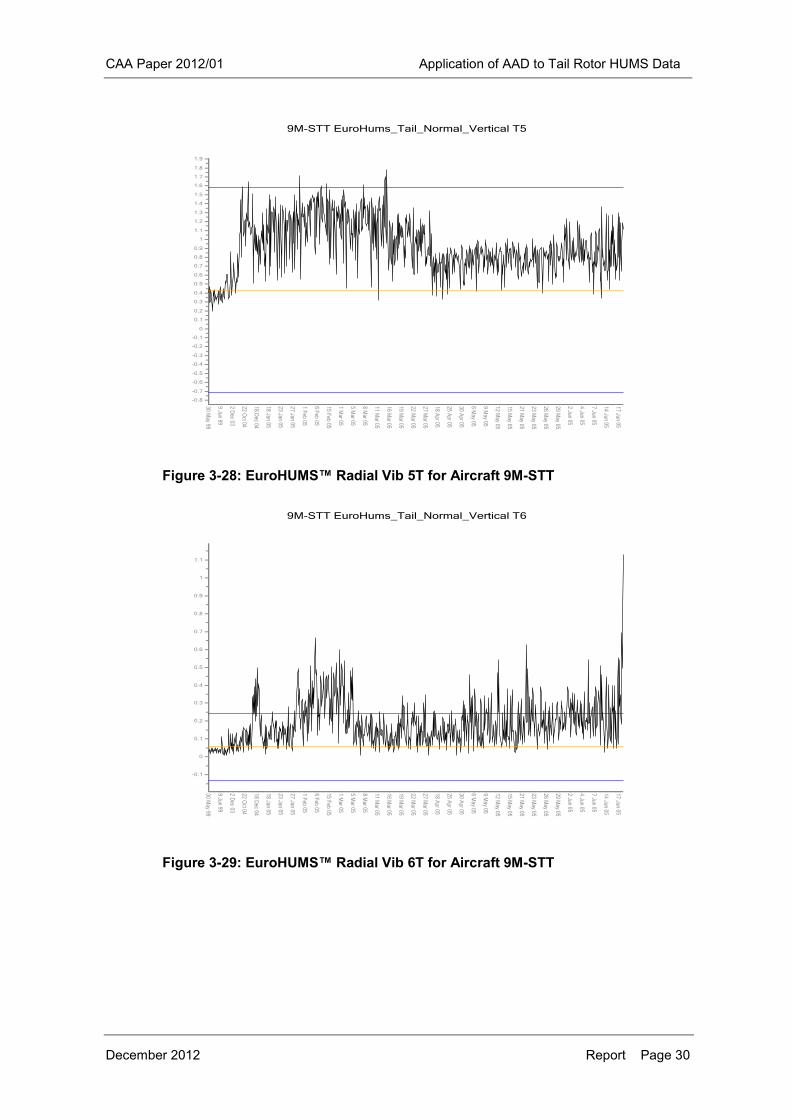
CAA Paper 2012/01 Application of AAD to Tail Rotor HUMS Data
December 2012 Report Page 30
Figure 3-28: EuroHUMS™ Radial Vib 5T for Aircraft 9M-STT
Figure 3-29: EuroHUMS™ Radial Vib 6T for Aircraft 9M-STT
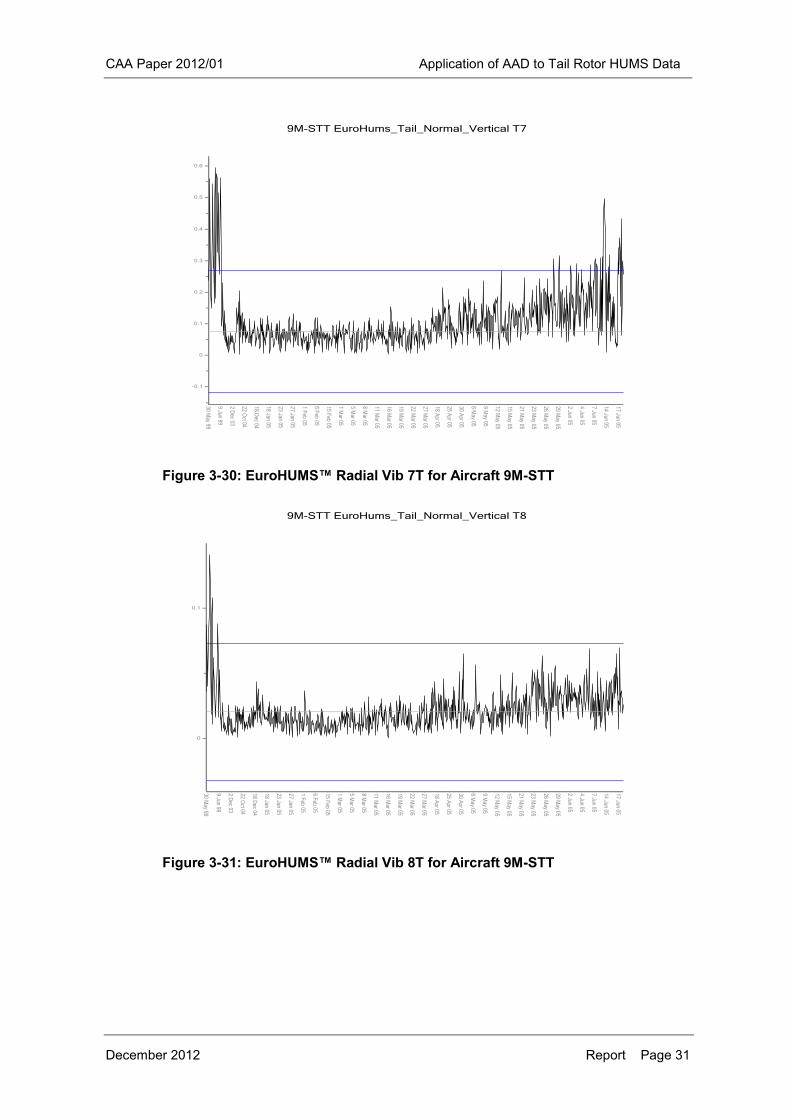
CAA Paper 2012/01 Application of AAD to Tail Rotor HUMS Data
December 2012 Report Page 31
Figure 3-30: EuroHUMS™ Radial Vib 7T for Aircraft 9M-STT
Figure 3-31: EuroHUMS™ Radial Vib 8T for Aircraft 9M-STT
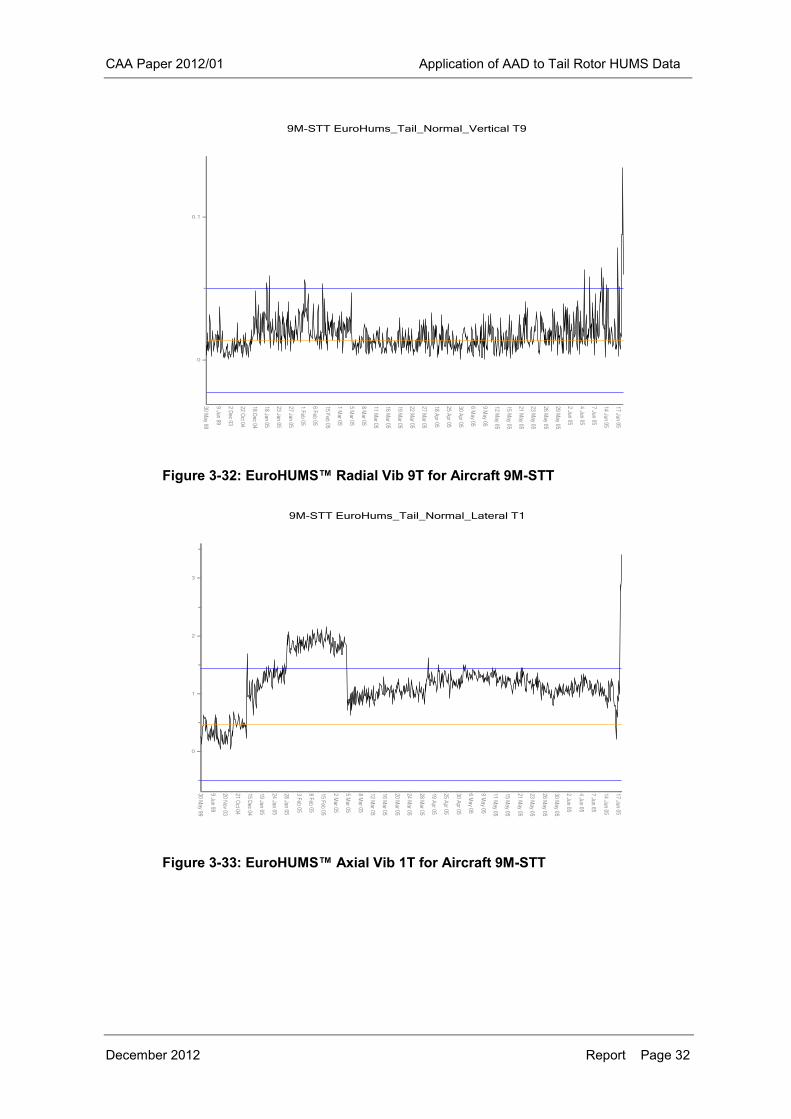
CAA Paper 2012/01 Application of AAD to Tail Rotor HUMS Data
December 2012 Report Page 32
Figure 3-32: EuroHUMS™ Radial Vib 9T for Aircraft 9M-STT
Figure 3-33: EuroHUMS™ Axial Vib 1T for Aircraft 9M-STT
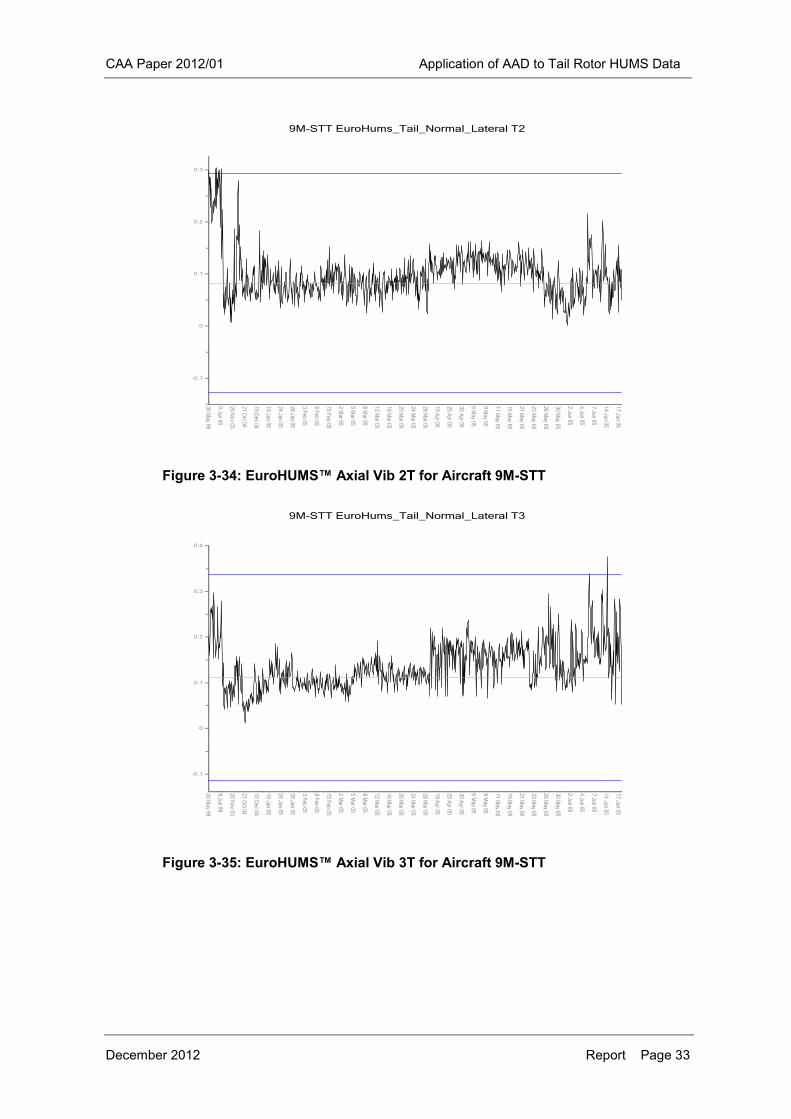
CAA Paper 2012/01 Application of AAD to Tail Rotor HUMS Data
December 2012 Report Page 33
Figure 3-34: EuroHUMS™ Axial Vib 2T for Aircraft 9M-STT
Figure 3-35: EuroHUMS™ Axial Vib 3T for Aircraft 9M-STT
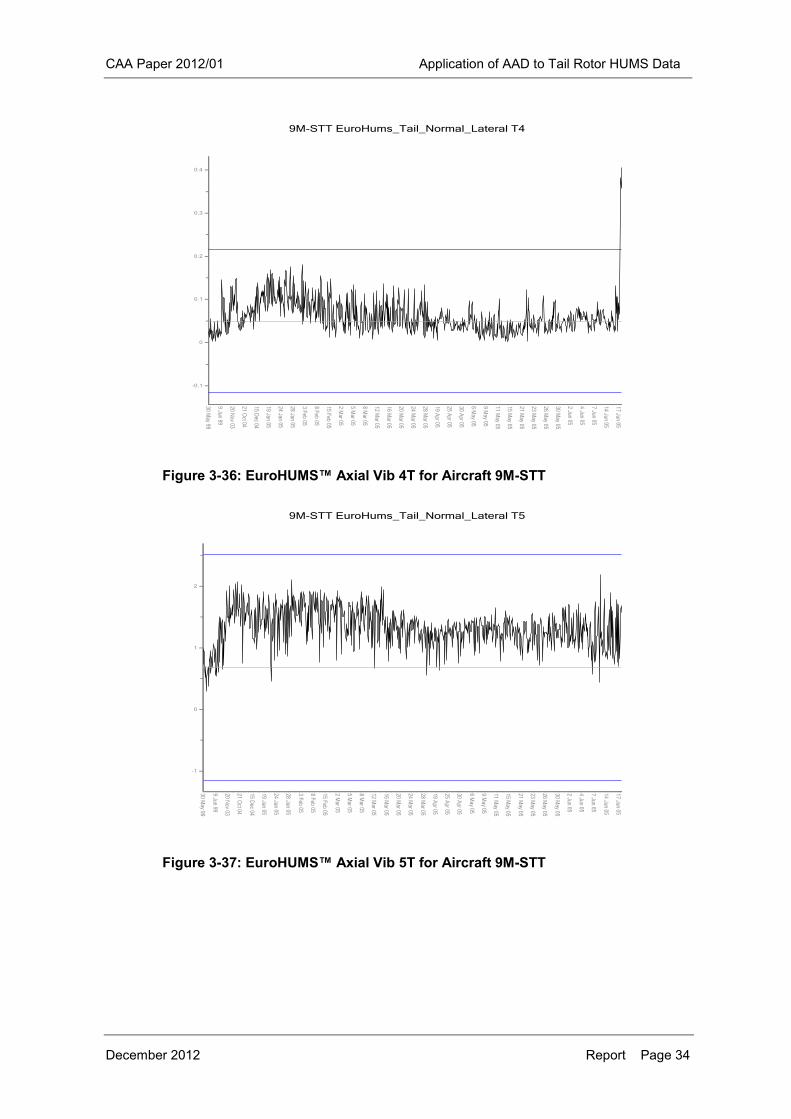
CAA Paper 2012/01 Application of AAD to Tail Rotor HUMS Data
December 2012 Report Page 34
Figure 3-36: EuroHUMS™ Axial Vib 4T for Aircraft 9M-STT
Figure 3-37: EuroHUMS™ Axial Vib 5T for Aircraft 9M-STT
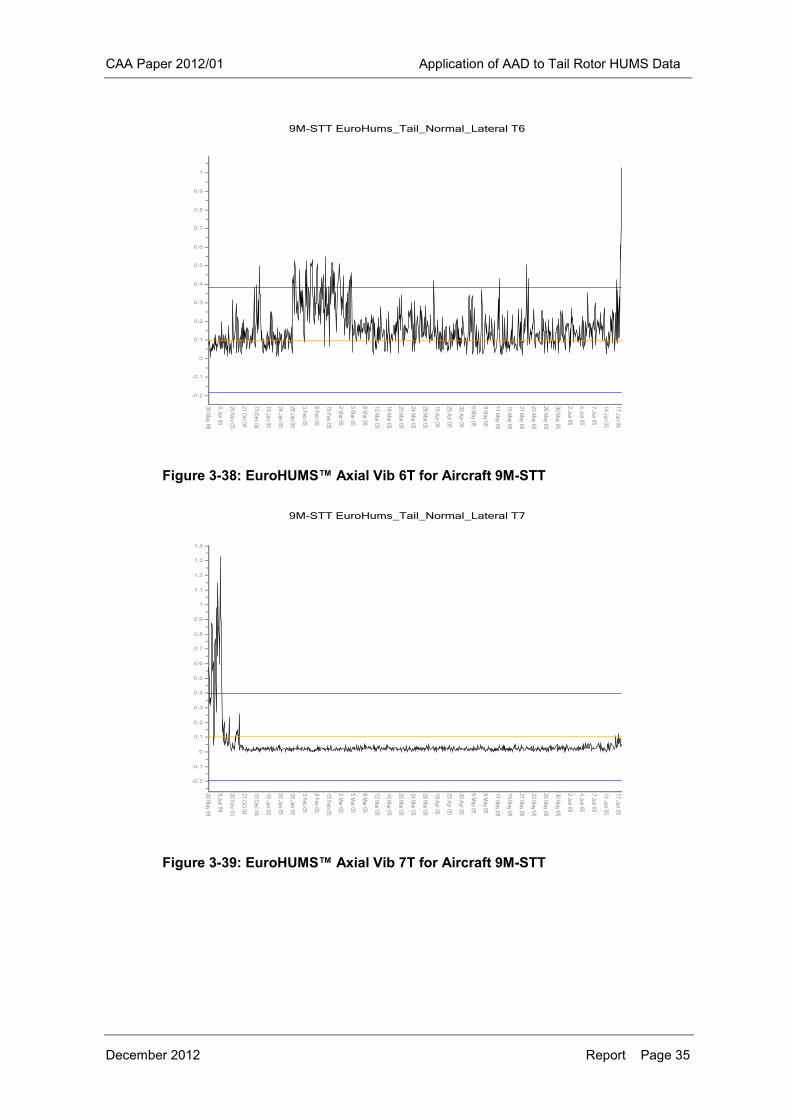
CAA Paper 2012/01 Application of AAD to Tail Rotor HUMS Data
December 2012 Report Page 35
Figure 3-38: EuroHUMS™ Axial Vib 6T for Aircraft 9M-STT
Figure 3-39: EuroHUMS™ Axial Vib 7T for Aircraft 9M-STT
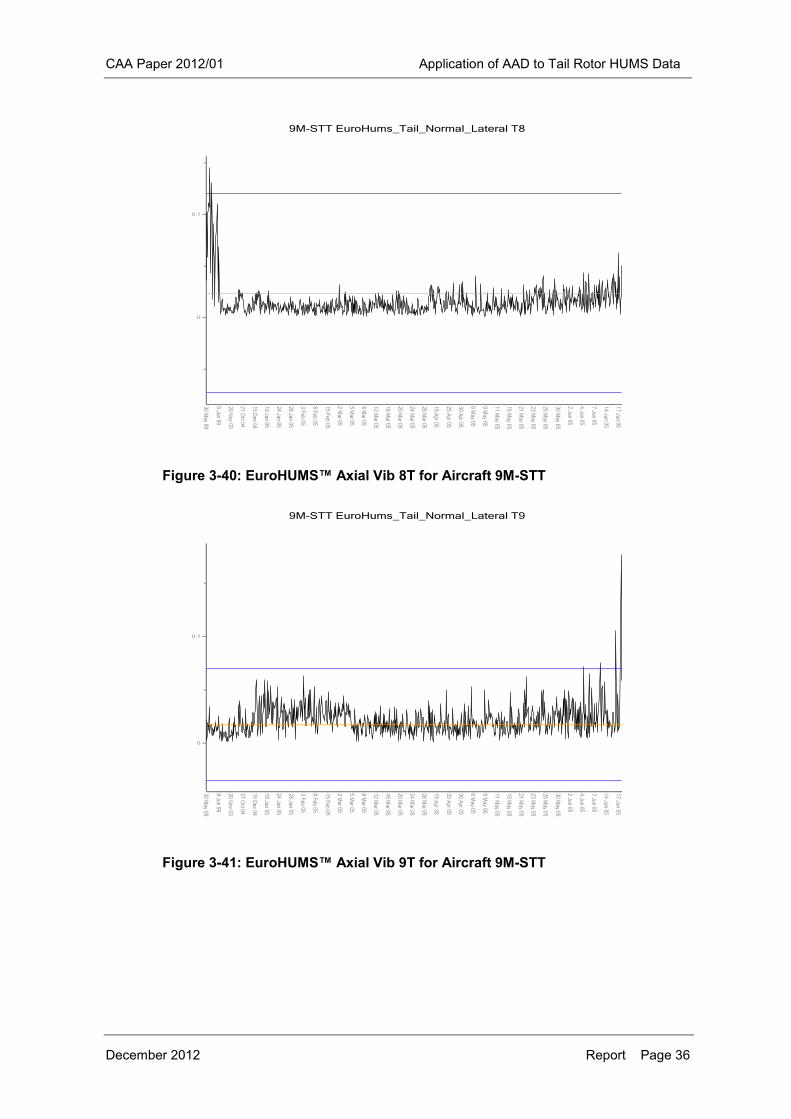
CAA Paper 2012/01 Application of AAD to Tail Rotor HUMS Data
December 2012 Report Page 36
Figure 3-40: EuroHUMS™ Axial Vib 8T for Aircraft 9M-STT
Figure 3-41: EuroHUMS™ Axial Vib 9T for Aircraft 9M-STT
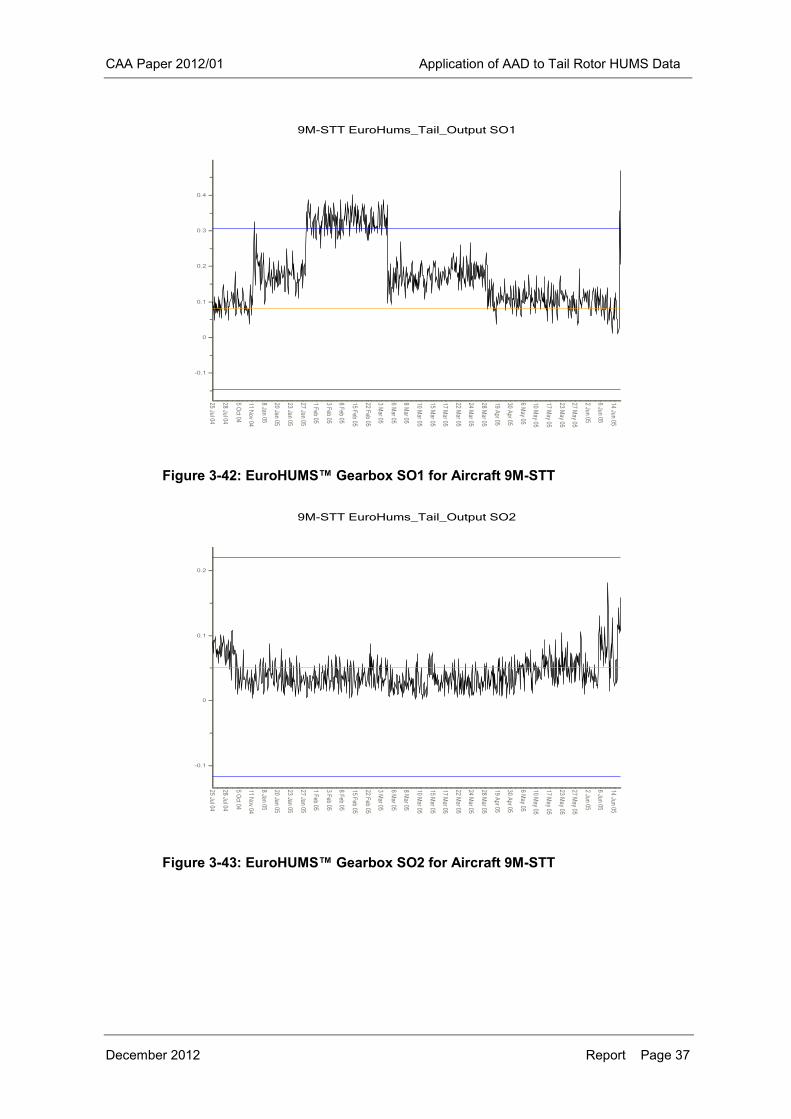
CAA Paper 2012/01 Application of AAD to Tail Rotor HUMS Data
December 2012 Report Page 37
Figure 3-42: EuroHUMS™ Gearbox SO1 for Aircraft 9M-STT
Figure 3-43: EuroHUMS™ Gearbox SO2 for Aircraft 9M-STT

CAA Paper 2012/01 Application of AAD to Tail Rotor HUMS Data
December 2012 Report Page 38
Univariate AAD models were built for 1T, 4T and 6T radial as well as 1T, 4T and 6T axial vibration. Multivariate models were built using combinations of either the axial or radial vibration data. The models were built using data from the Cruise phase only. For each model, the Fitness Scores were normalised by the mean and standard deviation of the Fitness Score values calculated over all the acquisitions for all the aircraft. The minimum value for each aircraft was extracted and the values ranked in descending order of magnitude. The top 20 ranked orders of significance for the axial vibration models are given for all the aircraft in Table 3-4. The results for the corresponding radial vibration models are given in Table 3-5. All models clearly responded to the accident data with significant Fitness Scores. The lowest ranked axial model was Axial 4T with a rank of 3. Models Axial 1T and Axial 1+6T were ranked 1. The remaining axial models were all ranked 2. In comparison the only radial model to be ranked 1 was Radial 6T. The lowest ranked radial model with a rank of 5 was Radial 1T. In general the axial models performed better at identifying the fault; the average rank for the axial models was 1.85 whilst the average rank for the radial models was 2.85. The multivariate models also performed better than the univariate models; the average rank for the univariate axial models was 2 whilst for the multivariate models the rank was 1.75. For the univariate radial models the average rank was 3.33 whilst for the multivariate models the average rank was 2.5. The highest ranked anomaly in most models is believed to be due to an instrumentation problem. Radial and axial TR acquisitions were merged together, resulting in a loss of approximately 14% of the data, however no data related to the accident was lost. TR data was also merged with that from the TGB output. This resulted in a high proportion of the data being lost (approximately 60%). Because of the large amount of data lost by this merge, no anomaly models using TGB data were built. In this case, data fusion would need to be performed using diagnostic reasoning logic. Three merged models were built; a four parameter model using axial 4T, axial 6T, radial 4T and radial 6T data (Both 46T), an eight parameter model using axial and radial 1T, 4T, 6T and 9T data (Both 1469T) and finally a two parameter model using axial 1T and radial 6T data. The normalised ranked results are shown in Table 3-6. The ranked results indicate that the two parameter model gave the greatest significance to the accident aircraft with a rank of 1 and a normalised minimum fitness score of 76.866 standard deviations below the mean; the next ranked value was 12 standard deviations below the mean. However, this result is somewhat artificial as the model has been somewhat contrived to illustrate the significance of the anomaly. The significance of the anomalous aircraft has been emphasised by using only the specific inputs which showed up as most significant in this particular case and would not be expected to be true generally. Nevertheless, the four parameter model gave a rank of 2 to the anomalous aircraft with a minimum normalised fitness score of 60 standard deviations below the mean. The eight parameter model ranked the accident aircraft 3 with a normalised fitness score of 38 standard deviations below the mean. However, with a PA threshold of 0.98 and a 2 out of 3 M out of N (MooN) alerting criteria (i.e. 2 out of 3 continuous points must be over the PA threshold to raise an alert), Aircraft 9M-STT raised an alert over the final 3 acquisitions. Only one other aircraft raised an alert with this threshold. The trend detection algorithm was applied to the model outputs and identified clear trends on the accident aircraft, with the highest trend severities in all cases, with the exception of the Radial 1T and Radial 4T models; Aircraft 9M-STT was ranked 3 for the Radial 1T model and 2 for the Radial 4T model. The model with the highest severity was the eight parameter model Both 1469T. The trend algorithm results for
CAA Paper 2012/01 Application of AAD to Tail Rotor HUMS Data
December 2012 Report Page 39
this model are shown in Table 3-7. The table shows all trends that were detected, i.e. trends were only detected in six out of the available 25 aircraft. It can be noted, however, the trend was only detected on the last two data points. An alternative trend detection approach was investigated, although it was difficult to improve detection time without identifying false trends due to data noise or spikes. To eliminate the effects of noise, it may be possible to fuse cruise model outputs with a MPOG model (where no response is observed in the accident case) to discriminate possible fault types.
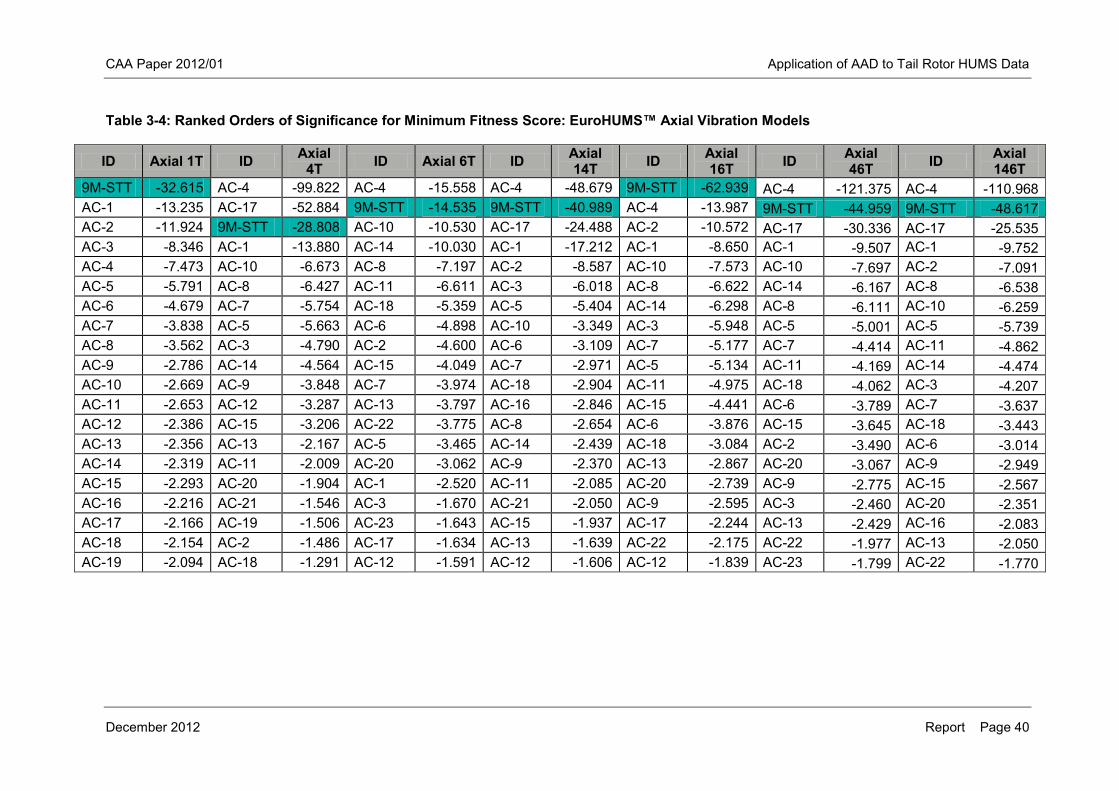
CAA Paper 2012/01 Application of AAD to Tail Rotor HUMS Data
December 2012 Report Page 40
Table 3-4: Ranked Orders of Significance for Minimum Fitness Score: EuroHUMS™ Axial Vibration Models
ID Axial 1T ID Axial 4T ID Axial 6T ID Axial
14T ID Axial 16T ID Axial
46T ID Axial 146T
9M-STT -32.615 AC-4 -99.822 AC-4 -15.558 AC-4 -48.679 9M-STT -62.939 AC-4 -121.375 AC-4 -110.968 AC-1 -13.235 AC-17 -52.884 9M-STT -14.535 9M-STT -40.989 AC-4 -13.987 9M-STT -44.959 9M-STT -48.617 AC-2 -11.924 9M-STT -28.808 AC-10 -10.530 AC-17 -24.488 AC-2 -10.572 AC-17 -30.336 AC-17 -25.535 AC-3 -8.346 AC-1 -13.880 AC-14 -10.030 AC-1 -17.212 AC-1 -8.650 AC-1 -9.507 AC-1 -9.752 AC-4 -7.473 AC-10 -6.673 AC-8 -7.197 AC-2 -8.587 AC-10 -7.573 AC-10 -7.697 AC-2 -7.091 AC-5 -5.791 AC-8 -6.427 AC-11 -6.611 AC-3 -6.018 AC-8 -6.622 AC-14 -6.167 AC-8 -6.538 AC-6 -4.679 AC-7 -5.754 AC-18 -5.359 AC-5 -5.404 AC-14 -6.298 AC-8 -6.111 AC-10 -6.259 AC-7 -3.838 AC-5 -5.663 AC-6 -4.898 AC-10 -3.349 AC-3 -5.948 AC-5 -5.001 AC-5 -5.739 AC-8 -3.562 AC-3 -4.790 AC-2 -4.600 AC-6 -3.109 AC-7 -5.177 AC-7 -4.414 AC-11 -4.862 AC-9 -2.786 AC-14 -4.564 AC-15 -4.049 AC-7 -2.971 AC-5 -5.134 AC-11 -4.169 AC-14 -4.474 AC-10 -2.669 AC-9 -3.848 AC-7 -3.974 AC-18 -2.904 AC-11 -4.975 AC-18 -4.062 AC-3 -4.207 AC-11 -2.653 AC-12 -3.287 AC-13 -3.797 AC-16 -2.846 AC-15 -4.441 AC-6 -3.789 AC-7 -3.637 AC-12 -2.386 AC-15 -3.206 AC-22 -3.775 AC-8 -2.654 AC-6 -3.876 AC-15 -3.645 AC-18 -3.443 AC-13 -2.356 AC-13 -2.167 AC-5 -3.465 AC-14 -2.439 AC-18 -3.084 AC-2 -3.490 AC-6 -3.014 AC-14 -2.319 AC-11 -2.009 AC-20 -3.062 AC-9 -2.370 AC-13 -2.867 AC-20 -3.067 AC-9 -2.949 AC-15 -2.293 AC-20 -1.904 AC-1 -2.520 AC-11 -2.085 AC-20 -2.739 AC-9 -2.775 AC-15 -2.567 AC-16 -2.216 AC-21 -1.546 AC-3 -1.670 AC-21 -2.050 AC-9 -2.595 AC-3 -2.460 AC-20 -2.351 AC-17 -2.166 AC-19 -1.506 AC-23 -1.643 AC-15 -1.937 AC-17 -2.244 AC-13 -2.429 AC-16 -2.083 AC-18 -2.154 AC-2 -1.486 AC-17 -1.634 AC-13 -1.639 AC-22 -2.175 AC-22 -1.977 AC-13 -2.050 AC-19 -2.094 AC-18 -1.291 AC-12 -1.591 AC-12 -1.606 AC-12 -1.839 AC-23 -1.799 AC-22 -1.770
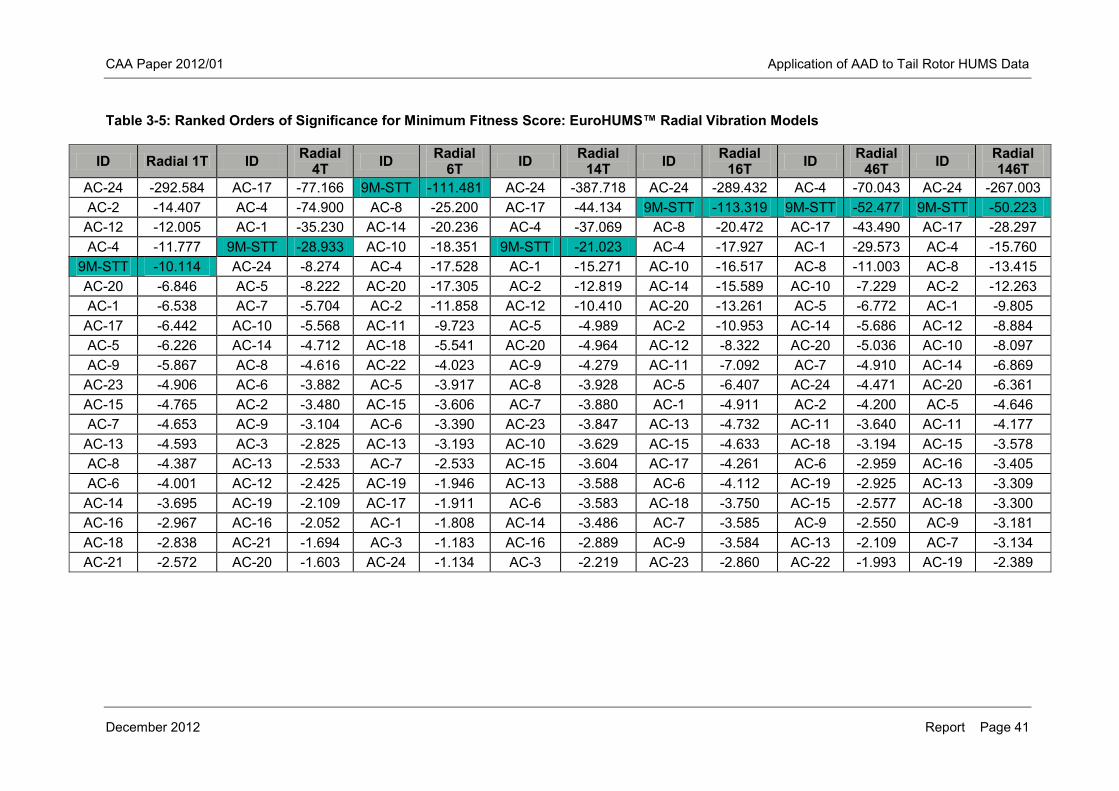
CAA Paper 2012/01 Application of AAD to Tail Rotor HUMS Data
December 2012 Report Page 41
Table 3-5: Ranked Orders of Significance for Minimum Fitness Score: EuroHUMS™ Radial Vibration Models
ID Radial 1T ID Radial 4T ID Radial
6T ID Radial 14T ID Radial
16T ID Radial 46T ID Radial
146T AC-24 -292.584 AC-17 -77.166 9M-STT -111.481 AC-24 -387.718 AC-24 -289.432 AC-4 -70.043 AC-24 -267.003 AC-2 -14.407 AC-4 -74.900 AC-8 -25.200 AC-17 -44.134 9M-STT -113.319 9M-STT -52.477 9M-STT -50.223
AC-12 -12.005 AC-1 -35.230 AC-14 -20.236 AC-4 -37.069 AC-8 -20.472 AC-17 -43.490 AC-17 -28.297 AC-4 -11.777 9M-STT -28.933 AC-10 -18.351 9M-STT -21.023 AC-4 -17.927 AC-1 -29.573 AC-4 -15.760
9M-STT -10.114 AC-24 -8.274 AC-4 -17.528 AC-1 -15.271 AC-10 -16.517 AC-8 -11.003 AC-8 -13.415 AC-20 -6.846 AC-5 -8.222 AC-20 -17.305 AC-2 -12.819 AC-14 -15.589 AC-10 -7.229 AC-2 -12.263 AC-1 -6.538 AC-7 -5.704 AC-2 -11.858 AC-12 -10.410 AC-20 -13.261 AC-5 -6.772 AC-1 -9.805
AC-17 -6.442 AC-10 -5.568 AC-11 -9.723 AC-5 -4.989 AC-2 -10.953 AC-14 -5.686 AC-12 -8.884 AC-5 -6.226 AC-14 -4.712 AC-18 -5.541 AC-20 -4.964 AC-12 -8.322 AC-20 -5.036 AC-10 -8.097 AC-9 -5.867 AC-8 -4.616 AC-22 -4.023 AC-9 -4.279 AC-11 -7.092 AC-7 -4.910 AC-14 -6.869
AC-23 -4.906 AC-6 -3.882 AC-5 -3.917 AC-8 -3.928 AC-5 -6.407 AC-24 -4.471 AC-20 -6.361 AC-15 -4.765 AC-2 -3.480 AC-15 -3.606 AC-7 -3.880 AC-1 -4.911 AC-2 -4.200 AC-5 -4.646 AC-7 -4.653 AC-9 -3.104 AC-6 -3.390 AC-23 -3.847 AC-13 -4.732 AC-11 -3.640 AC-11 -4.177
AC-13 -4.593 AC-3 -2.825 AC-13 -3.193 AC-10 -3.629 AC-15 -4.633 AC-18 -3.194 AC-15 -3.578 AC-8 -4.387 AC-13 -2.533 AC-7 -2.533 AC-15 -3.604 AC-17 -4.261 AC-6 -2.959 AC-16 -3.405 AC-6 -4.001 AC-12 -2.425 AC-19 -1.946 AC-13 -3.588 AC-6 -4.112 AC-19 -2.925 AC-13 -3.309
AC-14 -3.695 AC-19 -2.109 AC-17 -1.911 AC-6 -3.583 AC-18 -3.750 AC-15 -2.577 AC-18 -3.300 AC-16 -2.967 AC-16 -2.052 AC-1 -1.808 AC-14 -3.486 AC-7 -3.585 AC-9 -2.550 AC-9 -3.181 AC-18 -2.838 AC-21 -1.694 AC-3 -1.183 AC-16 -2.889 AC-9 -3.584 AC-13 -2.109 AC-7 -3.134 AC-21 -2.572 AC-20 -1.603 AC-24 -1.134 AC-3 -2.219 AC-23 -2.860 AC-22 -1.993 AC-19 -2.389
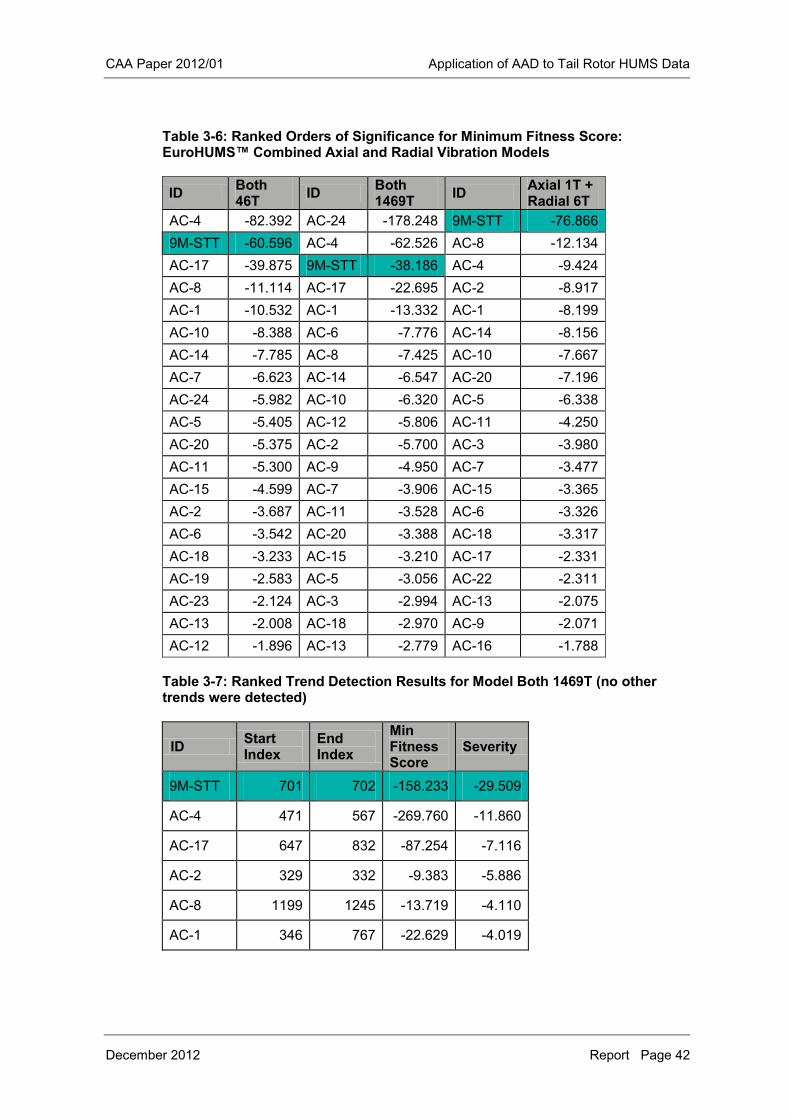
CAA Paper 2012/01 Application of AAD to Tail Rotor HUMS Data
December 2012 Report Page 42
Table 3-6: Ranked Orders of Significance for Minimum Fitness Score: EuroHUMS™ Combined Axial and Radial Vibration Models
ID Both 46T ID Both
1469T ID Axial 1T + Radial 6T
AC-4 -82.392 AC-24 -178.248 9M-STT -76.866 9M-STT -60.596 AC-4 -62.526 AC-8 -12.134 AC-17 -39.875 9M-STT -38.186 AC-4 -9.424 AC-8 -11.114 AC-17 -22.695 AC-2 -8.917 AC-1 -10.532 AC-1 -13.332 AC-1 -8.199 AC-10 -8.388 AC-6 -7.776 AC-14 -8.156 AC-14 -7.785 AC-8 -7.425 AC-10 -7.667 AC-7 -6.623 AC-14 -6.547 AC-20 -7.196 AC-24 -5.982 AC-10 -6.320 AC-5 -6.338 AC-5 -5.405 AC-12 -5.806 AC-11 -4.250 AC-20 -5.375 AC-2 -5.700 AC-3 -3.980 AC-11 -5.300 AC-9 -4.950 AC-7 -3.477 AC-15 -4.599 AC-7 -3.906 AC-15 -3.365 AC-2 -3.687 AC-11 -3.528 AC-6 -3.326 AC-6 -3.542 AC-20 -3.388 AC-18 -3.317 AC-18 -3.233 AC-15 -3.210 AC-17 -2.331 AC-19 -2.583 AC-5 -3.056 AC-22 -2.311 AC-23 -2.124 AC-3 -2.994 AC-13 -2.075 AC-13 -2.008 AC-18 -2.970 AC-9 -2.071 AC-12 -1.896 AC-13 -2.779 AC-16 -1.788
Table 3-7: Ranked Trend Detection Results for Model Both 1469T (no other trends were detected)
ID Start Index
End Index
Min Fitness Score
Severity
9M-STT 701 702 -158.233 -29.509
AC-4 471 567 -269.760 -11.860
AC-17 647 832 -87.254 -7.116
AC-2 329 332 -9.383 -5.886
AC-8 1199 1245 -13.719 -4.110
AC-1 346 767 -22.629 -4.019
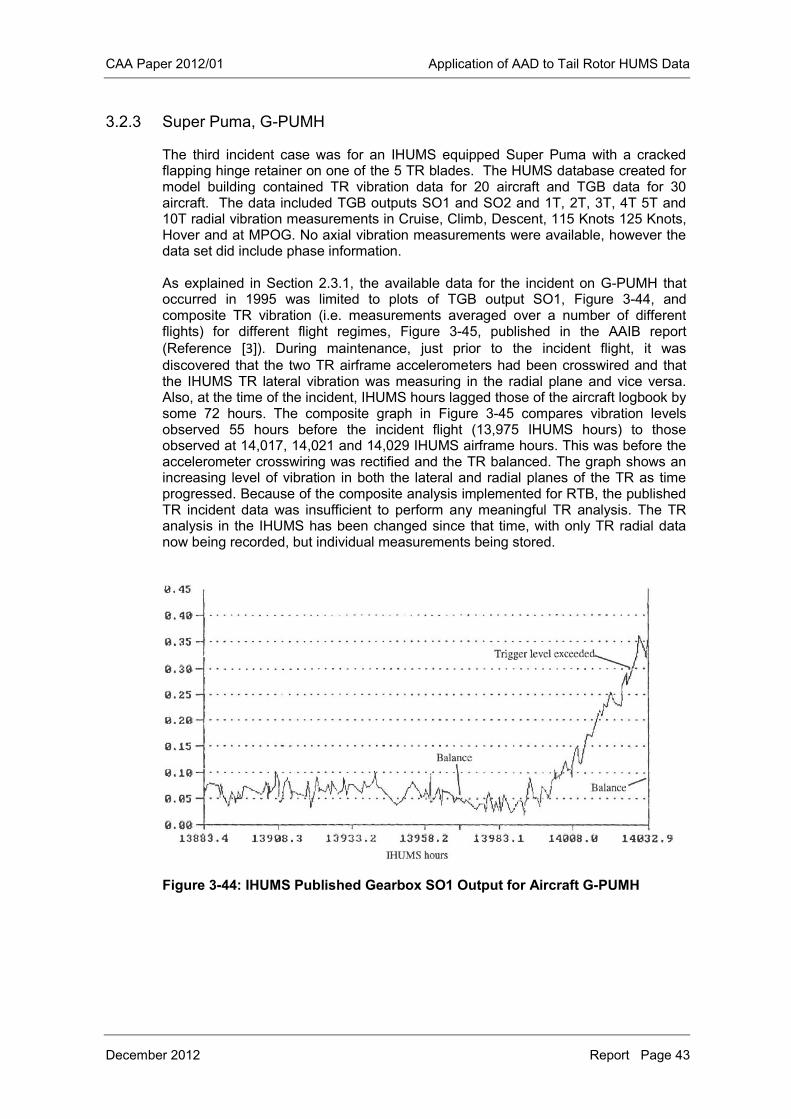
CAA Paper 2012/01 Application of AAD to Tail Rotor HUMS Data
December 2012 Report Page 43
3.2.3 Super Puma, G-PUMH
The third incident case was for an IHUMS equipped Super Puma with a cracked flapping hinge retainer on one of the 5 TR blades. The HUMS database created for model building contained TR vibration data for 20 aircraft and TGB data for 30 aircraft. The data included TGB outputs SO1 and SO2 and 1T, 2T, 3T, 4T 5T and 10T radial vibration measurements in Cruise, Climb, Descent, 115 Knots 125 Knots, Hover and at MPOG. No axial vibration measurements were available, however the data set did include phase information. As explained in Section 2.3.1, the available data for the incident on G-PUMH that occurred in 1995 was limited to plots of TGB output SO1, Figure 3-44, and composite TR vibration (i.e. measurements averaged over a number of different flights) for different flight regimes, Figure 3-45, published in the AAIB report (Reference [3]). During maintenance, just prior to the incident flight, it was discovered that the two TR airframe accelerometers had been crosswired and that the IHUMS TR lateral vibration was measuring in the radial plane and vice versa. Also, at the time of the incident, IHUMS hours lagged those of the aircraft logbook by some 72 hours. The composite graph in Figure 3-45 compares vibration levels observed 55 hours before the incident flight (13,975 IHUMS hours) to those observed at 14,017, 14,021 and 14,029 IHUMS airframe hours. This was before the accelerometer crosswiring was rectified and the TR balanced. The graph shows an increasing level of vibration in both the lateral and radial planes of the TR as time progressed. Because of the composite analysis implemented for RTB, the published TR incident data was insufficient to perform any meaningful TR analysis. The TR analysis in the IHUMS has been changed since that time, with only TR radial data now being recorded, but individual measurements being stored.
Figure 3-44: IHUMS Published Gearbox SO1 Output for Aircraft G-PUMH
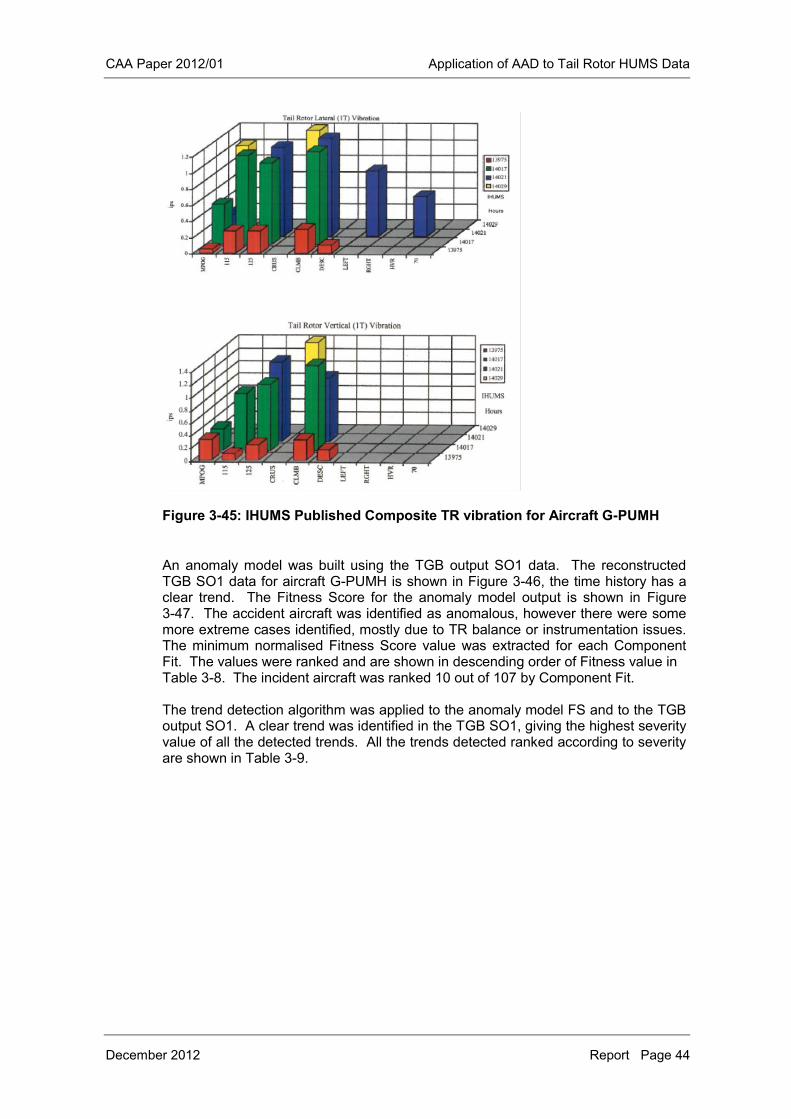
CAA Paper 2012/01 Application of AAD to Tail Rotor HUMS Data
December 2012 Report Page 44
Figure 3-45: IHUMS Published Composite TR vibration for Aircraft G-PUMH
An anomaly model was built using the TGB output SO1 data. The reconstructed TGB SO1 data for aircraft G-PUMH is shown in Figure 3-46, the time history has a clear trend. The Fitness Score for the anomaly model output is shown in Figure 3-47. The accident aircraft was identified as anomalous, however there were some more extreme cases identified, mostly due to TR balance or instrumentation issues. The minimum normalised Fitness Score value was extracted for each Component Fit. The values were ranked and are shown in descending order of Fitness value in Table 3-8. The incident aircraft was ranked 10 out of 107 by Component Fit. The trend detection algorithm was applied to the anomaly model FS and to the TGB output SO1. A clear trend was identified in the TGB SO1, giving the highest severity value of all the detected trends. All the trends detected ranked according to severity are shown in Table 3-9.
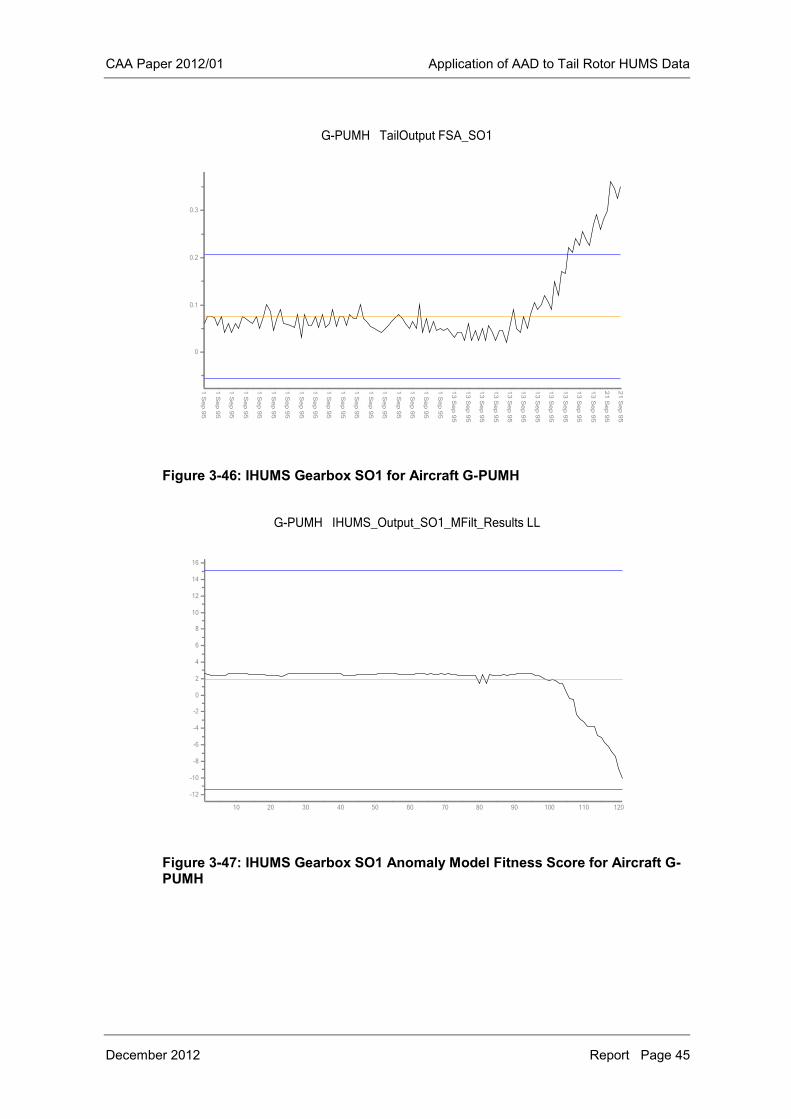
CAA Paper 2012/01 Application of AAD to Tail Rotor HUMS Data
December 2012 Report Page 45
Figure 3-46: IHUMS Gearbox SO1 for Aircraft G-PUMH
Figure 3-47: IHUMS Gearbox SO1 Anomaly Model Fitness Score for Aircraft G-PUMH
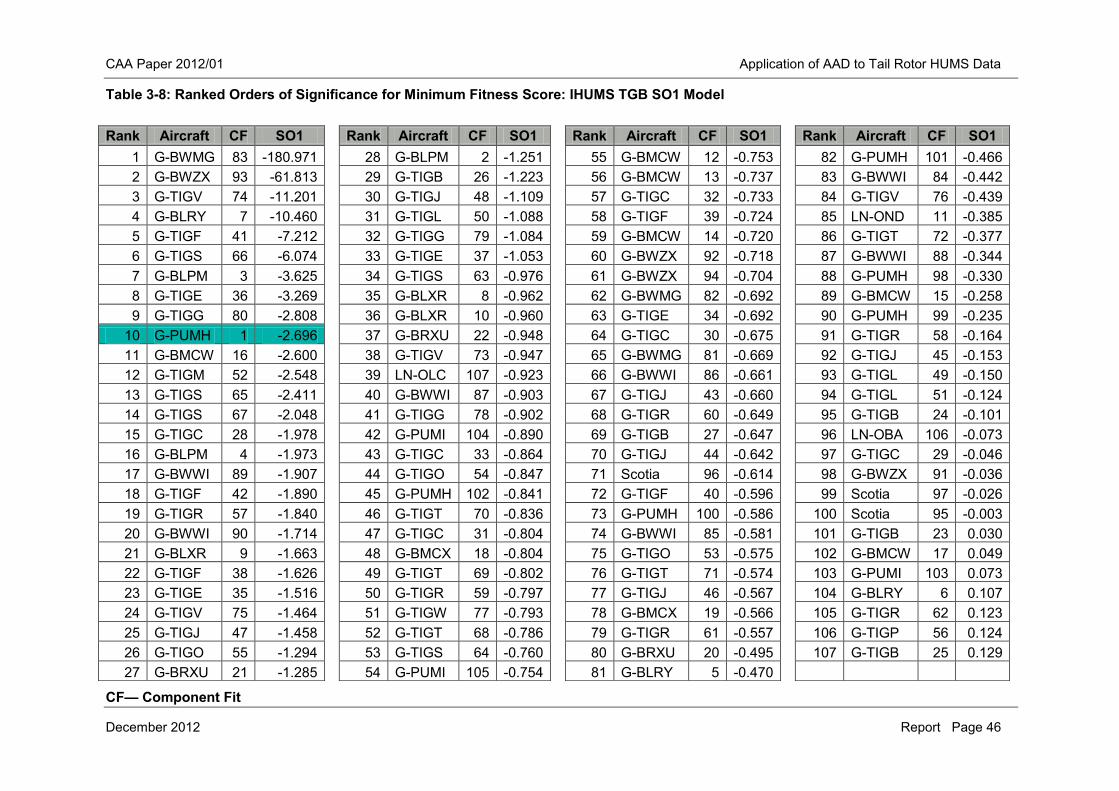
CAA Paper 2012/01 Application of AAD to Tail Rotor HUMS Data
December 2012 Report Page 46
Table 3-8: Ranked Orders of Significance for Minimum Fitness Score: IHUMS TGB SO1 Model
CF— Component Fit
Rank Aircraft CF SO1 Rank Aircraft CF SO1 Rank Aircraft CF SO1 Rank Aircraft CF SO1 1 G-BWMG 83 -180.971 28 G-BLPM 2 -1.251 55 G-BMCW 12 -0.753 82 G-PUMH 101 -0.466 2 G-BWZX 93 -61.813 29 G-TIGB 26 -1.223 56 G-BMCW 13 -0.737 83 G-BWWI 84 -0.442 3 G-TIGV 74 -11.201 30 G-TIGJ 48 -1.109 57 G-TIGC 32 -0.733 84 G-TIGV 76 -0.439 4 G-BLRY 7 -10.460 31 G-TIGL 50 -1.088 58 G-TIGF 39 -0.724 85 LN-OND 11 -0.385 5 G-TIGF 41 -7.212 32 G-TIGG 79 -1.084 59 G-BMCW 14 -0.720 86 G-TIGT 72 -0.377 6 G-TIGS 66 -6.074 33 G-TIGE 37 -1.053 60 G-BWZX 92 -0.718 87 G-BWWI 88 -0.344 7 G-BLPM 3 -3.625 34 G-TIGS 63 -0.976 61 G-BWZX 94 -0.704 88 G-PUMH 98 -0.330 8 G-TIGE 36 -3.269 35 G-BLXR 8 -0.962 62 G-BWMG 82 -0.692 89 G-BMCW 15 -0.258 9 G-TIGG 80 -2.808 36 G-BLXR 10 -0.960 63 G-TIGE 34 -0.692 90 G-PUMH 99 -0.235
10 G-PUMH 1 -2.696 37 G-BRXU 22 -0.948 64 G-TIGC 30 -0.675 91 G-TIGR 58 -0.164 11 G-BMCW 16 -2.600 38 G-TIGV 73 -0.947 65 G-BWMG 81 -0.669 92 G-TIGJ 45 -0.153 12 G-TIGM 52 -2.548 39 LN-OLC 107 -0.923 66 G-BWWI 86 -0.661 93 G-TIGL 49 -0.150 13 G-TIGS 65 -2.411 40 G-BWWI 87 -0.903 67 G-TIGJ 43 -0.660 94 G-TIGL 51 -0.124 14 G-TIGS 67 -2.048 41 G-TIGG 78 -0.902 68 G-TIGR 60 -0.649 95 G-TIGB 24 -0.101 15 G-TIGC 28 -1.978 42 G-PUMI 104 -0.890 69 G-TIGB 27 -0.647 96 LN-OBA 106 -0.073 16 G-BLPM 4 -1.973 43 G-TIGC 33 -0.864 70 G-TIGJ 44 -0.642 97 G-TIGC 29 -0.046 17 G-BWWI 89 -1.907 44 G-TIGO 54 -0.847 71 Scotia 96 -0.614 98 G-BWZX 91 -0.036 18 G-TIGF 42 -1.890 45 G-PUMH 102 -0.841 72 G-TIGF 40 -0.596 99 Scotia 97 -0.026 19 G-TIGR 57 -1.840 46 G-TIGT 70 -0.836 73 G-PUMH 100 -0.586 100 Scotia 95 -0.003 20 G-BWWI 90 -1.714 47 G-TIGC 31 -0.804 74 G-BWWI 85 -0.581 101 G-TIGB 23 0.030 21 G-BLXR 9 -1.663 48 G-BMCX 18 -0.804 75 G-TIGO 53 -0.575 102 G-BMCW 17 0.049 22 G-TIGF 38 -1.626 49 G-TIGT 69 -0.802 76 G-TIGT 71 -0.574 103 G-PUMI 103 0.073 23 G-TIGE 35 -1.516 50 G-TIGR 59 -0.797 77 G-TIGJ 46 -0.567 104 G-BLRY 6 0.107 24 G-TIGV 75 -1.464 51 G-TIGW 77 -0.793 78 G-BMCX 19 -0.566 105 G-TIGR 62 0.123 25 G-TIGJ 47 -1.458 52 G-TIGT 68 -0.786 79 G-TIGR 61 -0.557 106 G-TIGP 56 0.124 26 G-TIGO 55 -1.294 53 G-TIGS 64 -0.760 80 G-BRXU 20 -0.495 107 G-TIGB 25 0.129 27 G-BRXU 21 -1.285 54 G-PUMI 105 -0.754 81 G-BLRY 5 -0.470
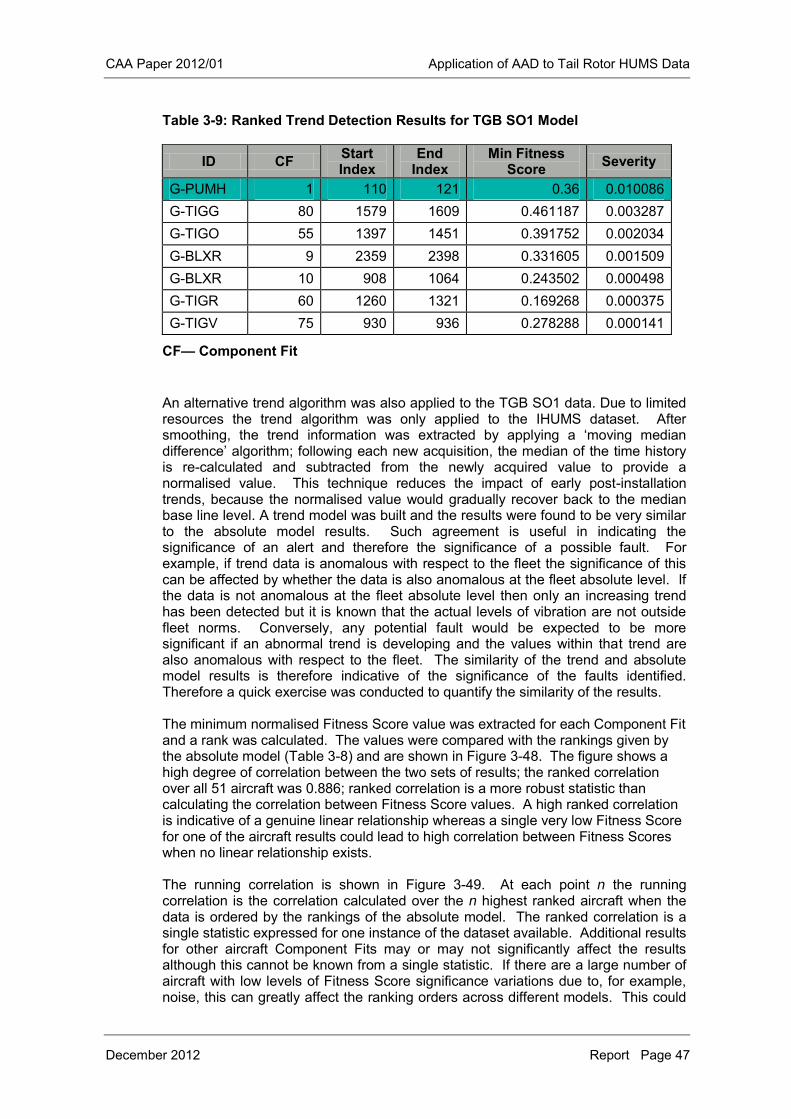
CAA Paper 2012/01 Application of AAD to Tail Rotor HUMS Data
December 2012 Report Page 47
Table 3-9: Ranked Trend Detection Results for TGB SO1 Model
ID CF Start Index
End Index
Min Fitness Score Severity
G-PUMH 1 110 121 0.36 0.010086 G-TIGG 80 1579 1609 0.461187 0.003287 G-TIGO 55 1397 1451 0.391752 0.002034 G-BLXR 9 2359 2398 0.331605 0.001509 G-BLXR 10 908 1064 0.243502 0.000498 G-TIGR 60 1260 1321 0.169268 0.000375 G-TIGV 75 930 936 0.278288 0.000141
CF— Component Fit An alternative trend algorithm was also applied to the TGB SO1 data. Due to limited resources the trend algorithm was only applied to the IHUMS dataset. After smoothing, the trend information was extracted by applying a ‘moving median difference’ algorithm; following each new acquisition, the median of the time history is re-calculated and subtracted from the newly acquired value to provide a normalised value. This technique reduces the impact of early post-installation trends, because the normalised value would gradually recover back to the median base line level. A trend model was built and the results were found to be very similar to the absolute model results. Such agreement is useful in indicating the significance of an alert and therefore the significance of a possible fault. For example, if trend data is anomalous with respect to the fleet the significance of this can be affected by whether the data is also anomalous at the fleet absolute level. If the data is not anomalous at the fleet absolute level then only an increasing trend has been detected but it is known that the actual levels of vibration are not outside fleet norms. Conversely, any potential fault would be expected to be more significant if an abnormal trend is developing and the values within that trend are also anomalous with respect to the fleet. The similarity of the trend and absolute model results is therefore indicative of the significance of the faults identified. Therefore a quick exercise was conducted to quantify the similarity of the results. The minimum normalised Fitness Score value was extracted for each Component Fit and a rank was calculated. The values were compared with the rankings given by the absolute model (Table 3-8) and are shown in Figure 3-48. The figure shows a high degree of correlation between the two sets of results; the ranked correlation over all 51 aircraft was 0.886; ranked correlation is a more robust statistic than calculating the correlation between Fitness Score values. A high ranked correlation is indicative of a genuine linear relationship whereas a single very low Fitness Score for one of the aircraft results could lead to high correlation between Fitness Scores when no linear relationship exists. The running correlation is shown in Figure 3-49. At each point n the running correlation is the correlation calculated over the n highest ranked aircraft when the data is ordered by the rankings of the absolute model. The ranked correlation is a single statistic expressed for one instance of the dataset available. Additional results for other aircraft Component Fits may or may not significantly affect the results although this cannot be known from a single statistic. If there are a large number of aircraft with low levels of Fitness Score significance variations due to, for example, noise, this can greatly affect the ranking orders across different models. This could
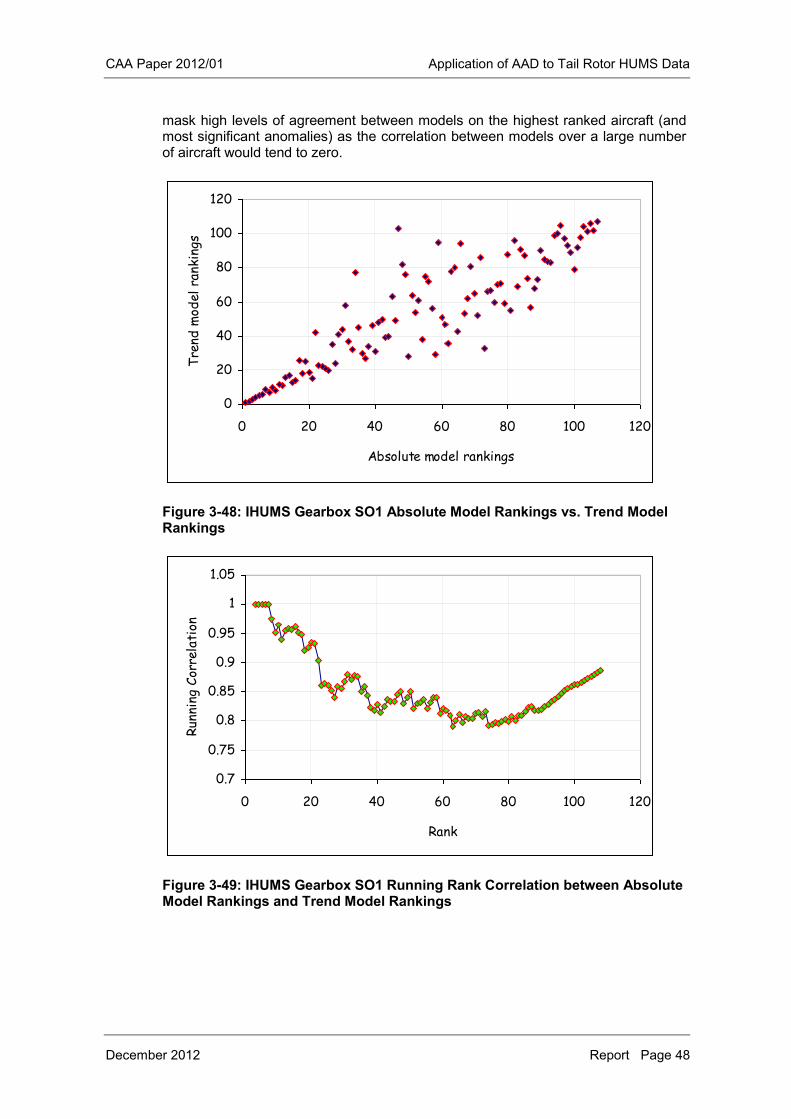
CAA Paper 2012/01 Application of AAD to Tail Rotor HUMS Data
December 2012 Report Page 48
mask high levels of agreement between models on the highest ranked aircraft (and most significant anomalies) as the correlation between models over a large number of aircraft would tend to zero.
Figure 3-48: IHUMS Gearbox SO1 Absolute Model Rankings vs. Trend Model Rankings
Figure 3-49: IHUMS Gearbox SO1 Running Rank Correlation between Absolute Model Rankings and Trend Model Rankings
0
20
40
60
80
100
120
0 20 40 60 80 100 120
Absolute model rankings
Tre
nd m
odel
ran
king
s
0.7
0.75
0.8
0.85
0.9
0.95
1
1.05
0 20 40 60 80 100 120
Rank
Run
ning
Cor
rela
tion
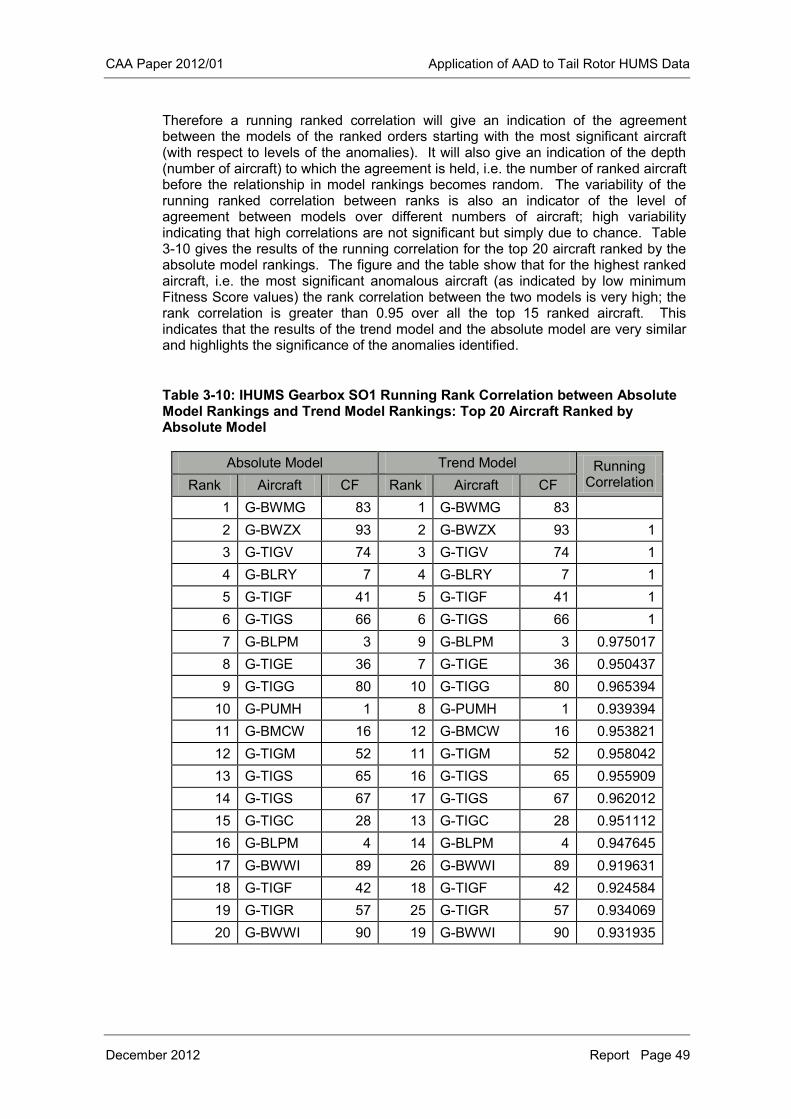
CAA Paper 2012/01 Application of AAD to Tail Rotor HUMS Data
December 2012 Report Page 49
Therefore a running ranked correlation will give an indication of the agreement between the models of the ranked orders starting with the most significant aircraft (with respect to levels of the anomalies). It will also give an indication of the depth (number of aircraft) to which the agreement is held, i.e. the number of ranked aircraft before the relationship in model rankings becomes random. The variability of the running ranked correlation between ranks is also an indicator of the level of agreement between models over different numbers of aircraft; high variability indicating that high correlations are not significant but simply due to chance. Table 3-10 gives the results of the running correlation for the top 20 aircraft ranked by the absolute model rankings. The figure and the table show that for the highest ranked aircraft, i.e. the most significant anomalous aircraft (as indicated by low minimum Fitness Score values) the rank correlation between the two models is very high; the rank correlation is greater than 0.95 over all the top 15 ranked aircraft. This indicates that the results of the trend model and the absolute model are very similar and highlights the significance of the anomalies identified.
Table 3-10: IHUMS Gearbox SO1 Running Rank Correlation between Absolute Model Rankings and Trend Model Rankings: Top 20 Aircraft Ranked by Absolute Model
Absolute Model Trend Model Running Correlation Rank Aircraft CF Rank Aircraft CF
1 G-BWMG 83 1 G-BWMG 83 2 G-BWZX 93 2 G-BWZX 93 1 3 G-TIGV 74 3 G-TIGV 74 1 4 G-BLRY 7 4 G-BLRY 7 1 5 G-TIGF 41 5 G-TIGF 41 1 6 G-TIGS 66 6 G-TIGS 66 1 7 G-BLPM 3 9 G-BLPM 3 0.975017 8 G-TIGE 36 7 G-TIGE 36 0.950437 9 G-TIGG 80 10 G-TIGG 80 0.965394
10 G-PUMH 1 8 G-PUMH 1 0.939394 11 G-BMCW 16 12 G-BMCW 16 0.953821 12 G-TIGM 52 11 G-TIGM 52 0.958042 13 G-TIGS 65 16 G-TIGS 65 0.955909 14 G-TIGS 67 17 G-TIGS 67 0.962012 15 G-TIGC 28 13 G-TIGC 28 0.951112 16 G-BLPM 4 14 G-BLPM 4 0.947645 17 G-BWWI 89 26 G-BWWI 89 0.919631 18 G-TIGF 42 18 G-TIGF 42 0.924584 19 G-TIGR 57 25 G-TIGR 57 0.934069 20 G-BWWI 90 19 G-BWWI 90 0.931935
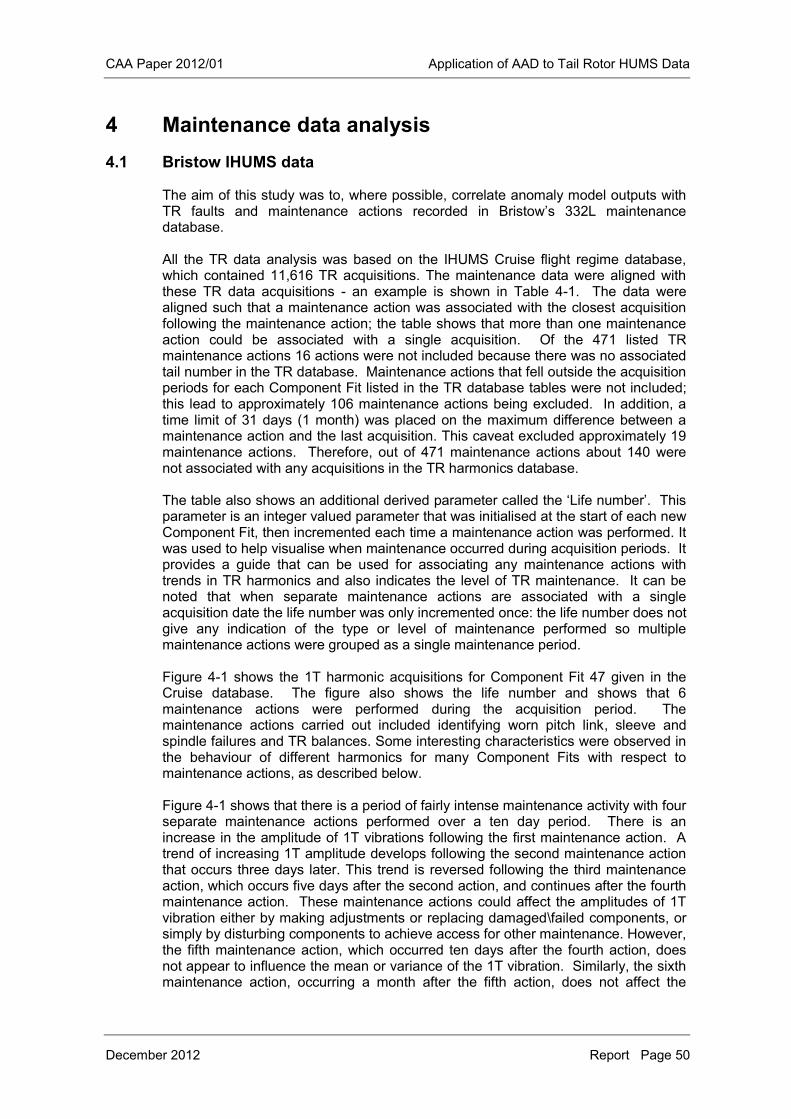
CAA Paper 2012/01 Application of AAD to Tail Rotor HUMS Data
December 2012 Report Page 50
4 Maintenance data analysis
4.1 Bristow IHUMS data
The aim of this study was to, where possible, correlate anomaly model outputs with TR faults and maintenance actions recorded in Bristow’s 332L maintenance database. All the TR data analysis was based on the IHUMS Cruise flight regime database, which contained 11,616 TR acquisitions. The maintenance data were aligned with these TR data acquisitions - an example is shown in Table 4-1. The data were aligned such that a maintenance action was associated with the closest acquisition following the maintenance action; the table shows that more than one maintenance action could be associated with a single acquisition. Of the 471 listed TR maintenance actions 16 actions were not included because there was no associated tail number in the TR database. Maintenance actions that fell outside the acquisition periods for each Component Fit listed in the TR database tables were not included; this lead to approximately 106 maintenance actions being excluded. In addition, a time limit of 31 days (1 month) was placed on the maximum difference between a maintenance action and the last acquisition. This caveat excluded approximately 19 maintenance actions. Therefore, out of 471 maintenance actions about 140 were not associated with any acquisitions in the TR harmonics database. The table also shows an additional derived parameter called the ‘Life number’. This parameter is an integer valued parameter that was initialised at the start of each new Component Fit, then incremented each time a maintenance action was performed. It was used to help visualise when maintenance occurred during acquisition periods. It provides a guide that can be used for associating any maintenance actions with trends in TR harmonics and also indicates the level of TR maintenance. It can be noted that when separate maintenance actions are associated with a single acquisition date the life number was only incremented once: the life number does not give any indication of the type or level of maintenance performed so multiple maintenance actions were grouped as a single maintenance period. Figure 4-1 shows the 1T harmonic acquisitions for Component Fit 47 given in the Cruise database. The figure also shows the life number and shows that 6 maintenance actions were performed during the acquisition period. The maintenance actions carried out included identifying worn pitch link, sleeve and spindle failures and TR balances. Some interesting characteristics were observed in the behaviour of different harmonics for many Component Fits with respect to maintenance actions, as described below. Figure 4-1 shows that there is a period of fairly intense maintenance activity with four separate maintenance actions performed over a ten day period. There is an increase in the amplitude of 1T vibrations following the first maintenance action. A trend of increasing 1T amplitude develops following the second maintenance action that occurs three days later. This trend is reversed following the third maintenance action, which occurs five days after the second action, and continues after the fourth maintenance action. These maintenance actions could affect the amplitudes of 1T vibration either by making adjustments or replacing damaged\failed components, or simply by disturbing components to achieve access for other maintenance. However, the fifth maintenance action, which occurred ten days after the fourth action, does not appear to influence the mean or variance of the 1T vibration. Similarly, the sixth maintenance action, occurring a month after the fifth action, does not affect the
CAA Paper 2012/01 Application of AAD to Tail Rotor HUMS Data
December 2012 Report Page 51
levels of 1T vibration. In these cases it may be that the action performed would not influence the performance of the TR. Alternatively, the maintenance action details that worn pitch links were observed but does not indicate whether any action was performed to rectify the problem, or indicate the level of wear found. The figure also shows another feature, where after sequence number 106 (date 27/10/06) a step change in the mean level of 1T vibration can be seen. However, there is no recorded maintenance action around this date to indicate a fault had occurred and was rectified, or that the act of performing a maintenance action lead to a change in vibration levels. It is possible that daily checks, such as TR greasing (recorded separately under routine maintenance), could affect recorded TR vibration levels.
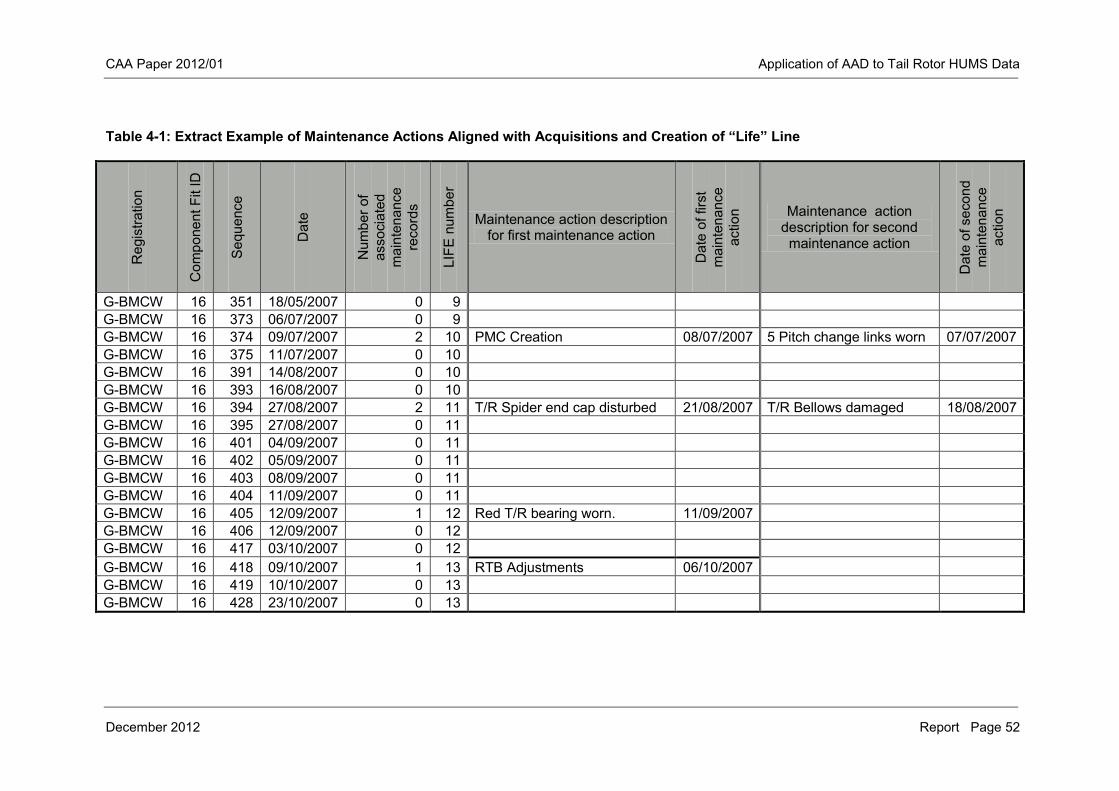
CAA Paper 2012/01 Application of AAD to Tail Rotor HUMS Data
December 2012 Report Page 52
Table 4-1: Extract Example of Maintenance Actions Aligned with Acquisitions and Creation of “Life” Line R
egis
tratio
n
Com
pone
nt F
it ID
Seq
uenc
e
Dat
e
Num
ber o
f as
soci
ated
m
aint
enan
ce
reco
rds
LIFE
num
ber
Maintenance action description for first maintenance action
Dat
e of
firs
t m
aint
enan
ce
actio
n Maintenance action description for second
maintenance action
Dat
e of
sec
ond
mai
nten
ance
ac
tion
G-BMCW 16 351 18/05/2007 0 9 G-BMCW 16 373 06/07/2007 0 9 G-BMCW 16 374 09/07/2007 2 10 PMC Creation 08/07/2007 5 Pitch change links worn 07/07/2007 G-BMCW 16 375 11/07/2007 0 10 G-BMCW 16 391 14/08/2007 0 10 G-BMCW 16 393 16/08/2007 0 10 G-BMCW 16 394 27/08/2007 2 11 T/R Spider end cap disturbed 21/08/2007 T/R Bellows damaged 18/08/2007 G-BMCW 16 395 27/08/2007 0 11 G-BMCW 16 401 04/09/2007 0 11 G-BMCW 16 402 05/09/2007 0 11 G-BMCW 16 403 08/09/2007 0 11 G-BMCW 16 404 11/09/2007 0 11 G-BMCW 16 405 12/09/2007 1 12 Red T/R bearing worn. 11/09/2007 G-BMCW 16 406 12/09/2007 0 12 G-BMCW 16 417 03/10/2007 0 12 G-BMCW 16 418 09/10/2007 1 13 RTB Adjustments 06/10/2007 G-BMCW 16 419 10/10/2007 0 13 G-BMCW 16 428 23/10/2007 0 13
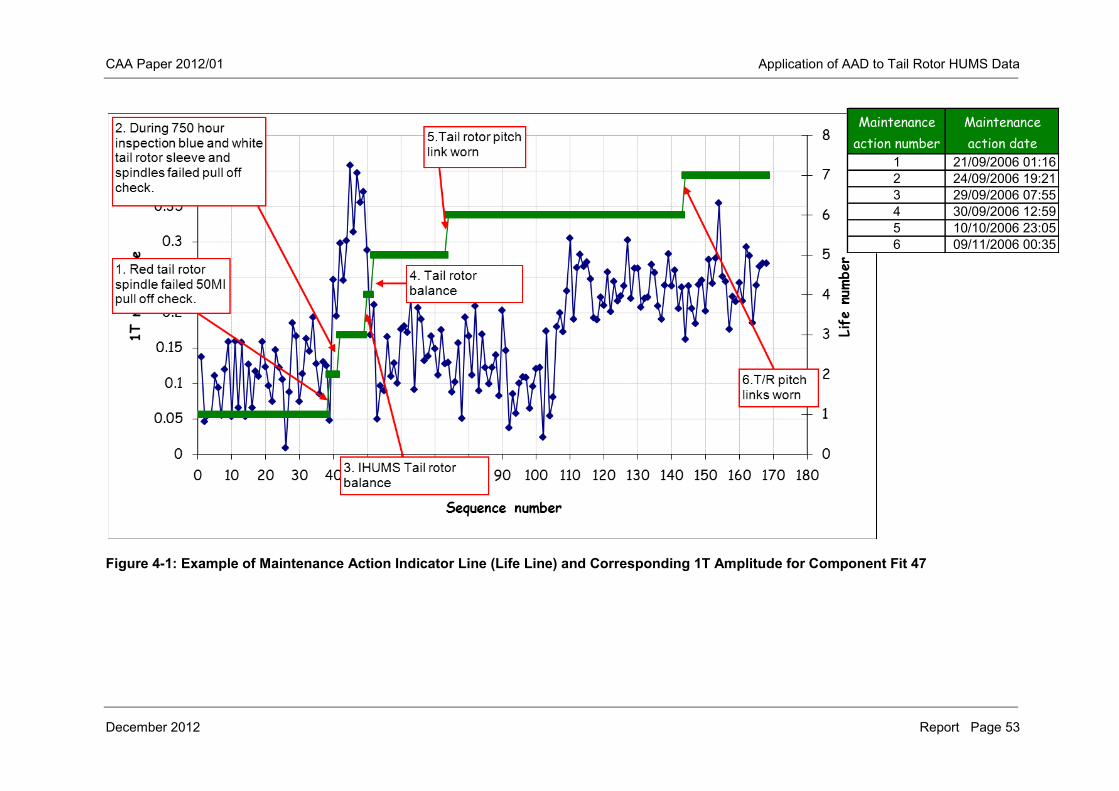
CAA Paper 2012/01 Application of AAD to Tail Rotor HUMS Data
December 2012 Report Page 53
Figure 4-1: Example of Maintenance Action Indicator Line (Life Line) and Corresponding 1T Amplitude for Component Fit 47
Maintenance
action number
Maintenance
action date
1 21/09/2006 01:162 24/09/2006 19:213 29/09/2006 07:554 30/09/2006 12:595 10/10/2006 23:056 09/11/2006 00:35
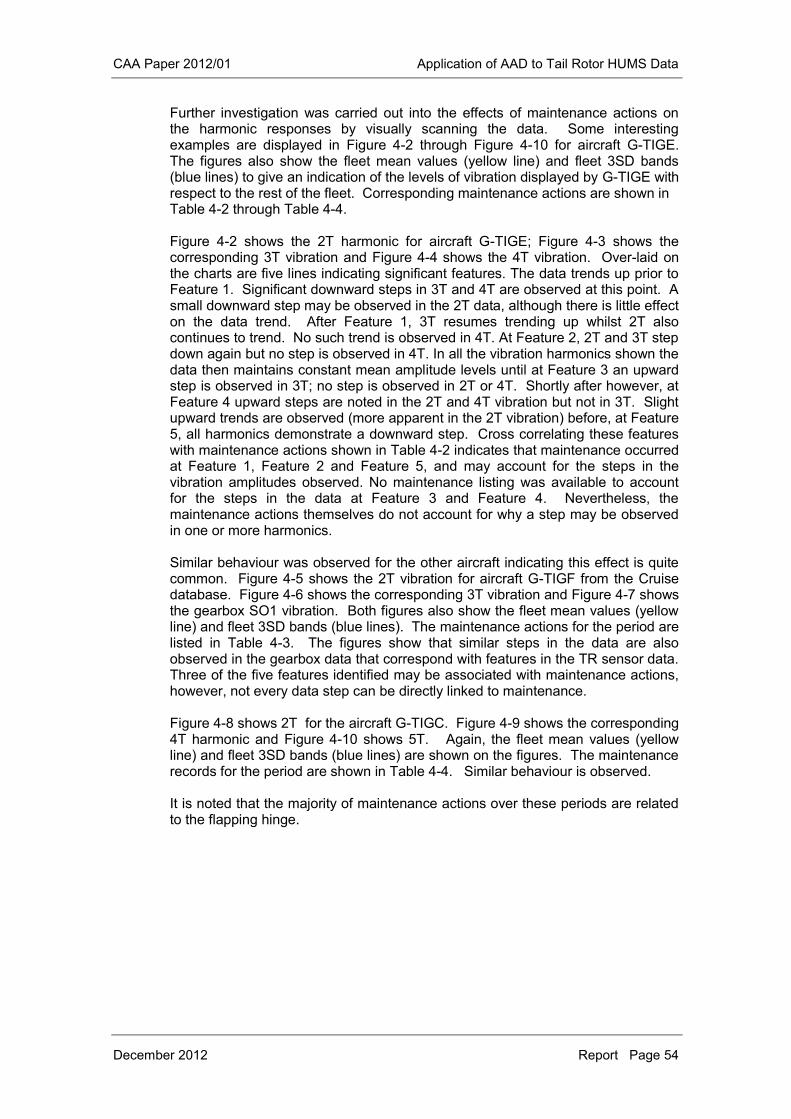
CAA Paper 2012/01 Application of AAD to Tail Rotor HUMS Data
December 2012 Report Page 54
Further investigation was carried out into the effects of maintenance actions on the harmonic responses by visually scanning the data. Some interesting examples are displayed in Figure 4-2 through Figure 4-10 for aircraft G-TIGE. The figures also show the fleet mean values (yellow line) and fleet 3SD bands (blue lines) to give an indication of the levels of vibration displayed by G-TIGE with respect to the rest of the fleet. Corresponding maintenance actions are shown in Table 4-2 through Table 4-4. Figure 4-2 shows the 2T harmonic for aircraft G-TIGE; Figure 4-3 shows the corresponding 3T vibration and Figure 4-4 shows the 4T vibration. Over-laid on the charts are five lines indicating significant features. The data trends up prior to Feature 1. Significant downward steps in 3T and 4T are observed at this point. A small downward step may be observed in the 2T data, although there is little effect on the data trend. After Feature 1, 3T resumes trending up whilst 2T also continues to trend. No such trend is observed in 4T. At Feature 2, 2T and 3T step down again but no step is observed in 4T. In all the vibration harmonics shown the data then maintains constant mean amplitude levels until at Feature 3 an upward step is observed in 3T; no step is observed in 2T or 4T. Shortly after however, at Feature 4 upward steps are noted in the 2T and 4T vibration but not in 3T. Slight upward trends are observed (more apparent in the 2T vibration) before, at Feature 5, all harmonics demonstrate a downward step. Cross correlating these features with maintenance actions shown in Table 4-2 indicates that maintenance occurred at Feature 1, Feature 2 and Feature 5, and may account for the steps in the vibration amplitudes observed. No maintenance listing was available to account for the steps in the data at Feature 3 and Feature 4. Nevertheless, the maintenance actions themselves do not account for why a step may be observed in one or more harmonics. Similar behaviour was observed for the other aircraft indicating this effect is quite common. Figure 4-5 shows the 2T vibration for aircraft G-TIGF from the Cruise database. Figure 4-6 shows the corresponding 3T vibration and Figure 4-7 shows the gearbox SO1 vibration. Both figures also show the fleet mean values (yellow line) and fleet 3SD bands (blue lines). The maintenance actions for the period are listed in Table 4-3. The figures show that similar steps in the data are also observed in the gearbox data that correspond with features in the TR sensor data. Three of the five features identified may be associated with maintenance actions, however, not every data step can be directly linked to maintenance. Figure 4-8 shows 2T for the aircraft G-TIGC. Figure 4-9 shows the corresponding 4T harmonic and Figure 4-10 shows 5T. Again, the fleet mean values (yellow line) and fleet 3SD bands (blue lines) are shown on the figures. The maintenance records for the period are shown in Table 4-4. Similar behaviour is observed. It is noted that the majority of maintenance actions over these periods are related to the flapping hinge.
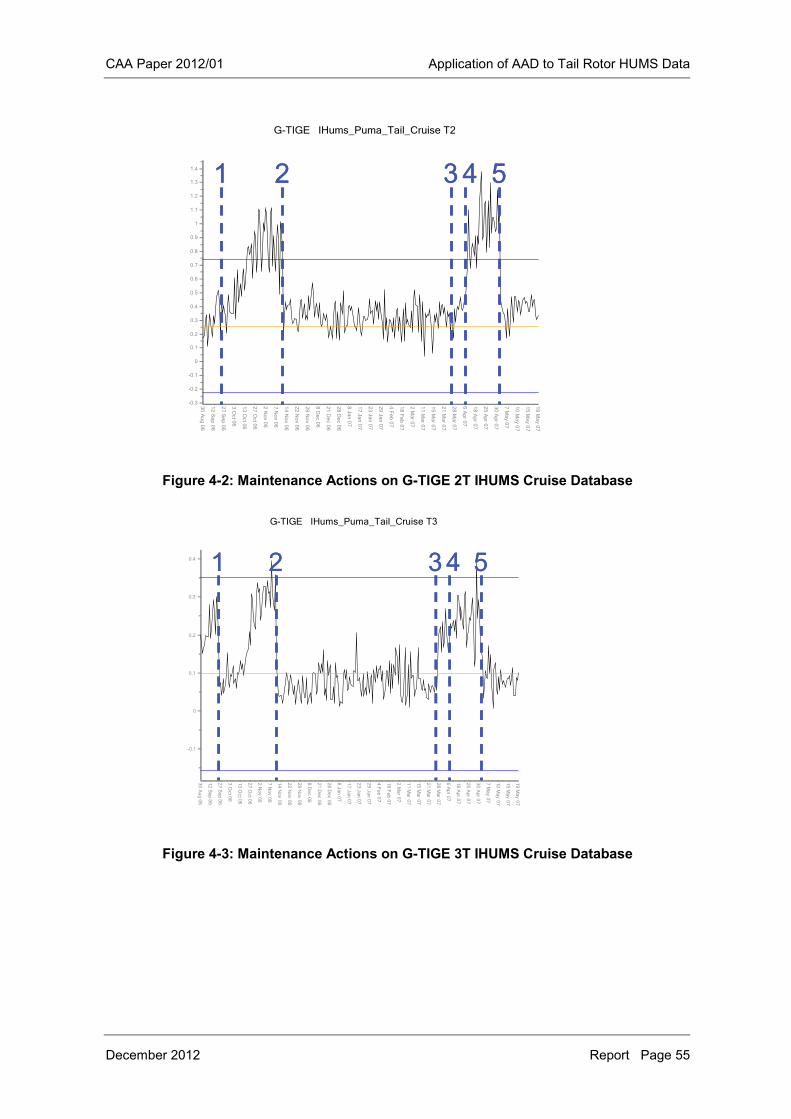
CAA Paper 2012/01 Application of AAD to Tail Rotor HUMS Data
December 2012 Report Page 55
Figure 4-2: Maintenance Actions on G-TIGE 2T IHUMS Cruise Database
Figure 4-3: Maintenance Actions on G-TIGE 3T IHUMS Cruise Database
1 2 3 541 2 3 541 2 3 54
G-TIGE IHums_Puma_Tail_Cruise T3
30
Au
g 0
6
12
Se
p 0
6
27
Se
p 0
6
3 O
ct 0
6
13
Oc
t 06
27
Oc
t 06
2 N
ov
06
7 N
ov
06
14
No
v 0
6
22
No
v 0
6
29
No
v 0
6
8 D
ec
06
21
De
c 0
6
28
De
c 0
6
8 J
an
07
17
Ja
n 0
7
23
Ja
n 0
7
29
Ja
n 0
7
4 F
eb
07
18
Fe
b 0
7
2 M
ar 0
7
11
Ma
r 07
15
Ma
r 07
21
Ma
r 07
28
Ma
r 07
6 A
pr 0
7
18
Ap
r 07
25
Ap
r 07
30
Ap
r 07
7 M
ay
07
10
Ma
y 0
7
15
Ma
y 0
7
19
Ma
y 0
7
-0.1
0
0.1
0.2
0.3
0.4 1 2 3 54
G-TIGE IHums_Puma_Tail_Cruise T3
30
Au
g 0
6
12
Se
p 0
6
27
Se
p 0
6
3 O
ct 0
6
13
Oc
t 06
27
Oc
t 06
2 N
ov
06
7 N
ov
06
14
No
v 0
6
22
No
v 0
6
29
No
v 0
6
8 D
ec
06
21
De
c 0
6
28
De
c 0
6
8 J
an
07
17
Ja
n 0
7
23
Ja
n 0
7
29
Ja
n 0
7
4 F
eb
07
18
Fe
b 0
7
2 M
ar 0
7
11
Ma
r 07
15
Ma
r 07
21
Ma
r 07
28
Ma
r 07
6 A
pr 0
7
18
Ap
r 07
25
Ap
r 07
30
Ap
r 07
7 M
ay
07
10
Ma
y 0
7
15
Ma
y 0
7
19
Ma
y 0
7
-0.1
0
0.1
0.2
0.3
0.4 1 2 3 541 2 3 54
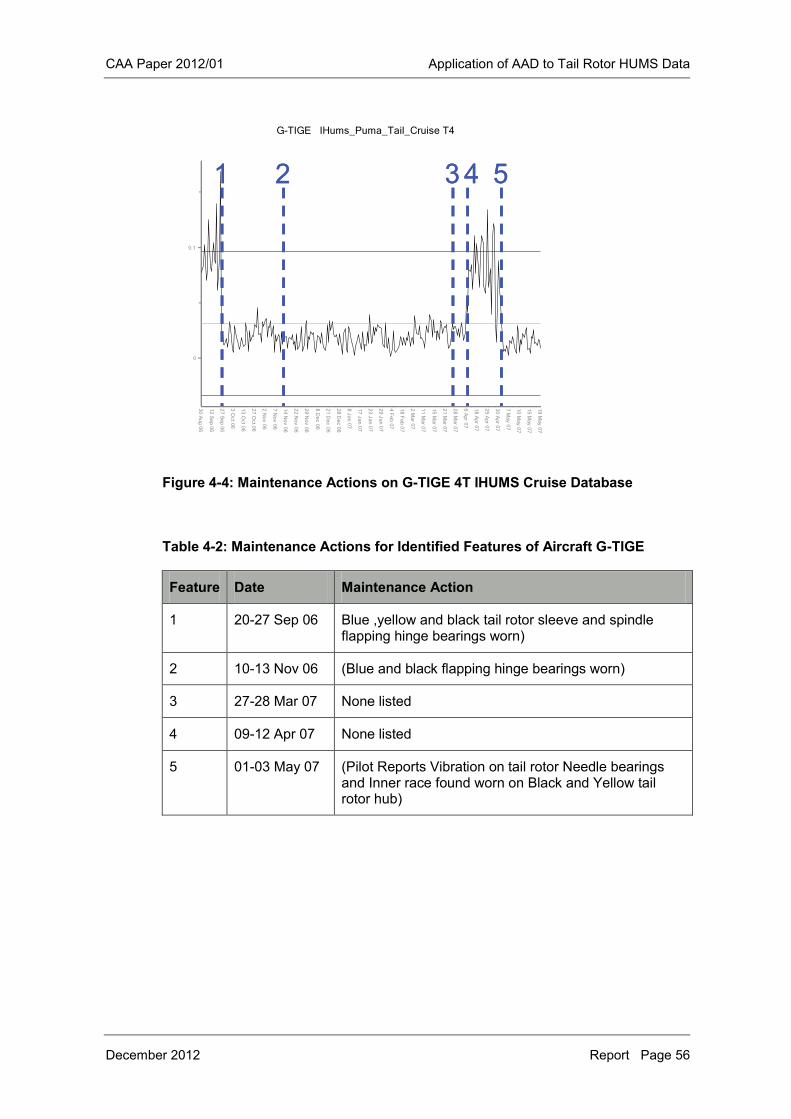
CAA Paper 2012/01 Application of AAD to Tail Rotor HUMS Data
December 2012 Report Page 56
Figure 4-4: Maintenance Actions on G-TIGE 4T IHUMS Cruise Database
Table 4-2: Maintenance Actions for Identified Features of Aircraft G-TIGE
Feature Date Maintenance Action
1 20-27 Sep 06 Blue ,yellow and black tail rotor sleeve and spindle flapping hinge bearings worn)
2 10-13 Nov 06 (Blue and black flapping hinge bearings worn)
3 27-28 Mar 07 None listed
4 09-12 Apr 07 None listed
5 01-03 May 07 (Pilot Reports Vibration on tail rotor Needle bearings and Inner race found worn on Black and Yellow tail rotor hub)
G-TIGE IHums_Puma_Tail_Cruise T4
30
Au
g 0
6
12
Se
p 0
6
27
Se
p 0
6
3 O
ct 0
6
13
Oc
t 06
27
Oc
t 06
2 N
ov
06
7 N
ov
06
14
No
v 0
6
22
No
v 0
6
29
No
v 0
6
8 D
ec
06
21
De
c 0
6
28
De
c 0
6
8 J
an
07
17
Ja
n 0
7
23
Ja
n 0
7
29
Ja
n 0
7
4 F
eb
07
18
Fe
b 0
7
2 M
ar 0
7
11
Ma
r 07
15
Ma
r 07
21
Ma
r 07
28
Ma
r 07
6 A
pr 0
7
18
Ap
r 07
25
Ap
r 07
30
Ap
r 07
7 M
ay
07
10
Ma
y 0
7
15
Ma
y 0
7
19
Ma
y 0
7
0
0.1
1 2 3 54
G-TIGE IHums_Puma_Tail_Cruise T4
30
Au
g 0
6
12
Se
p 0
6
27
Se
p 0
6
3 O
ct 0
6
13
Oc
t 06
27
Oc
t 06
2 N
ov
06
7 N
ov
06
14
No
v 0
6
22
No
v 0
6
29
No
v 0
6
8 D
ec
06
21
De
c 0
6
28
De
c 0
6
8 J
an
07
17
Ja
n 0
7
23
Ja
n 0
7
29
Ja
n 0
7
4 F
eb
07
18
Fe
b 0
7
2 M
ar 0
7
11
Ma
r 07
15
Ma
r 07
21
Ma
r 07
28
Ma
r 07
6 A
pr 0
7
18
Ap
r 07
25
Ap
r 07
30
Ap
r 07
7 M
ay
07
10
Ma
y 0
7
15
Ma
y 0
7
19
Ma
y 0
7
0
0.1
1 2 3 541 2 3 54
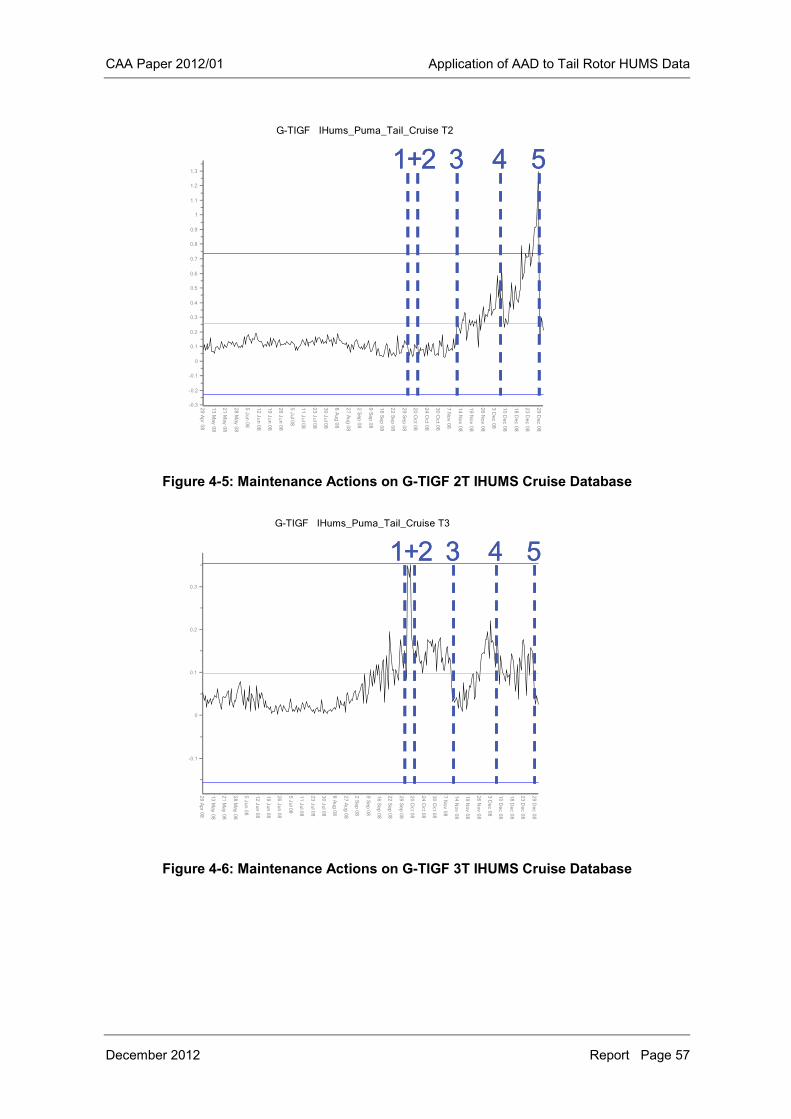
CAA Paper 2012/01 Application of AAD to Tail Rotor HUMS Data
December 2012 Report Page 57
Figure 4-5: Maintenance Actions on G-TIGF 2T IHUMS Cruise Database
Figure 4-6: Maintenance Actions on G-TIGF 3T IHUMS Cruise Database
G-TIGF IHums_Puma_Tail_Cruise T2
29
Ap
r 08
13
Ma
y 0
8
21
Ma
y 0
8
28
Ma
y 0
8
5 J
un
08
12
Ju
n 0
8
19
Ju
n 0
8
26
Ju
n 0
8
5 J
ul 0
8
11
Ju
l 08
23
Ju
l 08
30
Ju
l 08
8 A
ug
08
27
Au
g 0
8
2 S
ep
08
9 S
ep
08
16
Se
p 0
8
22
Se
p 0
8
29
Se
p 0
8
20
Oc
t 08
24
Oc
t 08
30
Oc
t 08
7 N
ov
08
14
No
v 0
8
19
No
v 0
8
26
No
v 0
8
3 D
ec
08
10
De
c 0
8
18
De
c 0
8
23
De
c 0
8
29
De
c 0
8
-0.3
-0.2
-0.1
0
0.1
0.2
0.3
0.4
0.5
0.6
0.7
0.8
0.9
1
1.1
1.2
1.31+2 3 54
G-TIGF IHums_Puma_Tail_Cruise T2
29
Ap
r 08
13
Ma
y 0
8
21
Ma
y 0
8
28
Ma
y 0
8
5 J
un
08
12
Ju
n 0
8
19
Ju
n 0
8
26
Ju
n 0
8
5 J
ul 0
8
11
Ju
l 08
23
Ju
l 08
30
Ju
l 08
8 A
ug
08
27
Au
g 0
8
2 S
ep
08
9 S
ep
08
16
Se
p 0
8
22
Se
p 0
8
29
Se
p 0
8
20
Oc
t 08
24
Oc
t 08
30
Oc
t 08
7 N
ov
08
14
No
v 0
8
19
No
v 0
8
26
No
v 0
8
3 D
ec
08
10
De
c 0
8
18
De
c 0
8
23
De
c 0
8
29
De
c 0
8
-0.3
-0.2
-0.1
0
0.1
0.2
0.3
0.4
0.5
0.6
0.7
0.8
0.9
1
1.1
1.2
1.31+2 3 541+2 3 54
G-TIGF IHums_Puma_Tail_Cruise T3
29
Ap
r 08
13
Ma
y 0
8
21
Ma
y 0
8
28
Ma
y 0
8
5 J
un
08
12
Ju
n 0
8
19
Ju
n 0
8
26
Ju
n 0
8
5 J
ul 0
8
11
Ju
l 08
23
Ju
l 08
30
Ju
l 08
8 A
ug
08
27
Au
g 0
8
2 S
ep
08
9 S
ep
08
16
Se
p 0
8
22
Se
p 0
8
29
Se
p 0
8
20
Oc
t 08
24
Oc
t 08
30
Oc
t 08
7 N
ov
08
14
No
v 0
8
19
No
v 0
8
26
No
v 0
8
3 D
ec
08
10
De
c 0
8
18
De
c 0
8
23
De
c 0
8
29
De
c 0
8
-0.1
0
0.1
0.2
0.3
1+2 3 54G-TIGF IHums_Puma_Tail_Cruise T3
29
Ap
r 08
13
Ma
y 0
8
21
Ma
y 0
8
28
Ma
y 0
8
5 J
un
08
12
Ju
n 0
8
19
Ju
n 0
8
26
Ju
n 0
8
5 J
ul 0
8
11
Ju
l 08
23
Ju
l 08
30
Ju
l 08
8 A
ug
08
27
Au
g 0
8
2 S
ep
08
9 S
ep
08
16
Se
p 0
8
22
Se
p 0
8
29
Se
p 0
8
20
Oc
t 08
24
Oc
t 08
30
Oc
t 08
7 N
ov
08
14
No
v 0
8
19
No
v 0
8
26
No
v 0
8
3 D
ec
08
10
De
c 0
8
18
De
c 0
8
23
De
c 0
8
29
De
c 0
8
-0.1
0
0.1
0.2
0.3
1+2 3 541+2 3 54
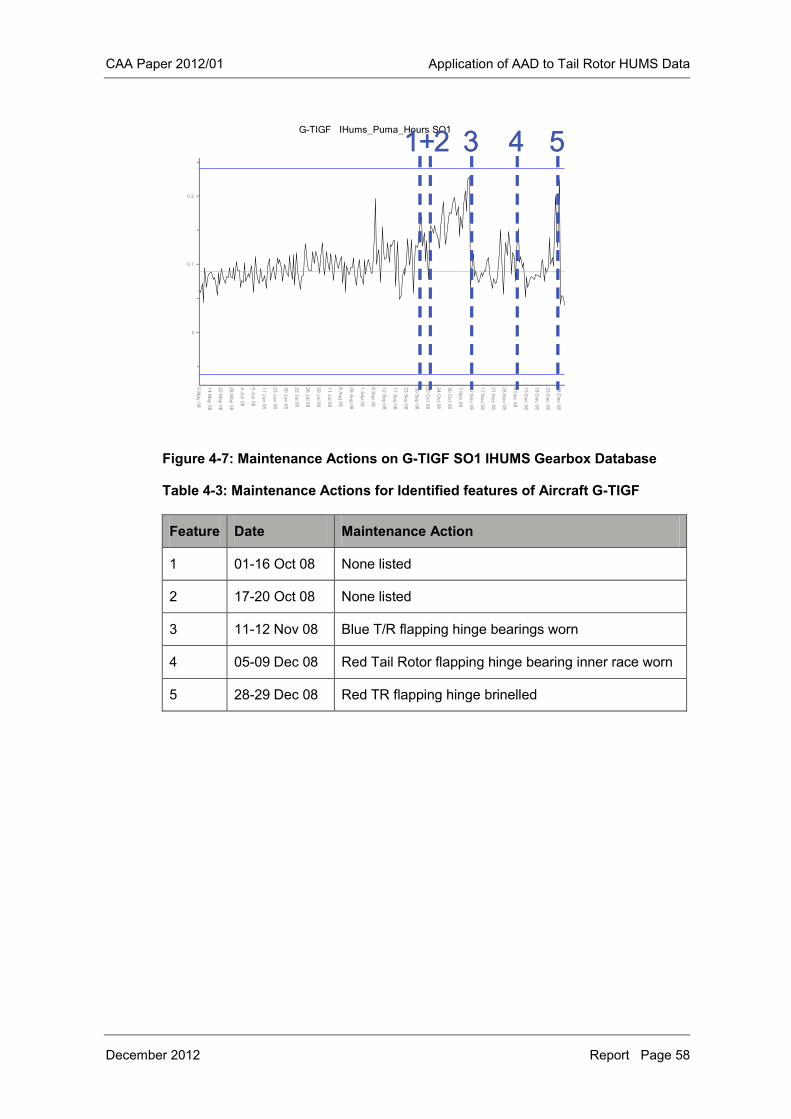
CAA Paper 2012/01 Application of AAD to Tail Rotor HUMS Data
December 2012 Report Page 58
Figure 4-7: Maintenance Actions on G-TIGF SO1 IHUMS Gearbox Database
Table 4-3: Maintenance Actions for Identified features of Aircraft G-TIGF
Feature Date Maintenance Action
1 01-16 Oct 08 None listed
2 17-20 Oct 08 None listed
3 11-12 Nov 08 Blue T/R flapping hinge bearings worn
4 05-09 Dec 08 Red Tail Rotor flapping hinge bearing inner race worn
5 28-29 Dec 08 Red TR flapping hinge brinelled
G-TIGF IHums_Puma_Hours SO1
5 M
ay
08
14
Ma
y 0
8
22
Ma
y 0
8
28
Ma
y 0
8
4 J
un
08
9 J
un
08
17
Ju
n 0
8
23
Ju
n 0
8
30
Ju
n 0
8
22
Ju
l 08
26
Ju
l 08
29
Ju
l 08
11
Ju
l 08
8 A
ug
08
26
Au
g 0
8
1 S
ep
08
8 S
ep
08
12
Se
p 0
8
17
Se
p 0
8
23
Se
p 0
8
30
Se
p 0
8
20
Oc
t 08
24
Oc
t 08
30
Oc
t 08
7 N
ov
08
12
No
v 0
8
17
No
v 0
8
21
No
v 0
8
28
No
v 0
8
4 D
ec
08
15
De
c 0
8
18
De
c 0
8
23
De
c 0
8
28
De
c 0
8
0
0.1
0.2
1+2 3 54G-TIGF IHums_Puma_Hours SO1
5 M
ay
08
14
Ma
y 0
8
22
Ma
y 0
8
28
Ma
y 0
8
4 J
un
08
9 J
un
08
17
Ju
n 0
8
23
Ju
n 0
8
30
Ju
n 0
8
22
Ju
l 08
26
Ju
l 08
29
Ju
l 08
11
Ju
l 08
8 A
ug
08
26
Au
g 0
8
1 S
ep
08
8 S
ep
08
12
Se
p 0
8
17
Se
p 0
8
23
Se
p 0
8
30
Se
p 0
8
20
Oc
t 08
24
Oc
t 08
30
Oc
t 08
7 N
ov
08
12
No
v 0
8
17
No
v 0
8
21
No
v 0
8
28
No
v 0
8
4 D
ec
08
15
De
c 0
8
18
De
c 0
8
23
De
c 0
8
28
De
c 0
8
0
0.1
0.2
1+2 3 541+2 3 54
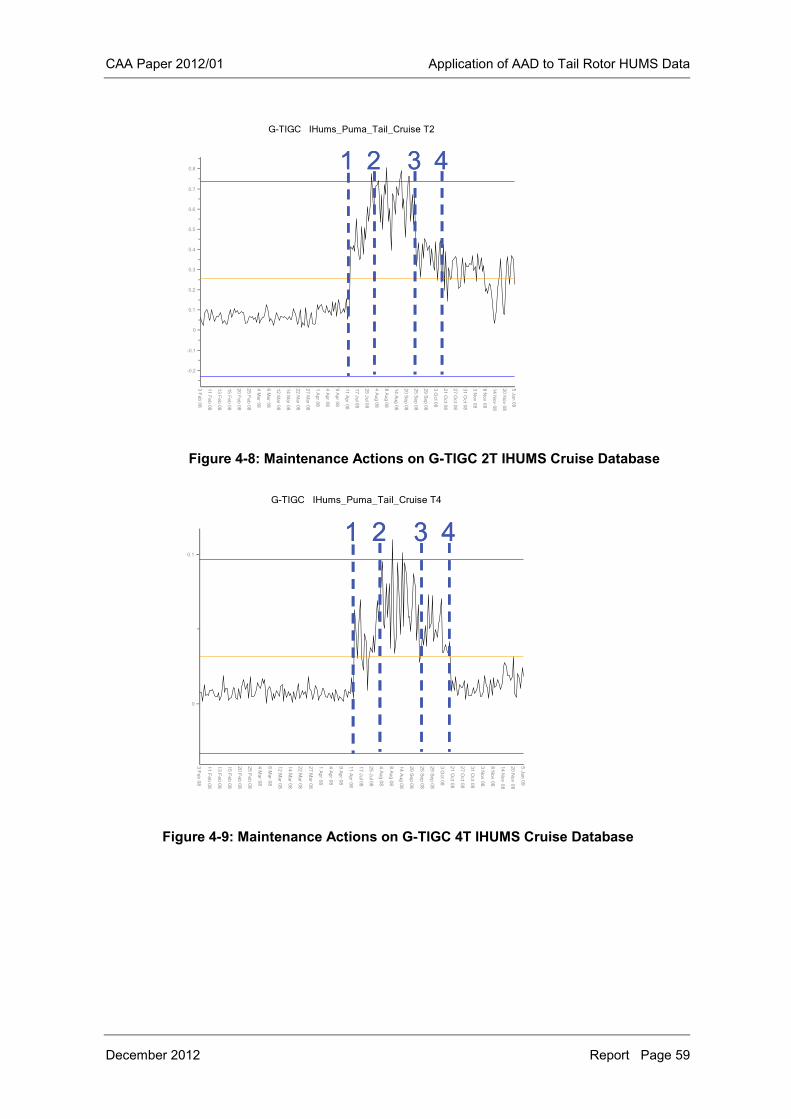
CAA Paper 2012/01 Application of AAD to Tail Rotor HUMS Data
December 2012 Report Page 59
Figure 4-8: Maintenance Actions on G-TIGC 2T IHUMS Cruise Database
Figure 4-9: Maintenance Actions on G-TIGC 4T IHUMS Cruise Database
G-TIGC IHums_Puma_Tail_Cruise T2
3 F
eb
08
11
Fe
b 0
8
13
Fe
b 0
8
15
Fe
b 0
8
20
Fe
b 0
8
25
Fe
b 0
8
4 M
ar 0
8
6 M
ar 0
8
12
Ma
r 08
14
Ma
r 08
22
Ma
r 08
27
Ma
r 08
1 A
pr 0
8
4 A
pr 0
8
9 A
pr 0
8
11
Ap
r 08
17
Ju
l 08
25
Ju
l 08
4 A
ug
08
8 A
ug
08
14
Au
g 0
8
20
Se
p 0
8
25
Se
p 0
8
29
Se
p 0
8
3 O
ct 0
8
21
Oc
t 08
27
Oc
t 08
31
Oc
t 08
3 N
ov
08
8 N
ov
08
14
No
v 0
8
20
No
v 0
8
5 J
an
09
-0.2
-0.1
0
0.1
0.2
0.3
0.4
0.5
0.6
0.7
0.8 1 2 3 4G-TIGC IHums_Puma_Tail_Cruise T2
3 F
eb
08
11
Fe
b 0
8
13
Fe
b 0
8
15
Fe
b 0
8
20
Fe
b 0
8
25
Fe
b 0
8
4 M
ar 0
8
6 M
ar 0
8
12
Ma
r 08
14
Ma
r 08
22
Ma
r 08
27
Ma
r 08
1 A
pr 0
8
4 A
pr 0
8
9 A
pr 0
8
11
Ap
r 08
17
Ju
l 08
25
Ju
l 08
4 A
ug
08
8 A
ug
08
14
Au
g 0
8
20
Se
p 0
8
25
Se
p 0
8
29
Se
p 0
8
3 O
ct 0
8
21
Oc
t 08
27
Oc
t 08
31
Oc
t 08
3 N
ov
08
8 N
ov
08
14
No
v 0
8
20
No
v 0
8
5 J
an
09
-0.2
-0.1
0
0.1
0.2
0.3
0.4
0.5
0.6
0.7
0.8 1 2 3 41 2 3 4
G-TIGC IHums_Puma_Tail_Cruise T4
3 F
eb
08
11
Fe
b 0
8
13
Fe
b 0
8
15
Fe
b 0
8
20
Fe
b 0
8
25
Fe
b 0
8
4 M
ar 0
8
6 M
ar 0
8
12
Ma
r 08
14
Ma
r 08
22
Ma
r 08
27
Ma
r 08
1 A
pr 0
8
4 A
pr 0
8
9 A
pr 0
8
11
Ap
r 08
17
Ju
l 08
25
Ju
l 08
4 A
ug
08
8 A
ug
08
14
Au
g 0
8
20
Se
p 0
8
25
Se
p 0
8
29
Se
p 0
8
3 O
ct 0
8
21
Oc
t 08
27
Oc
t 08
31
Oc
t 08
3 N
ov
08
8 N
ov
08
14
No
v 0
8
20
No
v 0
8
5 J
an
09
0
0.1
1 2 3 41 2 3 4
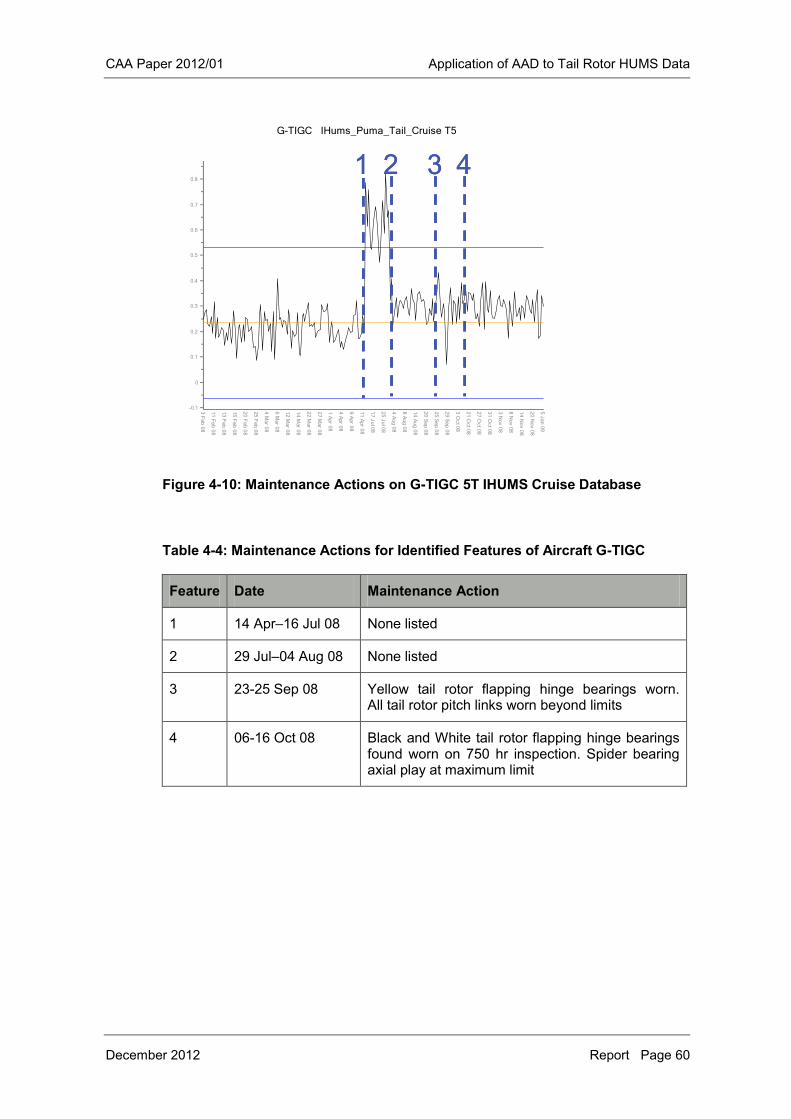
CAA Paper 2012/01 Application of AAD to Tail Rotor HUMS Data
December 2012 Report Page 60
Figure 4-10: Maintenance Actions on G-TIGC 5T IHUMS Cruise Database
Table 4-4: Maintenance Actions for Identified Features of Aircraft G-TIGC
Feature Date Maintenance Action
1 14 Apr–16 Jul 08 None listed
2 29 Jul–04 Aug 08 None listed
3 23-25 Sep 08 Yellow tail rotor flapping hinge bearings worn. All tail rotor pitch links worn beyond limits
4 06-16 Oct 08 Black and White tail rotor flapping hinge bearings found worn on 750 hr inspection. Spider bearing axial play at maximum limit
G-TIGC IHums_Puma_Tail_Cruise T5
3 F
eb
08
11
Fe
b 0
8
13
Fe
b 0
8
15
Fe
b 0
8
20
Fe
b 0
8
25
Fe
b 0
8
4 M
ar 0
8
6 M
ar 0
8
12
Ma
r 08
14
Ma
r 08
22
Ma
r 08
27
Ma
r 08
1 A
pr 0
8
4 A
pr 0
8
9 A
pr 0
8
11
Ap
r 08
17
Ju
l 08
25
Ju
l 08
4 A
ug
08
8 A
ug
08
14
Au
g 0
8
20
Se
p 0
8
25
Se
p 0
8
29
Se
p 0
8
3 O
ct 0
8
21
Oc
t 08
27
Oc
t 08
31
Oc
t 08
3 N
ov
08
8 N
ov
08
14
No
v 0
8
20
No
v 0
8
5 J
an
09
-0.1
0
0.1
0.2
0.3
0.4
0.5
0.6
0.7
0.8
1 2 3 41 2 3 4
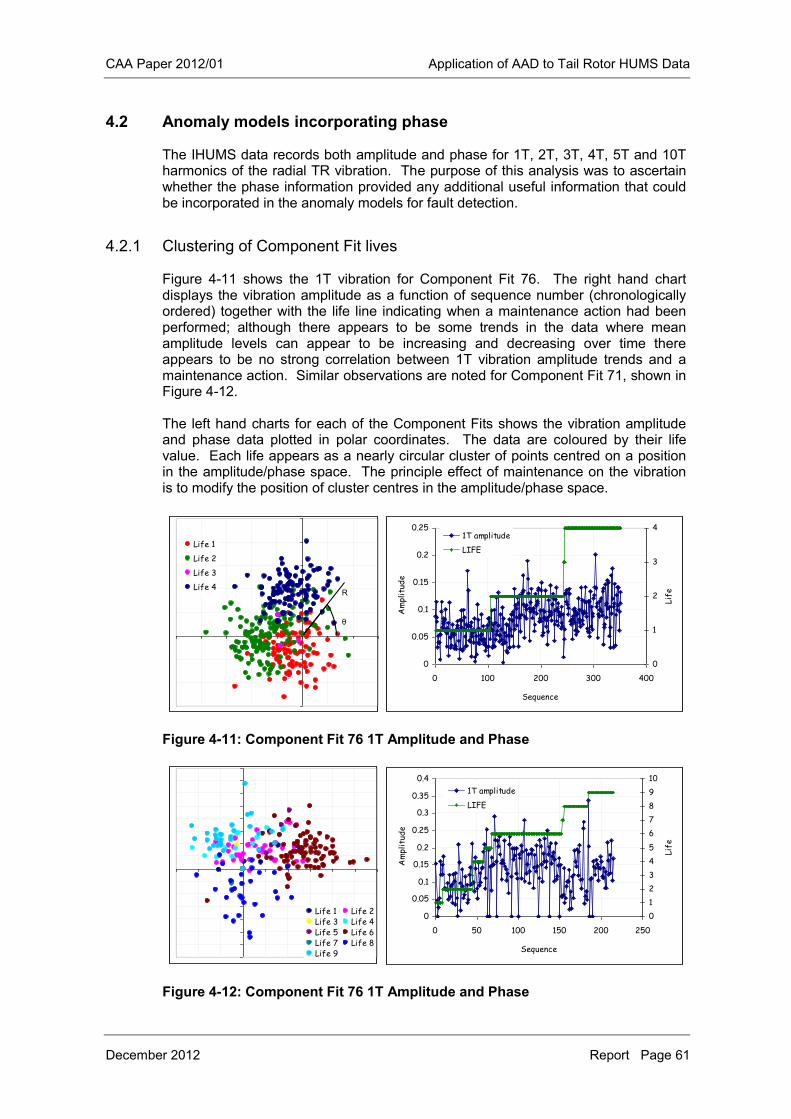
CAA Paper 2012/01 Application of AAD to Tail Rotor HUMS Data
December 2012 Report Page 61
4.2 Anomaly models incorporating phase
The IHUMS data records both amplitude and phase for 1T, 2T, 3T, 4T, 5T and 10T harmonics of the radial TR vibration. The purpose of this analysis was to ascertain whether the phase information provided any additional useful information that could be incorporated in the anomaly models for fault detection.
4.2.1 Clustering of Component Fit lives
Figure 4-11 shows the 1T vibration for Component Fit 76. The right hand chart displays the vibration amplitude as a function of sequence number (chronologically ordered) together with the life line indicating when a maintenance action had been performed; although there appears to be some trends in the data where mean amplitude levels can appear to be increasing and decreasing over time there appears to be no strong correlation between 1T vibration amplitude trends and a maintenance action. Similar observations are noted for Component Fit 71, shown in Figure 4-12. The left hand charts for each of the Component Fits shows the vibration amplitude and phase data plotted in polar coordinates. The data are coloured by their life value. Each life appears as a nearly circular cluster of points centred on a position in the amplitude/phase space. The principle effect of maintenance on the vibration is to modify the position of cluster centres in the amplitude/phase space.
Figure 4-11: Component Fit 76 1T Amplitude and Phase
Figure 4-12: Component Fit 76 1T Amplitude and Phase
Life 1
Life 2
Life 3
Life 4
θ
R
0
0.05
0.1
0.15
0.2
0.25
0 100 200 300 400
Sequence
Am
plit
ude
0
1
2
3
4
Life
1T amplitude
LIFE
Life 1 Life 2Life 3 Life 4Life 5 Life 6Life 7 Life 8Life 9
0
0.05
0.1
0.15
0.2
0.25
0.3
0.35
0.4
0 50 100 150 200 250
Sequence
Am
plit
ude
0
1
2
3
4
5
6
7
8
9
10
Life
1T amplitude
LIFE
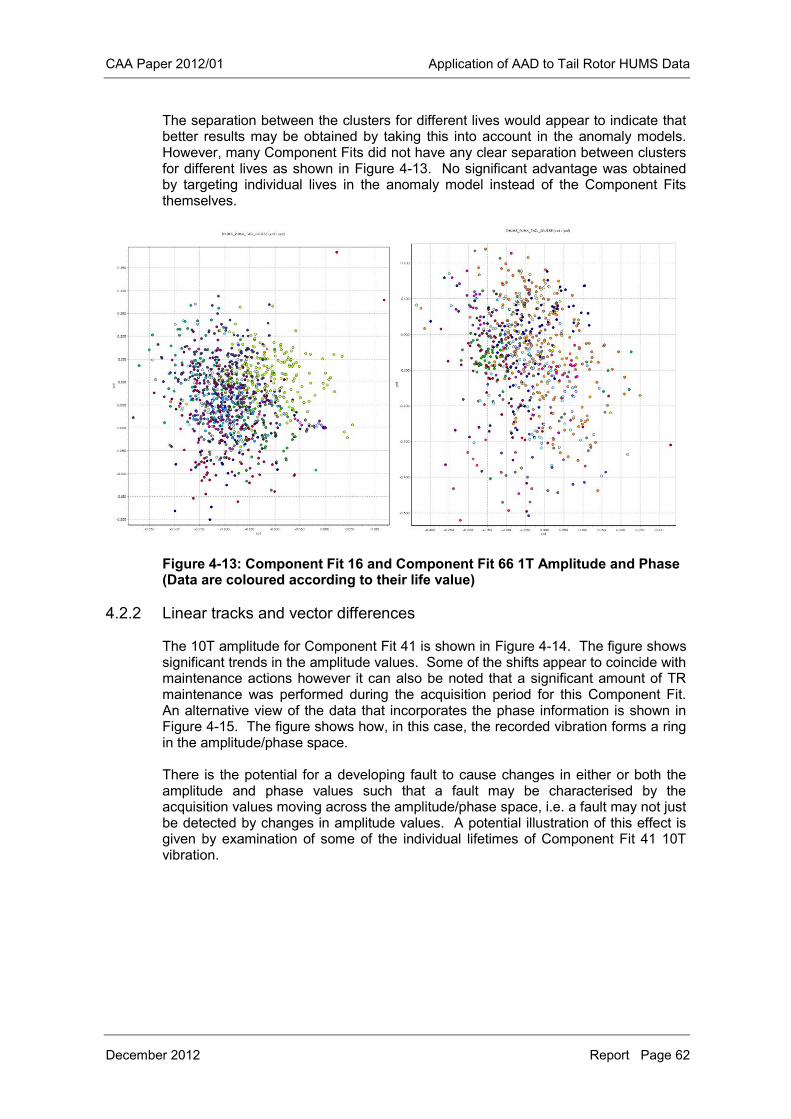
CAA Paper 2012/01 Application of AAD to Tail Rotor HUMS Data
December 2012 Report Page 62
The separation between the clusters for different lives would appear to indicate that better results may be obtained by taking this into account in the anomaly models. However, many Component Fits did not have any clear separation between clusters for different lives as shown in Figure 4-13. No significant advantage was obtained by targeting individual lives in the anomaly model instead of the Component Fits themselves.
Figure 4-13: Component Fit 16 and Component Fit 66 1T Amplitude and Phase (Data are coloured according to their life value)
4.2.2 Linear tracks and vector differences
The 10T amplitude for Component Fit 41 is shown in Figure 4-14. The figure shows significant trends in the amplitude values. Some of the shifts appear to coincide with maintenance actions however it can also be noted that a significant amount of TR maintenance was performed during the acquisition period for this Component Fit. An alternative view of the data that incorporates the phase information is shown in Figure 4-15. The figure shows how, in this case, the recorded vibration forms a ring in the amplitude/phase space. There is the potential for a developing fault to cause changes in either or both the amplitude and phase values such that a fault may be characterised by the acquisition values moving across the amplitude/phase space, i.e. a fault may not just be detected by changes in amplitude values. A potential illustration of this effect is given by examination of some of the individual lifetimes of Component Fit 41 10T vibration.
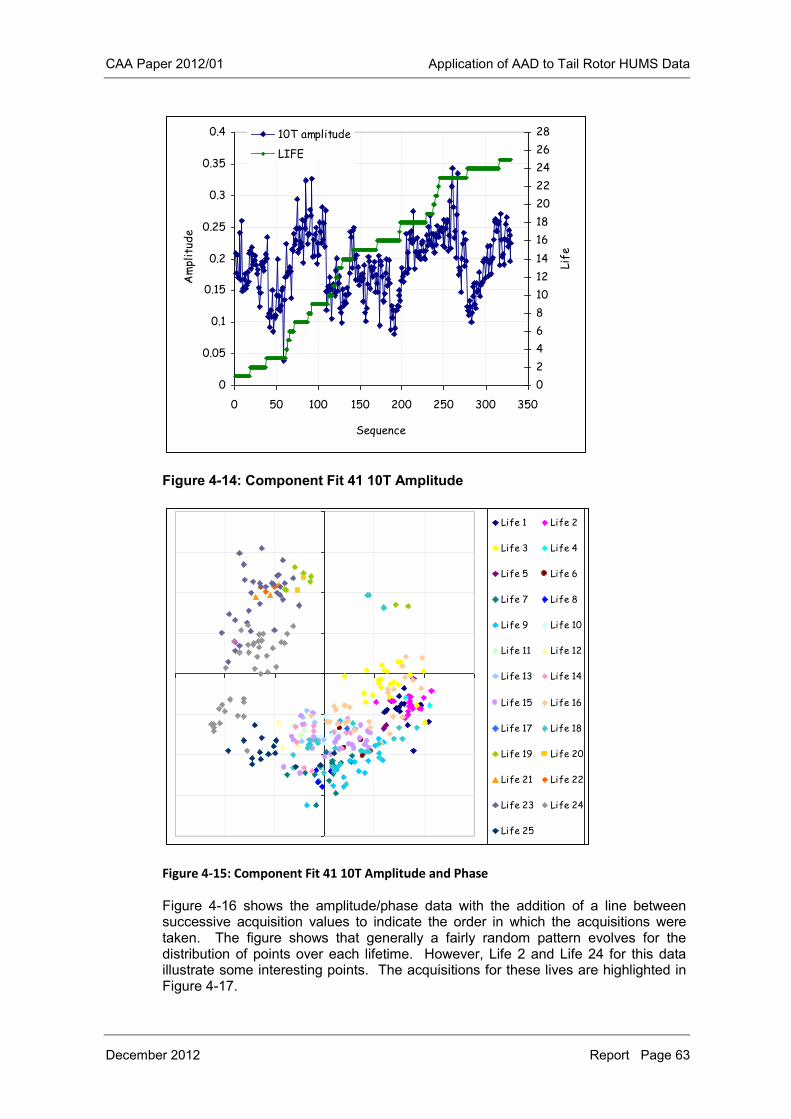
CAA Paper 2012/01 Application of AAD to Tail Rotor HUMS Data
December 2012 Report Page 63
Figure 4-14: Component Fit 41 10T Amplitude
Figure 4-15: Component Fit 41 10T Amplitude and Phase
Figure 4-16 shows the amplitude/phase data with the addition of a line between successive acquisition values to indicate the order in which the acquisitions were taken. The figure shows that generally a fairly random pattern evolves for the distribution of points over each lifetime. However, Life 2 and Life 24 for this data illustrate some interesting points. The acquisitions for these lives are highlighted in Figure 4-17.
0
0.05
0.1
0.15
0.2
0.25
0.3
0.35
0.4
0 50 100 150 200 250 300 350
Sequence
Am
plit
ude
0
2
4
6
8
10
12
14
16
18
20
22
24
26
28
Life
10T amplitude
LIFE
Life 1 Life 2
Life 3 Life 4
Life 5 Life 6
Life 7 Life 8
Life 9 Life 10
Life 11 Life 12
Life 13 Life 14
Life 15 Life 16
Life 17 Life 18
Life 19 Life 20
Life 21 Life 22
Life 23 Life 24
Life 25
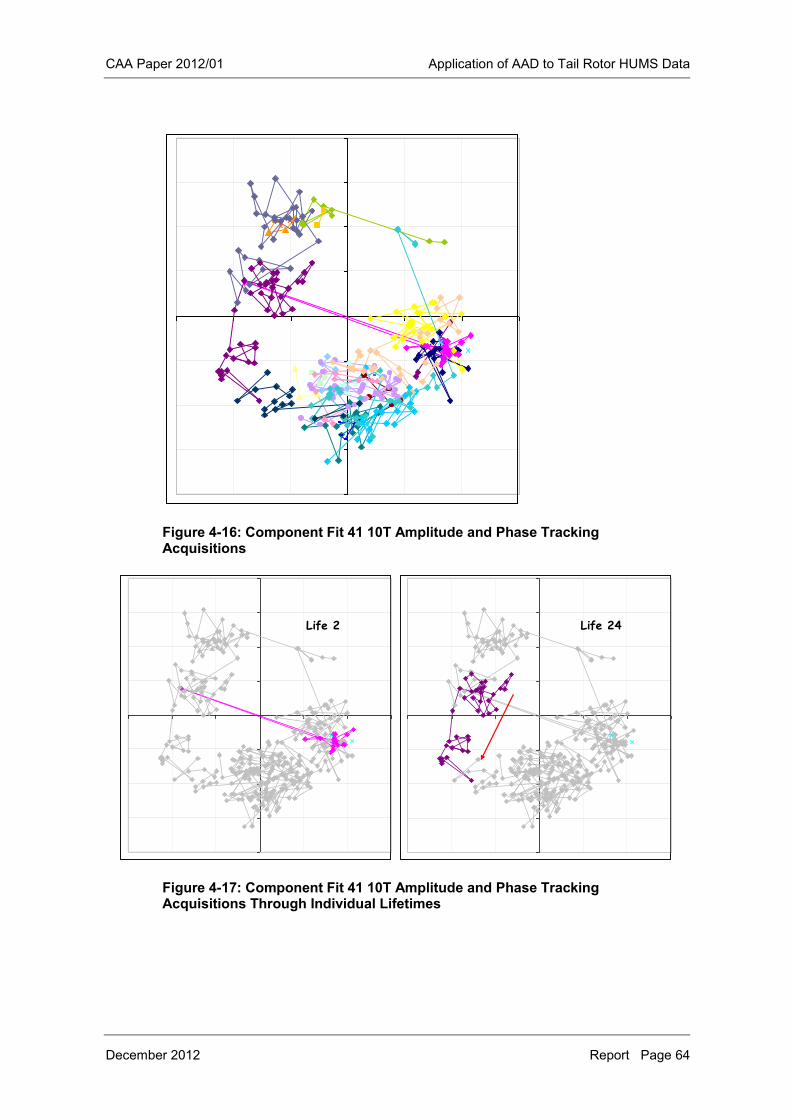
CAA Paper 2012/01 Application of AAD to Tail Rotor HUMS Data
December 2012 Report Page 64
Figure 4-16: Component Fit 41 10T Amplitude and Phase Tracking Acquisitions
Figure 4-17: Component Fit 41 10T Amplitude and Phase Tracking Acquisitions Through Individual Lifetimes
Life 2 Life 24
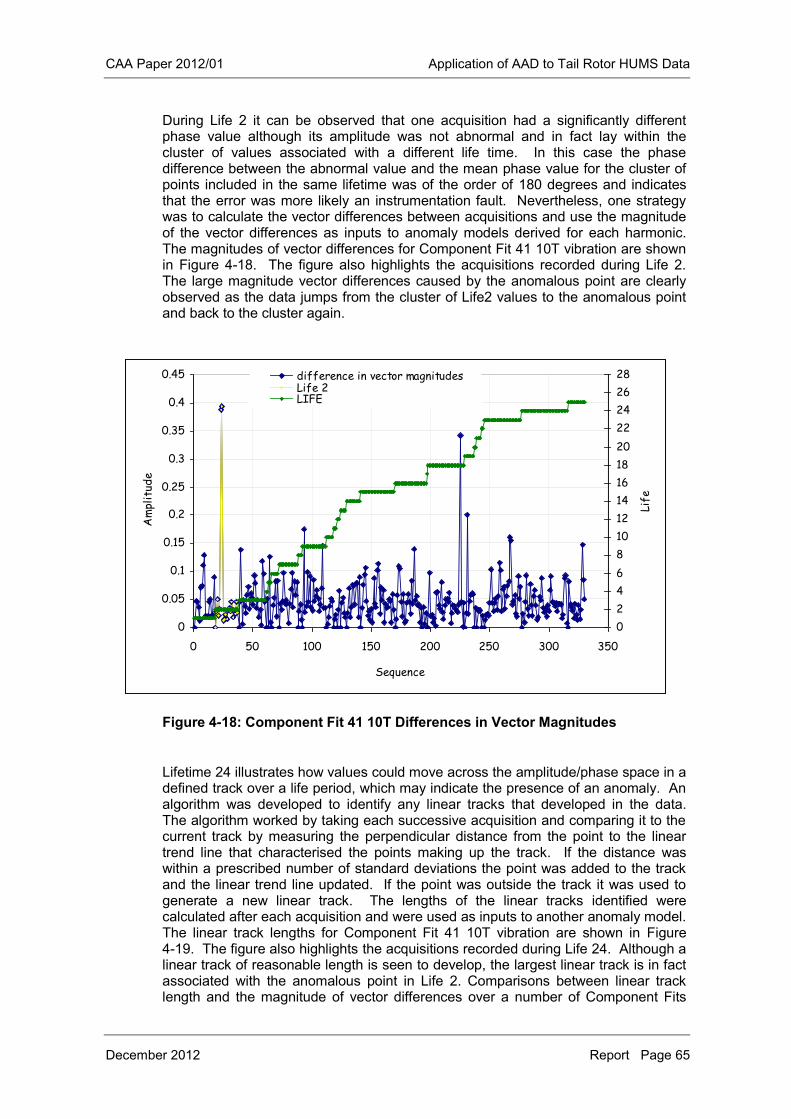
CAA Paper 2012/01 Application of AAD to Tail Rotor HUMS Data
December 2012 Report Page 65
During Life 2 it can be observed that one acquisition had a significantly different phase value although its amplitude was not abnormal and in fact lay within the cluster of values associated with a different life time. In this case the phase difference between the abnormal value and the mean phase value for the cluster of points included in the same lifetime was of the order of 180 degrees and indicates that the error was more likely an instrumentation fault. Nevertheless, one strategy was to calculate the vector differences between acquisitions and use the magnitude of the vector differences as inputs to anomaly models derived for each harmonic. The magnitudes of vector differences for Component Fit 41 10T vibration are shown in Figure 4-18. The figure also highlights the acquisitions recorded during Life 2. The large magnitude vector differences caused by the anomalous point are clearly observed as the data jumps from the cluster of Life2 values to the anomalous point and back to the cluster again.
Figure 4-18: Component Fit 41 10T Differences in Vector Magnitudes
Lifetime 24 illustrates how values could move across the amplitude/phase space in a defined track over a life period, which may indicate the presence of an anomaly. An algorithm was developed to identify any linear tracks that developed in the data. The algorithm worked by taking each successive acquisition and comparing it to the current track by measuring the perpendicular distance from the point to the linear trend line that characterised the points making up the track. If the distance was within a prescribed number of standard deviations the point was added to the track and the linear trend line updated. If the point was outside the track it was used to generate a new linear track. The lengths of the linear tracks identified were calculated after each acquisition and were used as inputs to another anomaly model. The linear track lengths for Component Fit 41 10T vibration are shown in Figure 4-19. The figure also highlights the acquisitions recorded during Life 24. Although a linear track of reasonable length is seen to develop, the largest linear track is in fact associated with the anomalous point in Life 2. Comparisons between linear track length and the magnitude of vector differences over a number of Component Fits
0
0.05
0.1
0.15
0.2
0.25
0.3
0.35
0.4
0.45
0 50 100 150 200 250 300 350
Sequence
Am
plit
ude
0
2
4
6
8
10
12
14
16
18
20
22
24
26
28
Life
difference in vector magnitudesLife 2LIFE
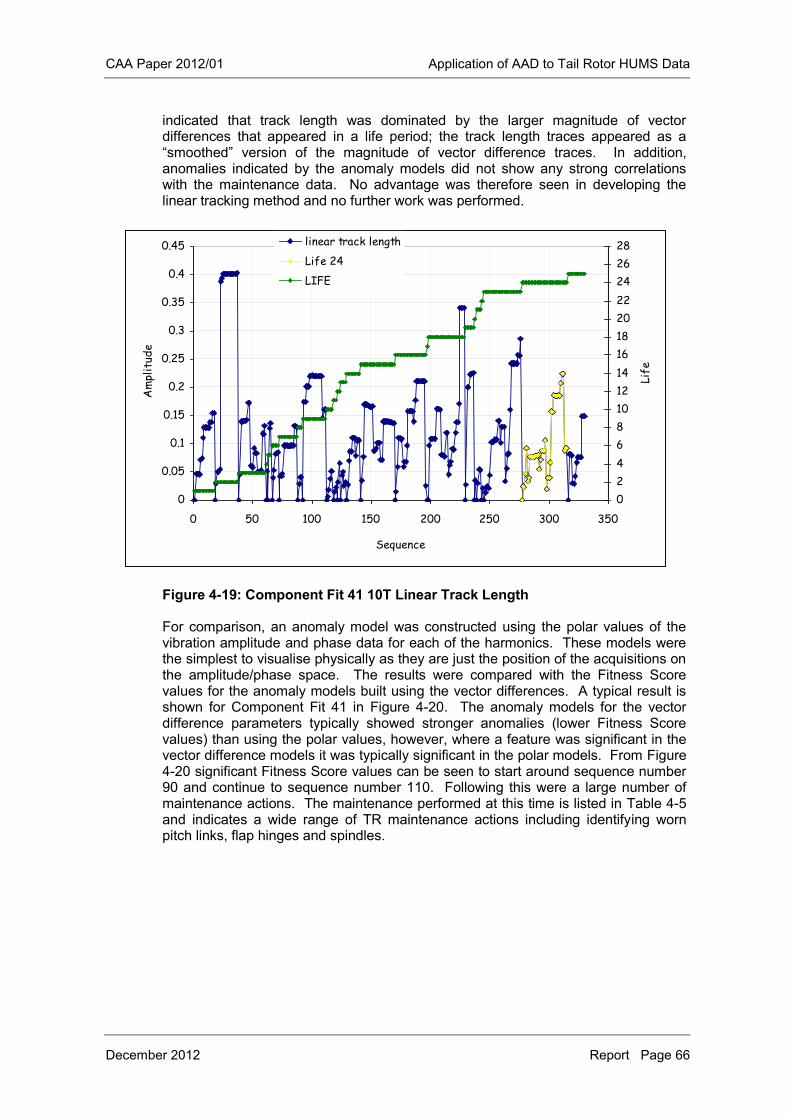
CAA Paper 2012/01 Application of AAD to Tail Rotor HUMS Data
December 2012 Report Page 66
indicated that track length was dominated by the larger magnitude of vector differences that appeared in a life period; the track length traces appeared as a “smoothed” version of the magnitude of vector difference traces. In addition, anomalies indicated by the anomaly models did not show any strong correlations with the maintenance data. No advantage was therefore seen in developing the linear tracking method and no further work was performed.
Figure 4-19: Component Fit 41 10T Linear Track Length
For comparison, an anomaly model was constructed using the polar values of the vibration amplitude and phase data for each of the harmonics. These models were the simplest to visualise physically as they are just the position of the acquisitions on the amplitude/phase space. The results were compared with the Fitness Score values for the anomaly models built using the vector differences. A typical result is shown for Component Fit 41 in Figure 4-20. The anomaly models for the vector difference parameters typically showed stronger anomalies (lower Fitness Score values) than using the polar values, however, where a feature was significant in the vector difference models it was typically significant in the polar models. From Figure 4-20 significant Fitness Score values can be seen to start around sequence number 90 and continue to sequence number 110. Following this were a large number of maintenance actions. The maintenance performed at this time is listed in Table 4-5 and indicates a wide range of TR maintenance actions including identifying worn pitch links, flap hinges and spindles.
0
0.05
0.1
0.15
0.2
0.25
0.3
0.35
0.4
0.45
0 50 100 150 200 250 300 350
Sequence
Am
plit
ude
0
2
4
6
8
10
12
14
16
18
20
22
24
26
28
Life
linear track length
Life 24
LIFE
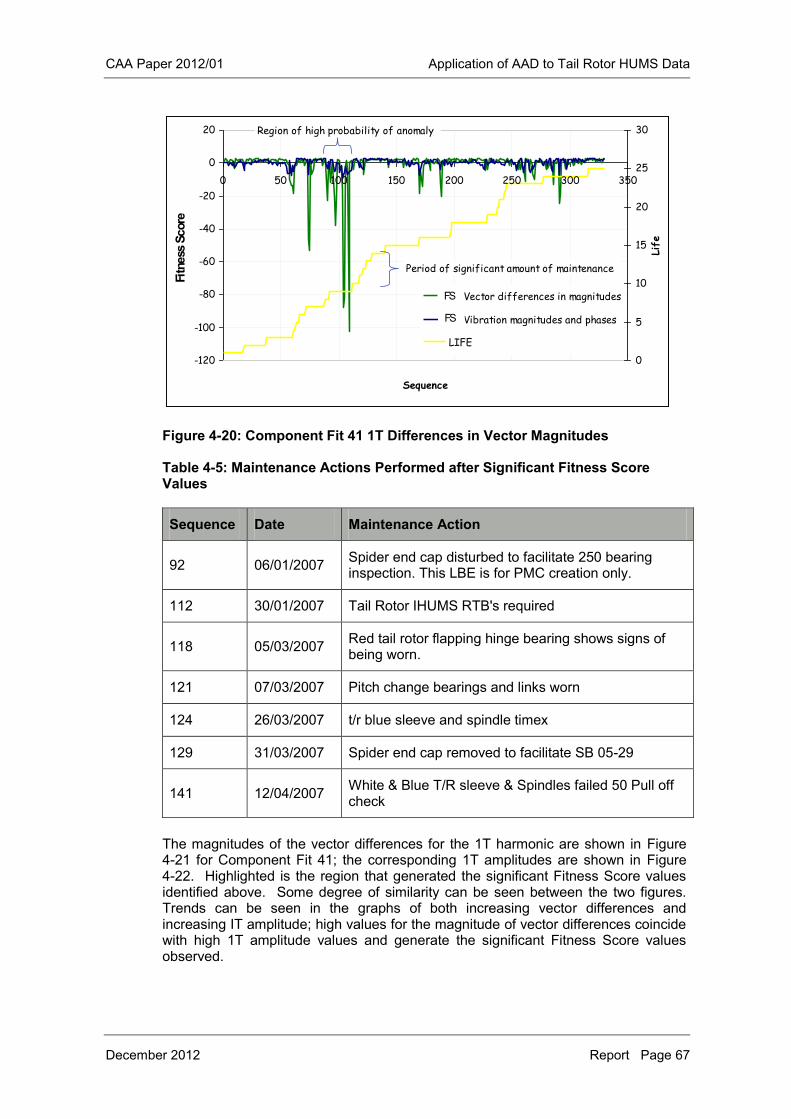
CAA Paper 2012/01 Application of AAD to Tail Rotor HUMS Data
December 2012 Report Page 67
Figure 4-20: Component Fit 41 1T Differences in Vector Magnitudes
Table 4-5: Maintenance Actions Performed after Significant Fitness Score Values
Sequence Date Maintenance Action
92 06/01/2007 Spider end cap disturbed to facilitate 250 bearing inspection. This LBE is for PMC creation only.
112 30/01/2007 Tail Rotor IHUMS RTB's required
118 05/03/2007 Red tail rotor flapping hinge bearing shows signs of being worn.
121 07/03/2007 Pitch change bearings and links worn
124 26/03/2007 t/r blue sleeve and spindle timex
129 31/03/2007 Spider end cap removed to facilitate SB 05-29
141 12/04/2007 White & Blue T/R sleeve & Spindles failed 50 Pull off check
The magnitudes of the vector differences for the 1T harmonic are shown in Figure 4-21 for Component Fit 41; the corresponding 1T amplitudes are shown in Figure 4-22. Highlighted is the region that generated the significant Fitness Score values identified above. Some degree of similarity can be seen between the two figures. Trends can be seen in the graphs of both increasing vector differences and increasing IT amplitude; high values for the magnitude of vector differences coincide with high 1T amplitude values and generate the significant Fitness Score values observed.
-120
-100
-80
-60
-40
-20
0
20
0 50 100 150 200 250 300 350
Sequence
Log L
ikelihood
0
5
10
15
20
25
30
Life
LL-Vector differences in magnitudes
LL-Vibration magnitudes and phases
LIFE
Region of high probability of anomaly
Period of significant amount of maintenance
Fitn
ess S
core
FS
FS
-120
-100
-80
-60
-40
-20
0
20
0 50 100 150 200 250 300 350
Sequence
Log L
ikelihood
0
5
10
15
20
25
30
Life
LL-Vector differences in magnitudes
LL-Vibration magnitudes and phases
LIFE
Region of high probability of anomaly
Period of significant amount of maintenance
Fitn
ess S
core
FS
FS
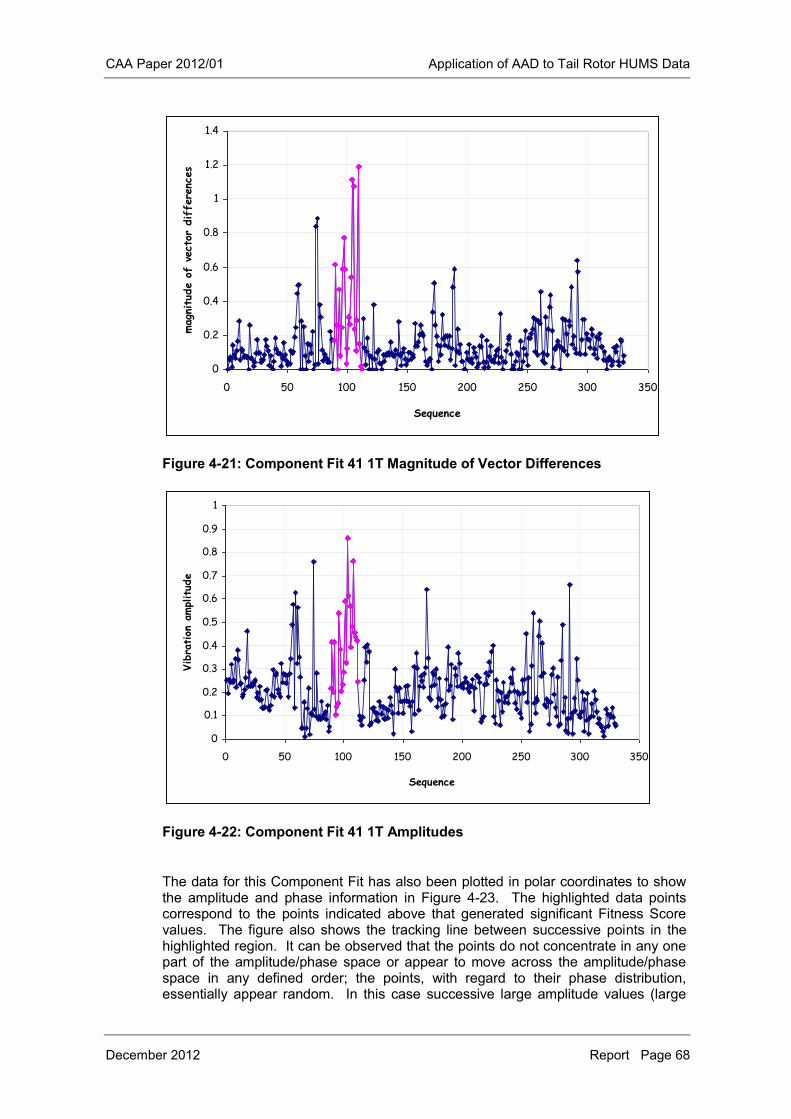
CAA Paper 2012/01 Application of AAD to Tail Rotor HUMS Data
December 2012 Report Page 68
Figure 4-21: Component Fit 41 1T Magnitude of Vector Differences
Figure 4-22: Component Fit 41 1T Amplitudes
The data for this Component Fit has also been plotted in polar coordinates to show the amplitude and phase information in Figure 4-23. The highlighted data points correspond to the points indicated above that generated significant Fitness Score values. The figure also shows the tracking line between successive points in the highlighted region. It can be observed that the points do not concentrate in any one part of the amplitude/phase space or appear to move across the amplitude/phase space in any defined order; the points, with regard to their phase distribution, essentially appear random. In this case successive large amplitude values (large
0
0.2
0.4
0.6
0.8
1
1.2
1.4
0 50 100 150 200 250 300 350
Sequence
magn
itud
e o
f ve
ctor
diffe
renc
es
0
0.1
0.2
0.3
0.4
0.5
0.6
0.7
0.8
0.9
1
0 50 100 150 200 250 300 350
Sequence
Vib
ration
amplitud
e
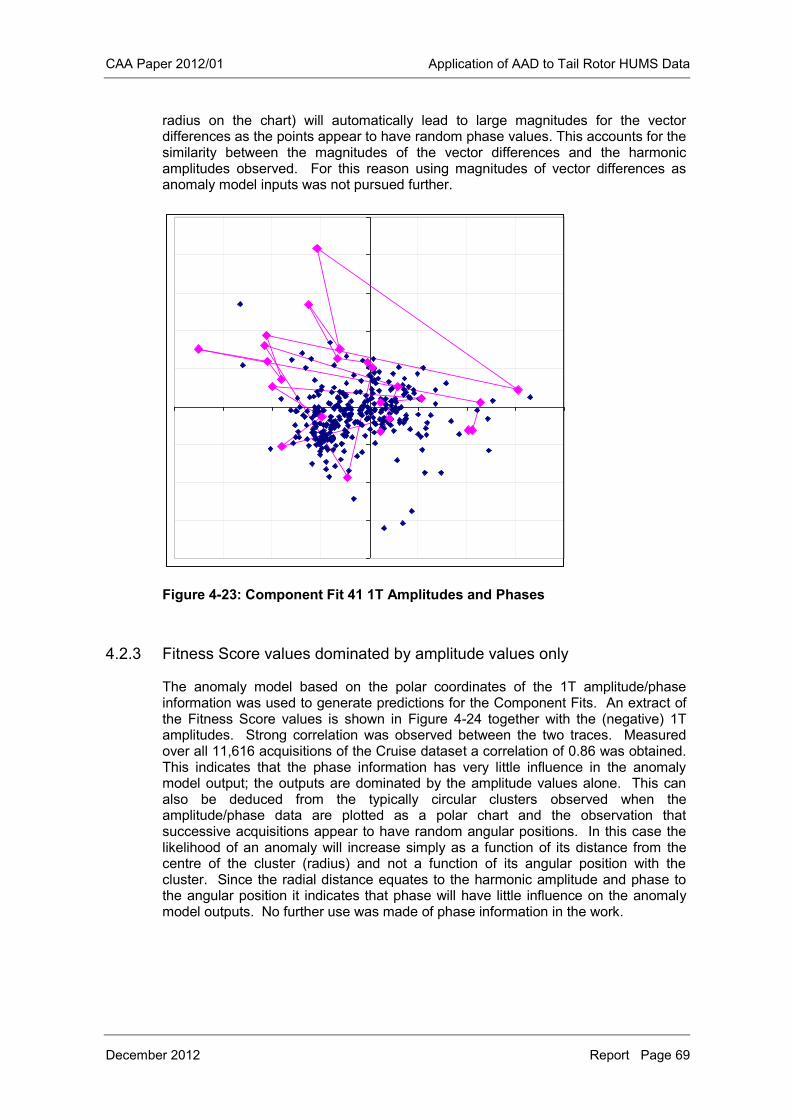
CAA Paper 2012/01 Application of AAD to Tail Rotor HUMS Data
December 2012 Report Page 69
radius on the chart) will automatically lead to large magnitudes for the vector differences as the points appear to have random phase values. This accounts for the similarity between the magnitudes of the vector differences and the harmonic amplitudes observed. For this reason using magnitudes of vector differences as anomaly model inputs was not pursued further.
Figure 4-23: Component Fit 41 1T Amplitudes and Phases
4.2.3 Fitness Score values dominated by amplitude values only
The anomaly model based on the polar coordinates of the 1T amplitude/phase information was used to generate predictions for the Component Fits. An extract of the Fitness Score values is shown in Figure 4-24 together with the (negative) 1T amplitudes. Strong correlation was observed between the two traces. Measured over all 11,616 acquisitions of the Cruise dataset a correlation of 0.86 was obtained. This indicates that the phase information has very little influence in the anomaly model output; the outputs are dominated by the amplitude values alone. This can also be deduced from the typically circular clusters observed when the amplitude/phase data are plotted as a polar chart and the observation that successive acquisitions appear to have random angular positions. In this case the likelihood of an anomaly will increase simply as a function of its distance from the centre of the cluster (radius) and not a function of its angular position with the cluster. Since the radial distance equates to the harmonic amplitude and phase to the angular position it indicates that phase will have little influence on the anomaly model outputs. No further use was made of phase information in the work.
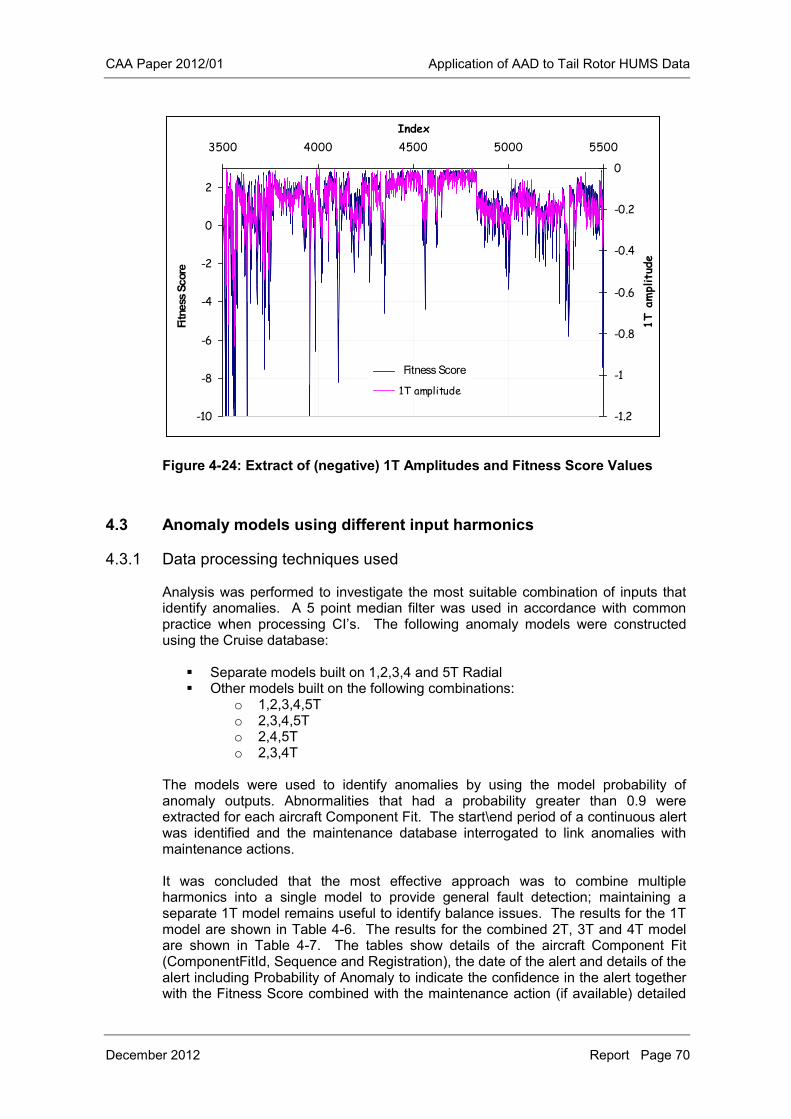
CAA Paper 2012/01 Application of AAD to Tail Rotor HUMS Data
December 2012 Report Page 70
Figure 4-24: Extract of (negative) 1T Amplitudes and Fitness Score Values
4.3 Anomaly models using different input harmonics
4.3.1 Data processing techniques used
Analysis was performed to investigate the most suitable combination of inputs that identify anomalies. A 5 point median filter was used in accordance with common practice when processing CI’s. The following anomaly models were constructed using the Cruise database:
Separate models built on 1,2,3,4 and 5T Radial Other models built on the following combinations:
o 1,2,3,4,5T o 2,3,4,5T o 2,4,5T o 2,3,4T
The models were used to identify anomalies by using the model probability of anomaly outputs. Abnormalities that had a probability greater than 0.9 were extracted for each aircraft Component Fit. The start\end period of a continuous alert was identified and the maintenance database interrogated to link anomalies with maintenance actions. It was concluded that the most effective approach was to combine multiple harmonics into a single model to provide general fault detection; maintaining a separate 1T model remains useful to identify balance issues. The results for the 1T model are shown in Table 4-6. The results for the combined 2T, 3T and 4T model are shown in Table 4-7. The tables show details of the aircraft Component Fit (ComponentFitId, Sequence and Registration), the date of the alert and details of the alert including Probability of Anomaly to indicate the confidence in the alert together with the Fitness Score combined with the maintenance action (if available) detailed
-10
-8
-6
-4
-2
0
2
3500 4000 4500 5000 5500
Index
Log
likelohoo
d
-1.2
-1
-0.8
-0.6
-0.4
-0.2
0
1T a
mplitu
de
Log likelihood
1T amplitude
Fitness Score
Fitn
ess S
core
-10
-8
-6
-4
-2
0
2
3500 4000 4500 5000 5500
Index
Log
likelohoo
d
-1.2
-1
-0.8
-0.6
-0.4
-0.2
0
1T a
mplitu
de
Log likelihood
1T amplitude
Fitness Score
Fitn
ess S
core
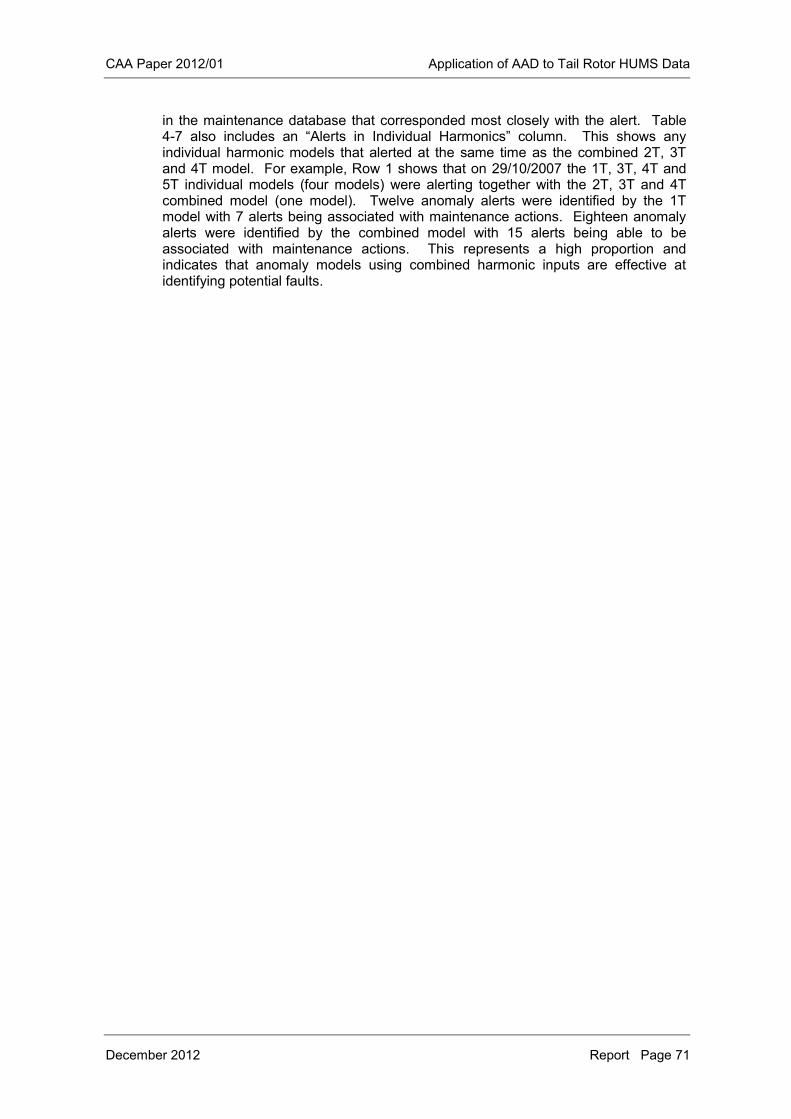
CAA Paper 2012/01 Application of AAD to Tail Rotor HUMS Data
December 2012 Report Page 71
in the maintenance database that corresponded most closely with the alert. Table 4-7 also includes an “Alerts in Individual Harmonics” column. This shows any individual harmonic models that alerted at the same time as the combined 2T, 3T and 4T model. For example, Row 1 shows that on 29/10/2007 the 1T, 3T, 4T and 5T individual models (four models) were alerting together with the 2T, 3T and 4T combined model (one model). Twelve anomaly alerts were identified by the 1T model with 7 alerts being associated with maintenance actions. Eighteen anomaly alerts were identified by the combined model with 15 alerts being able to be associated with maintenance actions. This represents a high proportion and indicates that anomaly models using combined harmonic inputs are effective at identifying potential faults.
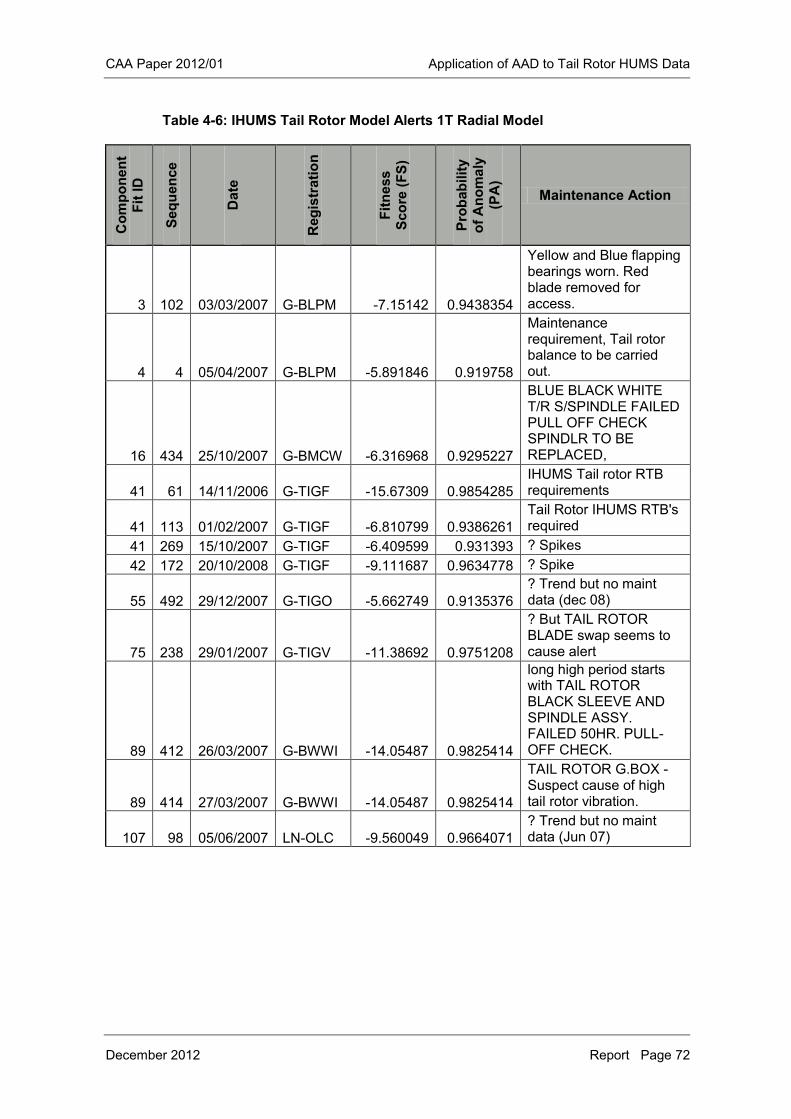
CAA Paper 2012/01 Application of AAD to Tail Rotor HUMS Data
December 2012 Report Page 72
Table 4-6: IHUMS Tail Rotor Model Alerts 1T Radial Model C
ompo
nent
Fit I
D
Sequ
ence
Dat
e
Reg
istr
atio
n
Fitn
ess
Scor
e (F
S)
Prob
abili
ty
of A
nom
aly
(PA
)
Maintenance Action
3 102 03/03/2007 G-BLPM -7.15142 0.9438354
Yellow and Blue flapping bearings worn. Red blade removed for access.
4 4 05/04/2007 G-BLPM -5.891846 0.919758
Maintenance requirement, Tail rotor balance to be carried out.
16 434 25/10/2007 G-BMCW -6.316968 0.9295227
BLUE BLACK WHITE T/R S/SPINDLE FAILED PULL OFF CHECK SPINDLR TO BE REPLACED,
41 61 14/11/2006 G-TIGF -15.67309 0.9854285 IHUMS Tail rotor RTB requirements
41 113 01/02/2007 G-TIGF -6.810799 0.9386261 Tail Rotor IHUMS RTB's required
41 269 15/10/2007 G-TIGF -6.409599 0.931393 ? Spikes 42 172 20/10/2008 G-TIGF -9.111687 0.9634778 ? Spike
55 492 29/12/2007 G-TIGO -5.662749 0.9135376 ? Trend but no maint data (dec 08)
75 238 29/01/2007 G-TIGV -11.38692 0.9751208
? But TAIL ROTOR BLADE swap seems to cause alert
89 412 26/03/2007 G-BWWI -14.05487 0.9825414
long high period starts with TAIL ROTOR BLACK SLEEVE AND SPINDLE ASSY. FAILED 50HR. PULL-OFF CHECK.
89 414 27/03/2007 G-BWWI -14.05487 0.9825414
TAIL ROTOR G.BOX - Suspect cause of high tail rotor vibration.
107 98 05/06/2007 LN-OLC -9.560049 0.9664071 ? Trend but no maint data (Jun 07)
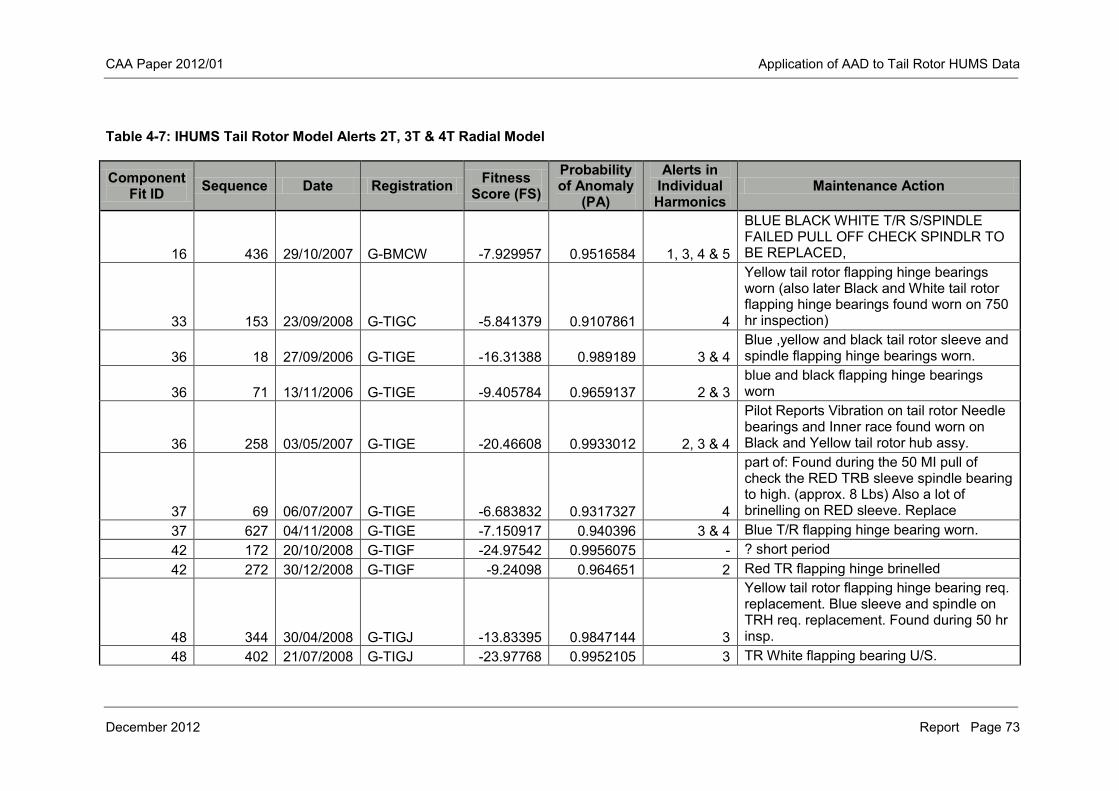
CAA Paper 2012/01 Application of AAD to Tail Rotor HUMS Data
December 2012 Report Page 73
Table 4-7: IHUMS Tail Rotor Model Alerts 2T, 3T & 4T Radial Model
Component Fit ID Sequence Date Registration Fitness
Score (FS) Probability of Anomaly
(PA)
Alerts in Individual Harmonics
Maintenance Action
16 436 29/10/2007 G-BMCW -7.929957 0.9516584 1, 3, 4 & 5
BLUE BLACK WHITE T/R S/SPINDLE FAILED PULL OFF CHECK SPINDLR TO BE REPLACED,
33 153 23/09/2008 G-TIGC -5.841379 0.9107861 4
Yellow tail rotor flapping hinge bearings worn (also later Black and White tail rotor flapping hinge bearings found worn on 750 hr inspection)
36 18 27/09/2006 G-TIGE -16.31388 0.989189 3 & 4 Blue ,yellow and black tail rotor sleeve and spindle flapping hinge bearings worn.
36 71 13/11/2006 G-TIGE -9.405784 0.9659137 2 & 3 blue and black flapping hinge bearings worn
36 258 03/05/2007 G-TIGE -20.46608 0.9933012 2, 3 & 4
Pilot Reports Vibration on tail rotor Needle bearings and Inner race found worn on Black and Yellow tail rotor hub assy.
37 69 06/07/2007 G-TIGE -6.683832 0.9317327 4
part of: Found during the 50 MI pull of check the RED TRB sleeve spindle bearing to high. (approx. 8 Lbs) Also a lot of brinelling on RED sleeve. Replace
37 627 04/11/2008 G-TIGE -7.150917 0.940396 3 & 4 Blue T/R flapping hinge bearing worn. 42 172 20/10/2008 G-TIGF -24.97542 0.9956075 - ? short period 42 272 30/12/2008 G-TIGF -9.24098 0.964651 2 Red TR flapping hinge brinelled
48 344 30/04/2008 G-TIGJ -13.83395 0.9847144 3
Yellow tail rotor flapping hinge bearing req. replacement. Blue sleeve and spindle on TRH req. replacement. Found during 50 hr insp.
48 402 21/07/2008 G-TIGJ -23.97768 0.9952105 3 TR White flapping bearing U/S.
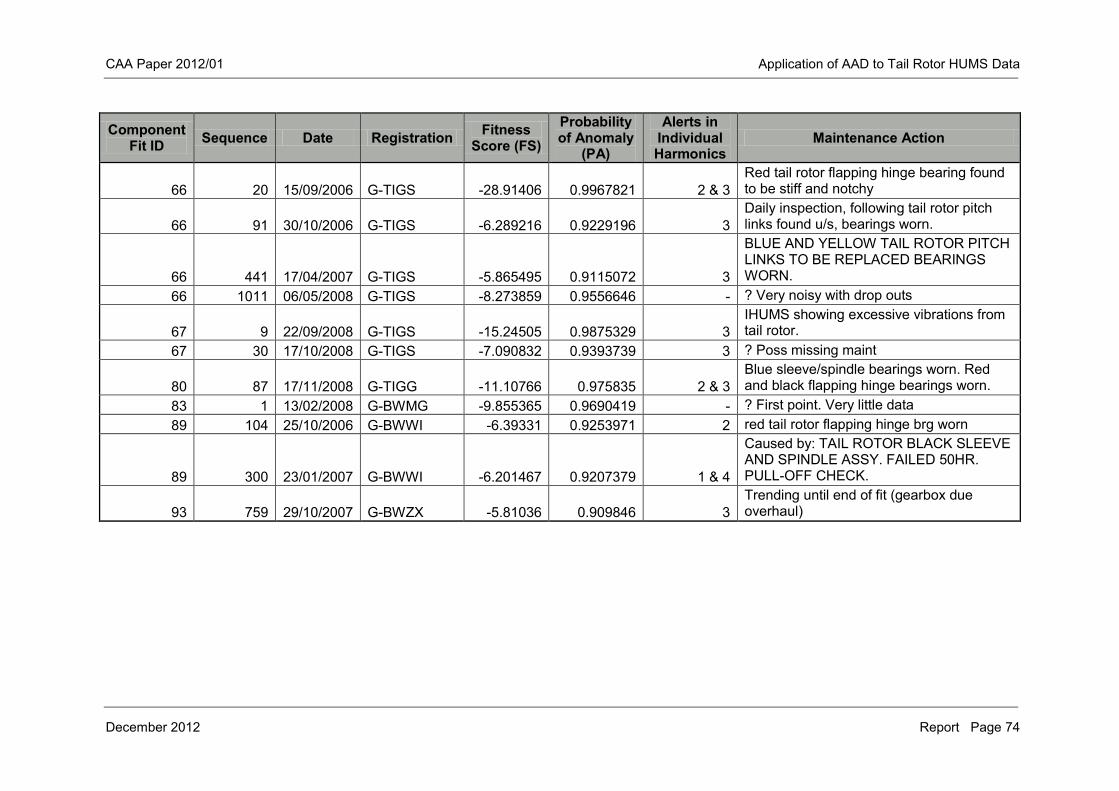
CAA Paper 2012/01 Application of AAD to Tail Rotor HUMS Data
December 2012 Report Page 74
Component Fit ID Sequence Date Registration Fitness
Score (FS) Probability of Anomaly
(PA)
Alerts in Individual Harmonics
Maintenance Action
66 20 15/09/2006 G-TIGS -28.91406 0.9967821 2 & 3 Red tail rotor flapping hinge bearing found to be stiff and notchy
66 91 30/10/2006 G-TIGS -6.289216 0.9229196 3 Daily inspection, following tail rotor pitch links found u/s, bearings worn.
66 441 17/04/2007 G-TIGS -5.865495 0.9115072 3
BLUE AND YELLOW TAIL ROTOR PITCH LINKS TO BE REPLACED BEARINGS WORN.
66 1011 06/05/2008 G-TIGS -8.273859 0.9556646 - ? Very noisy with drop outs
67 9 22/09/2008 G-TIGS -15.24505 0.9875329 3 IHUMS showing excessive vibrations from tail rotor.
67 30 17/10/2008 G-TIGS -7.090832 0.9393739 3 ? Poss missing maint
80 87 17/11/2008 G-TIGG -11.10766 0.975835 2 & 3 Blue sleeve/spindle bearings worn. Red and black flapping hinge bearings worn.
83 1 13/02/2008 G-BWMG -9.855365 0.9690419 - ? First point. Very little data 89 104 25/10/2006 G-BWWI -6.39331 0.9253971 2 red tail rotor flapping hinge brg worn
89 300 23/01/2007 G-BWWI -6.201467 0.9207379 1 & 4
Caused by: TAIL ROTOR BLACK SLEEVE AND SPINDLE ASSY. FAILED 50HR. PULL-OFF CHECK.
93 759 29/10/2007 G-BWZX -5.81036 0.909846 3 Trending until end of fit (gearbox due overhaul)
CAA Paper 2012/01 Application of AAD to Tail Rotor HUMS Data
December 2012 Report Page 75
4.4 Anomaly models incorporating trend analysis
4.4.1 Data processing techniques used
Analysis was performed to investigate processing techniques that improve the visibility of data features and reduce the effects of noise. An illustration of the data processing techniques investigated is shown in Figure 4-25. As a control models were also built using the unprocessed harmonic magnitudes. It was expected that due to the levels of noise observed in the data a significant number of alerts would be generated that did not relate to an actual anomaly. In this analysis work has focused mainly on Cruise database. A Savitzky-Golay (SG) filter using a 20 point second order filter was used to preserve any trends in the data whilst eliminating any localised variations that are likely to be due mainly to noise; unlike filters such as window averaging the Savitzky-Golay filters are effective at preserving the amplitudes of underlying narrow width features and should therefore be effective at preserving short term trends whilst eliminating high levels of noise, Figure 4-25b. A disadvantage of the smoothing filter, however, is the natural tendency to smooth step changes in the data. An alternative approach that would preserve any step changes but extract trends in the data was to use linear regression to track trends in the data. Similar to the tracking algorithm developed in the previous section the algorithm worked by taking each successive acquisition and comparing it to the current trend by measuring the perpendicular distance from the point to the linear trend line that characterised the trend. If the distance was within a prescribed number of standard deviations the point was added to the trend and the linear trend line updated. If the point was outside the trend it was used to generate a new linear trend, Figure 4-25c. A trend anomaly model was developed from this process by measuring the difference between each point in the trended data and the median of the proceeding points. It was assumed for this analysis that any maintenance action performed would return the TR to a healthy state. Therefore after each lifetime the number of points used to calculate a median value was reset (zeroed). This had the effect of taking into account any jumps in the amplitude values that followed a maintenance action and effectively normalised the data. To enable identification of the ability of the different models to identify faults based on the individual TR harmonics, separate anomaly models were constructed for each harmonic.
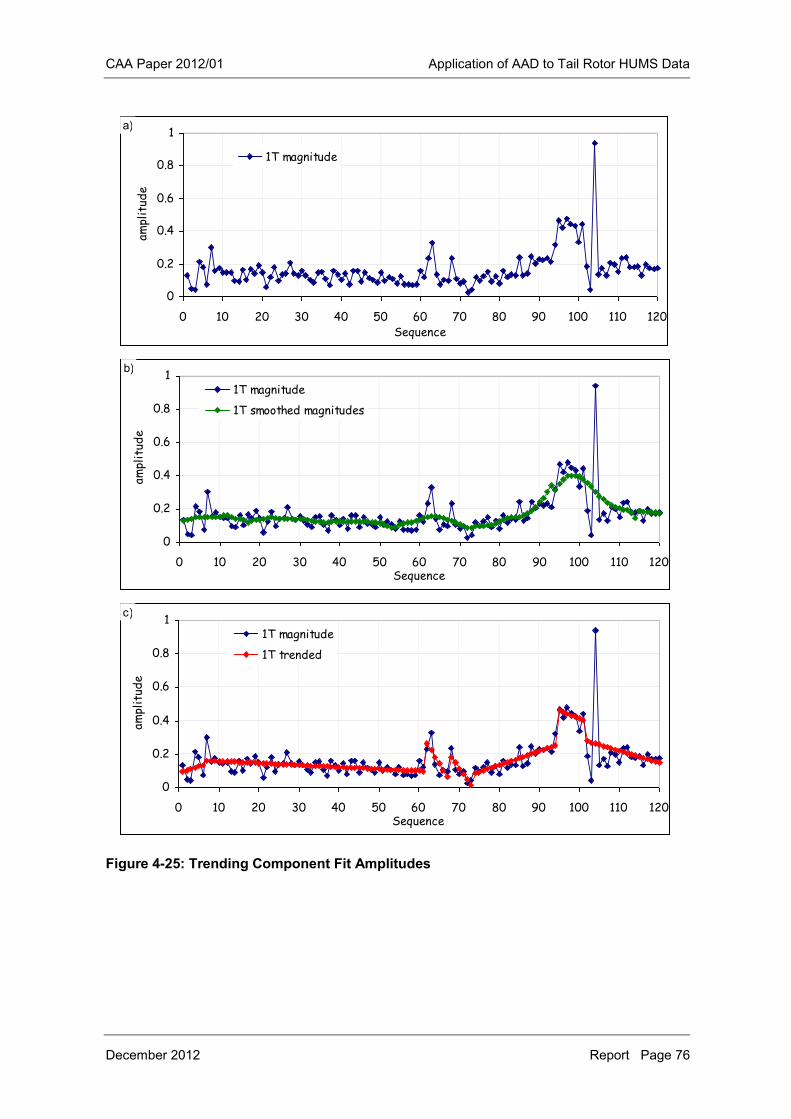
CAA Paper 2012/01 Application of AAD to Tail Rotor HUMS Data
December 2012 Report Page 76
Figure 4-25: Trending Component Fit Amplitudes
0
0.2
0.4
0.6
0.8
1
0 10 20 30 40 50 60 70 80 90 100 110 120Sequence
ampl
itud
e1T magnitude
a)
0
0.2
0.4
0.6
0.8
1
0 10 20 30 40 50 60 70 80 90 100 110 120Sequence
ampl
itud
e
1T magnitude
1T smoothed magnitudes
b)
0
0.2
0.4
0.6
0.8
1
0 10 20 30 40 50 60 70 80 90 100 110 120Sequence
ampl
itud
e
1T magnitude
1T trended
c)
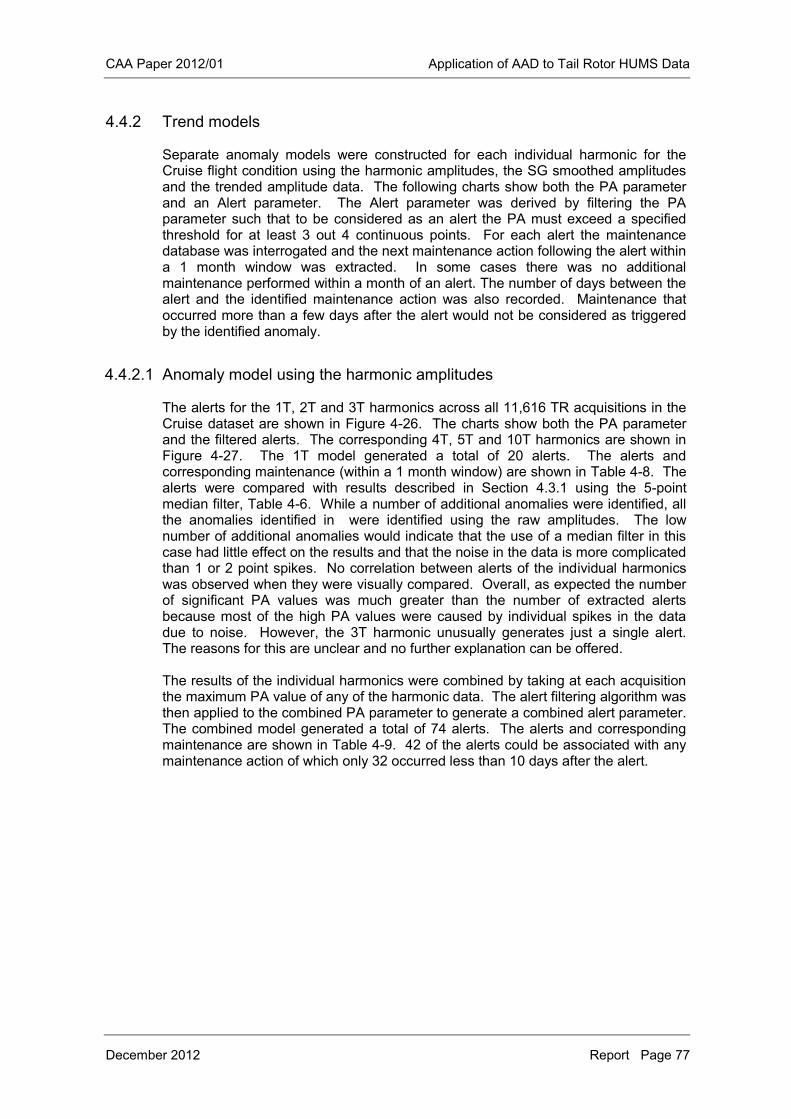
CAA Paper 2012/01 Application of AAD to Tail Rotor HUMS Data
December 2012 Report Page 77
4.4.2 Trend models
Separate anomaly models were constructed for each individual harmonic for the Cruise flight condition using the harmonic amplitudes, the SG smoothed amplitudes and the trended amplitude data. The following charts show both the PA parameter and an Alert parameter. The Alert parameter was derived by filtering the PA parameter such that to be considered as an alert the PA must exceed a specified threshold for at least 3 out 4 continuous points. For each alert the maintenance database was interrogated and the next maintenance action following the alert within a 1 month window was extracted. In some cases there was no additional maintenance performed within a month of an alert. The number of days between the alert and the identified maintenance action was also recorded. Maintenance that occurred more than a few days after the alert would not be considered as triggered by the identified anomaly.
4.4.2.1 Anomaly model using the harmonic amplitudes
The alerts for the 1T, 2T and 3T harmonics across all 11,616 TR acquisitions in the Cruise dataset are shown in Figure 4-26. The charts show both the PA parameter and the filtered alerts. The corresponding 4T, 5T and 10T harmonics are shown in Figure 4-27. The 1T model generated a total of 20 alerts. The alerts and corresponding maintenance (within a 1 month window) are shown in Table 4-8. The alerts were compared with results described in Section 4.3.1 using the 5-point median filter, Table 4-6. While a number of additional anomalies were identified, all the anomalies identified in were identified using the raw amplitudes. The low number of additional anomalies would indicate that the use of a median filter in this case had little effect on the results and that the noise in the data is more complicated than 1 or 2 point spikes. No correlation between alerts of the individual harmonics was observed when they were visually compared. Overall, as expected the number of significant PA values was much greater than the number of extracted alerts because most of the high PA values were caused by individual spikes in the data due to noise. However, the 3T harmonic unusually generates just a single alert. The reasons for this are unclear and no further explanation can be offered. The results of the individual harmonics were combined by taking at each acquisition the maximum PA value of any of the harmonic data. The alert filtering algorithm was then applied to the combined PA parameter to generate a combined alert parameter. The combined model generated a total of 74 alerts. The alerts and corresponding maintenance are shown in Table 4-9. 42 of the alerts could be associated with any maintenance action of which only 32 occurred less than 10 days after the alert.
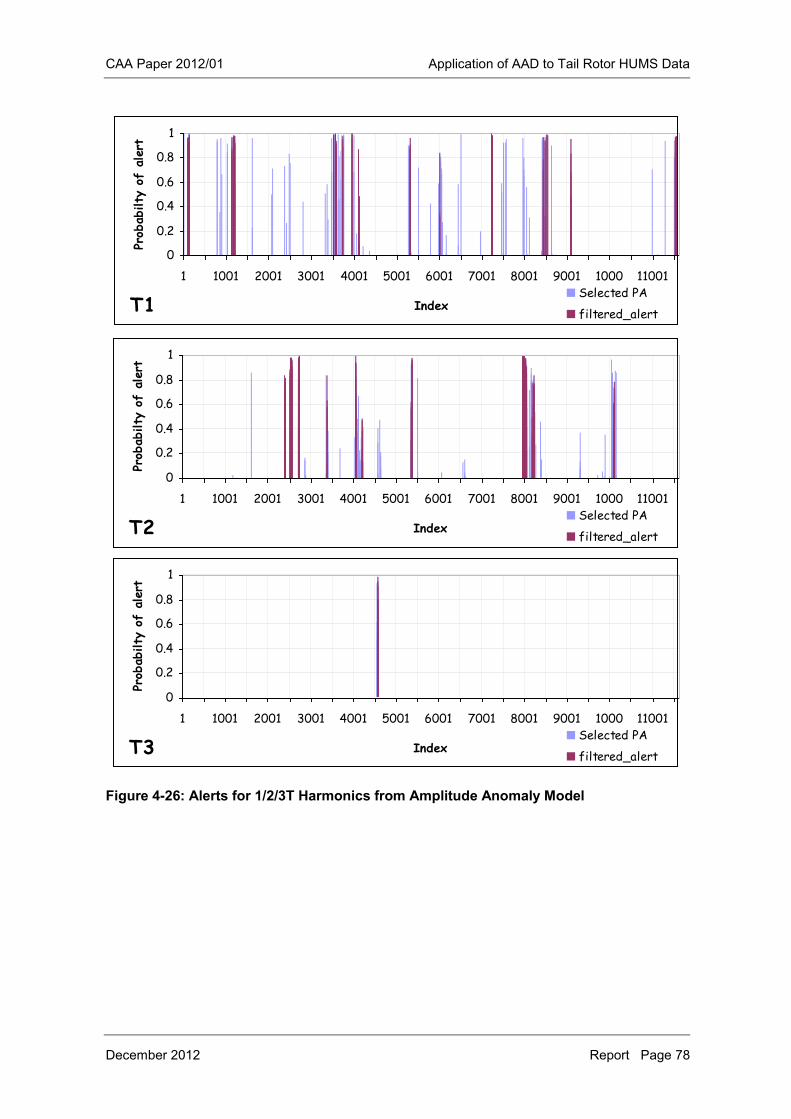
CAA Paper 2012/01 Application of AAD to Tail Rotor HUMS Data
December 2012 Report Page 78
Figure 4-26: Alerts for 1/2/3T Harmonics from Amplitude Anomaly Model
0
0.2
0.4
0.6
0.8
1
1 1001 2001 3001 4001 5001 6001 7001 8001 9001 1000 11001
Index
Prob
abilty
of
aler
t
Selected PA
filtered_alertT1
0
0.2
0.4
0.6
0.8
1
1 1001 2001 3001 4001 5001 6001 7001 8001 9001 1000 11001
Index
Prob
abilty
of
aler
t
Selected PA
filtered_alertT2
0
0.2
0.4
0.6
0.8
1
1 1001 2001 3001 4001 5001 6001 7001 8001 9001 1000 11001
Index
Prob
abilty
of
aler
t
Selected PA
filtered_alertT3
CAA Paper 2012/01 Application of AAD to Tail Rotor HUMS Data
December 2012 Report Page 79
Figure 4-27: Alerts for 4/5/6T Harmonics from Amplitude Anomaly Models
0
0.2
0.4
0.6
0.8
1
1 1001 2001 3001 4001 5001 6001 7001 8001 9001 1000 11001
Index
Prob
abilty
of
aler
t
Selected PA
filtered_alertT4
0
0.2
0.4
0.6
0.8
1
1 1001 2001 3001 4001 5001 6001 7001 8001 9001 1000 11001
Index
Prob
abilty
of
alert
Selected PA
filtered_alertT5
0.00E+00
2.00E-01
4.00E-01
6.00E-01
8.00E-01
1.00E+00
1 1001 2001 3001 4001 5001 6001 7001 8001 9001 1000 11001
Index
Prob
abilty
of
alert
Selected PA
filtered_alertT10
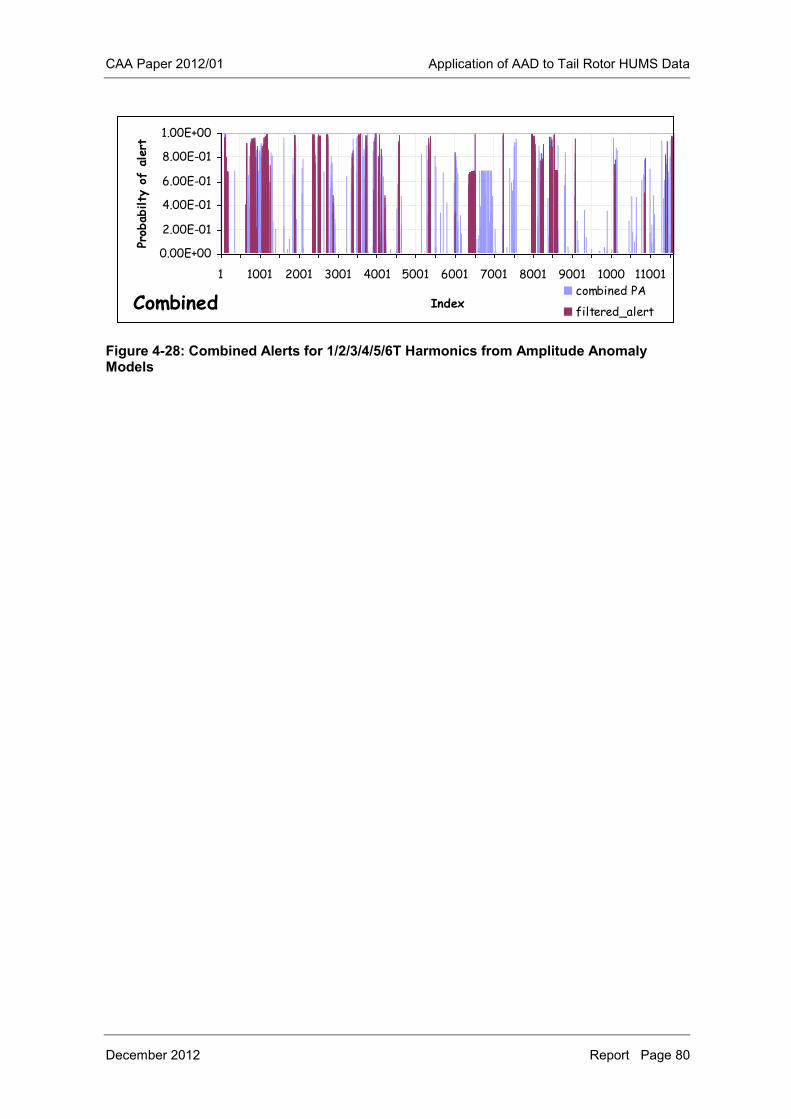
CAA Paper 2012/01 Application of AAD to Tail Rotor HUMS Data
December 2012 Report Page 80
Figure 4-28: Combined Alerts for 1/2/3/4/5/6T Harmonics from Amplitude Anomaly Models
0.00E+00
2.00E-01
4.00E-01
6.00E-01
8.00E-01
1.00E+00
1 1001 2001 3001 4001 5001 6001 7001 8001 9001 1000 11001
Index
Prob
abilty
of
aler
t
combined PA
filtered_alertCombined
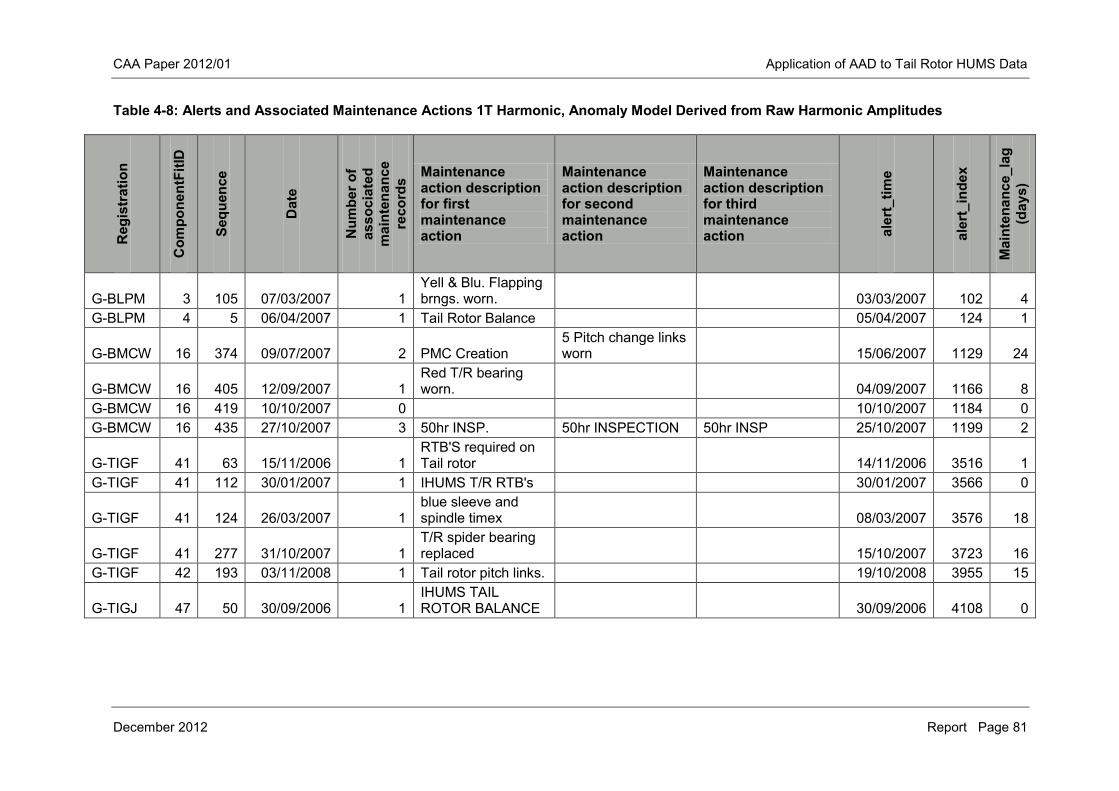
CAA Paper 2012/01 Application of AAD to Tail Rotor HUMS Data
December 2012 Report Page 81
Table 4-8: Alerts and Associated Maintenance Actions 1T Harmonic, Anomaly Model Derived from Raw Harmonic Amplitudes R
egis
trat
ion
Com
pone
ntFi
tID
Sequ
ence
Dat
e
Num
ber o
f as
soci
ated
m
aint
enan
ce
reco
rds Maintenance
action description for first maintenance action
Maintenance action description for second maintenance action
Maintenance action description for third maintenance action al
ert_
time
aler
t_in
dex
Mai
nten
ance
_lag
(d
ays)
G-BLPM 3 105 07/03/2007 1 Yell & Blu. Flapping brngs. worn. 03/03/2007 102 4
G-BLPM 4 5 06/04/2007 1 Tail Rotor Balance 05/04/2007 124 1
G-BMCW 16 374 09/07/2007 2 PMC Creation 5 Pitch change links worn 15/06/2007 1129 24
G-BMCW 16 405 12/09/2007 1 Red T/R bearing worn. 04/09/2007 1166 8
G-BMCW 16 419 10/10/2007 0 10/10/2007 1184 0 G-BMCW 16 435 27/10/2007 3 50hr INSP. 50hr INSPECTION 50hr INSP 25/10/2007 1199 2
G-TIGF 41 63 15/11/2006 1 RTB'S required on Tail rotor 14/11/2006 3516 1
G-TIGF 41 112 30/01/2007 1 IHUMS T/R RTB's 30/01/2007 3566 0
G-TIGF 41 124 26/03/2007 1 blue sleeve and spindle timex 08/03/2007 3576 18
G-TIGF 41 277 31/10/2007 1 T/R spider bearing replaced 15/10/2007 3723 16
G-TIGF 42 193 03/11/2008 1 Tail rotor pitch links. 19/10/2008 3955 15
G-TIGJ 47 50 30/09/2006 1 IHUMS TAIL ROTOR BALANCE 30/09/2006 4108 0
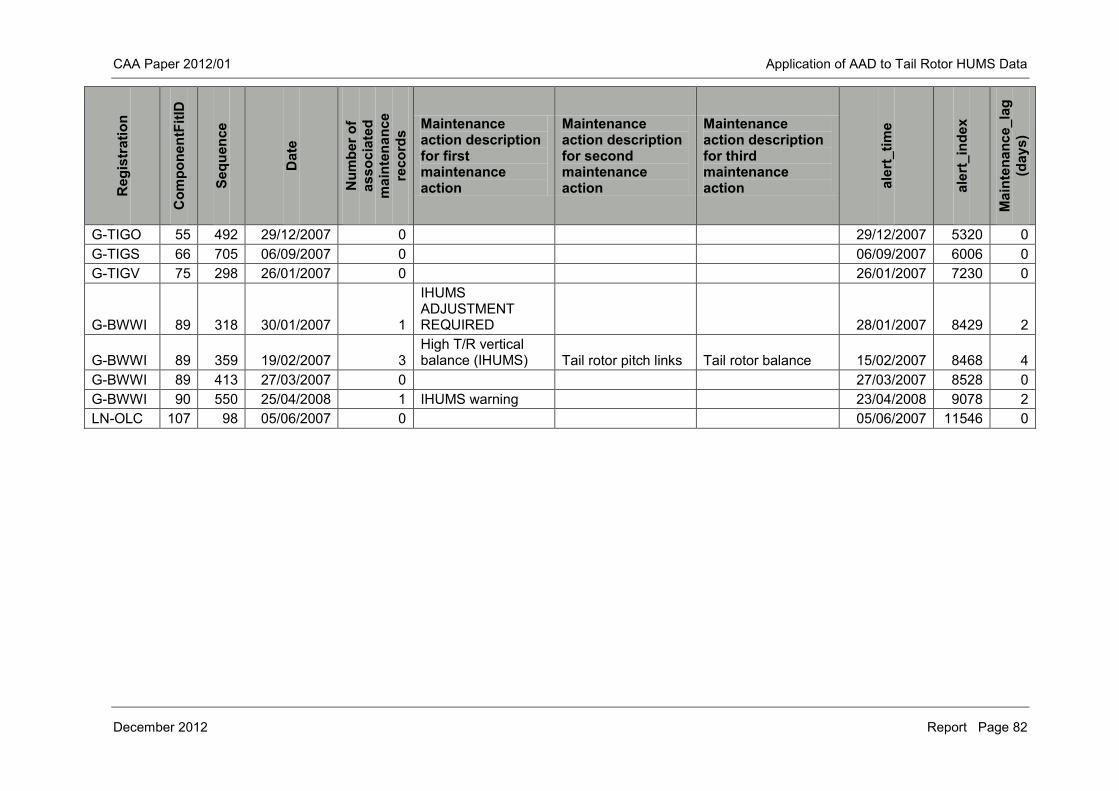
CAA Paper 2012/01 Application of AAD to Tail Rotor HUMS Data
December 2012 Report Page 82
Reg
istr
atio
n
Com
pone
ntFi
tID
Sequ
ence
Dat
e
Num
ber o
f as
soci
ated
m
aint
enan
ce
reco
rds Maintenance
action description for first maintenance action
Maintenance action description for second maintenance action
Maintenance action description for third maintenance action al
ert_
time
aler
t_in
dex
Mai
nten
ance
_lag
(d
ays)
G-TIGO 55 492 29/12/2007 0 29/12/2007 5320 0 G-TIGS 66 705 06/09/2007 0 06/09/2007 6006 0 G-TIGV 75 298 26/01/2007 0 26/01/2007 7230 0
G-BWWI 89 318 30/01/2007 1
IHUMS ADJUSTMENT REQUIRED 28/01/2007 8429 2
G-BWWI 89 359 19/02/2007 3 High T/R vertical balance (IHUMS) Tail rotor pitch links Tail rotor balance 15/02/2007 8468 4
G-BWWI 89 413 27/03/2007 0 27/03/2007 8528 0 G-BWWI 90 550 25/04/2008 1 IHUMS warning 23/04/2008 9078 2 LN-OLC 107 98 05/06/2007 0 05/06/2007 11546 0
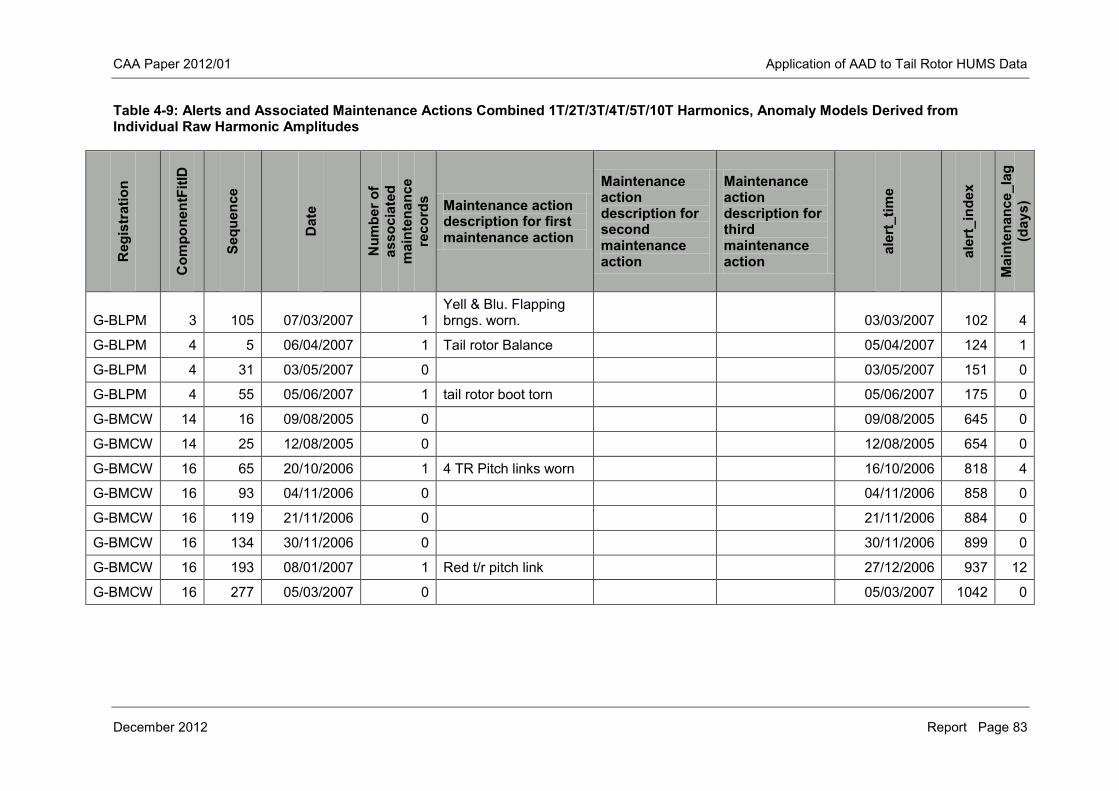
CAA Paper 2012/01 Application of AAD to Tail Rotor HUMS Data
December 2012 Report Page 83
Table 4-9: Alerts and Associated Maintenance Actions Combined 1T/2T/3T/4T/5T/10T Harmonics, Anomaly Models Derived from Individual Raw Harmonic Amplitudes
Reg
istr
atio
n
Com
pone
ntFi
tID
Sequ
ence
Dat
e
Num
ber o
f as
soci
ated
m
aint
enan
ce
reco
rds Maintenance action
description for first maintenance action
Maintenance action description for second maintenance action
Maintenance action description for third maintenance action
aler
t_tim
e
aler
t_in
dex
Mai
nten
ance
_lag
(d
ays)
G-BLPM 3 105 07/03/2007 1 Yell & Blu. Flapping brngs. worn. 03/03/2007 102 4
G-BLPM 4 5 06/04/2007 1 Tail rotor Balance 05/04/2007 124 1
G-BLPM 4 31 03/05/2007 0 03/05/2007 151 0
G-BLPM 4 55 05/06/2007 1 tail rotor boot torn 05/06/2007 175 0
G-BMCW 14 16 09/08/2005 0 09/08/2005 645 0
G-BMCW 14 25 12/08/2005 0 12/08/2005 654 0
G-BMCW 16 65 20/10/2006 1 4 TR Pitch links worn 16/10/2006 818 4
G-BMCW 16 93 04/11/2006 0 04/11/2006 858 0
G-BMCW 16 119 21/11/2006 0 21/11/2006 884 0
G-BMCW 16 134 30/11/2006 0 30/11/2006 899 0
G-BMCW 16 193 08/01/2007 1 Red t/r pitch link 27/12/2006 937 12
G-BMCW 16 277 05/03/2007 0 05/03/2007 1042 0
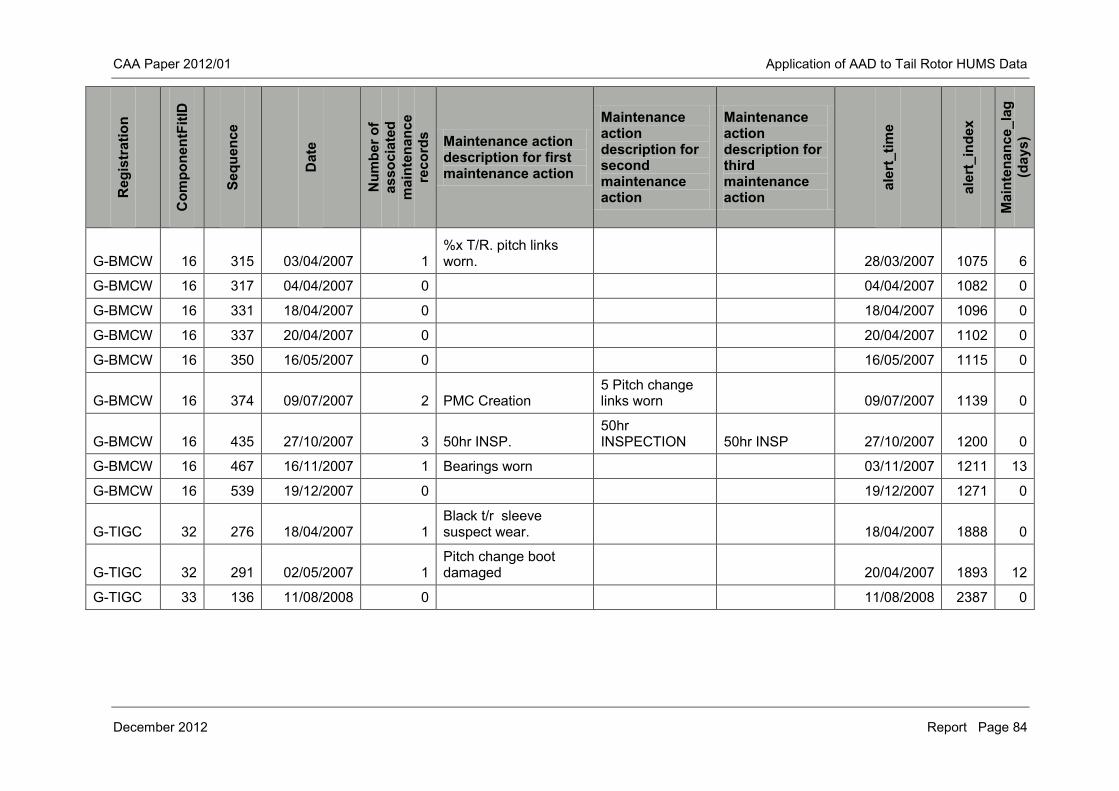
CAA Paper 2012/01 Application of AAD to Tail Rotor HUMS Data
December 2012 Report Page 84
Reg
istr
atio
n
Com
pone
ntFi
tID
Sequ
ence
Dat
e
Num
ber o
f as
soci
ated
m
aint
enan
ce
reco
rds Maintenance action
description for first maintenance action
Maintenance action description for second maintenance action
Maintenance action description for third maintenance action
aler
t_tim
e
aler
t_in
dex
Mai
nten
ance
_lag
(d
ays)
G-BMCW 16 315 03/04/2007 1 %x T/R. pitch links worn. 28/03/2007 1075 6
G-BMCW 16 317 04/04/2007 0 04/04/2007 1082 0
G-BMCW 16 331 18/04/2007 0 18/04/2007 1096 0
G-BMCW 16 337 20/04/2007 0 20/04/2007 1102 0
G-BMCW 16 350 16/05/2007 0 16/05/2007 1115 0
G-BMCW 16 374 09/07/2007 2 PMC Creation 5 Pitch change links worn 09/07/2007 1139 0
G-BMCW 16 435 27/10/2007 3 50hr INSP. 50hr INSPECTION 50hr INSP 27/10/2007 1200 0
G-BMCW 16 467 16/11/2007 1 Bearings worn 03/11/2007 1211 13
G-BMCW 16 539 19/12/2007 0 19/12/2007 1271 0
G-TIGC 32 276 18/04/2007 1 Black t/r sleeve suspect wear. 18/04/2007 1888 0
G-TIGC 32 291 02/05/2007 1 Pitch change boot damaged 20/04/2007 1893 12
G-TIGC 33 136 11/08/2008 0 11/08/2008 2387 0
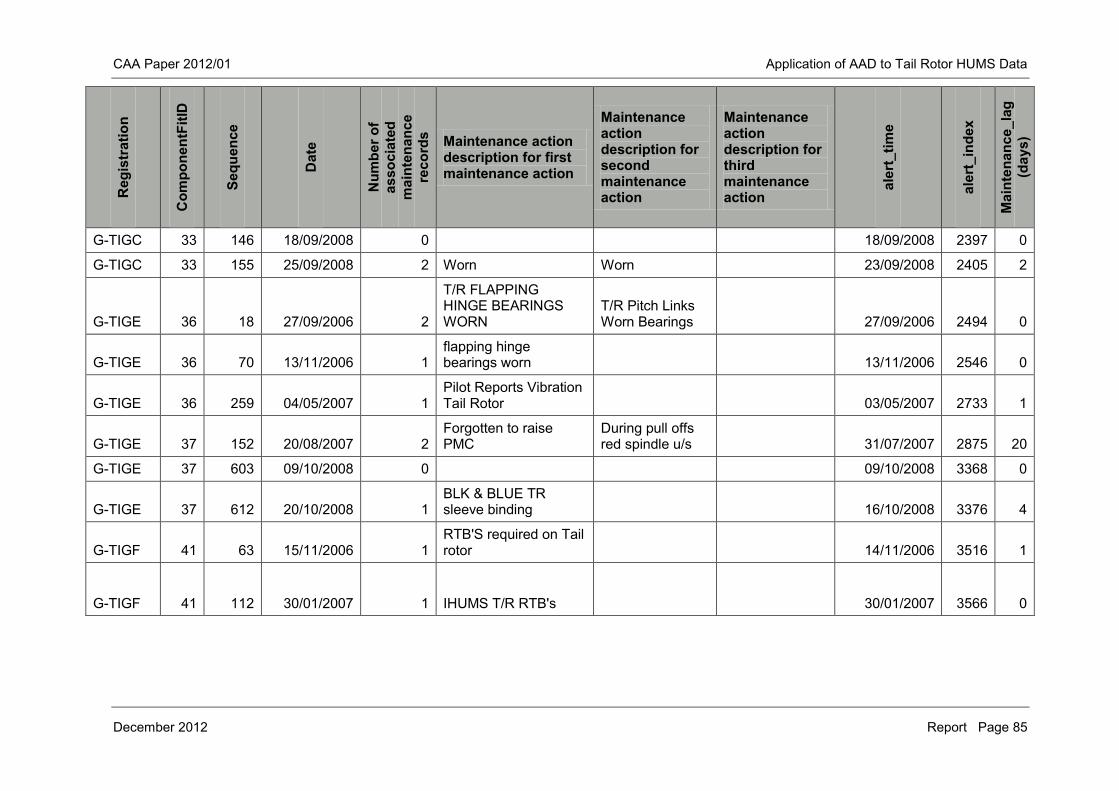
CAA Paper 2012/01 Application of AAD to Tail Rotor HUMS Data
December 2012 Report Page 85
Reg
istr
atio
n
Com
pone
ntFi
tID
Sequ
ence
Dat
e
Num
ber o
f as
soci
ated
m
aint
enan
ce
reco
rds Maintenance action
description for first maintenance action
Maintenance action description for second maintenance action
Maintenance action description for third maintenance action
aler
t_tim
e
aler
t_in
dex
Mai
nten
ance
_lag
(d
ays)
G-TIGC 33 146 18/09/2008 0 18/09/2008 2397 0
G-TIGC 33 155 25/09/2008 2 Worn Worn 23/09/2008 2405 2
G-TIGE 36 18 27/09/2006 2
T/R FLAPPING HINGE BEARINGS WORN
T/R Pitch Links Worn Bearings 27/09/2006 2494 0
G-TIGE 36 70 13/11/2006 1 flapping hinge bearings worn 13/11/2006 2546 0
G-TIGE 36 259 04/05/2007 1 Pilot Reports Vibration Tail Rotor 03/05/2007 2733 1
G-TIGE 37 152 20/08/2007 2 Forgotten to raise PMC
During pull offs red spindle u/s 31/07/2007 2875 20
G-TIGE 37 603 09/10/2008 0 09/10/2008 3368 0
G-TIGE 37 612 20/10/2008 1 BLK & BLUE TR sleeve binding 16/10/2008 3376 4
G-TIGF 41 63 15/11/2006 1 RTB'S required on Tail rotor 14/11/2006 3516 1
G-TIGF 41 112 30/01/2007 1 IHUMS T/R RTB's 30/01/2007 3566 0
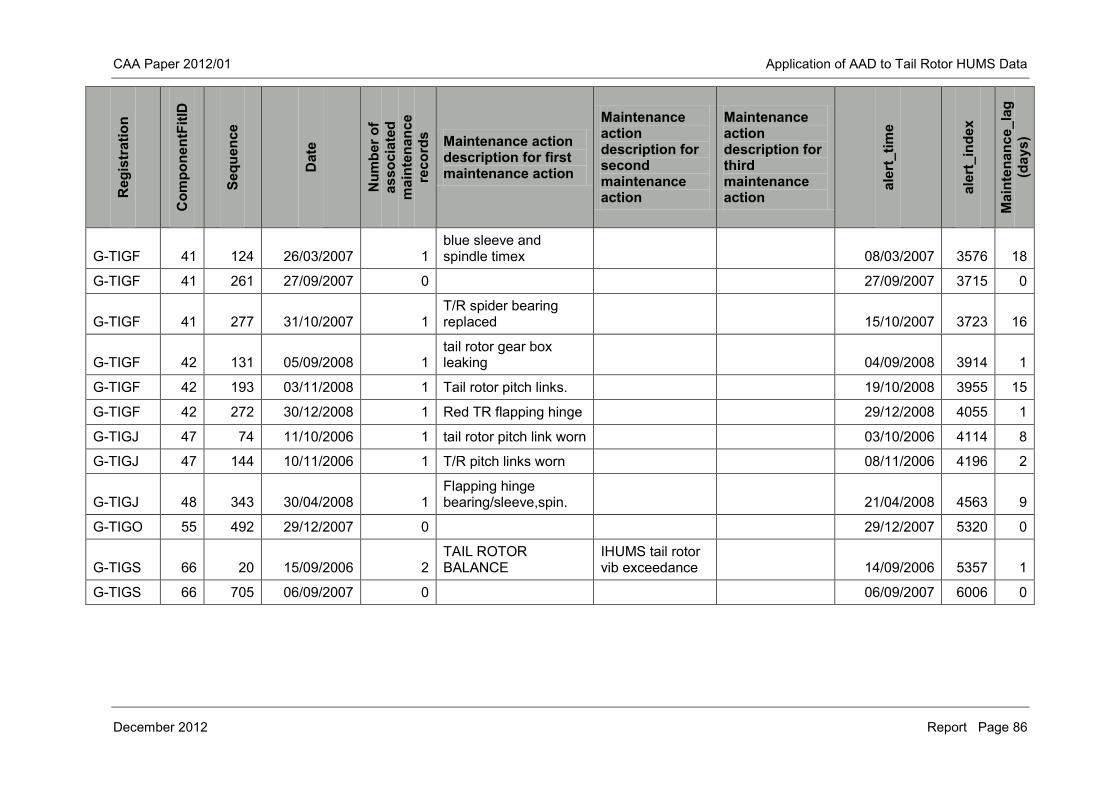
CAA Paper 2012/01 Application of AAD to Tail Rotor HUMS Data
December 2012 Report Page 86
Reg
istr
atio
n
Com
pone
ntFi
tID
Sequ
ence
Dat
e
Num
ber o
f as
soci
ated
m
aint
enan
ce
reco
rds Maintenance action
description for first maintenance action
Maintenance action description for second maintenance action
Maintenance action description for third maintenance action
aler
t_tim
e
aler
t_in
dex
Mai
nten
ance
_lag
(d
ays)
G-TIGF 41 124 26/03/2007 1 blue sleeve and spindle timex 08/03/2007 3576 18
G-TIGF 41 261 27/09/2007 0 27/09/2007 3715 0
G-TIGF 41 277 31/10/2007 1 T/R spider bearing replaced 15/10/2007 3723 16
G-TIGF 42 131 05/09/2008 1 tail rotor gear box leaking 04/09/2008 3914 1
G-TIGF 42 193 03/11/2008 1 Tail rotor pitch links. 19/10/2008 3955 15
G-TIGF 42 272 30/12/2008 1 Red TR flapping hinge 29/12/2008 4055 1
G-TIGJ 47 74 11/10/2006 1 tail rotor pitch link worn 03/10/2006 4114 8
G-TIGJ 47 144 10/11/2006 1 T/R pitch links worn 08/11/2006 4196 2
G-TIGJ 48 343 30/04/2008 1 Flapping hinge bearing/sleeve,spin. 21/04/2008 4563 9
G-TIGO 55 492 29/12/2007 0 29/12/2007 5320 0
G-TIGS 66 20 15/09/2006 2 TAIL ROTOR BALANCE
IHUMS tail rotor vib exceedance 14/09/2006 5357 1
G-TIGS 66 705 06/09/2007 0 06/09/2007 6006 0
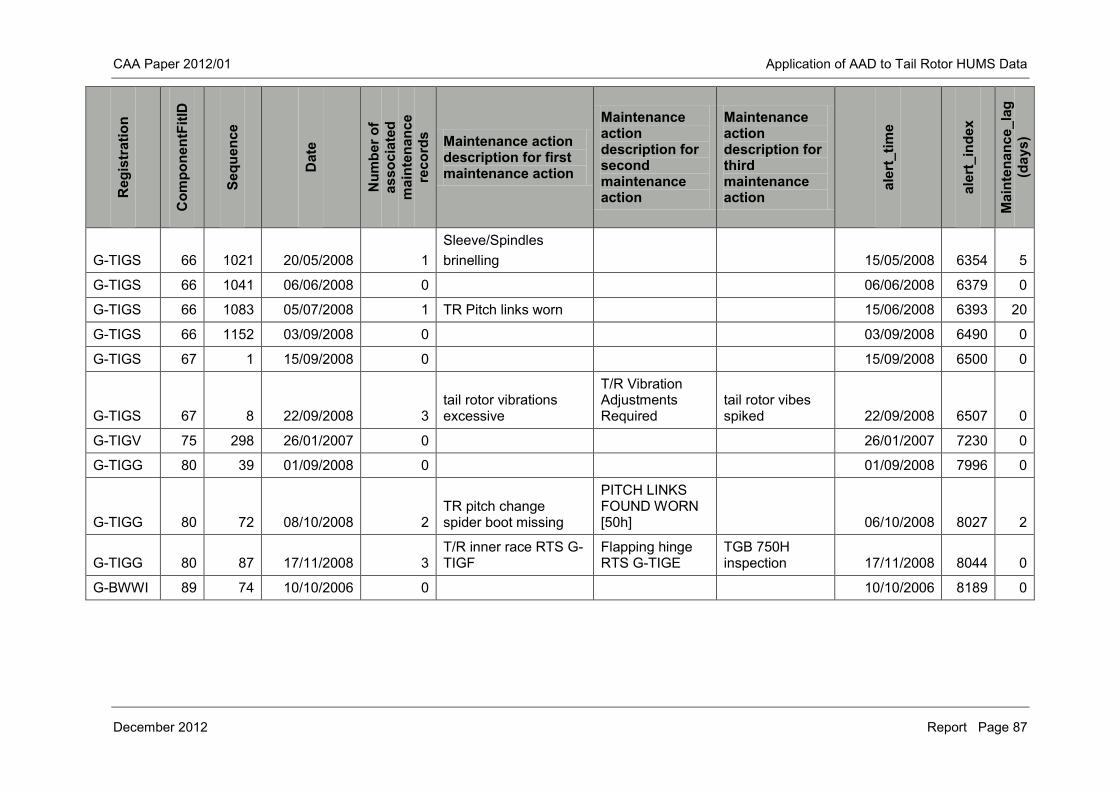
CAA Paper 2012/01 Application of AAD to Tail Rotor HUMS Data
December 2012 Report Page 87
Reg
istr
atio
n
Com
pone
ntFi
tID
Sequ
ence
Dat
e
Num
ber o
f as
soci
ated
m
aint
enan
ce
reco
rds Maintenance action
description for first maintenance action
Maintenance action description for second maintenance action
Maintenance action description for third maintenance action
aler
t_tim
e
aler
t_in
dex
Mai
nten
ance
_lag
(d
ays)
G-TIGS 66 1021 20/05/2008 1 Sleeve/Spindles brinelling 15/05/2008 6354 5
G-TIGS 66 1041 06/06/2008 0 06/06/2008 6379 0
G-TIGS 66 1083 05/07/2008 1 TR Pitch links worn 15/06/2008 6393 20
G-TIGS 66 1152 03/09/2008 0 03/09/2008 6490 0
G-TIGS 67 1 15/09/2008 0 15/09/2008 6500 0
G-TIGS 67 8 22/09/2008 3 tail rotor vibrations excessive
T/R Vibration Adjustments Required
tail rotor vibes spiked 22/09/2008 6507 0
G-TIGV 75 298 26/01/2007 0 26/01/2007 7230 0
G-TIGG 80 39 01/09/2008 0 01/09/2008 7996 0
G-TIGG 80 72 08/10/2008 2 TR pitch change spider boot missing
PITCH LINKS FOUND WORN [50h] 06/10/2008 8027 2
G-TIGG 80 87 17/11/2008 3 T/R inner race RTS G-TIGF
Flapping hinge RTS G-TIGE
TGB 750H inspection 17/11/2008 8044 0
G-BWWI 89 74 10/10/2006 0 10/10/2006 8189 0
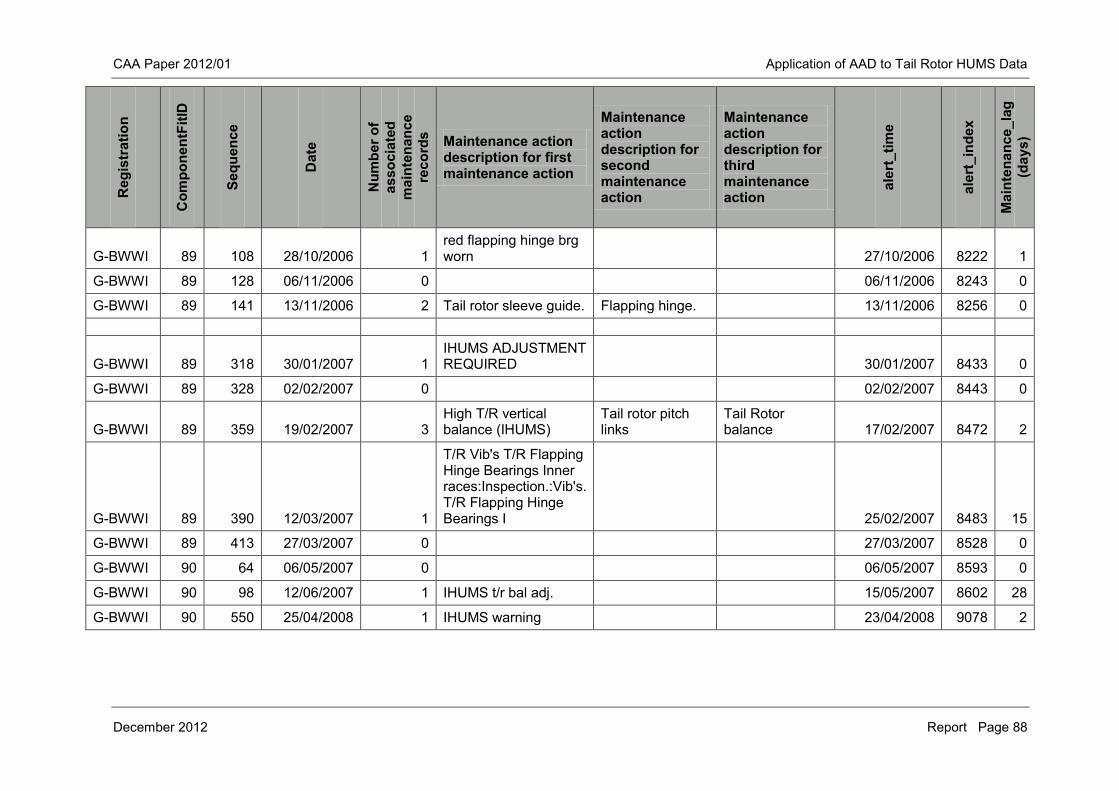
CAA Paper 2012/01 Application of AAD to Tail Rotor HUMS Data
December 2012 Report Page 88
Reg
istr
atio
n
Com
pone
ntFi
tID
Sequ
ence
Dat
e
Num
ber o
f as
soci
ated
m
aint
enan
ce
reco
rds Maintenance action
description for first maintenance action
Maintenance action description for second maintenance action
Maintenance action description for third maintenance action
aler
t_tim
e
aler
t_in
dex
Mai
nten
ance
_lag
(d
ays)
G-BWWI 89 108 28/10/2006 1 red flapping hinge brg worn 27/10/2006 8222 1
G-BWWI 89 128 06/11/2006 0 06/11/2006 8243 0
G-BWWI 89 141 13/11/2006 2 Tail rotor sleeve guide. Flapping hinge. 13/11/2006 8256 0
G-BWWI 89 318 30/01/2007 1
IHUMS ADJUSTMENT REQUIRED 30/01/2007 8433 0
G-BWWI 89 328 02/02/2007 0 02/02/2007 8443 0
G-BWWI 89 359 19/02/2007 3 High T/R vertical balance (IHUMS)
Tail rotor pitch links
Tail Rotor balance 17/02/2007 8472 2
G-BWWI 89 390 12/03/2007 1
T/R Vib's T/R Flapping Hinge Bearings Inner races:Inspection.:Vib's. T/R Flapping Hinge Bearings I 25/02/2007 8483 15
G-BWWI 89 413 27/03/2007 0 27/03/2007 8528 0
G-BWWI 90 64 06/05/2007 0 06/05/2007 8593 0
G-BWWI 90 98 12/06/2007 1 IHUMS t/r bal adj. 15/05/2007 8602 28
G-BWWI 90 550 25/04/2008 1 IHUMS warning 23/04/2008 9078 2
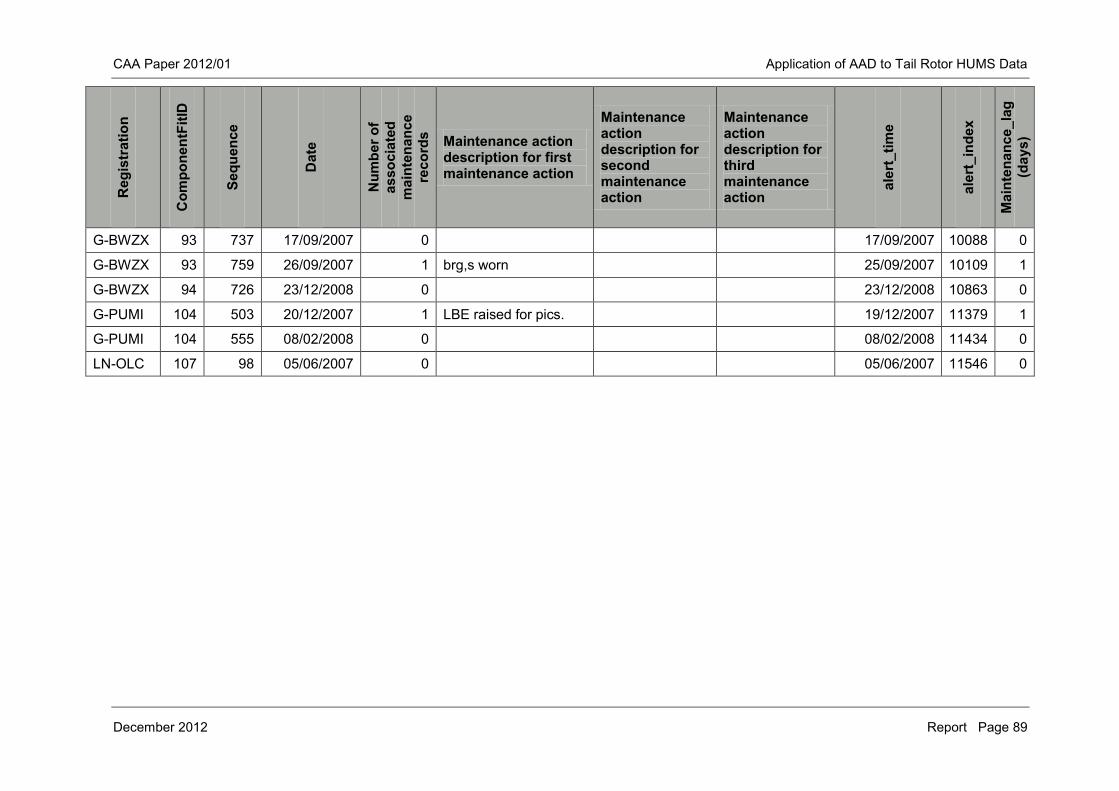
CAA Paper 2012/01 Application of AAD to Tail Rotor HUMS Data
December 2012 Report Page 89
Reg
istr
atio
n
Com
pone
ntFi
tID
Sequ
ence
Dat
e
Num
ber o
f as
soci
ated
m
aint
enan
ce
reco
rds Maintenance action
description for first maintenance action
Maintenance action description for second maintenance action
Maintenance action description for third maintenance action
aler
t_tim
e
aler
t_in
dex
Mai
nten
ance
_lag
(d
ays)
G-BWZX 93 737 17/09/2007 0 17/09/2007 10088 0
G-BWZX 93 759 26/09/2007 1 brg,s worn 25/09/2007 10109 1
G-BWZX 94 726 23/12/2008 0 23/12/2008 10863 0
G-PUMI 104 503 20/12/2007 1 LBE raised for pics. 19/12/2007 11379 1
G-PUMI 104 555 08/02/2008 0 08/02/2008 11434 0
LN-OLC 107 98 05/06/2007 0 05/06/2007 11546 0
CAA Paper 2012/01 Application of AAD to Tail Rotor HUMS Data
December 2012 Report Page 90
4.4.2.2 Anomaly model using the SG smoothed harmonic amplitudes
The alerts for the 1T, 2T and 3T harmonics across all 11,616 TR acquisitions are shown in Figure 4-29. The charts show both the PA parameter and the filtered alerts. The corresponding 4T, 5T and 10T harmonics are a shown in Figure 4-30. The 1T model generated a total of 12 alerts. The alerts and corresponding maintenance are shown in Table 4-10. As would be expected in comparison to the raw amplitude model outputs most of the high PA values trigger alerts using the smoothed harmonics. Eight of the 12 T1 alerts coincide with the outputs of the model based on 1T raw amplitude data. From visual inspection of the data a number of alerts appear to exist in multiple individual harmonic models. In particular alerts can be seen in the 1T, 4T, 5T and 10T model outputs at approximate index 1100, also in the 1T, 2T, 4T, 5T and 10T model outputs at approximate index 6500 (Component Fit 66), and in the 1T, 2T, 4T, 5T and 10T harmonics at approximate index 8600 (Component Fit 90). These results are shown for the two Component Fits that had anomalies appearing in all harmonics (except 3T) in Figure 4-32 and Figure 4-33; Figure 4-32 shows the 1T harmonic and PA for Component Fit 66, while Figure 4-33 shows the corresponding values for Component Fit 90. The anomalies occur where the signals flat line. This is characteristic of an instrumentation fault. Since a fault in the signal will typically produce anomalies in all TR harmonics it would be expected that anomalies would be detected in all these harmonics. It is interesting to note that the flat line signal was not identified as an anomaly by the raw amplitudes methods. Nevertheless, while a genuine fault can generate anomalies in several harmonics, a fault that appears in all (or the majority of) harmonics is likely to be due to instrumentation. The results of the individual harmonics were combined by taking at each acquisition the maximum PA value of any of the harmonic data. The alert filtering algorithm was then applied to the combined PA parameter to generate a combined alert parameter. The combined model generated a total of 61 alerts. The alerts and corresponding maintenance are shown in Table 4-11. 35 of the alerts could be associated with any maintenance action while of those only 22 occurred less than 10 days after the alert.
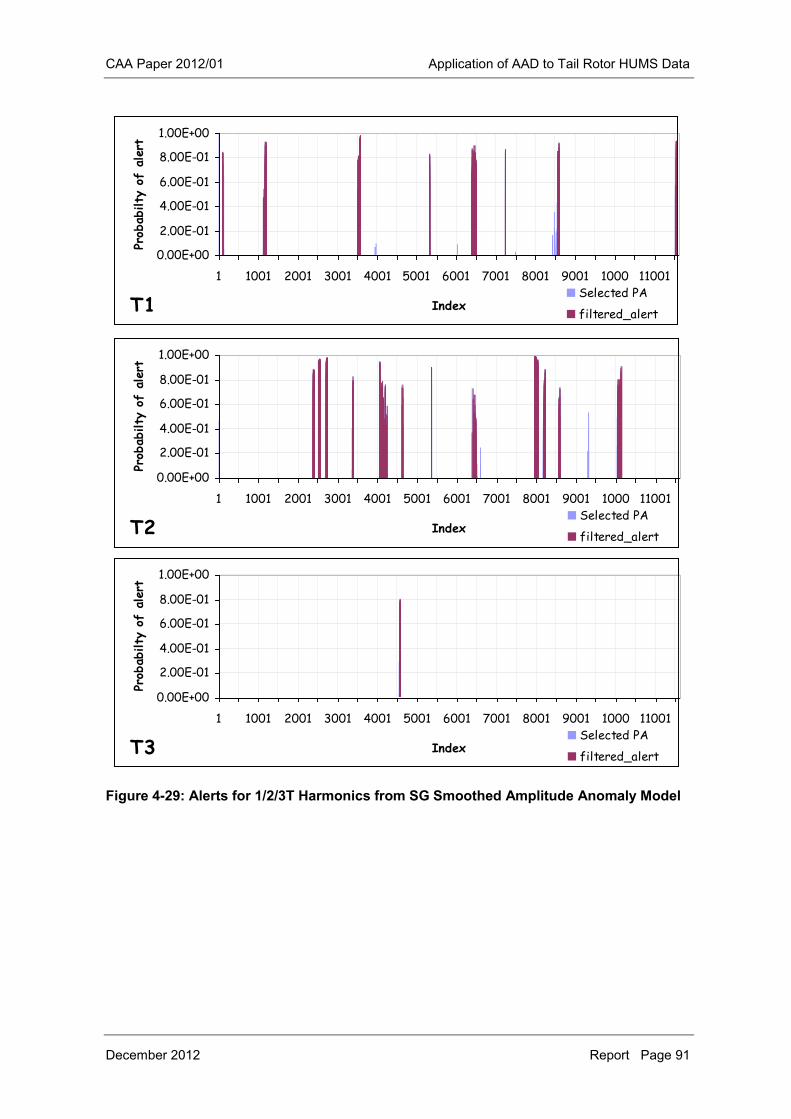
CAA Paper 2012/01 Application of AAD to Tail Rotor HUMS Data
December 2012 Report Page 91
Figure 4-29: Alerts for 1/2/3T Harmonics from SG Smoothed Amplitude Anomaly Model
0.00E+00
2.00E-01
4.00E-01
6.00E-01
8.00E-01
1.00E+00
1 1001 2001 3001 4001 5001 6001 7001 8001 9001 1000 11001
Index
Prob
abilty
of
aler
t
Selected PA
filtered_alertT1
0.00E+00
2.00E-01
4.00E-01
6.00E-01
8.00E-01
1.00E+00
1 1001 2001 3001 4001 5001 6001 7001 8001 9001 1000 11001
Index
Prob
abilty
of
aler
t
Selected PA
filtered_alertT2
0.00E+00
2.00E-01
4.00E-01
6.00E-01
8.00E-01
1.00E+00
1 1001 2001 3001 4001 5001 6001 7001 8001 9001 1000 11001
Index
Prob
abilty
of
aler
t
Selected PA
filtered_alertT3
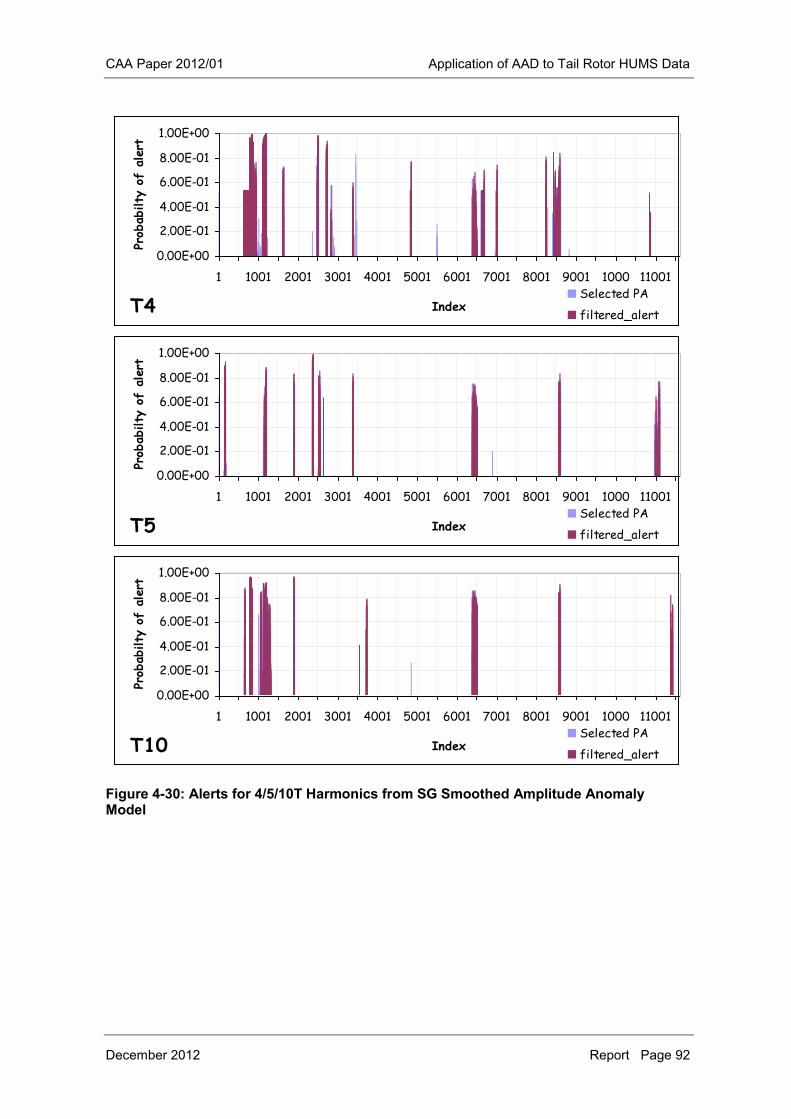
CAA Paper 2012/01 Application of AAD to Tail Rotor HUMS Data
December 2012 Report Page 92
Figure 4-30: Alerts for 4/5/10T Harmonics from SG Smoothed Amplitude Anomaly Model
0.00E+00
2.00E-01
4.00E-01
6.00E-01
8.00E-01
1.00E+00
1 1001 2001 3001 4001 5001 6001 7001 8001 9001 1000 11001
Index
Prob
abilty
of
aler
t
Selected PA
filtered_alertT4
0.00E+00
2.00E-01
4.00E-01
6.00E-01
8.00E-01
1.00E+00
1 1001 2001 3001 4001 5001 6001 7001 8001 9001 1000 11001
Index
Prob
abilty
of
alert
Selected PA
filtered_alertT5
0.00E+00
2.00E-01
4.00E-01
6.00E-01
8.00E-01
1.00E+00
1 1001 2001 3001 4001 5001 6001 7001 8001 9001 1000 11001
Index
Prob
abilty
of
alert
Selected PA
filtered_alertT10
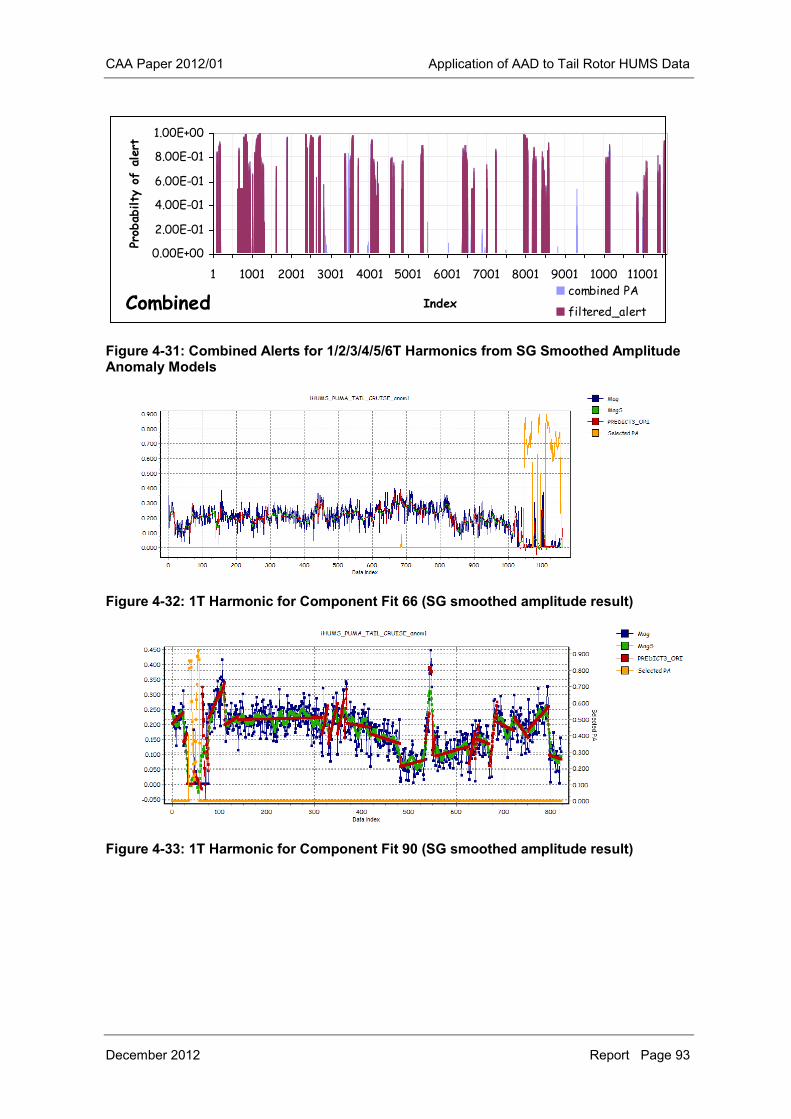
CAA Paper 2012/01 Application of AAD to Tail Rotor HUMS Data
December 2012 Report Page 93
Figure 4-31: Combined Alerts for 1/2/3/4/5/6T Harmonics from SG Smoothed Amplitude Anomaly Models
Figure 4-32: 1T Harmonic for Component Fit 66 (SG smoothed amplitude result)
Figure 4-33: 1T Harmonic for Component Fit 90 (SG smoothed amplitude result)
0.00E+00
2.00E-01
4.00E-01
6.00E-01
8.00E-01
1.00E+00
1 1001 2001 3001 4001 5001 6001 7001 8001 9001 1000 11001
Index
Prob
abilty
of
aler
t
combined PA
filtered_alertCombined
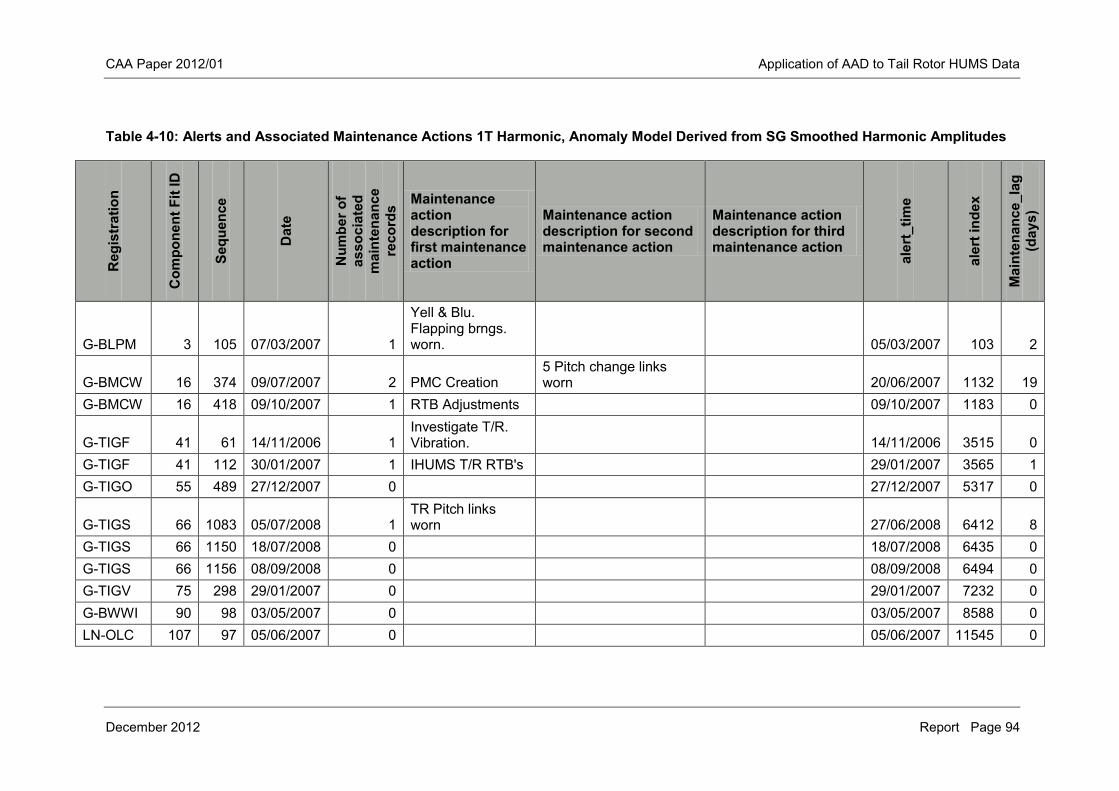
CAA Paper 2012/01 Application of AAD to Tail Rotor HUMS Data
December 2012 Report Page 94
Table 4-10: Alerts and Associated Maintenance Actions 1T Harmonic, Anomaly Model Derived from SG Smoothed Harmonic Amplitudes R
egis
trat
ion
Com
pone
nt F
it ID
Sequ
ence
Dat
e
Num
ber o
f as
soci
ated
m
aint
enan
ce
reco
rds Maintenance
action description for first maintenance action
Maintenance action description for second maintenance action
Maintenance action description for third maintenance action
aler
t_tim
e
aler
t ind
ex
Mai
nten
ance
_lag
(d
ays)
G-BLPM 3 105 07/03/2007 1
Yell & Blu. Flapping brngs. worn. 05/03/2007 103 2
G-BMCW 16 374 09/07/2007 2 PMC Creation 5 Pitch change links worn 20/06/2007 1132 19
G-BMCW 16 418 09/10/2007 1 RTB Adjustments 09/10/2007 1183 0
G-TIGF 41 61 14/11/2006 1 Investigate T/R. Vibration. 14/11/2006 3515 0
G-TIGF 41 112 30/01/2007 1 IHUMS T/R RTB's 29/01/2007 3565 1 G-TIGO 55 489 27/12/2007 0 27/12/2007 5317 0
G-TIGS 66 1083 05/07/2008 1 TR Pitch links worn 27/06/2008 6412 8
G-TIGS 66 1150 18/07/2008 0 18/07/2008 6435 0 G-TIGS 66 1156 08/09/2008 0 08/09/2008 6494 0 G-TIGV 75 298 29/01/2007 0 29/01/2007 7232 0 G-BWWI 90 98 03/05/2007 0 03/05/2007 8588 0 LN-OLC 107 97 05/06/2007 0 05/06/2007 11545 0
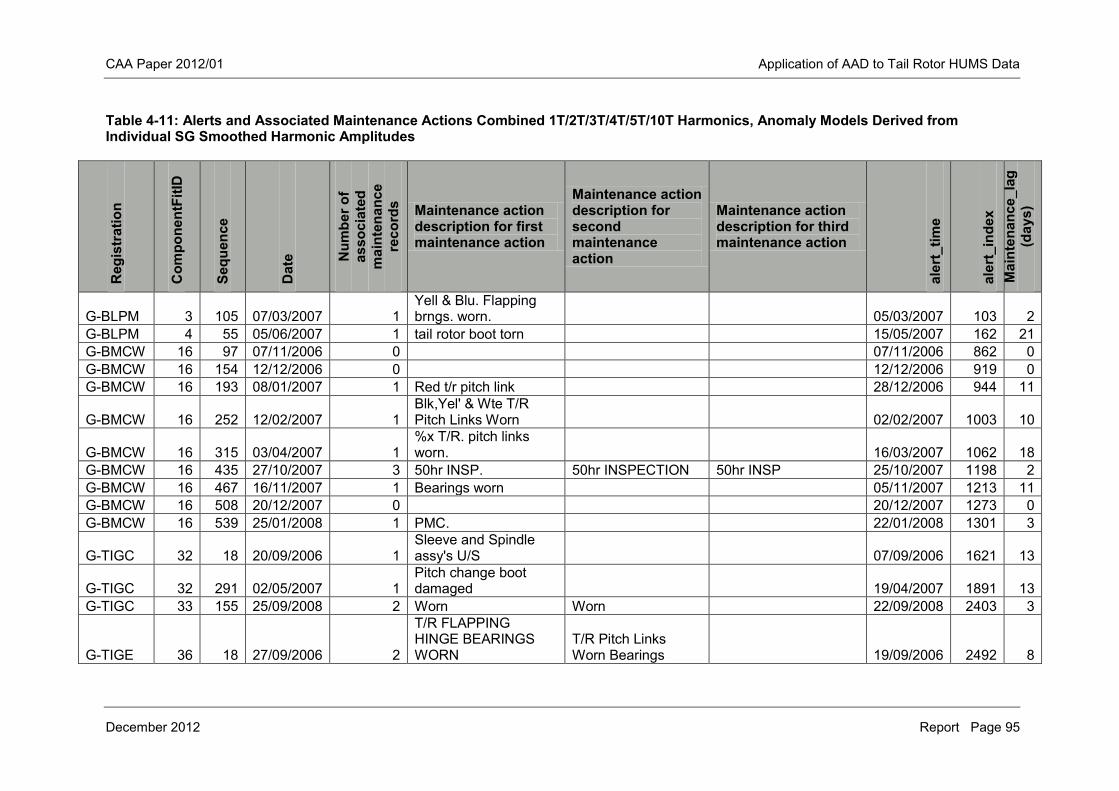
CAA Paper 2012/01 Application of AAD to Tail Rotor HUMS Data
December 2012 Report Page 95
Table 4-11: Alerts and Associated Maintenance Actions Combined 1T/2T/3T/4T/5T/10T Harmonics, Anomaly Models Derived from Individual SG Smoothed Harmonic Amplitudes
Reg
istr
atio
n
Com
pone
ntFi
tID
Sequ
ence
Dat
e Num
ber o
f as
soci
ated
m
aint
enan
ce
reco
rds Maintenance action
description for first maintenance action
Maintenance action description for second maintenance action
Maintenance action description for third maintenance action
aler
t_tim
e
aler
t_in
dex
Mai
nten
ance
_lag
(d
ays)
G-BLPM 3 105 07/03/2007 1 Yell & Blu. Flapping brngs. worn. 05/03/2007 103 2
G-BLPM 4 55 05/06/2007 1 tail rotor boot torn 15/05/2007 162 21 G-BMCW 16 97 07/11/2006 0 07/11/2006 862 0 G-BMCW 16 154 12/12/2006 0 12/12/2006 919 0 G-BMCW 16 193 08/01/2007 1 Red t/r pitch link 28/12/2006 944 11
G-BMCW 16 252 12/02/2007 1 Blk,Yel' & Wte T/R Pitch Links Worn 02/02/2007 1003 10
G-BMCW 16 315 03/04/2007 1 %x T/R. pitch links worn. 16/03/2007 1062 18
G-BMCW 16 435 27/10/2007 3 50hr INSP. 50hr INSPECTION 50hr INSP 25/10/2007 1198 2 G-BMCW 16 467 16/11/2007 1 Bearings worn 05/11/2007 1213 11 G-BMCW 16 508 20/12/2007 0 20/12/2007 1273 0 G-BMCW 16 539 25/01/2008 1 PMC. 22/01/2008 1301 3
G-TIGC 32 18 20/09/2006 1 Sleeve and Spindle assy's U/S 07/09/2006 1621 13
G-TIGC 32 291 02/05/2007 1 Pitch change boot damaged 19/04/2007 1891 13
G-TIGC 33 155 25/09/2008 2 Worn Worn 22/09/2008 2403 3
G-TIGE 36 18 27/09/2006 2
T/R FLAPPING HINGE BEARINGS WORN
T/R Pitch Links Worn Bearings 19/09/2006 2492 8
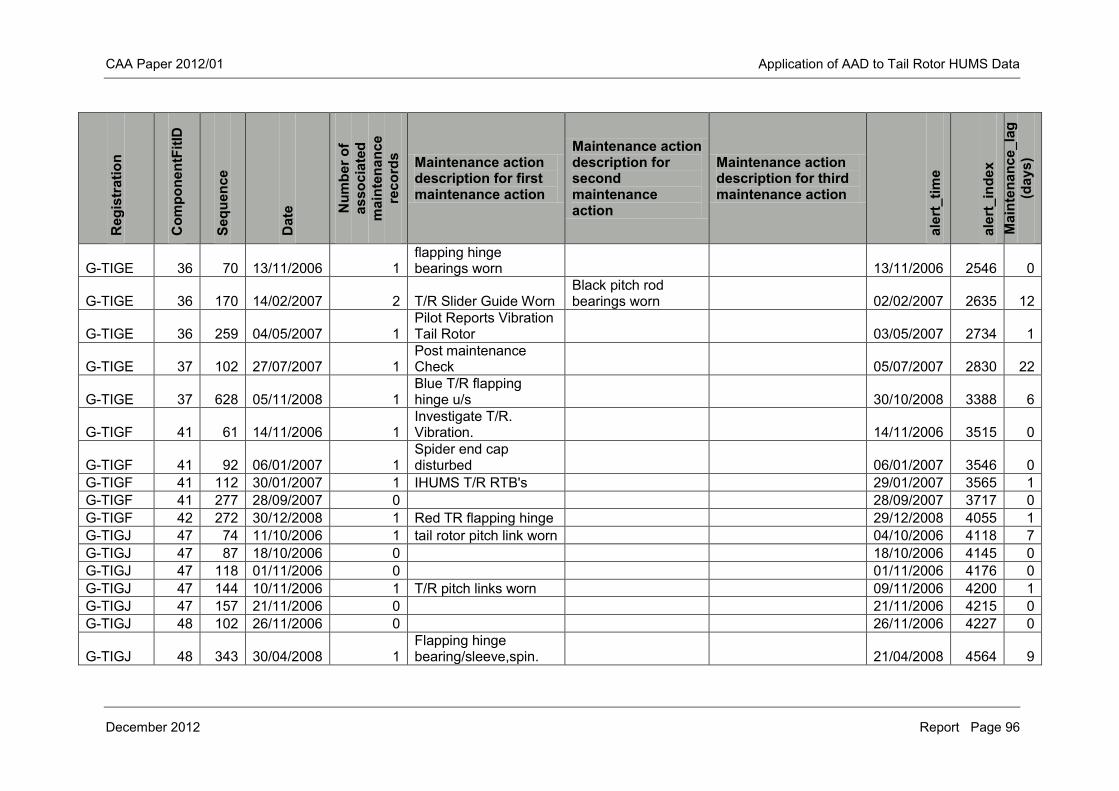
CAA Paper 2012/01 Application of AAD to Tail Rotor HUMS Data
December 2012 Report Page 96
Reg
istr
atio
n
Com
pone
ntFi
tID
Sequ
ence
Dat
e Num
ber o
f as
soci
ated
m
aint
enan
ce
reco
rds Maintenance action
description for first maintenance action
Maintenance action description for second maintenance action
Maintenance action description for third maintenance action
aler
t_tim
e
aler
t_in
dex
Mai
nten
ance
_lag
(d
ays)
G-TIGE 36 70 13/11/2006 1 flapping hinge bearings worn 13/11/2006 2546 0
G-TIGE 36 170 14/02/2007 2 T/R Slider Guide Worn Black pitch rod bearings worn 02/02/2007 2635 12
G-TIGE 36 259 04/05/2007 1 Pilot Reports Vibration Tail Rotor 03/05/2007 2734 1
G-TIGE 37 102 27/07/2007 1 Post maintenance Check 05/07/2007 2830 22
G-TIGE 37 628 05/11/2008 1 Blue T/R flapping hinge u/s 30/10/2008 3388 6
G-TIGF 41 61 14/11/2006 1 Investigate T/R. Vibration. 14/11/2006 3515 0
G-TIGF 41 92 06/01/2007 1 Spider end cap disturbed 06/01/2007 3546 0
G-TIGF 41 112 30/01/2007 1 IHUMS T/R RTB's 29/01/2007 3565 1 G-TIGF 41 277 28/09/2007 0 28/09/2007 3717 0 G-TIGF 42 272 30/12/2008 1 Red TR flapping hinge 29/12/2008 4055 1 G-TIGJ 47 74 11/10/2006 1 tail rotor pitch link worn 04/10/2006 4118 7 G-TIGJ 47 87 18/10/2006 0 18/10/2006 4145 0 G-TIGJ 47 118 01/11/2006 0 01/11/2006 4176 0 G-TIGJ 47 144 10/11/2006 1 T/R pitch links worn 09/11/2006 4200 1 G-TIGJ 47 157 21/11/2006 0 21/11/2006 4215 0 G-TIGJ 48 102 26/11/2006 0 26/11/2006 4227 0
G-TIGJ 48 343 30/04/2008 1 Flapping hinge bearing/sleeve,spin. 21/04/2008 4564 9
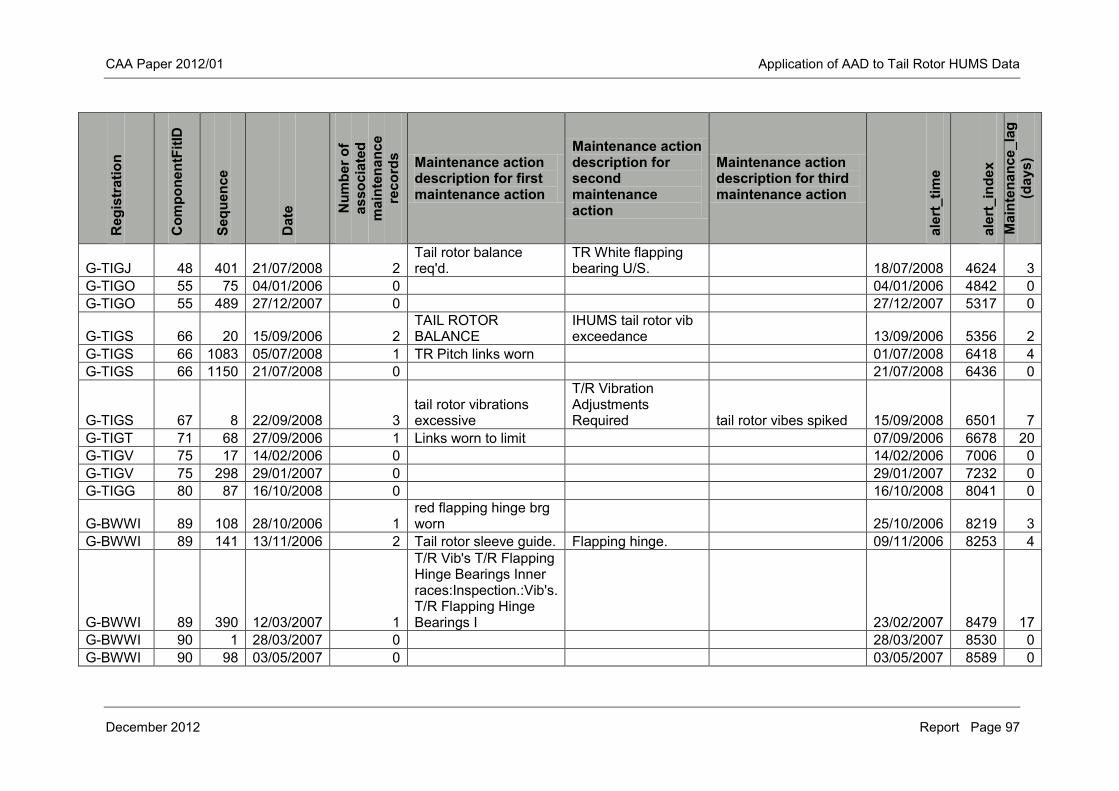
CAA Paper 2012/01 Application of AAD to Tail Rotor HUMS Data
December 2012 Report Page 97
Reg
istr
atio
n
Com
pone
ntFi
tID
Sequ
ence
Dat
e Num
ber o
f as
soci
ated
m
aint
enan
ce
reco
rds Maintenance action
description for first maintenance action
Maintenance action description for second maintenance action
Maintenance action description for third maintenance action
aler
t_tim
e
aler
t_in
dex
Mai
nten
ance
_lag
(d
ays)
G-TIGJ 48 401 21/07/2008 2 Tail rotor balance req'd.
TR White flapping bearing U/S. 18/07/2008 4624 3
G-TIGO 55 75 04/01/2006 0 04/01/2006 4842 0 G-TIGO 55 489 27/12/2007 0 27/12/2007 5317 0
G-TIGS 66 20 15/09/2006 2 TAIL ROTOR BALANCE
IHUMS tail rotor vib exceedance 13/09/2006 5356 2
G-TIGS 66 1083 05/07/2008 1 TR Pitch links worn 01/07/2008 6418 4 G-TIGS 66 1150 21/07/2008 0 21/07/2008 6436 0
G-TIGS 67 8 22/09/2008 3 tail rotor vibrations excessive
T/R Vibration Adjustments Required tail rotor vibes spiked 15/09/2008 6501 7
G-TIGT 71 68 27/09/2006 1 Links worn to limit 07/09/2006 6678 20 G-TIGV 75 17 14/02/2006 0 14/02/2006 7006 0 G-TIGV 75 298 29/01/2007 0 29/01/2007 7232 0 G-TIGG 80 87 16/10/2008 0 16/10/2008 8041 0
G-BWWI 89 108 28/10/2006 1 red flapping hinge brg worn 25/10/2006 8219 3
G-BWWI 89 141 13/11/2006 2 Tail rotor sleeve guide. Flapping hinge. 09/11/2006 8253 4
G-BWWI 89 390 12/03/2007 1
T/R Vib's T/R Flapping Hinge Bearings Inner races:Inspection.:Vib's. T/R Flapping Hinge Bearings I 23/02/2007 8479 17
G-BWWI 90 1 28/03/2007 0 28/03/2007 8530 0 G-BWWI 90 98 03/05/2007 0 03/05/2007 8589 0
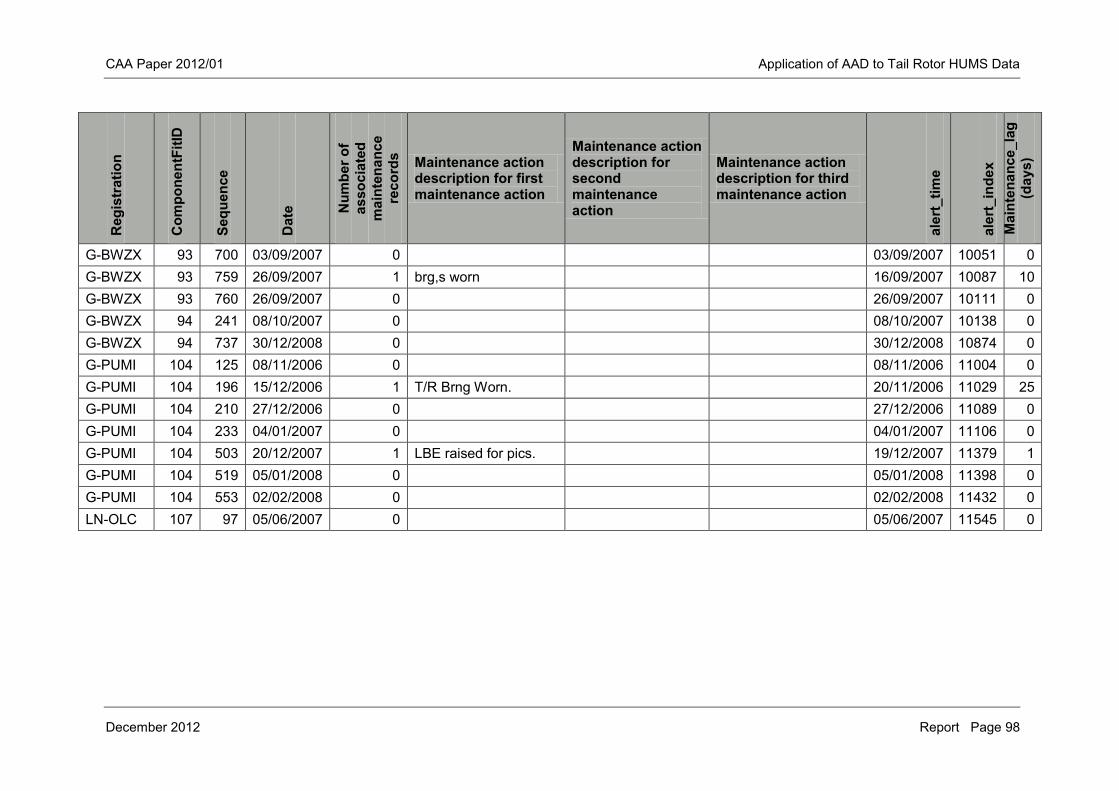
CAA Paper 2012/01 Application of AAD to Tail Rotor HUMS Data
December 2012 Report Page 98
Reg
istr
atio
n
Com
pone
ntFi
tID
Sequ
ence
Dat
e Num
ber o
f as
soci
ated
m
aint
enan
ce
reco
rds Maintenance action
description for first maintenance action
Maintenance action description for second maintenance action
Maintenance action description for third maintenance action
aler
t_tim
e
aler
t_in
dex
Mai
nten
ance
_lag
(d
ays)
G-BWZX 93 700 03/09/2007 0 03/09/2007 10051 0 G-BWZX 93 759 26/09/2007 1 brg,s worn 16/09/2007 10087 10 G-BWZX 93 760 26/09/2007 0 26/09/2007 10111 0 G-BWZX 94 241 08/10/2007 0 08/10/2007 10138 0 G-BWZX 94 737 30/12/2008 0 30/12/2008 10874 0 G-PUMI 104 125 08/11/2006 0 08/11/2006 11004 0 G-PUMI 104 196 15/12/2006 1 T/R Brng Worn. 20/11/2006 11029 25 G-PUMI 104 210 27/12/2006 0 27/12/2006 11089 0 G-PUMI 104 233 04/01/2007 0 04/01/2007 11106 0 G-PUMI 104 503 20/12/2007 1 LBE raised for pics. 19/12/2007 11379 1 G-PUMI 104 519 05/01/2008 0 05/01/2008 11398 0 G-PUMI 104 553 02/02/2008 0 02/02/2008 11432 0 LN-OLC 107 97 05/06/2007 0 05/06/2007 11545 0
CAA Paper 2012/01 Application of AAD to Tail Rotor HUMS Data
December 2012 Report Page 99
4.4.2.3 Anomaly model using trended harmonic amplitudes
The alerts for the 1T, 2T and 3T harmonics across all 11,616 TR acquisitions are shown in Figure 4-34. The charts show both the PA parameter and the filtered alerts. The corresponding 4T, 5T and 10T harmonics are a shown in Figure 4-35. The 1T model generated a total of 15 alerts. The alerts and corresponding maintenance are shown in Table 4-12. Eight of the 15 T1 alerts coincide with the outputs of the model based on 1T raw amplitude data. Six alerts coincide with alerts from using the smoothed amplitude data. Three alerts were identified that were not previously highlighted. Similarly to the smoothed amplitude models, from visual inspection of the data a number of alerts appear to exist in multiple individual harmonic models. In particular are alerts that appear at indexes of approximately 4500, 6500 and 8500. The results of the individual harmonics were combined by taking at each acquisition the maximum PA value of any of the harmonic data. The alert filtering algorithm was then applied to the combined PA parameter to generate a combined alert parameter. The combined model generated a total of 51 alerts. The alerts and corresponding maintenance are shown in Table 4-12. Thirty-one of the alerts could be associated with maintenance action: 21 alerts occurred less than 10 days after the alert.
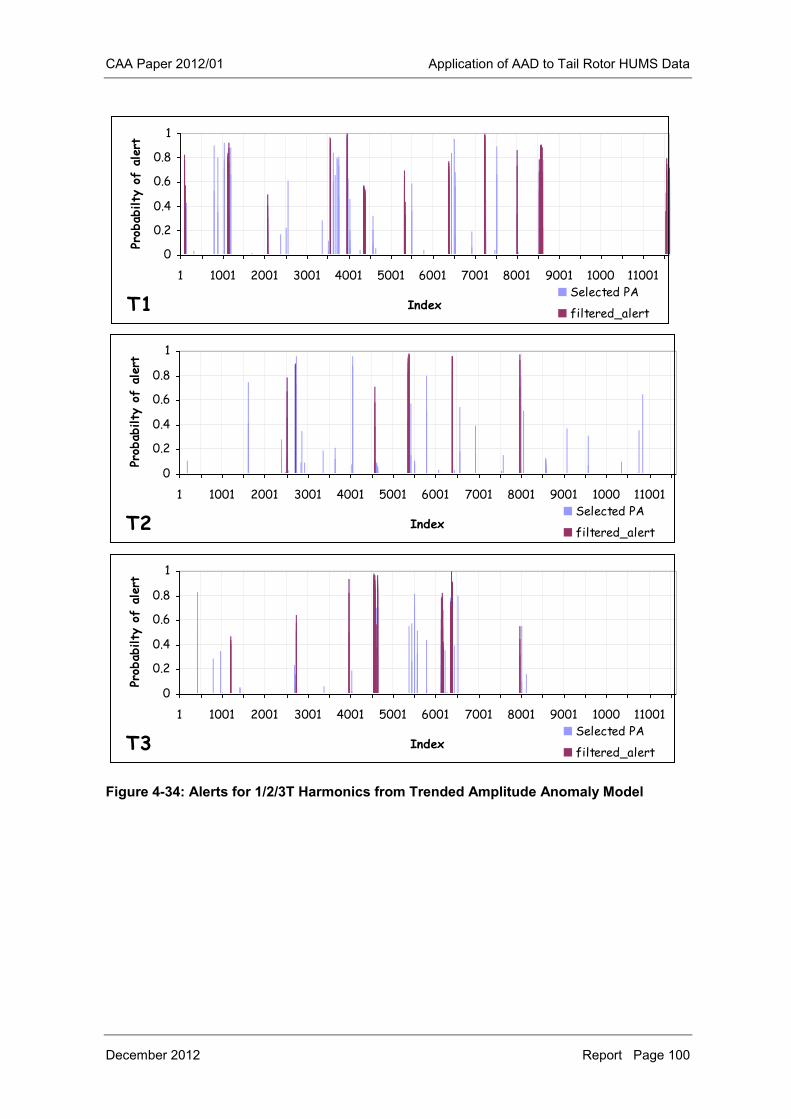
CAA Paper 2012/01 Application of AAD to Tail Rotor HUMS Data
December 2012 Report Page 100
Figure 4-34: Alerts for 1/2/3T Harmonics from Trended Amplitude Anomaly Model
0
0.2
0.4
0.6
0.8
1
1 1001 2001 3001 4001 5001 6001 7001 8001 9001 1000 11001
Index
Prob
abilty
of
aler
t
Selected PA
filtered_alertT1
0
0.2
0.4
0.6
0.8
1
1 1001 2001 3001 4001 5001 6001 7001 8001 9001 1000 11001
Index
Prob
abilty
of
aler
t
Selected PA
filtered_alertT2
0
0.2
0.4
0.6
0.8
1
1 1001 2001 3001 4001 5001 6001 7001 8001 9001 1000 11001
Index
Prob
abilty
of
aler
t
Selected PA
filtered_alertT3
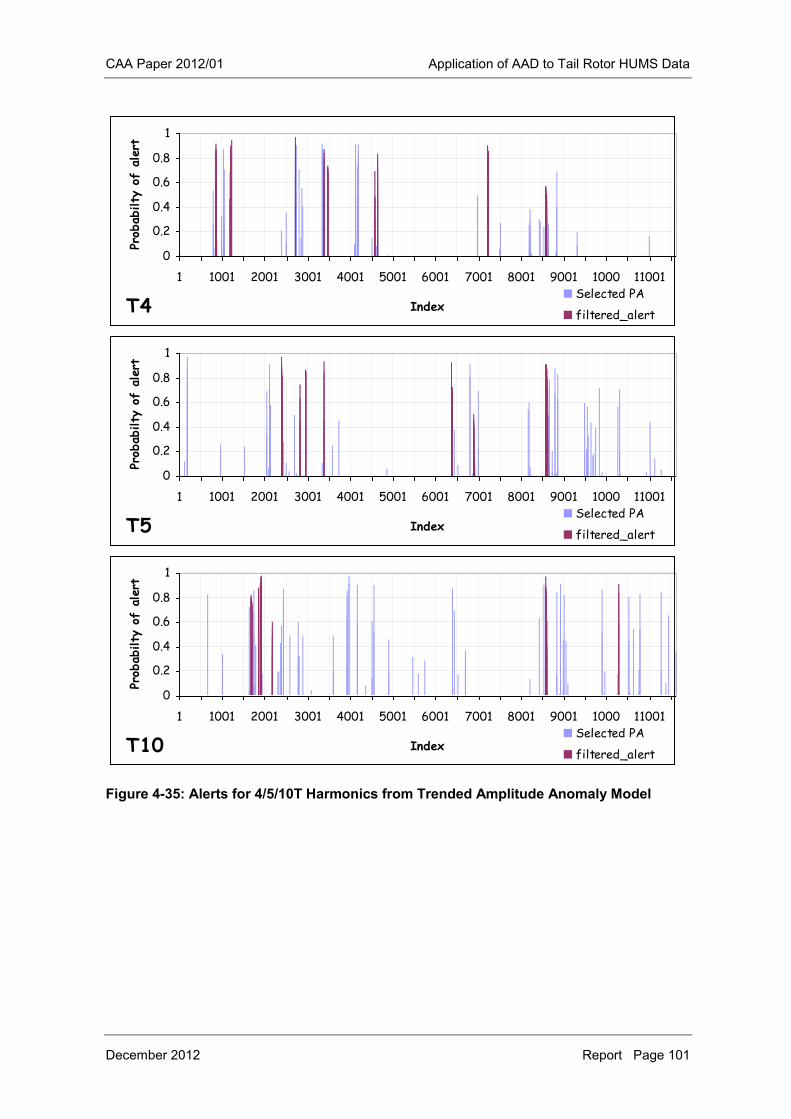
CAA Paper 2012/01 Application of AAD to Tail Rotor HUMS Data
December 2012 Report Page 101
Figure 4-35: Alerts for 4/5/10T Harmonics from Trended Amplitude Anomaly Model
0
0.2
0.4
0.6
0.8
1
1 1001 2001 3001 4001 5001 6001 7001 8001 9001 1000 11001
Index
Prob
abilty
of
aler
t
Selected PA
filtered_alertT4
0
0.2
0.4
0.6
0.8
1
1 1001 2001 3001 4001 5001 6001 7001 8001 9001 1000 11001
Index
Prob
abilty
of
alert
Selected PA
filtered_alertT5
0
0.2
0.4
0.6
0.8
1
1 1001 2001 3001 4001 5001 6001 7001 8001 9001 1000 11001
Index
Prob
abilty
of
alert
Selected PA
filtered_alertT10
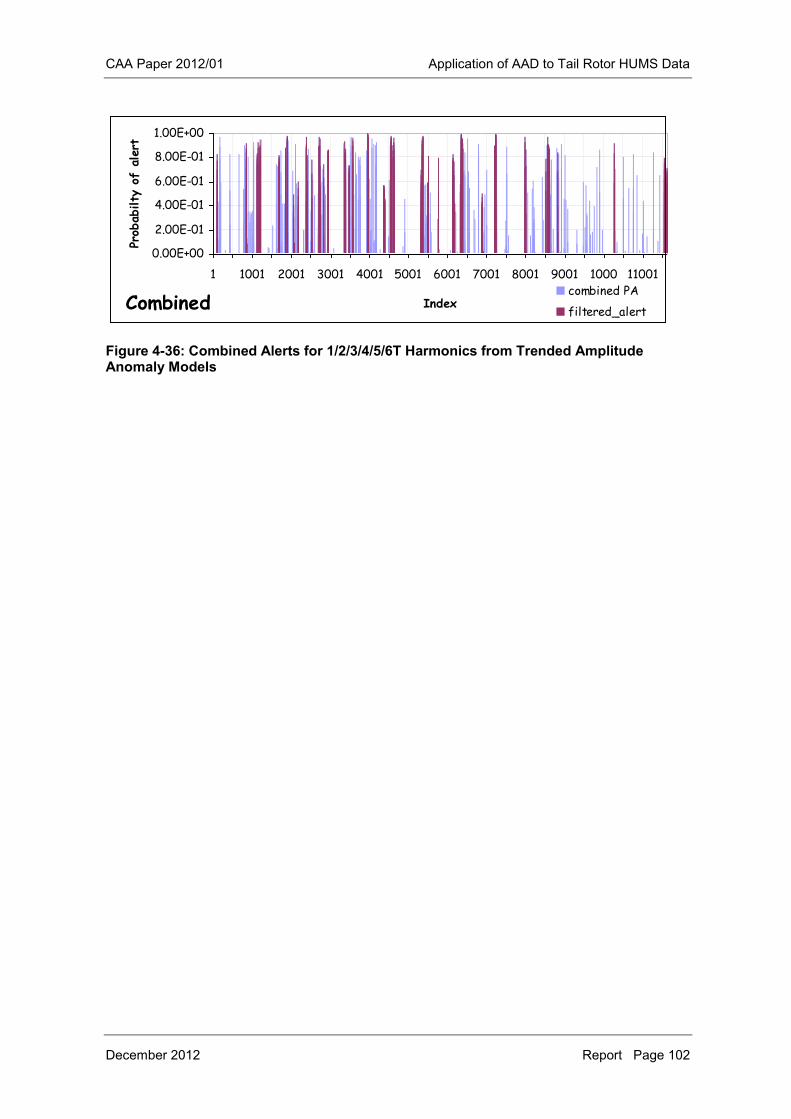
CAA Paper 2012/01 Application of AAD to Tail Rotor HUMS Data
December 2012 Report Page 102
Figure 4-36: Combined Alerts for 1/2/3/4/5/6T Harmonics from Trended Amplitude Anomaly Models
0.00E+00
2.00E-01
4.00E-01
6.00E-01
8.00E-01
1.00E+00
1 1001 2001 3001 4001 5001 6001 7001 8001 9001 1000 11001
Index
Prob
abilty
of
aler
t
combined PA
filtered_alertCombined
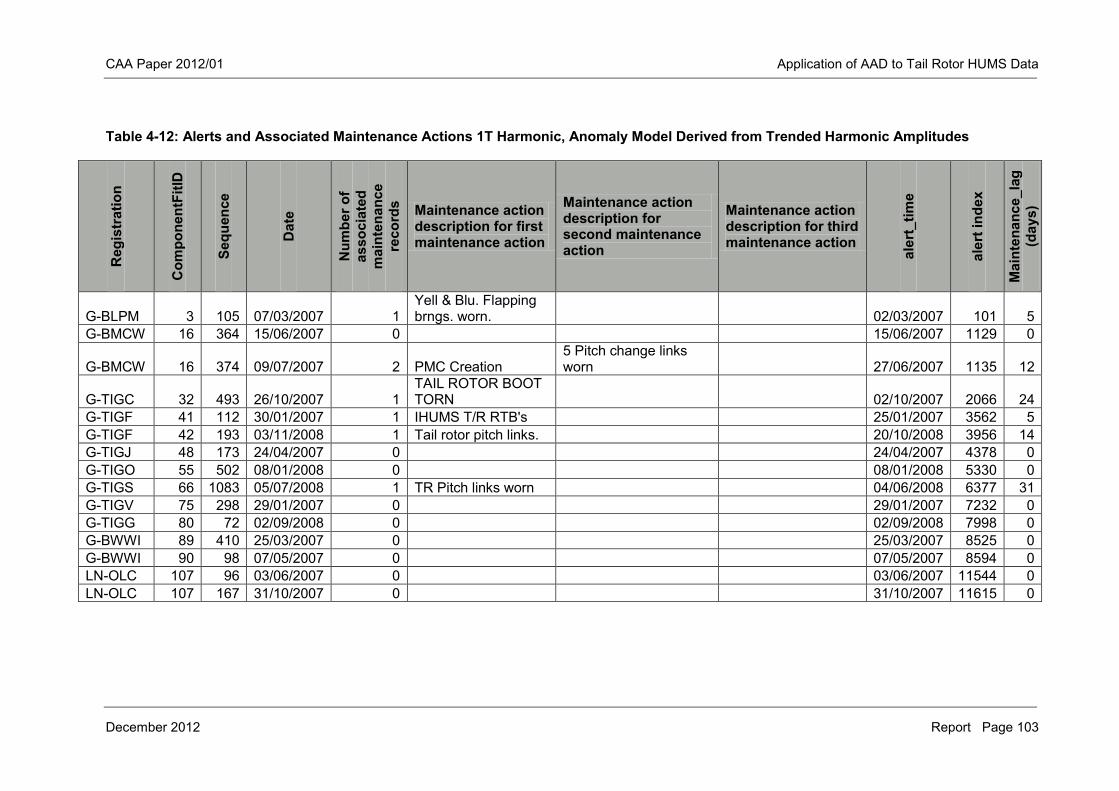
CAA Paper 2012/01 Application of AAD to Tail Rotor HUMS Data
December 2012 Report Page 103
Table 4-12: Alerts and Associated Maintenance Actions 1T Harmonic, Anomaly Model Derived from Trended Harmonic Amplitudes R
egis
trat
ion
Com
pone
ntFi
tID
Sequ
ence
Dat
e
Num
ber o
f as
soci
ated
m
aint
enan
ce
reco
rds Maintenance action
description for first maintenance action
Maintenance action description for second maintenance action
Maintenance action description for third maintenance action
aler
t_tim
e
aler
t ind
ex
Mai
nten
ance
_lag
(d
ays)
G-BLPM 3 105 07/03/2007 1 Yell & Blu. Flapping brngs. worn. 02/03/2007 101 5
G-BMCW 16 364 15/06/2007 0 15/06/2007 1129 0
G-BMCW 16 374 09/07/2007 2 PMC Creation 5 Pitch change links worn 27/06/2007 1135 12
G-TIGC 32 493 26/10/2007 1 TAIL ROTOR BOOT TORN 02/10/2007 2066 24
G-TIGF 41 112 30/01/2007 1 IHUMS T/R RTB's 25/01/2007 3562 5 G-TIGF 42 193 03/11/2008 1 Tail rotor pitch links. 20/10/2008 3956 14 G-TIGJ 48 173 24/04/2007 0 24/04/2007 4378 0 G-TIGO 55 502 08/01/2008 0 08/01/2008 5330 0 G-TIGS 66 1083 05/07/2008 1 TR Pitch links worn 04/06/2008 6377 31 G-TIGV 75 298 29/01/2007 0 29/01/2007 7232 0 G-TIGG 80 72 02/09/2008 0 02/09/2008 7998 0 G-BWWI 89 410 25/03/2007 0 25/03/2007 8525 0 G-BWWI 90 98 07/05/2007 0 07/05/2007 8594 0 LN-OLC 107 96 03/06/2007 0 03/06/2007 11544 0 LN-OLC 107 167 31/10/2007 0 31/10/2007 11615 0
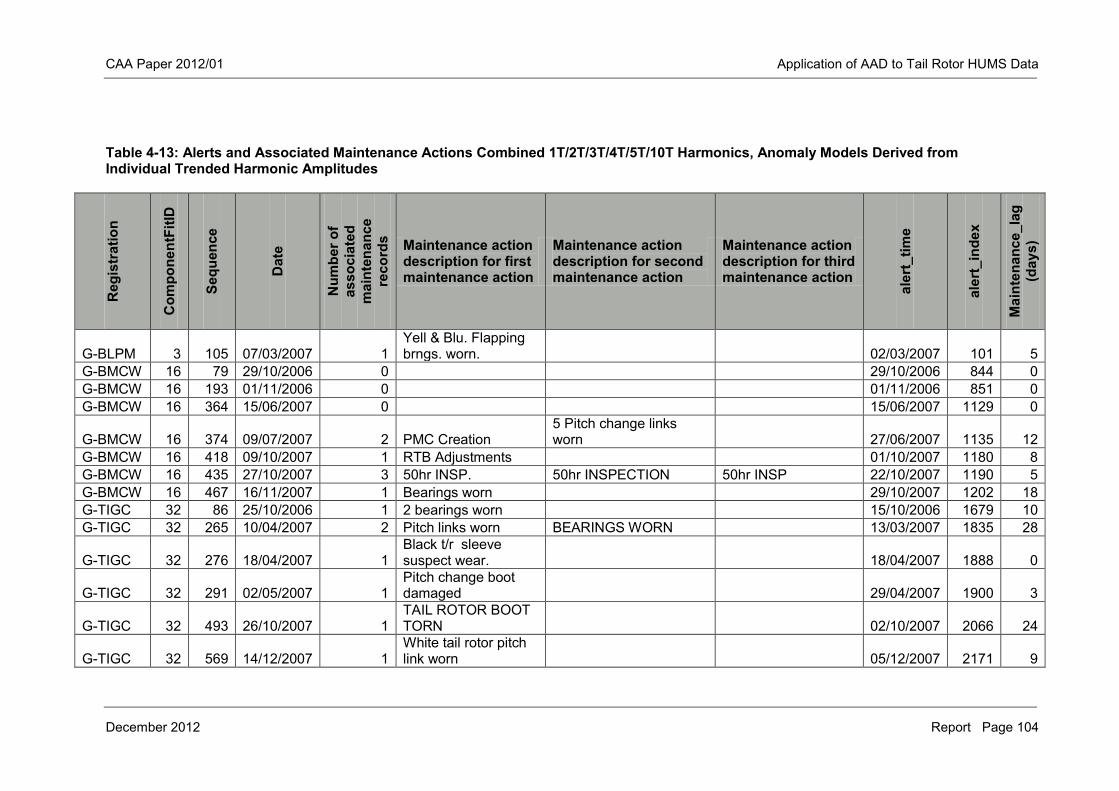
CAA Paper 2012/01 Application of AAD to Tail Rotor HUMS Data
December 2012 Report Page 104
Table 4-13: Alerts and Associated Maintenance Actions Combined 1T/2T/3T/4T/5T/10T Harmonics, Anomaly Models Derived from Individual Trended Harmonic Amplitudes
Reg
istr
atio
n
Com
pone
ntFi
tID
Sequ
ence
Dat
e
Num
ber o
f as
soci
ated
m
aint
enan
ce
reco
rds Maintenance action
description for first maintenance action
Maintenance action description for second maintenance action
Maintenance action description for third maintenance action
aler
t_tim
e
aler
t_in
dex
Mai
nten
ance
_lag
(d
ays)
G-BLPM 3 105 07/03/2007 1 Yell & Blu. Flapping brngs. worn. 02/03/2007 101 5
G-BMCW 16 79 29/10/2006 0 29/10/2006 844 0 G-BMCW 16 193 01/11/2006 0 01/11/2006 851 0 G-BMCW 16 364 15/06/2007 0 15/06/2007 1129 0
G-BMCW 16 374 09/07/2007 2 PMC Creation 5 Pitch change links worn 27/06/2007 1135 12
G-BMCW 16 418 09/10/2007 1 RTB Adjustments 01/10/2007 1180 8 G-BMCW 16 435 27/10/2007 3 50hr INSP. 50hr INSPECTION 50hr INSP 22/10/2007 1190 5 G-BMCW 16 467 16/11/2007 1 Bearings worn 29/10/2007 1202 18 G-TIGC 32 86 25/10/2006 1 2 bearings worn 15/10/2006 1679 10 G-TIGC 32 265 10/04/2007 2 Pitch links worn BEARINGS WORN 13/03/2007 1835 28
G-TIGC 32 276 18/04/2007 1 Black t/r sleeve suspect wear. 18/04/2007 1888 0
G-TIGC 32 291 02/05/2007 1 Pitch change boot damaged 29/04/2007 1900 3
G-TIGC 32 493 26/10/2007 1 TAIL ROTOR BOOT TORN 02/10/2007 2066 24
G-TIGC 32 569 14/12/2007 1 White tail rotor pitch link worn 05/12/2007 2171 9
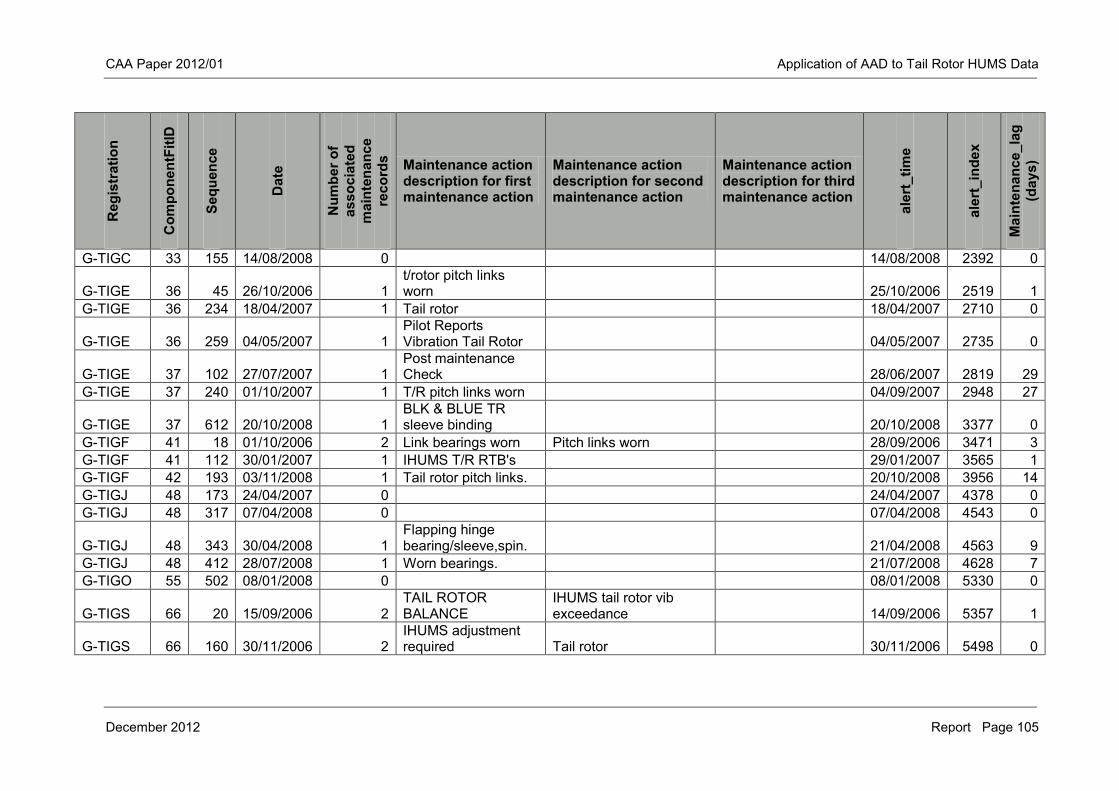
CAA Paper 2012/01 Application of AAD to Tail Rotor HUMS Data
December 2012 Report Page 105
Reg
istr
atio
n
Com
pone
ntFi
tID
Sequ
ence
Dat
e
Num
ber o
f as
soci
ated
m
aint
enan
ce
reco
rds Maintenance action
description for first maintenance action
Maintenance action description for second maintenance action
Maintenance action description for third maintenance action
aler
t_tim
e
aler
t_in
dex
Mai
nten
ance
_lag
(d
ays)
G-TIGC 33 155 14/08/2008 0 14/08/2008 2392 0
G-TIGE 36 45 26/10/2006 1 t/rotor pitch links worn 25/10/2006 2519 1
G-TIGE 36 234 18/04/2007 1 Tail rotor 18/04/2007 2710 0
G-TIGE 36 259 04/05/2007 1 Pilot Reports Vibration Tail Rotor 04/05/2007 2735 0
G-TIGE 37 102 27/07/2007 1 Post maintenance Check 28/06/2007 2819 29
G-TIGE 37 240 01/10/2007 1 T/R pitch links worn 04/09/2007 2948 27
G-TIGE 37 612 20/10/2008 1 BLK & BLUE TR sleeve binding 20/10/2008 3377 0
G-TIGF 41 18 01/10/2006 2 Link bearings worn Pitch links worn 28/09/2006 3471 3 G-TIGF 41 112 30/01/2007 1 IHUMS T/R RTB's 29/01/2007 3565 1 G-TIGF 42 193 03/11/2008 1 Tail rotor pitch links. 20/10/2008 3956 14 G-TIGJ 48 173 24/04/2007 0 24/04/2007 4378 0 G-TIGJ 48 317 07/04/2008 0 07/04/2008 4543 0
G-TIGJ 48 343 30/04/2008 1 Flapping hinge bearing/sleeve,spin. 21/04/2008 4563 9
G-TIGJ 48 412 28/07/2008 1 Worn bearings. 21/07/2008 4628 7 G-TIGO 55 502 08/01/2008 0 08/01/2008 5330 0
G-TIGS 66 20 15/09/2006 2 TAIL ROTOR BALANCE
IHUMS tail rotor vib exceedance 14/09/2006 5357 1
G-TIGS 66 160 30/11/2006 2 IHUMS adjustment required Tail rotor 30/11/2006 5498 0
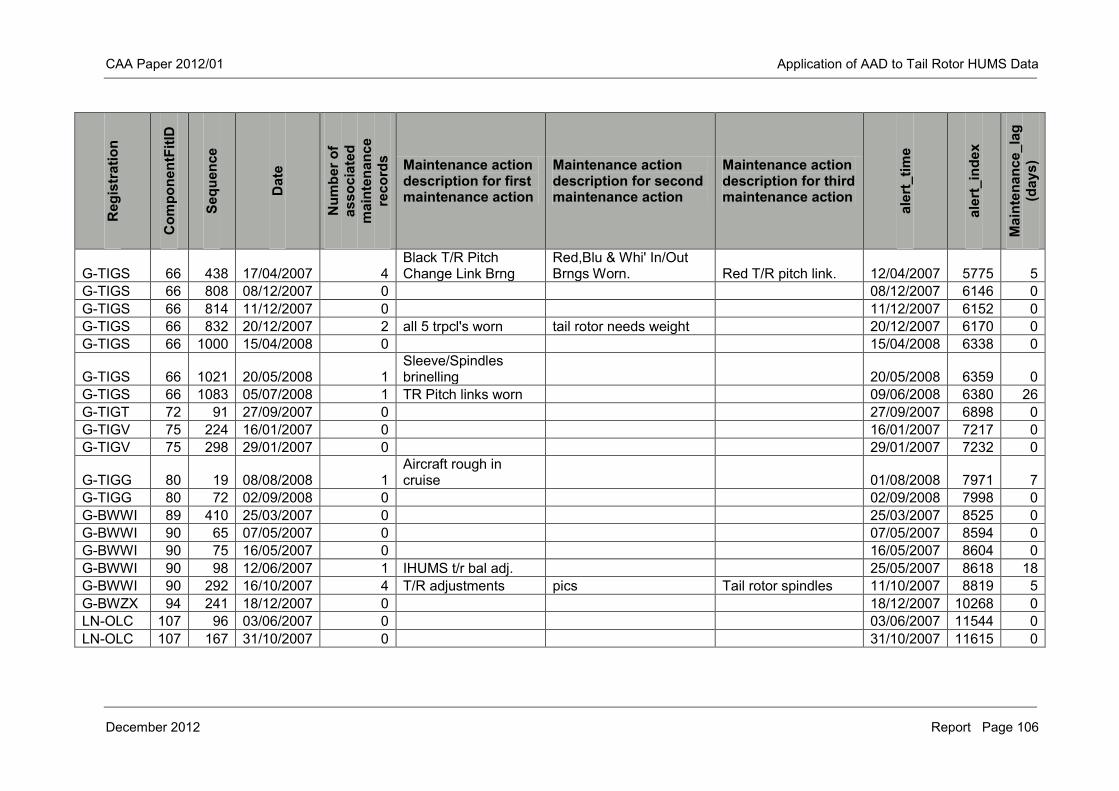
CAA Paper 2012/01 Application of AAD to Tail Rotor HUMS Data
December 2012 Report Page 106
Reg
istr
atio
n
Com
pone
ntFi
tID
Sequ
ence
Dat
e
Num
ber o
f as
soci
ated
m
aint
enan
ce
reco
rds Maintenance action
description for first maintenance action
Maintenance action description for second maintenance action
Maintenance action description for third maintenance action
aler
t_tim
e
aler
t_in
dex
Mai
nten
ance
_lag
(d
ays)
G-TIGS 66 438 17/04/2007 4 Black T/R Pitch Change Link Brng
Red,Blu & Whi' In/Out Brngs Worn. Red T/R pitch link. 12/04/2007 5775 5
G-TIGS 66 808 08/12/2007 0 08/12/2007 6146 0 G-TIGS 66 814 11/12/2007 0 11/12/2007 6152 0 G-TIGS 66 832 20/12/2007 2 all 5 trpcl's worn tail rotor needs weight 20/12/2007 6170 0 G-TIGS 66 1000 15/04/2008 0 15/04/2008 6338 0
G-TIGS 66 1021 20/05/2008 1 Sleeve/Spindles brinelling 20/05/2008 6359 0
G-TIGS 66 1083 05/07/2008 1 TR Pitch links worn 09/06/2008 6380 26 G-TIGT 72 91 27/09/2007 0 27/09/2007 6898 0 G-TIGV 75 224 16/01/2007 0 16/01/2007 7217 0 G-TIGV 75 298 29/01/2007 0 29/01/2007 7232 0
G-TIGG 80 19 08/08/2008 1 Aircraft rough in cruise 01/08/2008 7971 7
G-TIGG 80 72 02/09/2008 0 02/09/2008 7998 0 G-BWWI 89 410 25/03/2007 0 25/03/2007 8525 0 G-BWWI 90 65 07/05/2007 0 07/05/2007 8594 0 G-BWWI 90 75 16/05/2007 0 16/05/2007 8604 0 G-BWWI 90 98 12/06/2007 1 IHUMS t/r bal adj. 25/05/2007 8618 18 G-BWWI 90 292 16/10/2007 4 T/R adjustments pics Tail rotor spindles 11/10/2007 8819 5 G-BWZX 94 241 18/12/2007 0 18/12/2007 10268 0 LN-OLC 107 96 03/06/2007 0 03/06/2007 11544 0 LN-OLC 107 167 31/10/2007 0 31/10/2007 11615 0
CAA Paper 2012/01 Application of AAD to Tail Rotor HUMS Data
December 2012 Report Page 107
4.4.3 Trend model summary
The three methods presented are not mutually exclusive and all three models may be used to confirm a potential fault. The raw magnitudes model does not process the data so will not mask a fault by contaminating the data through an applied process; if a fault is present and manifests itself in the recorded data it should be detected by the anomaly model. Nevertheless, a significant amount of alerts will be false due to the high levels of noise. In addition, this model is based on absolute values only, and may not be particularly effective at reacting to developing trends due to localised variations in the vibration amplitudes. The SG smoothing model is less affected by noise and can identify developing underlying trends. The use of SG filters means that rapidly developing short term trends are preserved. Nevertheless, sudden changes, due to step changes in the data, for example, will be smoothed. The (linear) trended harmonic model, unlike the SG smoothing model, is able to react to sudden step changes in the data that could indicate the onset of a fault condition. Also, by tracking linear trends in the data it is able to indicate when there has been a change in behaviour in the harmonic amplitudes, e.g. a change from a constant trend in amplitude to an increasing trend. However, in this work this aspect of the model has not been investigated due to limited available time. Nevertheless it could be useful to detect changes in trends before they become large enough to trigger alerts in the anomaly models. The trended harmonic model provides a high degree of smoothing and in this regard is similar to the SG smoothing model. It will remove a substantial part of the background noise that can obscure trends in the raw harmonics model, although further work should be considered to improve the robustness of the model to outliers. However because it is also able to react to step changes that would be smoothed by the SG smoothing model it can be seen to compliment both the raw magnitudes model and the smoothed models to provide additional information. Therefore the different models would be expected to identify different anomalies. Nevertheless, significant anomalies that develop over a period sufficiently long not to be considered noise and removed with the smoothing models would be expected to alert in all three models. Therefore one approach for improving the robustness of the models is to identify faults that are detected by multiple models. Measured over all the anomaly models that used individual harmonic inputs, the total number of unique anomalies identified was 123. 44 of the anomalies were identified by two model techniques. Of these 23 were identified by the raw amplitude and the SG smoothed amplitude models. 13 anomalies were identified by all three methods. The 13 anomalies detected by all three models are shown in Table 4-14. The table also shows any corresponding maintenance action carried out within one month of the alert. It can be noted that all bar one of the alerts could be associated with a maintenance action within this period whilst 7 of the actions occurred within 10 days of the alerts and a further 3 actions occurred within 13 days. This shows a high correlation between maintenance action and events where all three model types alerted. A summary of the numbers of alerts generated by the absolute models and the trend models is shown in Table 4-15. The table shows the alerts for the individual harmonic absolute and trend models, the absolute models that used multiple
CAA Paper 2012/01 Application of AAD to Tail Rotor HUMS Data
December 2012 Report Page 108
harmonic inputs and the combined alerts of the individual trend models. The table also shows the number of alerts that could be associated with maintenance actions. For the trend models these are the actions that occurred within 10 days of the alert. Highlighted in the table are the alerts for the individual harmonic models that demonstrated the highest correlation with maintenance actions. For many of the individual harmonic models the SG smoothed model generated the most alerts that could be associated with a maintenance action. Overall, the results indicate that there is an advantage to developing models based on smoothed and trended the data, as well as raw amplitude data. As indicated above, models based on individual harmonics can potentially be used to distinguish instrumentation faults. However, the number of anomalies that could be associated with maintenance actions are lower than previously obtained using a single anomaly model with multiple (e.g. 2T—10T) harmonic inputs. There is no reason therefore that simple anomaly models based on 1T and 2T—10T inputs should not be used.
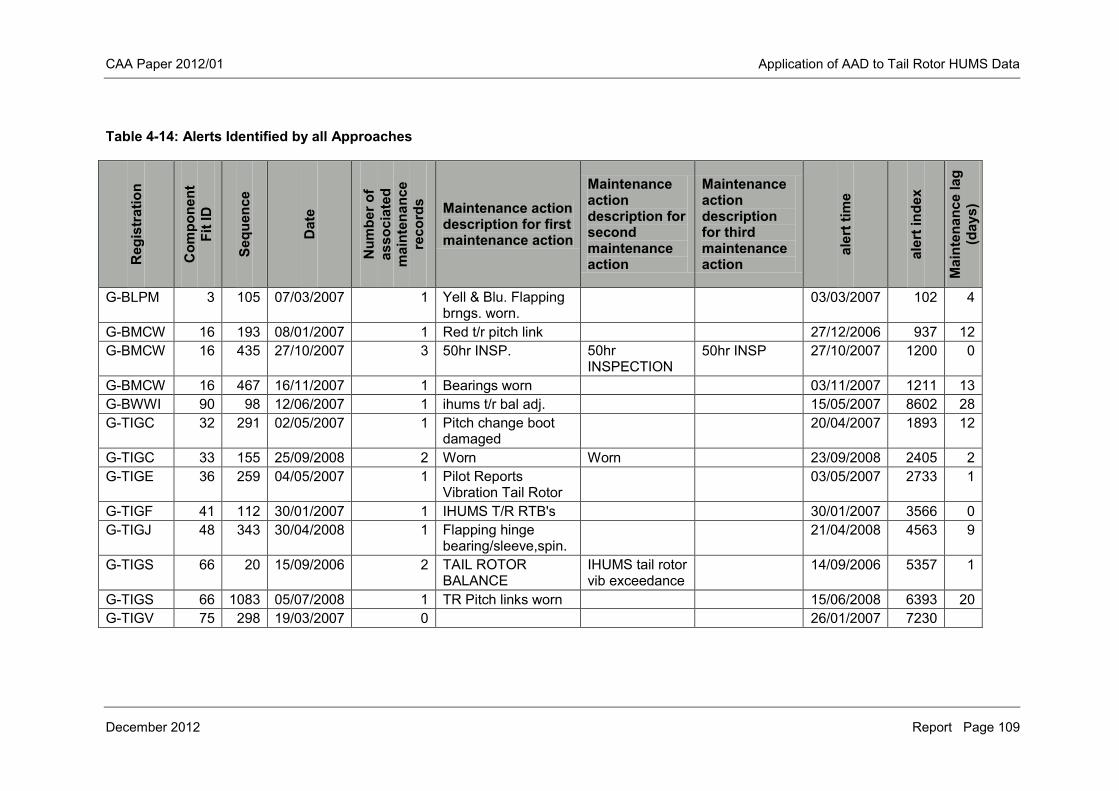
CAA Paper 2012/01 Application of AAD to Tail Rotor HUMS Data
December 2012 Report Page 109
Table 4-14: Alerts Identified by all Approaches R
egis
trat
ion
Com
pone
nt
Fit I
D
Sequ
ence
Dat
e
Num
ber o
f as
soci
ated
m
aint
enan
ce
reco
rds Maintenance action
description for first maintenance action
Maintenance action description for second maintenance action
Maintenance action description for third maintenance action
aler
t tim
e
aler
t ind
ex
Mai
nten
ance
lag
(day
s)
G-BLPM 3 105 07/03/2007 1 Yell & Blu. Flapping brngs. worn.
03/03/2007 102 4
G-BMCW 16 193 08/01/2007 1 Red t/r pitch link 27/12/2006 937 12 G-BMCW 16 435 27/10/2007 3 50hr INSP. 50hr
INSPECTION 50hr INSP 27/10/2007 1200 0
G-BMCW 16 467 16/11/2007 1 Bearings worn 03/11/2007 1211 13 G-BWWI 90 98 12/06/2007 1 ihums t/r bal adj. 15/05/2007 8602 28 G-TIGC 32 291 02/05/2007 1 Pitch change boot
damaged 20/04/2007 1893 12
G-TIGC 33 155 25/09/2008 2 Worn Worn 23/09/2008 2405 2 G-TIGE 36 259 04/05/2007 1 Pilot Reports
Vibration Tail Rotor 03/05/2007 2733 1
G-TIGF 41 112 30/01/2007 1 IHUMS T/R RTB's 30/01/2007 3566 0 G-TIGJ 48 343 30/04/2008 1 Flapping hinge
bearing/sleeve,spin. 21/04/2008 4563 9
G-TIGS 66 20 15/09/2006 2 TAIL ROTOR BALANCE
IHUMS tail rotor vib exceedance
14/09/2006 5357 1
G-TIGS 66 1083 05/07/2008 1 TR Pitch links worn 15/06/2008 6393 20 G-TIGV 75 298 19/03/2007 0 26/01/2007 7230
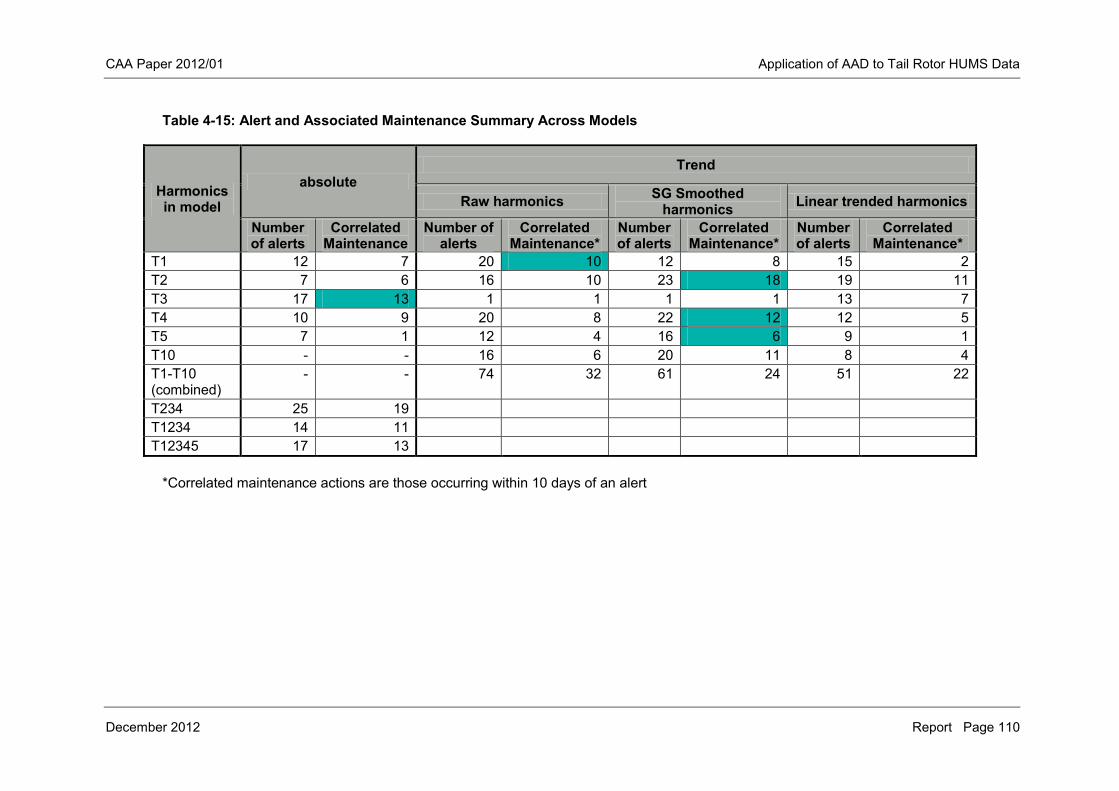
CAA Paper 2012/01 Application of AAD to Tail Rotor HUMS Data
December 2012 Report Page 110
Table 4-15: Alert and Associated Maintenance Summary Across Models
Harmonics in model
absolute Trend
Raw harmonics SG Smoothed harmonics Linear trended harmonics
Number of alerts
Correlated Maintenance
Number of alerts
Correlated Maintenance*
Number of alerts
Correlated Maintenance*
Number of alerts
Correlated Maintenance*
T1 12 7 20 10 12 8 15 2 T2 7 6 16 10 23 18 19 11 T3 17 13 1 1 1 1 13 7 T4 10 9 20 8 22 12 12 5 T5 7 1 12 4 16 6 9 1 T10 - - 16 6 20 11 8 4 T1-T10 (combined)
- - 74 32 61 24 51 22
T234 25 19 T1234 14 11 T12345 17 13
*Correlated maintenance actions are those occurring within 10 days of an alert
CAA Paper 2012/01 Application of AAD to Tail Rotor HUMS Data
December 2012 Report Page 111
4.5 Combining TR and gearbox databases
The large amount of noise in the data and the significant variance of the recorded values can make it difficult to distinguish a genuine anomaly from one caused by an artefact of the data. Previous research focusing on the TR gearbox determined that some anomalies identified in the gearbox were caused by the TR itself (Reference [1]). Therefore, it is anticipated that combining the measurements in the TR database with the gearbox database could enhance the ability to detect faults by including a measure of cross validation. The main advantage of this approach is that the TR sensors are separate from the gearbox sensors. A genuine fault may be sensed by both the TR sensors and the gearbox sensors. An instrumentation error in one sensor would not affect the other sensor, while the likelihood of instrumentation errors in both sensors at the same time is much lower than the likelihood of this occurring in any one sensor. Therefore, anomalies that are identified in one TR sensor but do not appear in the other may be caused by an instrumentation problem. A limitation of this approach is that the gearbox sensor only outputs SO1 and SO2 (1/rev and 2/rev vibration), therefore only the TR 1T and 2T harmonics could be cross validated in this way. A second difficulty in cross validating anomalies in the two sensor measurements is the different acquisition times and regimes for the gearbox and TR. Previous attempts to merge the data resulted in the loss of a large amount of data and made developing models from the reduced data sets unviable. An alternative approach is to build separate anomaly models for the TR and gearbox data sets, then combine the outputs from the models using reasoning logic to determine the presence of a fault. A limited exercise was performed building a gearbox SO1 model and a TR 1T model, then comparing alerts triggered by the two models. Only a relatively small proportion of the alerts could be directly correlated, therefore the analysis was not pursued any further. However, it is still considered that there is merit in cross validating information from separate sensors to provide robustness when instrumentation faults affect the data. Nevertheless, the correlated results for the three model types (raw, SG smoothed and linear trended) and the corresponding maintenance actions are shown in Table 4-16, Table 4-17 and Table 4-18. The individual raw parameter model for the TR 1T harmonic indicated 21 alerts of which 11 alerts could be correlated with a maintenance action within 30 days of the alert. Of those alerts 10 could be correlated with a maintenance action within 10 days. The corresponding individual raw parameter model for the gearbox SO1 parameter indicated 40 alerts of which 18 alerts could be associated with maintenance within 30 days. Of those alerts 15 could be correlated with a maintenance action within 10 days. The combined gearbox\TR 1T model results are shown in Table 4-16. The table shows that only 3 alerts were common between the two models with 2 alerts having maintenance action within 10 days whilst the third alert could not be associated with any action. Therefore there were 58 individual alerts across the two models with only 3 common to both (5.1%). The individual smoothed parameter model for the TR 1T harmonic indicated 39 alerts where 20 alerts could be correlated with maintenance within 30 days. Of those alerts, 17 could be correlated within 10 days. For the corresponding gearbox model 29 alerts were recorded. However, only 13 alerts were correlated with maintenance within 30 days and only 9 alerts with maintenance within 10 days. The
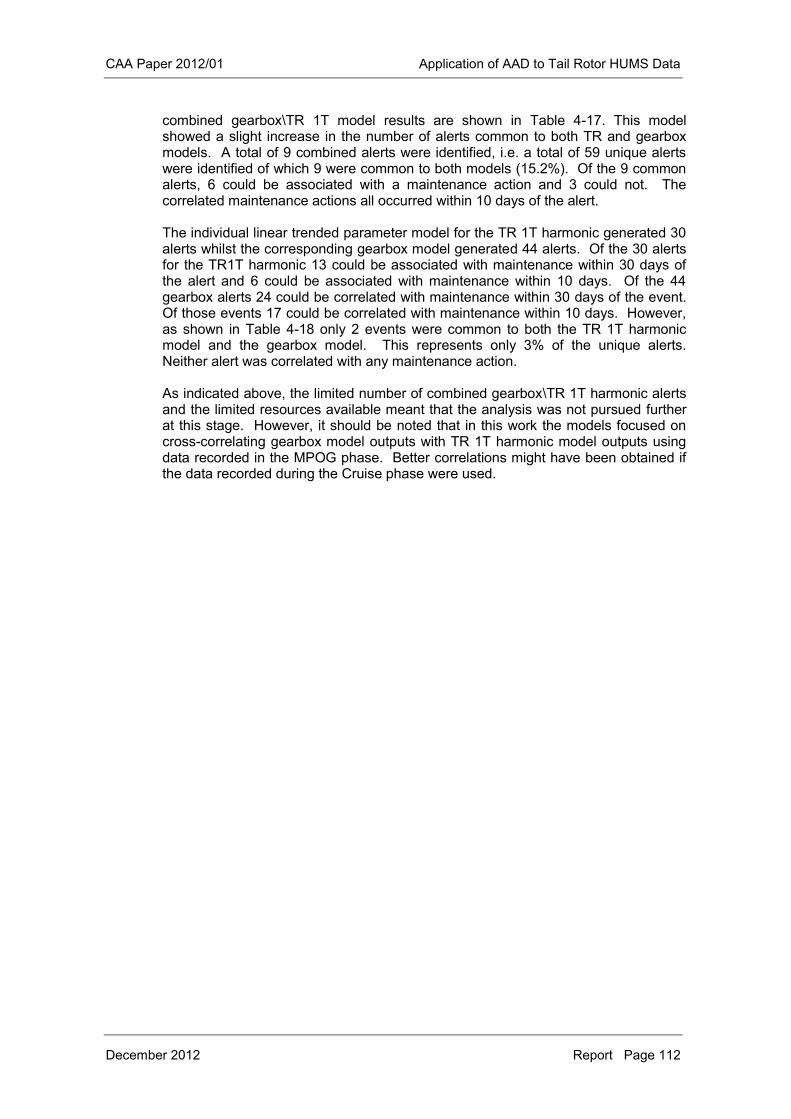
CAA Paper 2012/01 Application of AAD to Tail Rotor HUMS Data
December 2012 Report Page 112
combined gearbox\TR 1T model results are shown in Table 4-17. This model showed a slight increase in the number of alerts common to both TR and gearbox models. A total of 9 combined alerts were identified, i.e. a total of 59 unique alerts were identified of which 9 were common to both models (15.2%). Of the 9 common alerts, 6 could be associated with a maintenance action and 3 could not. The correlated maintenance actions all occurred within 10 days of the alert. The individual linear trended parameter model for the TR 1T harmonic generated 30 alerts whilst the corresponding gearbox model generated 44 alerts. Of the 30 alerts for the TR1T harmonic 13 could be associated with maintenance within 30 days of the alert and 6 could be associated with maintenance within 10 days. Of the 44 gearbox alerts 24 could be correlated with maintenance within 30 days of the event. Of those events 17 could be correlated with maintenance within 10 days. However, as shown in Table 4-18 only 2 events were common to both the TR 1T harmonic model and the gearbox model. This represents only 3% of the unique alerts. Neither alert was correlated with any maintenance action. As indicated above, the limited number of combined gearbox\TR 1T harmonic alerts and the limited resources available meant that the analysis was not pursued further at this stage. However, it should be noted that in this work the models focused on cross-correlating gearbox model outputs with TR 1T harmonic model outputs using data recorded in the MPOG phase. Better correlations might have been obtained if the data recorded during the Cruise phase were used.
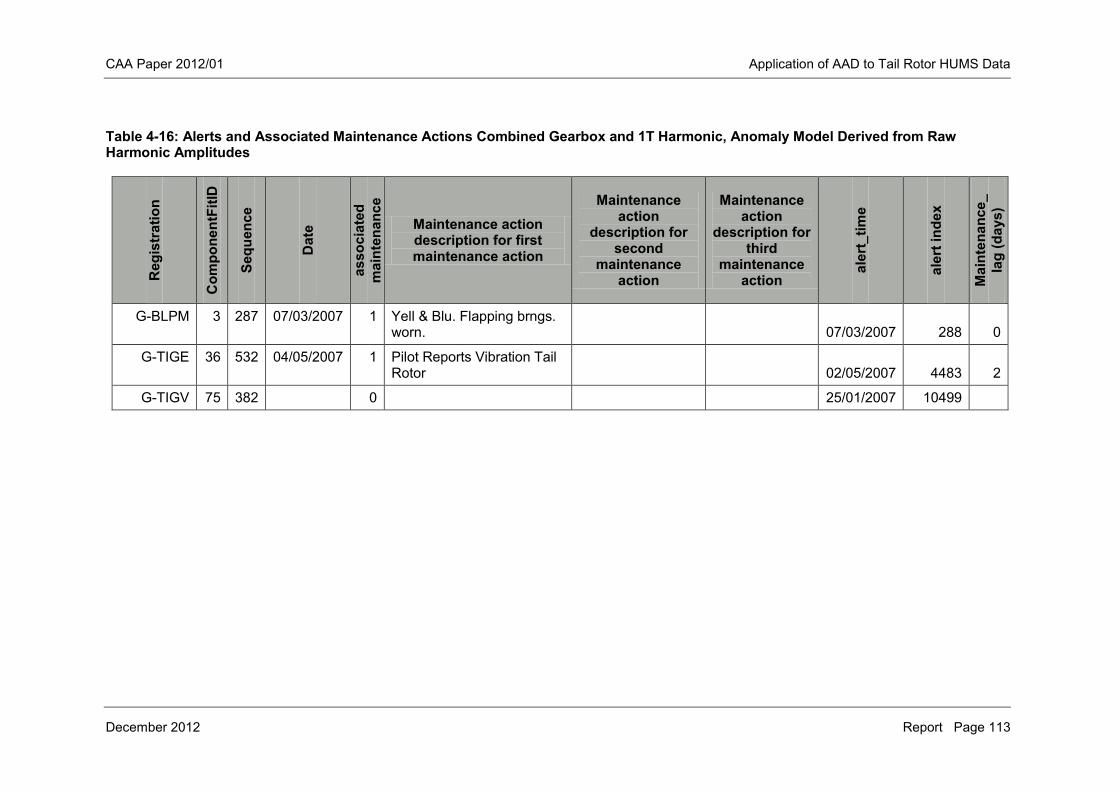
CAA Paper 2012/01 Application of AAD to Tail Rotor HUMS Data
December 2012 Report Page 113
Table 4-16: Alerts and Associated Maintenance Actions Combined Gearbox and 1T Harmonic, Anomaly Model Derived from Raw Harmonic Amplitudes
Reg
istr
atio
n
Com
pone
ntFi
tID
Sequ
ence
Dat
e
Num
ber o
f as
soci
ated
m
aint
enan
ce
reco
rds Maintenance action
description for first maintenance action
Maintenance action
description for second
maintenance action
Maintenance action
description for third
maintenance action
aler
t_tim
e
aler
t ind
ex
Mai
nten
ance
_ la
g (d
ays)
G-BLPM 3 287 07/03/2007 1 Yell & Blu. Flapping brngs. worn. 07/03/2007 288 0
G-TIGE 36 532 04/05/2007 1 Pilot Reports Vibration Tail Rotor 02/05/2007 4483 2
G-TIGV 75 382 0 25/01/2007 10499
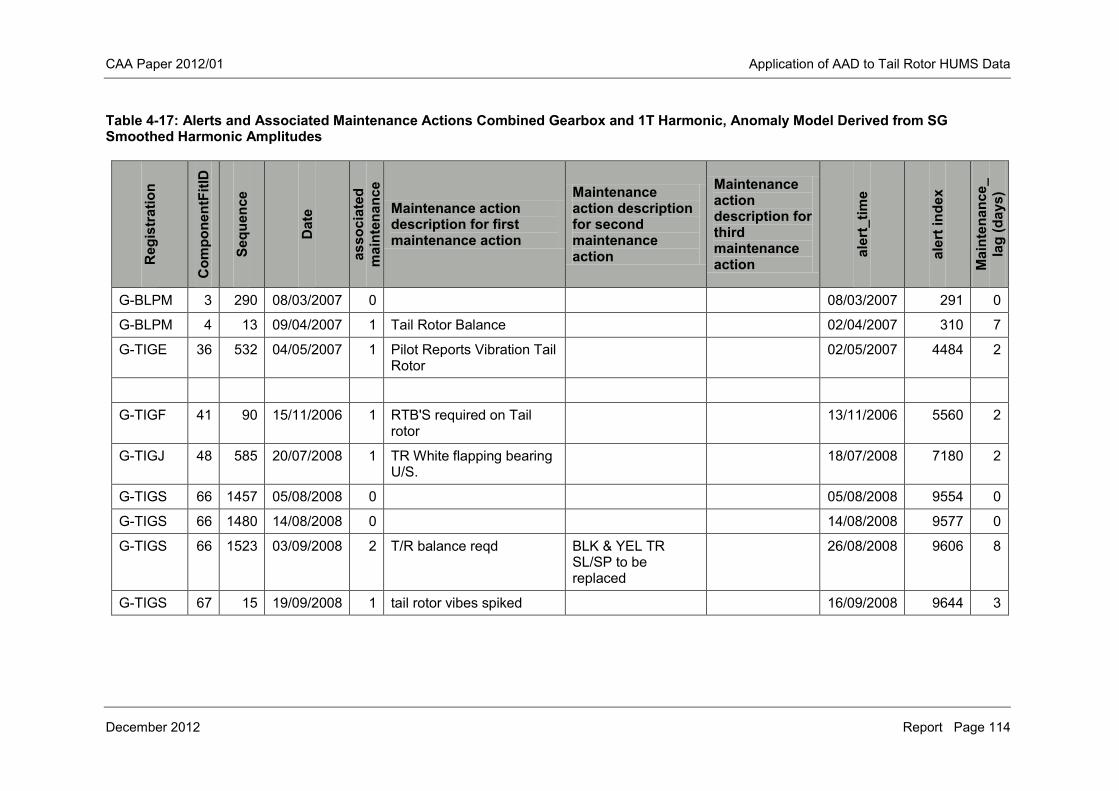
CAA Paper 2012/01 Application of AAD to Tail Rotor HUMS Data
December 2012 Report Page 114
Table 4-17: Alerts and Associated Maintenance Actions Combined Gearbox and 1T Harmonic, Anomaly Model Derived from SG Smoothed Harmonic Amplitudes
Reg
istr
atio
n
Com
pone
ntFi
tID
Sequ
ence
Dat
e
Num
ber o
f as
soci
ated
m
aint
enan
ce
reco
rds Maintenance action
description for first maintenance action
Maintenance action description for second maintenance action
Maintenance action description for third maintenance action
aler
t_tim
e
aler
t ind
ex
Mai
nten
ance
_ la
g (d
ays)
G-BLPM 3 290 08/03/2007 0 08/03/2007 291 0
G-BLPM 4 13 09/04/2007 1 Tail Rotor Balance 02/04/2007 310 7
G-TIGE 36 532 04/05/2007 1 Pilot Reports Vibration Tail Rotor
02/05/2007 4484 2
G-TIGF 41 90 15/11/2006 1 RTB'S required on Tail rotor
13/11/2006 5560 2
G-TIGJ 48 585 20/07/2008 1 TR White flapping bearing U/S.
18/07/2008 7180 2
G-TIGS 66 1457 05/08/2008 0 05/08/2008 9554 0
G-TIGS 66 1480 14/08/2008 0 14/08/2008 9577 0
G-TIGS 66 1523 03/09/2008 2 T/R balance reqd BLK & YEL TR SL/SP to be replaced
26/08/2008 9606 8
G-TIGS 67 15 19/09/2008 1 tail rotor vibes spiked 16/09/2008 9644 3
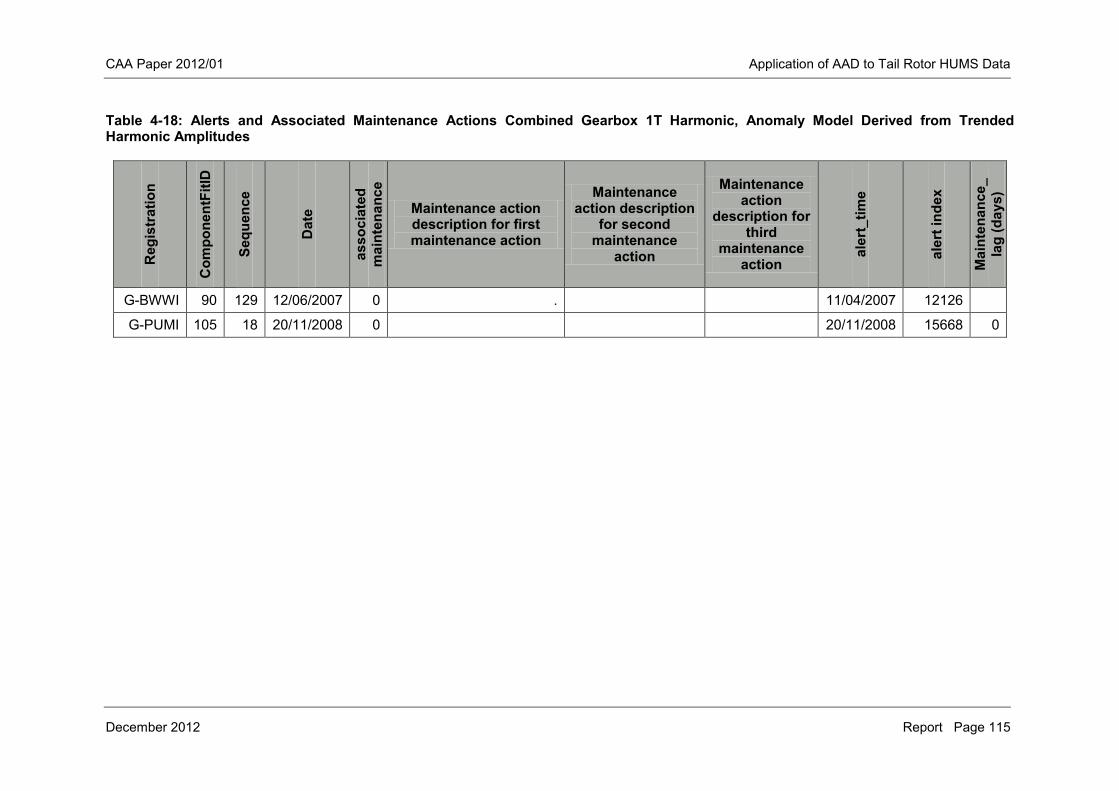
CAA Paper 2012/01 Application of AAD to Tail Rotor HUMS Data
December 2012 Report Page 115
Table 4-18: Alerts and Associated Maintenance Actions Combined Gearbox 1T Harmonic, Anomaly Model Derived from Trended Harmonic Amplitudes
Reg
istr
atio
n
Com
pone
ntFi
tID
Sequ
ence
Dat
e
Num
ber o
f as
soci
ated
m
aint
enan
ce
reco
rds Maintenance action
description for first maintenance action
Maintenance action description
for second maintenance
action
Maintenance action
description for third
maintenance action
aler
t_tim
e
aler
t ind
ex
Mai
nten
ance
_ la
g (d
ays)
G-BWWI 90 129 12/06/2007 0 . 11/04/2007 12126
G-PUMI 105 18 20/11/2008 0 20/11/2008 15668 0
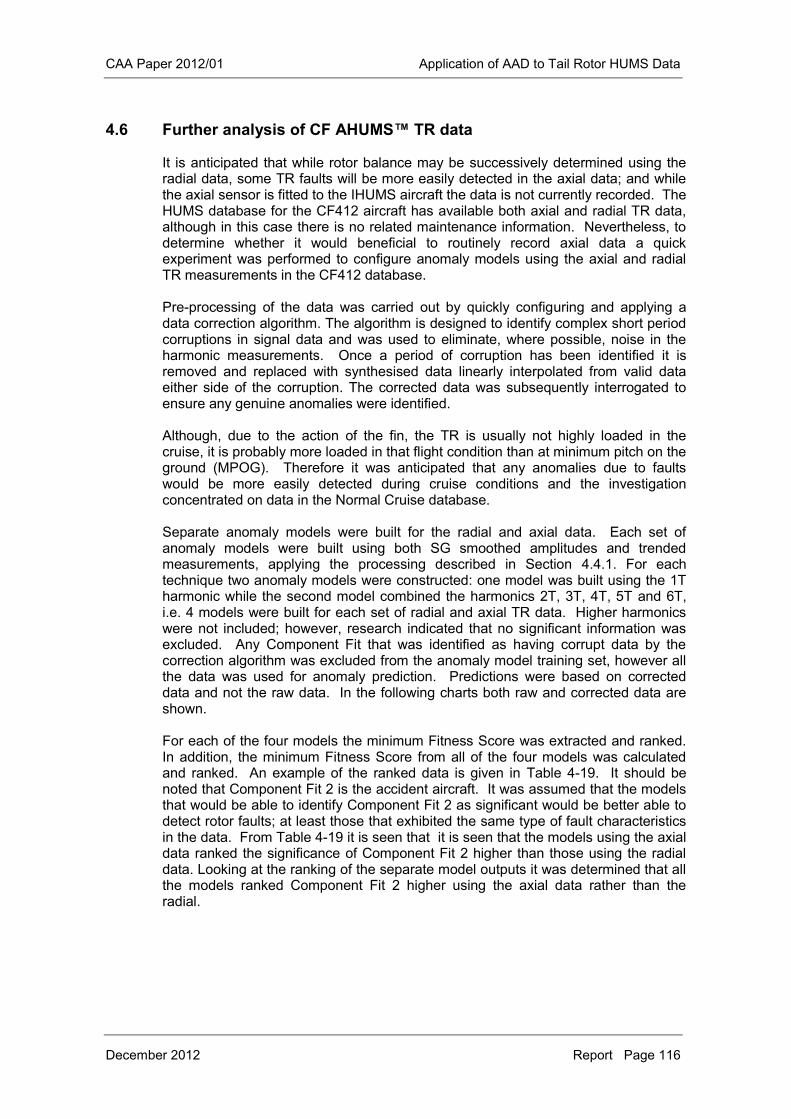
CAA Paper 2012/01 Application of AAD to Tail Rotor HUMS Data
December 2012 Report Page 116
4.6 Further analysis of CF AHUMS™ TR data
It is anticipated that while rotor balance may be successively determined using the radial data, some TR faults will be more easily detected in the axial data; and while the axial sensor is fitted to the IHUMS aircraft the data is not currently recorded. The HUMS database for the CF412 aircraft has available both axial and radial TR data, although in this case there is no related maintenance information. Nevertheless, to determine whether it would beneficial to routinely record axial data a quick experiment was performed to configure anomaly models using the axial and radial TR measurements in the CF412 database. Pre-processing of the data was carried out by quickly configuring and applying a data correction algorithm. The algorithm is designed to identify complex short period corruptions in signal data and was used to eliminate, where possible, noise in the harmonic measurements. Once a period of corruption has been identified it is removed and replaced with synthesised data linearly interpolated from valid data either side of the corruption. The corrected data was subsequently interrogated to ensure any genuine anomalies were identified. Although, due to the action of the fin, the TR is usually not highly loaded in the cruise, it is probably more loaded in that flight condition than at minimum pitch on the ground (MPOG). Therefore it was anticipated that any anomalies due to faults would be more easily detected during cruise conditions and the investigation concentrated on data in the Normal Cruise database. Separate anomaly models were built for the radial and axial data. Each set of anomaly models were built using both SG smoothed amplitudes and trended measurements, applying the processing described in Section 4.4.1. For each technique two anomaly models were constructed: one model was built using the 1T harmonic while the second model combined the harmonics 2T, 3T, 4T, 5T and 6T, i.e. 4 models were built for each set of radial and axial TR data. Higher harmonics were not included; however, research indicated that no significant information was excluded. Any Component Fit that was identified as having corrupt data by the correction algorithm was excluded from the anomaly model training set, however all the data was used for anomaly prediction. Predictions were based on corrected data and not the raw data. In the following charts both raw and corrected data are shown. For each of the four models the minimum Fitness Score was extracted and ranked. In addition, the minimum Fitness Score from all of the four models was calculated and ranked. An example of the ranked data is given in Table 4-19. It should be noted that Component Fit 2 is the accident aircraft. It was assumed that the models that would be able to identify Component Fit 2 as significant would be better able to detect rotor faults; at least those that exhibited the same type of fault characteristics in the data. From Table 4-19 it is seen that it is seen that the models using the axial data ranked the significance of Component Fit 2 higher than those using the radial data. Looking at the ranking of the separate model outputs it was determined that all the models ranked Component Fit 2 higher using the axial data rather than the radial.
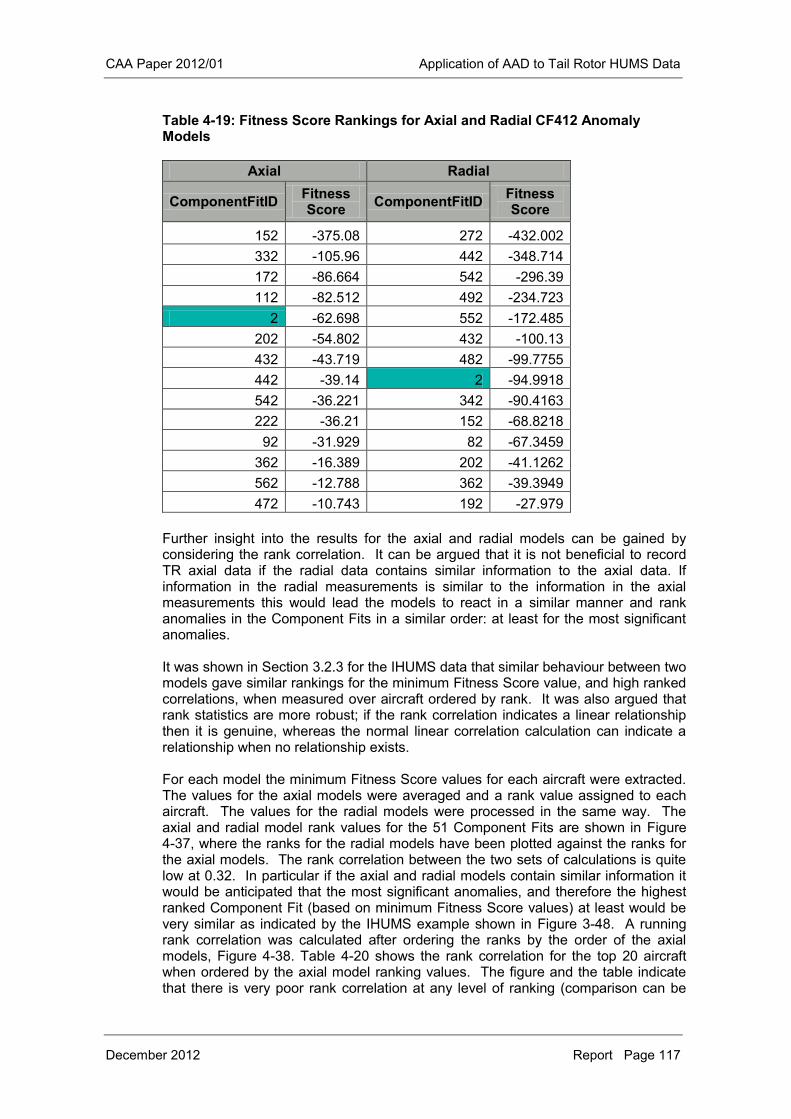
CAA Paper 2012/01 Application of AAD to Tail Rotor HUMS Data
December 2012 Report Page 117
Table 4-19: Fitness Score Rankings for Axial and Radial CF412 Anomaly Models
Axial Radial
ComponentFitID Fitness Score ComponentFitID Fitness
Score
152 -375.08 272 -432.002 332 -105.96 442 -348.714 172 -86.664 542 -296.39 112 -82.512 492 -234.723
2 -62.698 552 -172.485 202 -54.802 432 -100.13 432 -43.719 482 -99.7755 442 -39.14 2 -94.9918 542 -36.221 342 -90.4163 222 -36.21 152 -68.8218
92 -31.929 82 -67.3459 362 -16.389 202 -41.1262 562 -12.788 362 -39.3949 472 -10.743 192 -27.979
Further insight into the results for the axial and radial models can be gained by considering the rank correlation. It can be argued that it is not beneficial to record TR axial data if the radial data contains similar information to the axial data. If information in the radial measurements is similar to the information in the axial measurements this would lead the models to react in a similar manner and rank anomalies in the Component Fits in a similar order: at least for the most significant anomalies. It was shown in Section 3.2.3 for the IHUMS data that similar behaviour between two models gave similar rankings for the minimum Fitness Score value, and high ranked correlations, when measured over aircraft ordered by rank. It was also argued that rank statistics are more robust; if the rank correlation indicates a linear relationship then it is genuine, whereas the normal linear correlation calculation can indicate a relationship when no relationship exists. For each model the minimum Fitness Score values for each aircraft were extracted. The values for the axial models were averaged and a rank value assigned to each aircraft. The values for the radial models were processed in the same way. The axial and radial model rank values for the 51 Component Fits are shown in Figure 4-37, where the ranks for the radial models have been plotted against the ranks for the axial models. The rank correlation between the two sets of calculations is quite low at 0.32. In particular if the axial and radial models contain similar information it would be anticipated that the most significant anomalies, and therefore the highest ranked Component Fit (based on minimum Fitness Score values) at least would be very similar as indicated by the IHUMS example shown in Figure 3-48. A running rank correlation was calculated after ordering the ranks by the order of the axial models, Figure 4-38. Table 4-20 shows the rank correlation for the top 20 aircraft when ordered by the axial model ranking values. The figure and the table indicate that there is very poor rank correlation at any level of ranking (comparison can be
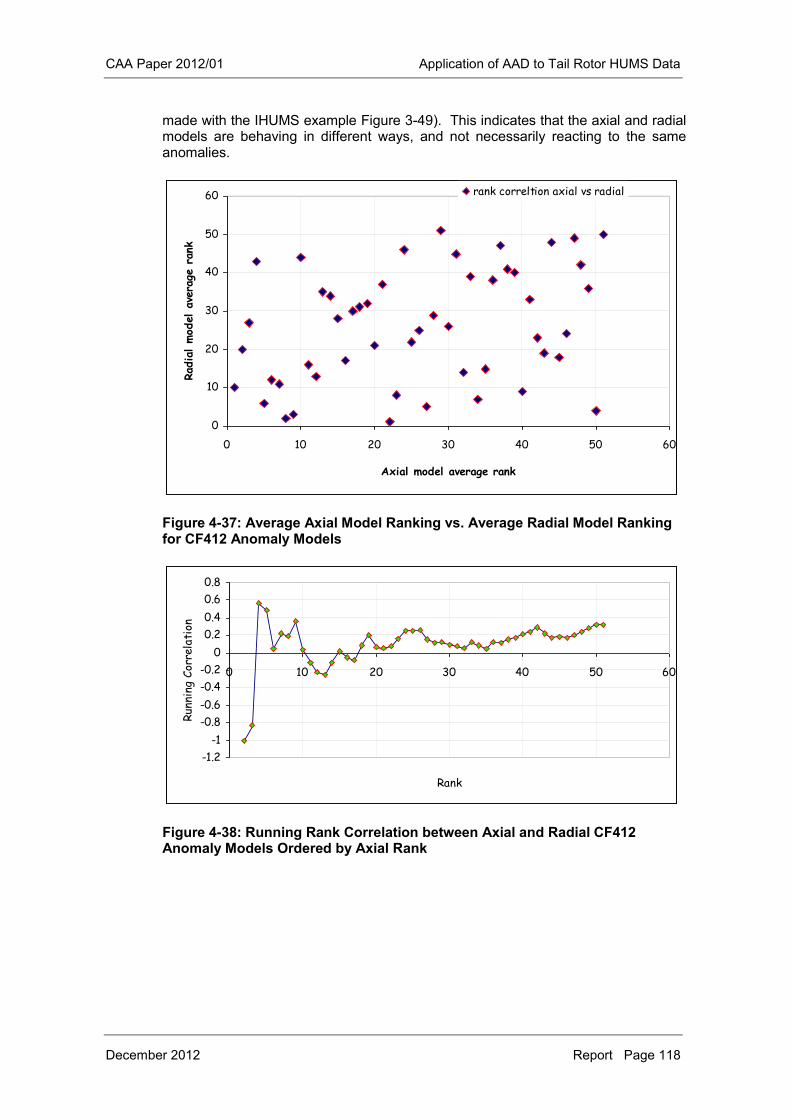
CAA Paper 2012/01 Application of AAD to Tail Rotor HUMS Data
December 2012 Report Page 118
made with the IHUMS example Figure 3-49). This indicates that the axial and radial models are behaving in different ways, and not necessarily reacting to the same anomalies.
Figure 4-37: Average Axial Model Ranking vs. Average Radial Model Ranking for CF412 Anomaly Models
Figure 4-38: Running Rank Correlation between Axial and Radial CF412 Anomaly Models Ordered by Axial Rank
0
10
20
30
40
50
60
0 10 20 30 40 50 60
Axial model average rank
Rad
ial mod
el a
vera
ge r
ank
rank correltion axial vs radial
-1.2
-1
-0.8
-0.6
-0.4
-0.2
0
0.2
0.4
0.6
0.8
0 10 20 30 40 50 60
Rank
Run
ning
Cor
rela
tion
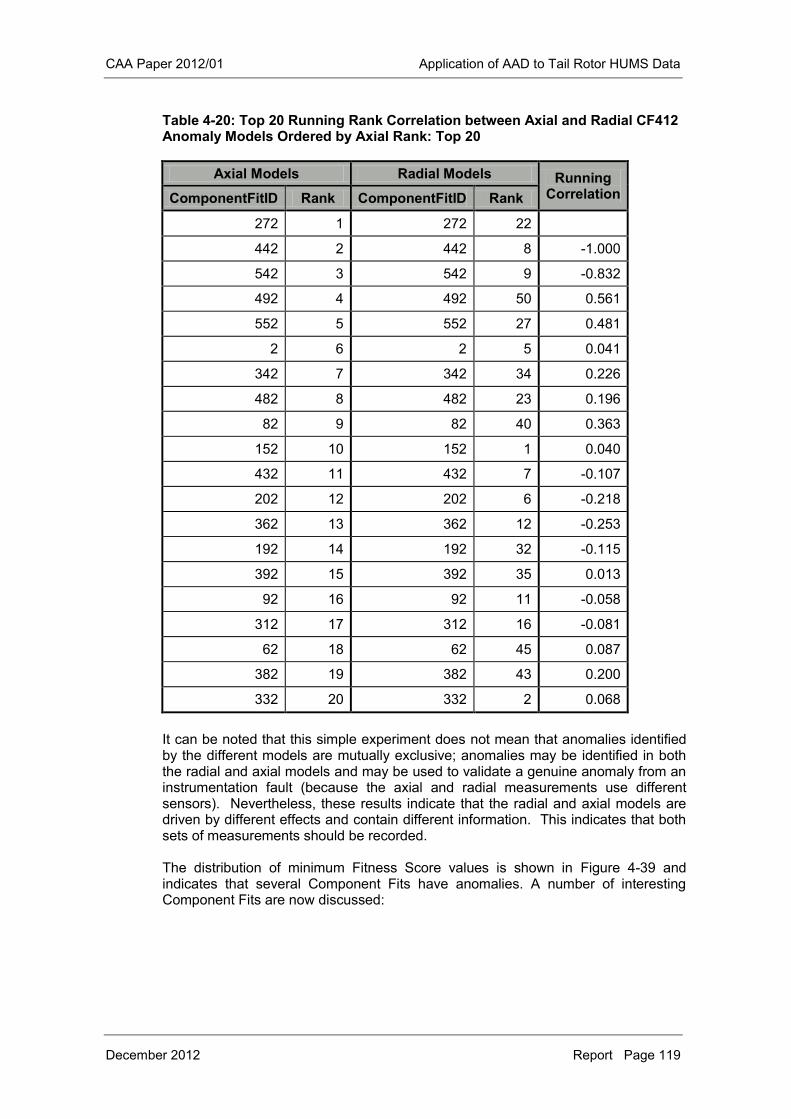
CAA Paper 2012/01 Application of AAD to Tail Rotor HUMS Data
December 2012 Report Page 119
Table 4-20: Top 20 Running Rank Correlation between Axial and Radial CF412 Anomaly Models Ordered by Axial Rank: Top 20
Axial Models Radial Models Running Correlation ComponentFitID Rank ComponentFitID Rank
272 1 272 22
442 2 442 8 -1.000
542 3 542 9 -0.832
492 4 492 50 0.561
552 5 552 27 0.481
2 6 2 5 0.041
342 7 342 34 0.226
482 8 482 23 0.196
82 9 82 40 0.363
152 10 152 1 0.040
432 11 432 7 -0.107
202 12 202 6 -0.218
362 13 362 12 -0.253
192 14 192 32 -0.115
392 15 392 35 0.013
92 16 92 11 -0.058
312 17 312 16 -0.081
62 18 62 45 0.087
382 19 382 43 0.200
332 20 332 2 0.068 It can be noted that this simple experiment does not mean that anomalies identified by the different models are mutually exclusive; anomalies may be identified in both the radial and axial models and may be used to validate a genuine anomaly from an instrumentation fault (because the axial and radial measurements use different sensors). Nevertheless, these results indicate that the radial and axial models are driven by different effects and contain different information. This indicates that both sets of measurements should be recorded. The distribution of minimum Fitness Score values is shown in Figure 4-39 and indicates that several Component Fits have anomalies. A number of interesting Component Fits are now discussed:
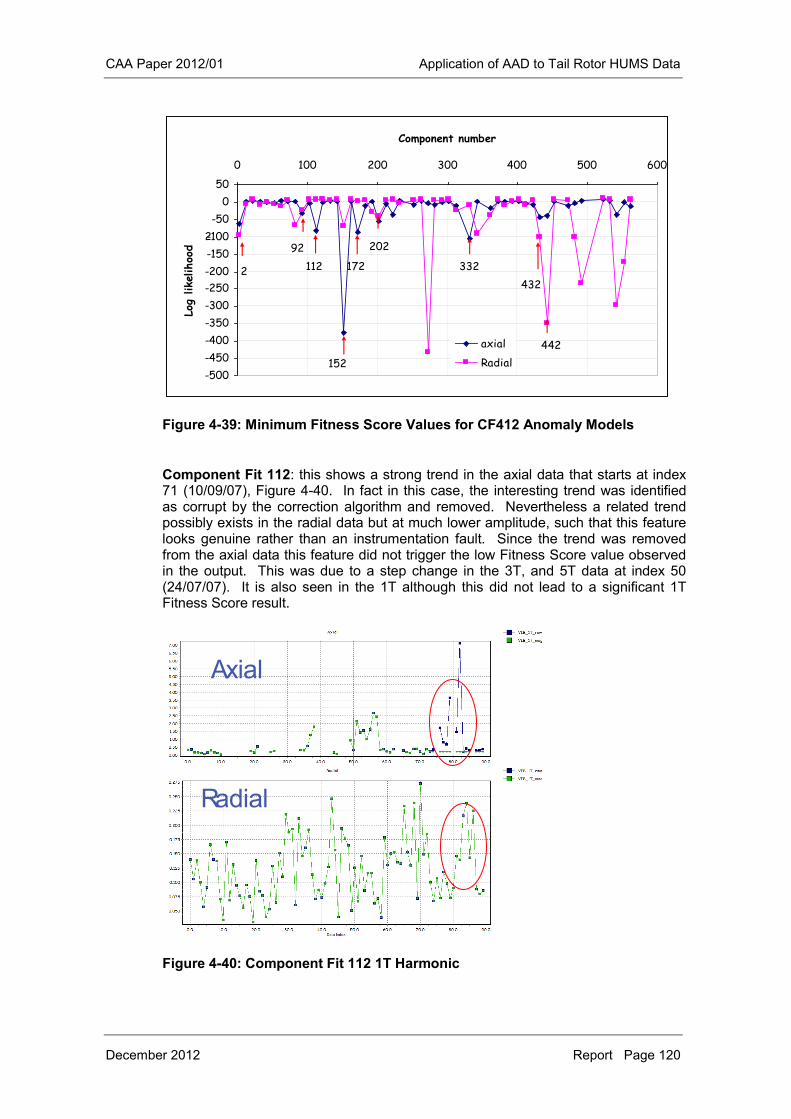
CAA Paper 2012/01 Application of AAD to Tail Rotor HUMS Data
December 2012 Report Page 120
Figure 4-39: Minimum Fitness Score Values for CF412 Anomaly Models
Component Fit 112: this shows a strong trend in the axial data that starts at index 71 (10/09/07), Figure 4-40. In fact in this case, the interesting trend was identified as corrupt by the correction algorithm and removed. Nevertheless a related trend possibly exists in the radial data but at much lower amplitude, such that this feature looks genuine rather than an instrumentation fault. Since the trend was removed from the axial data this feature did not trigger the low Fitness Score value observed in the output. This was due to a step change in the 3T, and 5T data at index 50 (24/07/07). It is also seen in the 1T although this did not lead to a significant 1T Fitness Score result.
Figure 4-40: Component Fit 112 1T Harmonic
-500
-450
-400
-350
-300
-250
-200
-150
-100
-50
0
50
0 100 200 300 400 500 600
Component number
Log
like
lihoo
d
axial
Radial
2
112
152
172 332
442
432
20292
2
Axial
Radial
Axial
Radial
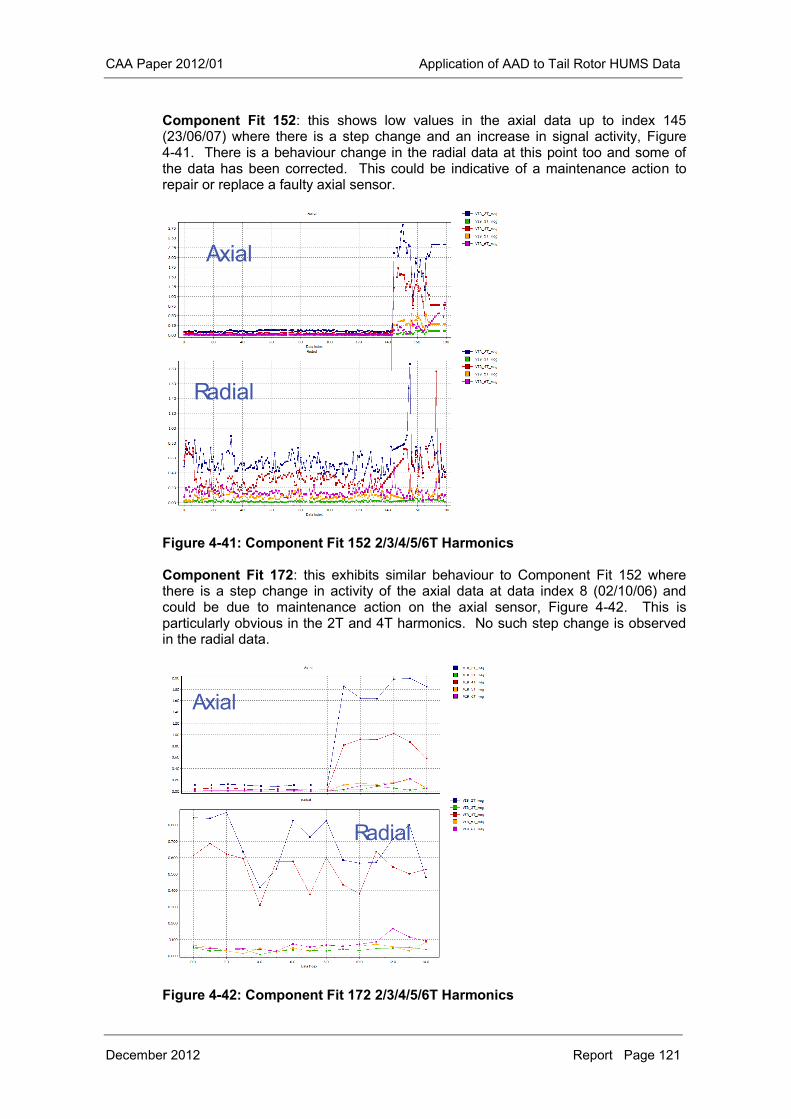
CAA Paper 2012/01 Application of AAD to Tail Rotor HUMS Data
December 2012 Report Page 121
Component Fit 152: this shows low values in the axial data up to index 145 (23/06/07) where there is a step change and an increase in signal activity, Figure 4-41. There is a behaviour change in the radial data at this point too and some of the data has been corrected. This could be indicative of a maintenance action to repair or replace a faulty axial sensor.
Figure 4-41: Component Fit 152 2/3/4/5/6T Harmonics
Component Fit 172: this exhibits similar behaviour to Component Fit 152 where there is a step change in activity of the axial data at data index 8 (02/10/06) and could be due to maintenance action on the axial sensor, Figure 4-42. This is particularly obvious in the 2T and 4T harmonics. No such step change is observed in the radial data.
Figure 4-42: Component Fit 172 2/3/4/5/6T Harmonics
Axial
Radial
Axial
Radial
Axial
Radial
Axial
Radial
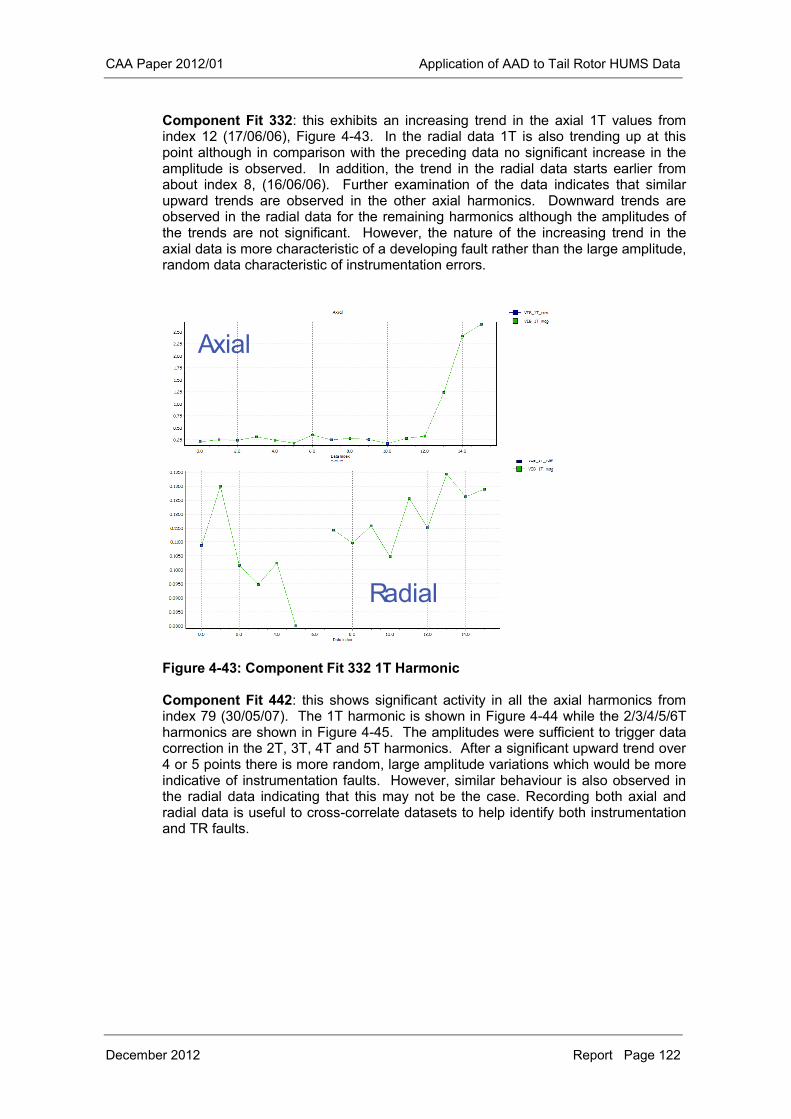
CAA Paper 2012/01 Application of AAD to Tail Rotor HUMS Data
December 2012 Report Page 122
Component Fit 332: this exhibits an increasing trend in the axial 1T values from index 12 (17/06/06), Figure 4-43. In the radial data 1T is also trending up at this point although in comparison with the preceding data no significant increase in the amplitude is observed. In addition, the trend in the radial data starts earlier from about index 8, (16/06/06). Further examination of the data indicates that similar upward trends are observed in the other axial harmonics. Downward trends are observed in the radial data for the remaining harmonics although the amplitudes of the trends are not significant. However, the nature of the increasing trend in the axial data is more characteristic of a developing fault rather than the large amplitude, random data characteristic of instrumentation errors.
Figure 4-43: Component Fit 332 1T Harmonic
Component Fit 442: this shows significant activity in all the axial harmonics from index 79 (30/05/07). The 1T harmonic is shown in Figure 4-44 while the 2/3/4/5/6T harmonics are shown in Figure 4-45. The amplitudes were sufficient to trigger data correction in the 2T, 3T, 4T and 5T harmonics. After a significant upward trend over 4 or 5 points there is more random, large amplitude variations which would be more indicative of instrumentation faults. However, similar behaviour is also observed in the radial data indicating that this may not be the case. Recording both axial and radial data is useful to cross-correlate datasets to help identify both instrumentation and TR faults.
Axial
Radial
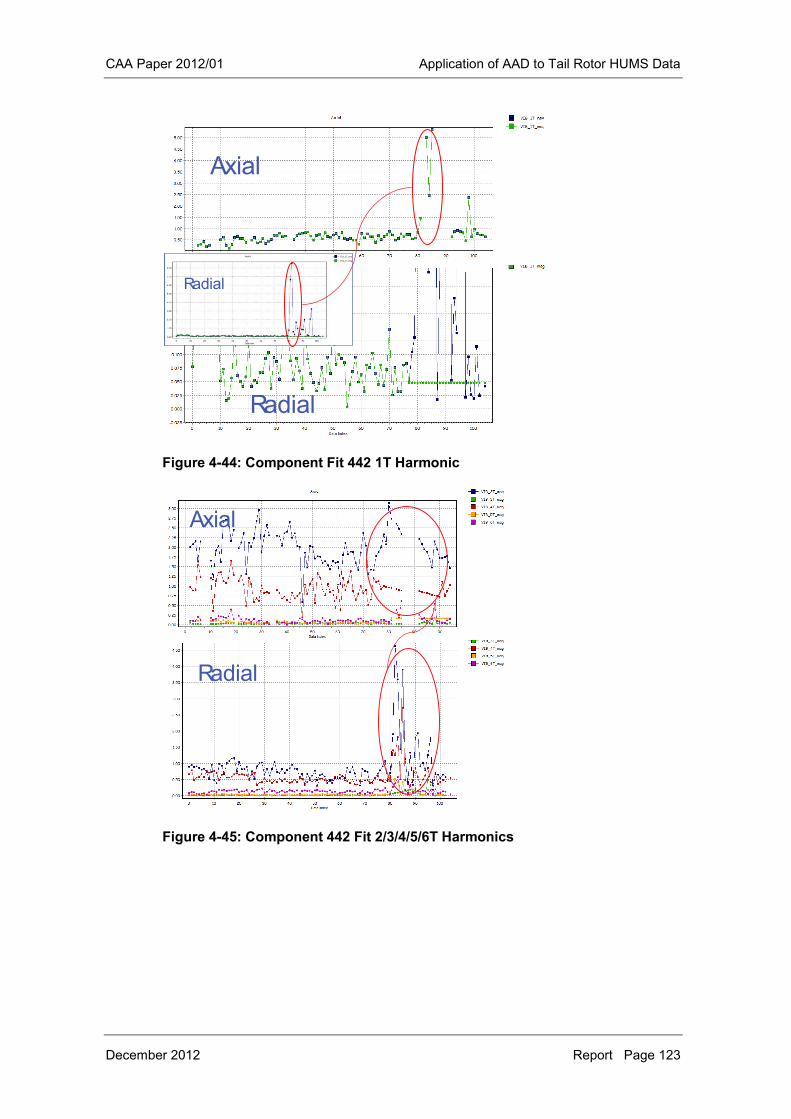
CAA Paper 2012/01 Application of AAD to Tail Rotor HUMS Data
December 2012 Report Page 123
Figure 4-44: Component Fit 442 1T Harmonic
Figure 4-45: Component 442 Fit 2/3/4/5/6T Harmonics
Axial
Radial
Radial
Axial
Radial
Radial
Axial
Radial
Axial
Radial
CAA Paper 2012/01 Application of AAD to Tail Rotor HUMS Data
December 2012 Report Page 124
5 Conclusions and Recommendations
5.1 Conclusions
Under an extension to Contract No. 841, GE Aviation conducted a helicopter rotor HUMS study to review the status of rotor health monitoring research, and also accidents caused by rotor system failures. This study identified two Main Rotor (MR) failure cases and three Tail Rotor (TR) cases for which HUMS data was available. In neither of the MR cases (a MR blade failure and a cracked blade yoke) was there any evidence in the currently acquired HUMS data of fault-induced changes that could have provided warning of the failure. However, in all three TR cases (failure of a flapping hinge retainer; failure of a pitch change spider; and a blade failure) an investigation performed after the incident or accident revealed some fault-related information in the HUMS vibration data. In one case an increase in 1/rev vibration had triggered a HUMS alert, but an inspection failed to detect the fault. In the other two cases there were increases in vibration harmonics for which thresholds are not currently set. It was therefore concluded that there is potential to improve airworthiness through the application of Advanced Anomaly Detection (AAD) to HUMS TR vibration data. Under a further extension to Contract No. 841, GE Aviation has applied its AAD technology to HUMS vibration data from two TR-related accidents and one TR-related incident, and also a database of historical Bristow 332L IHUMS data (with TR faults identified in a separate maintenance database) to evaluate the potential airworthiness and maintenance benefits that could be obtained. The analysis consisted of three primary elements; anomaly modelling of single and multiple TR harmonics, merging data from different acquisitions stored in different database tables (e.g. to allow TR axial and radial data to be modelled together), and automated trend analysis. A blade failure occurred on the two bladed TR of a Bell 412 helicopter. The clearest failure related trends were in 1T and 5T axial and radial vibration. The 1T vibration would be expected as a result of the defection of the cracked blade. However the 5T trend could not have been predicted, and is believed to be due to excitation of a blade bending mode, as the frequencies of the blade modes would decrease as the crack developed. Several anomaly models built with different combinations of vibration harmonics responded to the fault. An axial 5T univariate model had the highest anomaly ranking, identifying the significance of the 5T axial data; however fusing multiple TR harmonics in an anomaly model also gave a clear fault indication. A trend detection algorithm showed that the last 3 data points from the accident aircraft could be identified as part of a trend. The results indicated that a TR AAD alert could have been triggered on the flight prior to a refuelling stop that occurred before the final flight. A failure occurred on one of the arms of the pitch change spider on the 5 bladed TR of a Super Puma. The clearest failure related trends were in 1T, 4T and 6T axial and radial vibration. In this case, the frequencies could be predicted from a knowledge of the failure mode (causing 1/rev modulation of the blade pass frequency). Multiple anomaly models were built using axial and radial TR data and all models clearly responded to the failure. The trend detection algorithm identified a clear trend on the accident aircraft; however this was only detected on the last two data points. The results show that a TR alert could have been triggered after the first flight of the day of the accident, with the failure occurring on the second flight.
CAA Paper 2012/01 Application of AAD to Tail Rotor HUMS Data
December 2012 Report Page 125
The third incident involved a Super Puma with a cracked flapping hinge retainer on one of the 5 TR blades. The available accident data was limited to published plots of HUMS Tail rotor Gearbox (TGB) output SO1 data and ‘composite’ TR vibration measurements. An anomaly model was built using recreated TGB output SO1 data and the accident aircraft was identified as anomalous. A trend detection algorithm also identified a clear trend in the data. In this case the existing IHUMS had triggered an alert, but a subsequent maintenance inspection failed to identify the developing flapping hinge retainer crack. For the two accident cases an anomaly alert could have been triggered before the final flight, however to prevent the accident it would have been necessary for the HUM system to report a warning, and for this to have been acted upon, between two flights on the same day. In the case of the incident, an anomaly warning could have been generated several flights before the failure. In both accident cases the effects of the faults were clearest in the TR axial data as opposed to the radial data. Radial measurements can be affected by both TR unbalance and component faults, whereas axial measurements are in the axis of thrust generated loadings, which could exercise faults. As for the application of AAD to the helicopter rotor drive system, in all cases the most extreme anomalies identified were believed to be due to HUMS instrumentation issues. For TR failures, there can be a very limited time interval between the point at which damage propagates to an extent that it affects the vibration measurements and the final failure. As HUMS data is not downloaded and analysed after every landing (the aircraft may be away from its operating base), if all three accidents/incidents were to have been prevented it would probably be necessary to implement AAD in the on-board system and provide a cockpit indication on the ground before take-off. There may then be a problem of nuisance alerts due to HUMS instrumentation issues. However, even without this capability, applying AAD to HUMS TR data would still improve fault detection as multiple TR harmonics can be modelled, including ones that do not currently have HUMS thresholds. The Bristow Super Puma TR ‘maintenance study’ (analysing maintenance-related TR faults) used IHUMS data that was limited to radial measurements only, but included both amplitude and phase. The TR maintenance actions identified typically related to TR balance, pitch link bearings, flapping hinge bearings, and sleeve and spindle bearings. According to the maintenance data, there were repeat occurrences of similar faults, however the TR vibration data showed trends in different TR harmonics, and it was not possible to identify any consistent pattern between the harmonics in the TR vibration data and particular documented fault types. However instrumentation faults could affect all harmonics. The analysis indicated that multiple TR harmonics can be combined in a single model to provide a general fault detection capability, while a separate 1T model remains useful to identify balance issues. An analysis of the TR phase data identified phase shifts caused by maintenance actions, but did not highlight any clear trends in phase information that could be correlated with developing faults. Results showed that the outputs from anomaly models combining amplitude and phase information were primarily dependent on magnitude rather than phase. Therefore it was concluded that using the phase data did not provide any improvement in the ability to detect TR faults. The Bristow IHUMS data was affected by frequent TR maintenance and servicing actions, with noise also being present due to suspected instrumentation issues. Smoothing the data and applying trend analysis to identify underlying trends was
CAA Paper 2012/01 Application of AAD to Tail Rotor HUMS Data
December 2012 Report Page 126
useful, suppressing the effects of data noise. However, smoothing techniques must be treated with caution as the accident analysis showed that TR faults causing accidents can develop quickly. To complete the project, some limited further analysis was performed on the Bell 412 HUMS TR data. This data was pre-processed using a smoothing filter, and anomaly models were built on the smoothed magnitude data. A trend algorithm was also applied to automatically identify and extract linear trends in the data, and trend models were built on differences in linear trend data. Anomaly models were built on the smoothed magnitudes and trends in the 1T and 2-6T harmonics of the data from the radial and axial accelerometers. Like the previously analysed Bristow 332L IHUMS data, the Bell 412 data also appeared to be affected by HUMS instrumentation issues. It was concluded from this short final anomaly modelling exercise that TR faults appear to be generally more visible in the axial dataset rather than the radial. Cross correlating axial and radial data sets can help to distinguish between instrumentation errors and potential faults.
5.2 Recommendations
It is recommended that, when implementing an AAD capability for the helicopter rotor drive system, AAD models are also included for the TR. While there may be aircraft specific modeling requirements, for an optimum balance between good fault detection and diagnostic capabilities and reduced false alarms, it is generally recommended that four model configurations are implemented. These are two univariate models; 1T radial and 1T axial, and two multivariate models; 2 to n+1T radial, 2 to n+1T axial (where n = 4 or the number of TR blades, whichever is larger). 1T radial and axial measurements could be included in a single model, however it would involve combining results from different data acquisitions (this has not been implemented in current AAD systems). Consideration should be given to the application of appropriate data pre- and post processing techniques to enhance the AAD results. Pre-processing may include the use of techniques to identify data trends (building models on trend data) and the careful use of smoothing techniques if data is noisy. Post-processing can include anomaly model output trend identification and severity assessment. TR vibration monitoring may provide a late indication of a potential TR hub or blade failure. Therefore, where possible, HUMS data should be downloaded and reviewed between flights. For system upgrades and future systems, consideration should be given to the feasibility of providing on-ground indications of MR and TR vibration monitoring alerts on a Multi-Functional Display in the cockpit. Providing on-ground cockpit alerts based on AAD would also require the implementation of an AAD capability in the on-board system. Alternatively, where the facilities exist, MR and TR vibration measurements and alerts could be included in data transmitted from aircraft via a Satcom link in flight or a Wifi link at a landing site. As TRs can have different numbers of blades, there will be some differences in the TR vibration measurements between different aircraft types, for example in the number of harmonics measured. However it is recommended that, for TR VHM, the measurement set is standardised where possible. Data should be acquired from both radial and axial accelerometers and should, as a minimum, include measurements at MPOG and in normal cruise of all harmonics up to nT+1 where n = 4 or the number of TR blades, whichever is larger.
CAA Paper 2012/01 Application of AAD to Tail Rotor HUMS Data
December 2012 Report Page 127
Vibration monitoring can provide TR health information, however instrumentation problems can cause a significant number of false alarms. Providing high reliability instrumentation and the elimination of signal noise should be key requirements for the design and installation of accelerometers and wiring harnesses for TR vibration monitoring. The analysis described in this report was performed on TR data from early generation HUM systems and, in the case of the Bristow IHUMS, on data from a radial sensor only. TR data could be analysed from more modern aircraft (e.g. the EC225 or AW139), with different TR hub designs and possibly more reliable instrumentation. However, no further accident data is available and, whilst further analysis may yield new information, it would be unlikely to change the overall conclusions of the work. As there are similar limitations with MR and TR VHM, consideration should be given to further research into health monitoring techniques that would be applicable to both the MR and TR. This could include areas such as the investigation of the potential use of vibration data acquired during unsteady flight conditions, and the investigation of the emergent rotating-frame sensing technologies including data transfer from the rotor system to the non-rotating fuselage equipment.
CAA Paper 2012/01 Application of AAD to Tail Rotor HUMS Data
December 2012 Report Page 128
6 References and Acknowledgement
1 CAA Paper 2011/01: “Intelligent Management of Helicopter Vibration Health Monitoring Data”, May 2012.
2 CAA Paper 2008/05: “HUMS Extension to Rotor Health Monitoring”,
March 2009. 3 “Report on the Incident to Aerospatiale AS332L Super Puma, G-PUMH over
North Sea on 27 September 1995”, AAIB Aircraft Incident Report 2/98. 4 Canadian Forces Flight Safety Investigation Report (FSIR) – Final Report, File
Number 1010-CH146420 (DFS 2-2), 24 June 2005.
5 GE Aviation report REP1649(3), “MHS Aircraft 9M-STT Ditching – Analysis of HUMS Data”, September 2005.
Acknowledgement
GE Aviation wishes to acknowledge the assistance given by the following organisations in providing data and information for this work: Meggitt Avionics, Bristow Helicopters, CHC Helicopters, DND Canada, Malaysian Helicopter Services and Eurocopter.

![Anomaly Detection: Principles, Benchmarking, Explanation ...web.engr.oregonstate.edu/~tgd/...anomaly-detection... · Towards a Theory of Anomaly Detection [Siddiqui, et al.; UAI 2016]](https://static.fdocuments.us/doc/165x107/5fd8992320a65f059c333c6d/anomaly-detection-principles-benchmarking-explanation-webengr-tgdanomaly-detection.jpg)


![Comparison of Unsupervised Anomaly Detection Techniques · a RapidMiner [10] Extension Anomaly Detection was developed that contains several unsupervised anomaly detection techniques.](https://static.fdocuments.us/doc/165x107/5b014b8c7f8b9a952f8e25e8/comparison-of-unsupervised-anomaly-detection-rapidminer-10-extension-anomaly-detection.jpg)


