The Annual Community Report Taylor Middleton, August 30, 2013.
28
The Annual Community Report Taylor Middleton, August 30, 2013
-
Upload
jasper-johnson -
Category
Documents
-
view
214 -
download
0
Transcript of The Annual Community Report Taylor Middleton, August 30, 2013.
The Annual Community Report
Taylor Middleton, August 30, 2013
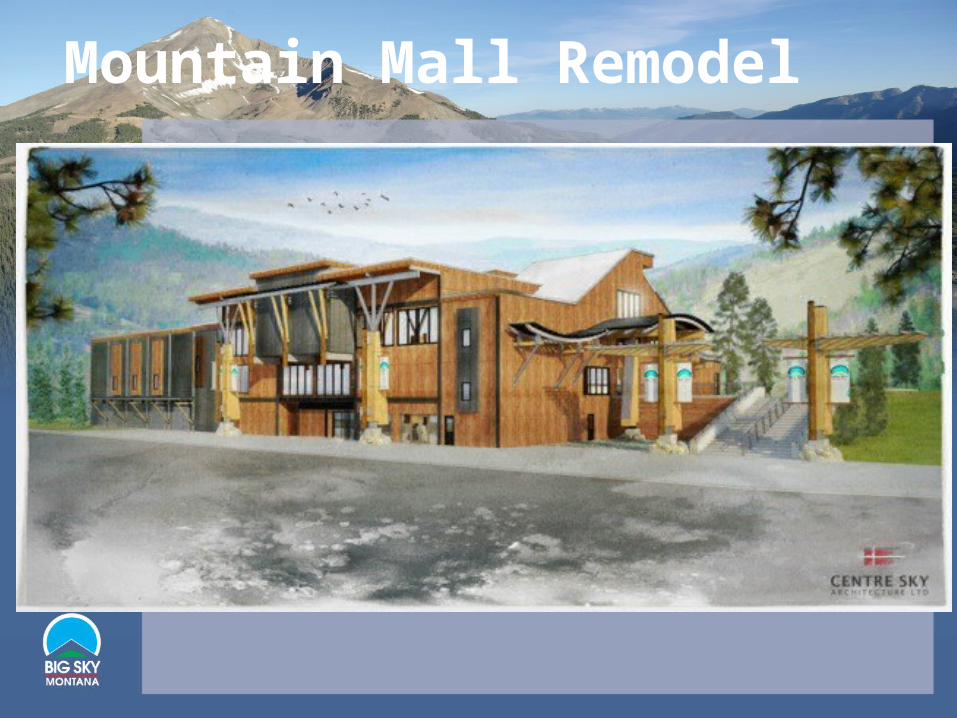
Mountain Mall Remodel
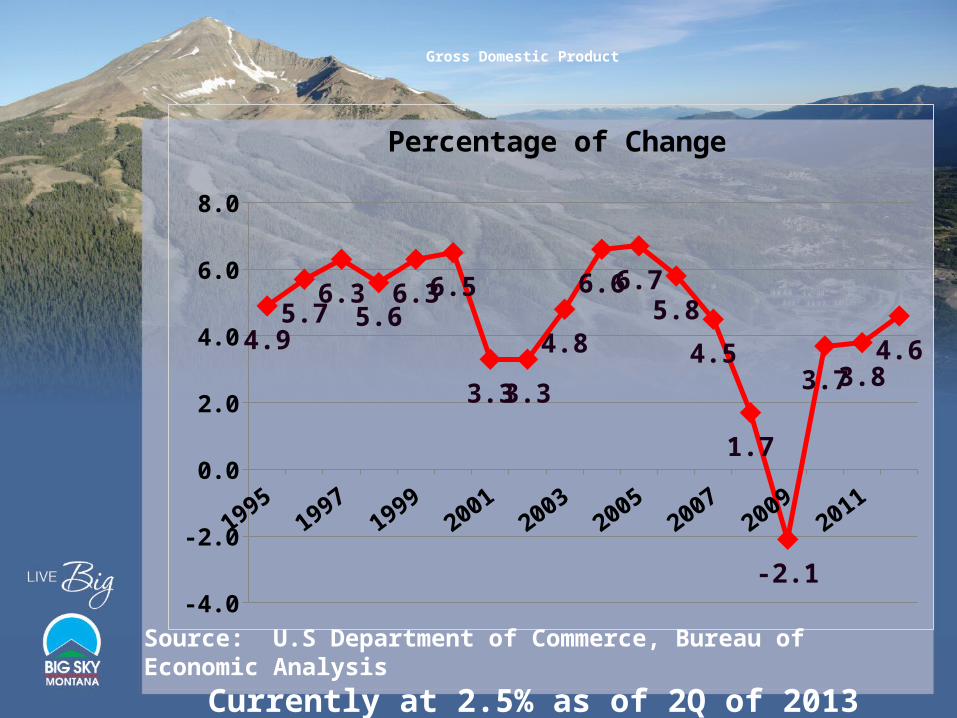
Gross Domestic Product
19951997
19992001
20032005
20072009
2011
-4.0
-2.0
0.0
2.0
4.0
6.0
8.0
4.95.7
6.35.6
6.36.5
3.33.3
4.8
6.66.75.8
4.5
1.7
-2.1
3.73.84.6
Percentage of Change
Source: U.S Department of Commerce, Bureau of Economic Analysis
Currently at 2.5% as of 2Q of 2013
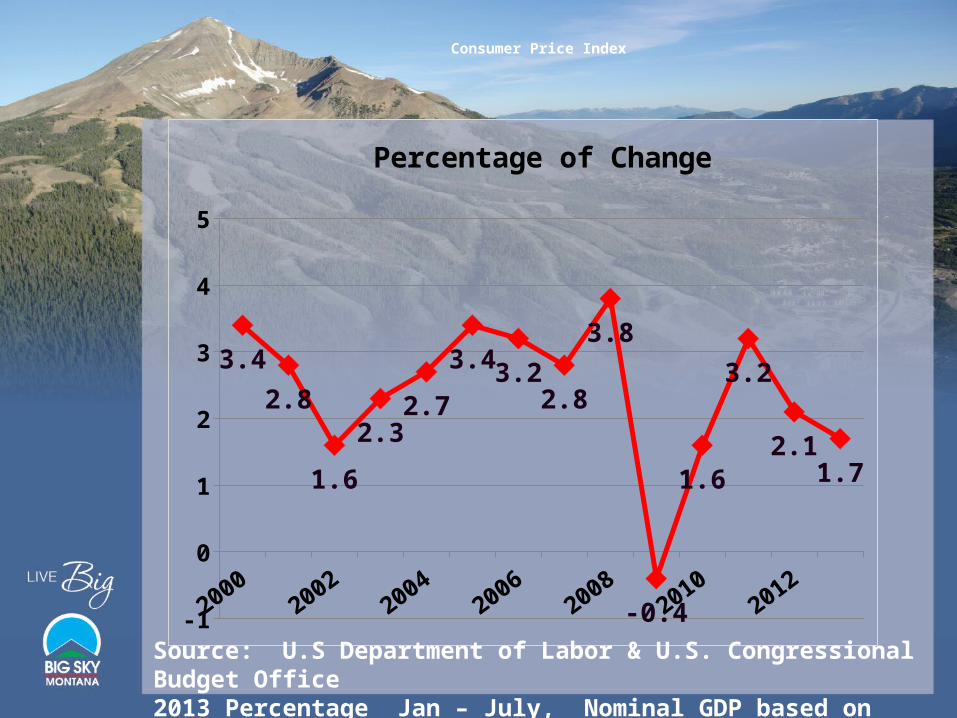
Consumer Price Index
20002002
20042006
20082010
2012
-1
0
1
2
3
4
5
3.4
2.8
1.6
2.32.7
3.43.22.8
3.8
-0.4
1.6
3.2
2.11.7
Percentage of Change
Source: U.S Department of Labor & U.S. Congressional Budget Office2013 Percentage Jan – July, Nominal GDP based on actual prices

USA Unemployment 7.4%
Jan Feb Mar Apr May Jun Jul Aug Sep Oct Nov Dec0.0
2.0
4.0
6.0
8.0
10.0
12.0
20032004200520062007200820092010201120122013
Bureau of Labor Statistics / US Department of Labor
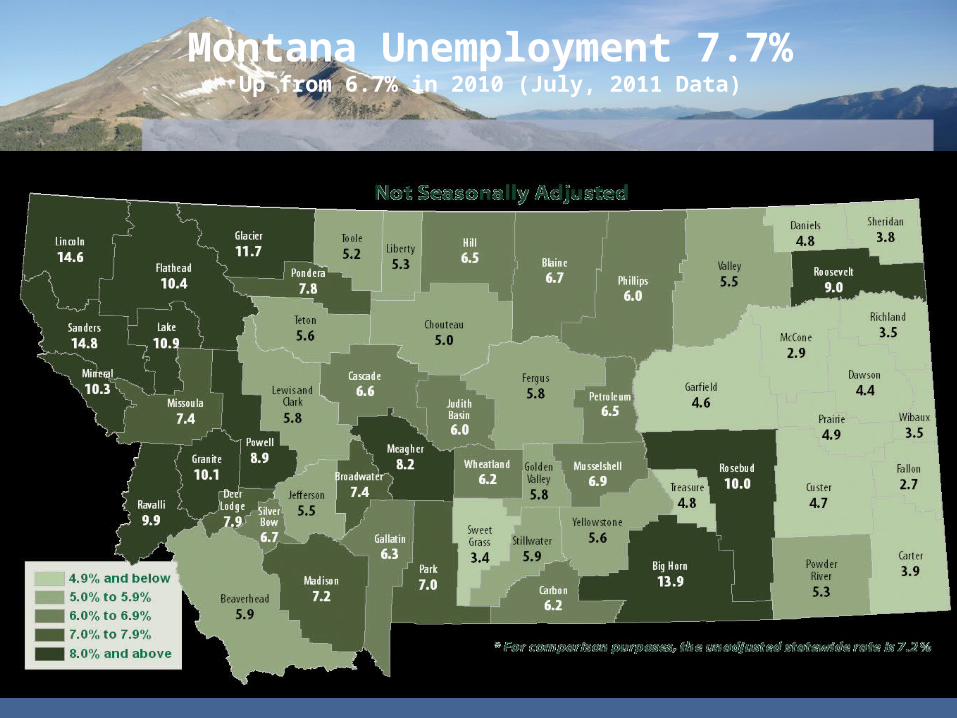
Montana Unemployment 7.7%Up from 6.7% in 2010 (July, 2011 Data)
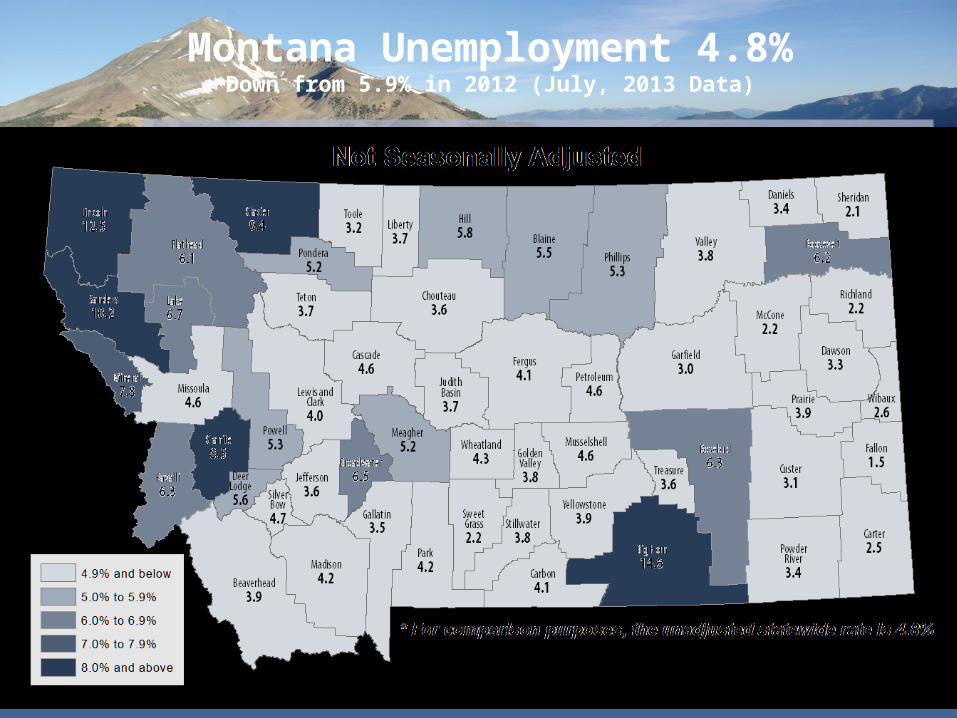
Montana Unemployment 4.8%Down from 5.9% in 2012 (July, 2013 Data)

Census Data
2000 2010 20130
50,000,000
100,000,000
150,000,000
200,000,000
250,000,000
300,000,000
350,000,000
281,421,906308,745,538 314,000,000
Population Growth United States 9.7%
Population Growth United States
US population growth of 1.7% since 2010

Census Data
2000 2010 20130
200,000
400,000
600,000
800,000
1,000,000
1,200,000
902,195989,415 1,005,000
Population Growth Montana 9.6%
Population Growth M...
Montana population growth of 1.6% since 2010
Census Data
2000 20100
500
1,000
1,500
2,000
2,500
1,221
2,308
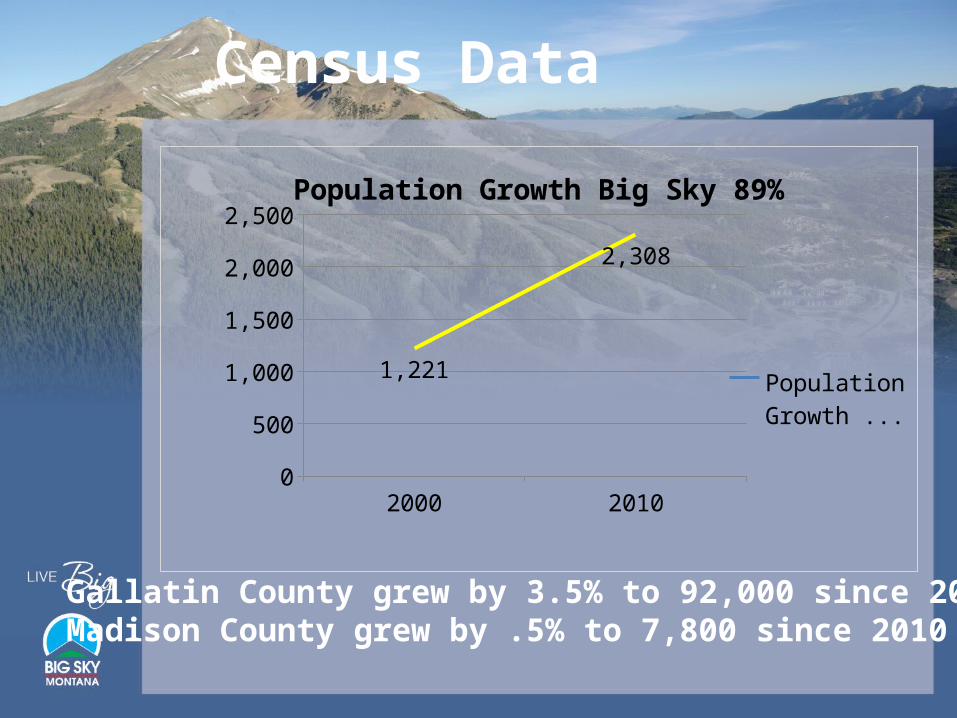
Population Growth Big Sky 89%
Population Growth Big Sky
Gallatin County grew by 3.5% to 92,000 since 2010Madison County grew by .5% to 7,800 since 2010
Census Data
U.S.
Montan
a
Big Sk
yVail
Jackso
n
Sun Vall
ey
Tellurid
e-20.00%
0.00%
20.00%
40.00%
60.00%
80.00%
100.00%
9.7% 9.6%
89.0%
17.1% 10.8%
-1.5%
4.7%
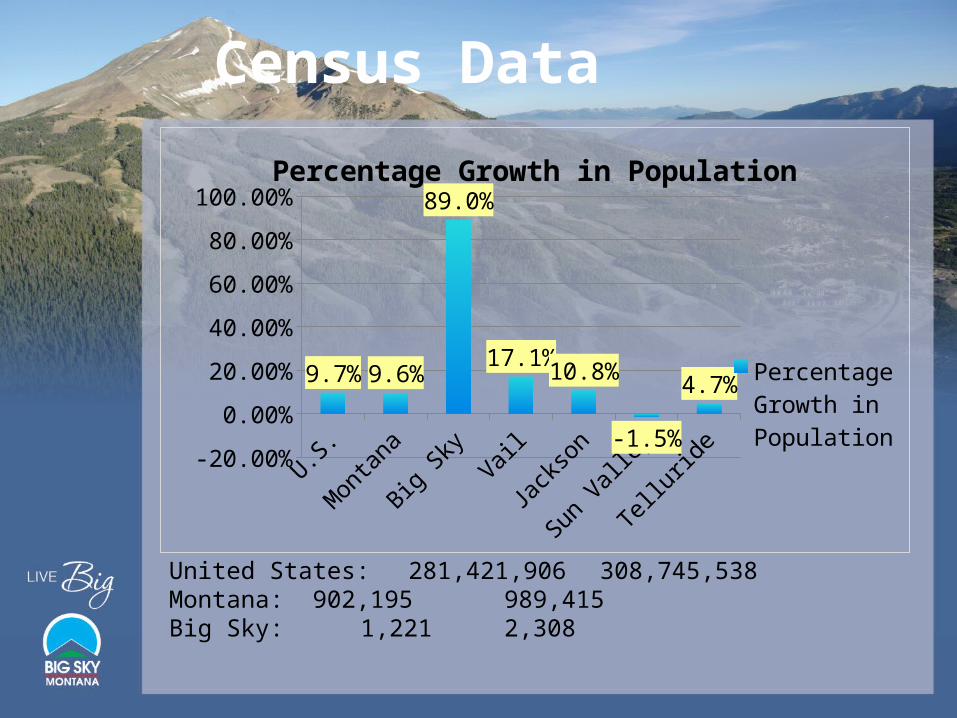
Percentage Growth in Population
Percentage Growth in Population
United States: 281,421,906 308,745,538Montana: 902,195 989,415Big Sky: 1,221 2,308
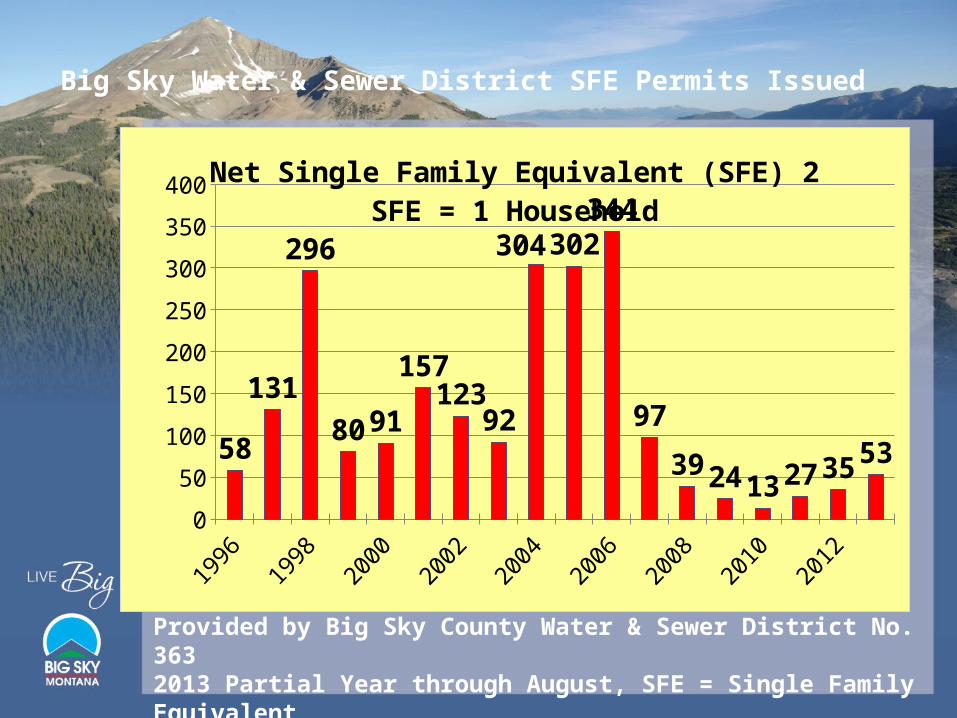
Big Sky Water & Sewer District SFE Permits Issued
199619971998199920002001200220032004200520062007200820092010201120122013
0
50
100
150
200
250
300
350
400
58
131
296
80 91
157123
92
304 302344
97
39 24 13 27 35 53
Net Single Family Equivalent (SFE) 2 SFE = 1 Household
Provided by Big Sky County Water & Sewer District No. 3632013 Partial Year through August, SFE = Single Family EquivalentAverage Household in Big Sky is 2 SFE’s
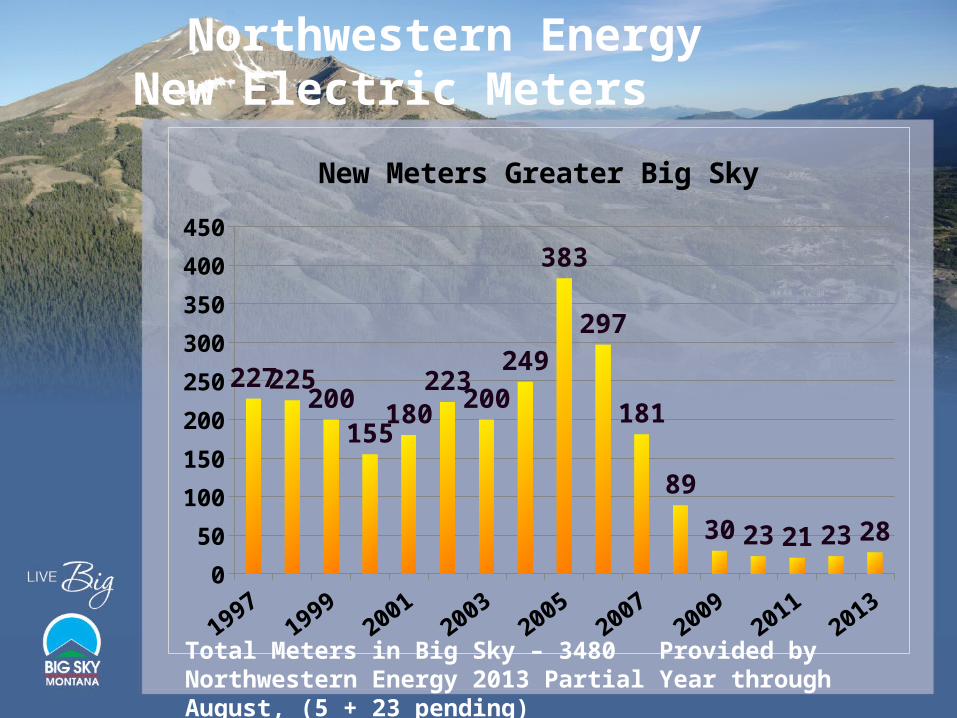
Northwestern Energy New Electric Meters
19971999
20012003
20052007
20092011
20130
50
100
150
200
250
300
350
400
450
227225200
155180
223200
249
383
297
181
89
30 23 21 23 28
New Meters Greater Big Sky
Total Meters in Big Sky – 3480 Provided by Northwestern Energy 2013 Partial Year through August, (5 + 23 pending)
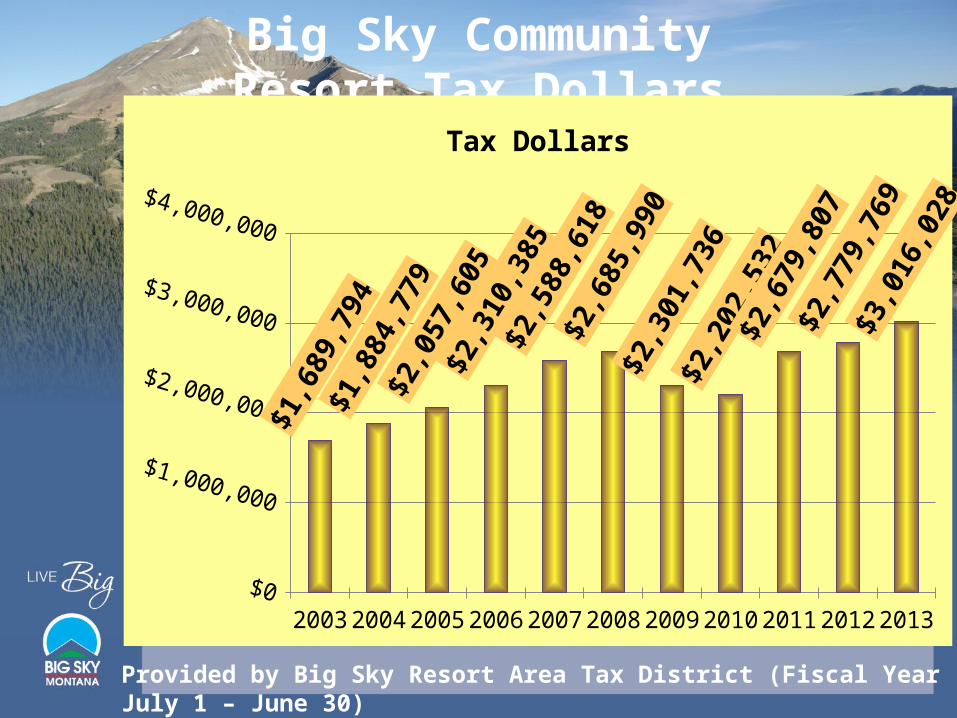
Big Sky CommunityResort Tax Dollars
2003 2004 2005 2006 2007 2008 2009 2010 2011 2012 2013$0
$500,000
$1,000,000
$1,500,000
$2,000,000
$2,500,000
$3,000,000
$3,500,000
$1,6
89,7
94$1
,884
,779
$2,0
57,6
05$2
,310
,385
$2,5
88,6
18$2
,685
,990
$2,3
01,7
36$2
,202
,532
$2,6
79,8
07$2
,779
,769
$3,0
16,0
28
Tax Dollars
Provided by Big Sky Resort Area Tax District (Fiscal Year July 1 – June 30)
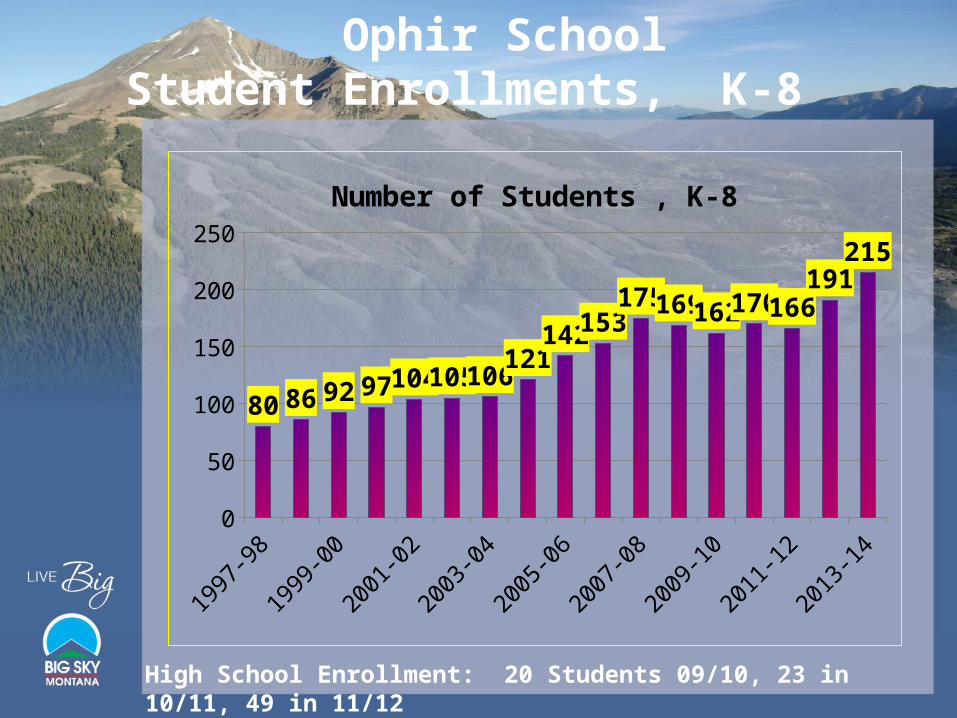
Ophir School Student Enrollments, K-8
1997-98
1998-99
1999-00
2000-01
2001-02
2002-03
2003-04
2004-05
2005-06
2006-07
2007-08
2008-09
2009-10
2010-11
2011-12
2012-13
2013-140
50
100
150
200
250
80 86 92 97 104105106121
142153175169162170166
191215
Number of Students , K-8
High School Enrollment: 20 Students 09/10, 23 in 10/11, 49 in 11/12

Big Sky School DistrictK-4, 5 – 8, LPHS & Total
2008-09 2009-10 2010-11 2011-12 2012-13 2013-140
50
100
150
200
250
300
176 178164
200216
273
Students by Age GroupK-4, 5-8, LPHS & Total
High School Enrollment: 20 Students 09/10, 23 in 10/11, 49 in 11/12

Big Sky Resort Number of Employees
20002001
20022003
20042005
20062007
20082009
20102011
20122013
500
600
700
800
900
1000
1100
688
815782 787 799
874 889927
1027982
886
964 9801016
Employees
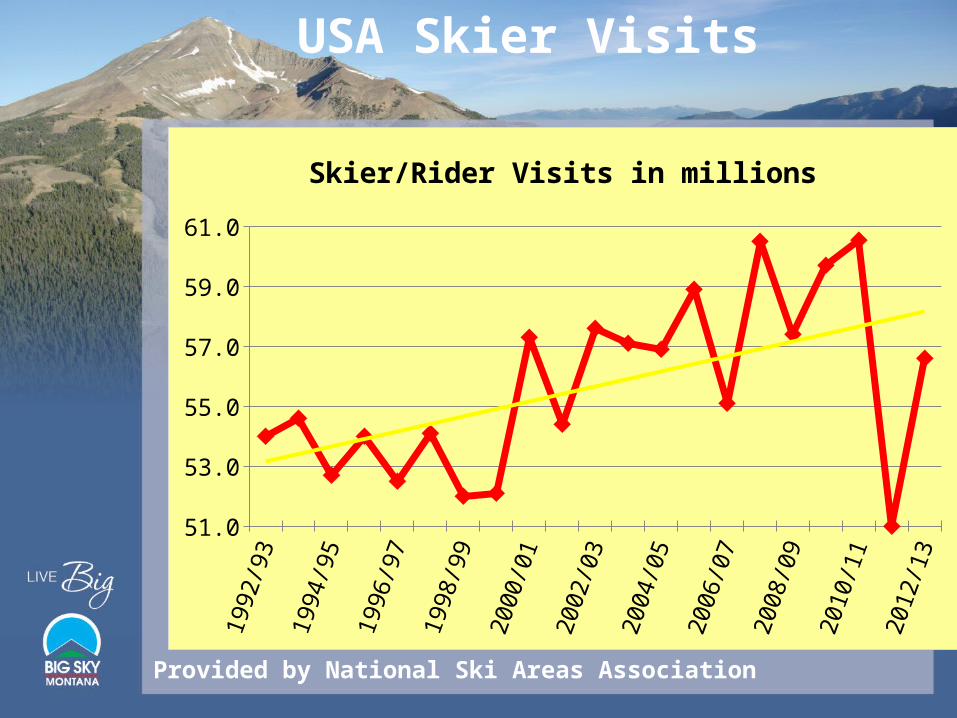
USA Skier Visits
1992
/93
1993
/94
1994
/95
1995
/96
1996
/97
1997
/98
1998
/99
1999
/00
2000
/01
2001
/02
2002
/03
2003
/04
2004
/05
2005
/06
2006
/07
2007
/08
2008
/09
2009
/10
2010
/11
2011
/12
2012
/13
51.052.053.054.055.056.057.058.059.060.061.0
Skier/Rider Visits in millions
Provided by National Ski Areas Association
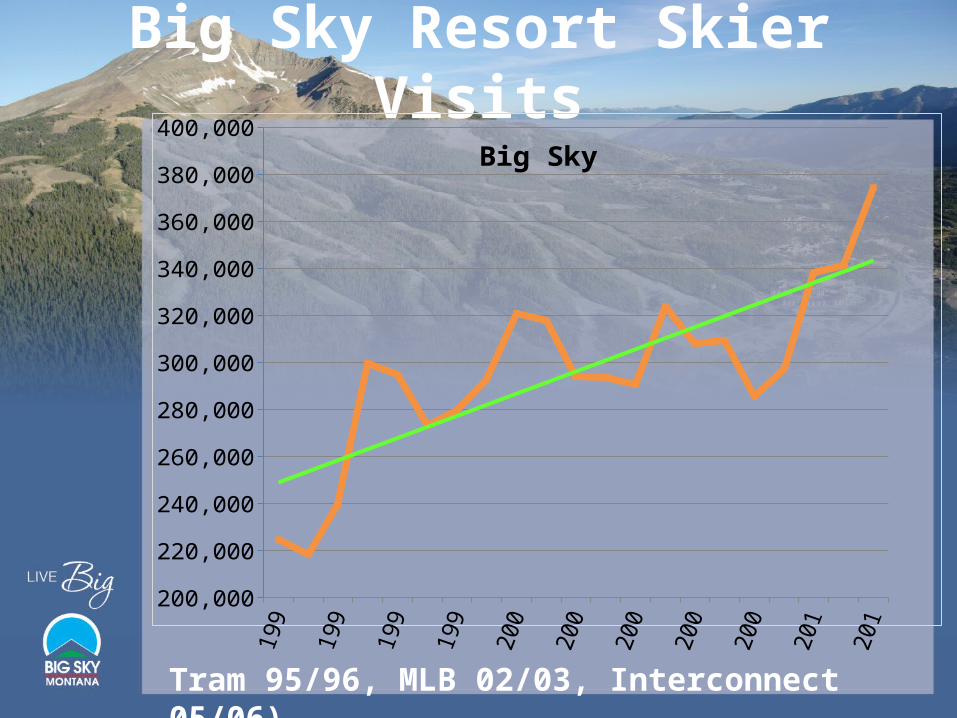
Big Sky Resort Skier Visits
200,000
220,000
240,000
260,000
280,000
300,000
320,000
340,000
360,000
380,000
400,000Big Sky
Tram 95/96, MLB 02/03, Interconnect 05/06)
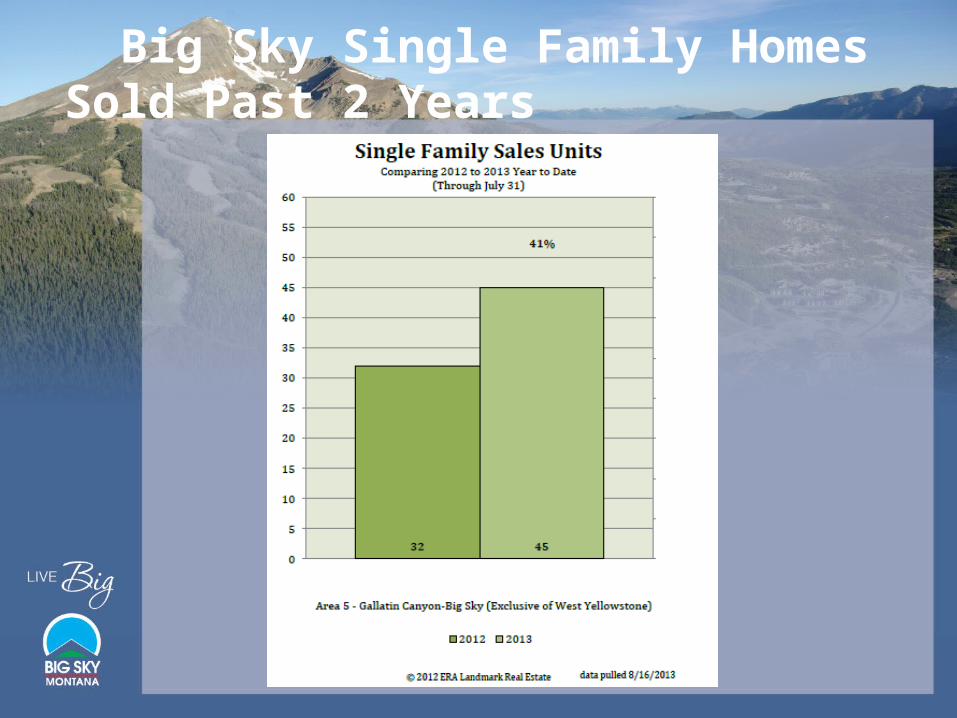
Big Sky Single Family Homes Sold Past 2 Years
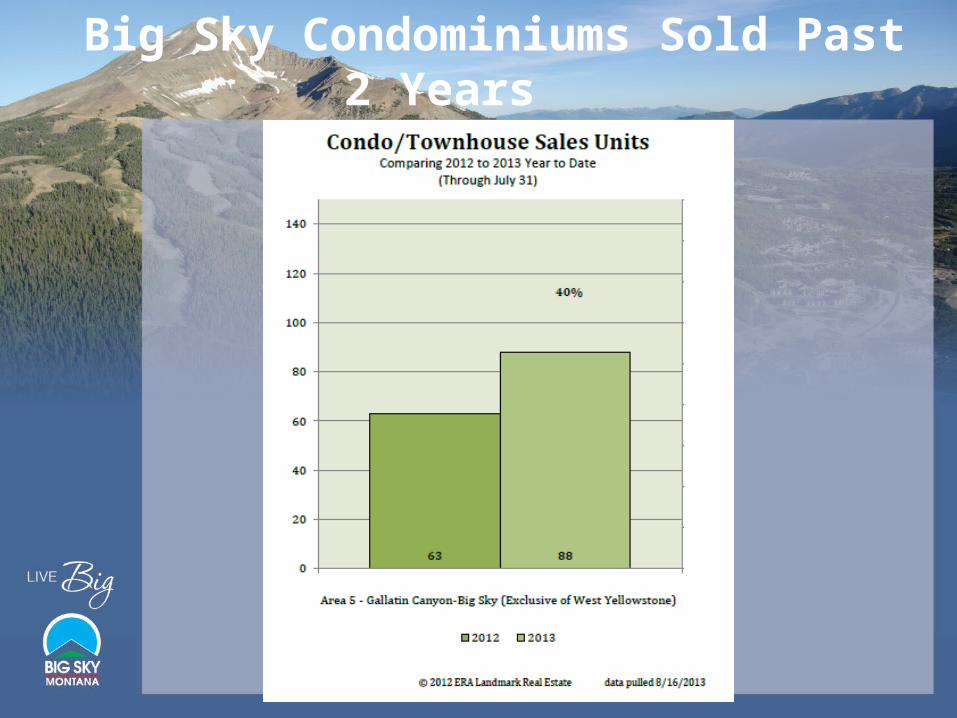
Big Sky Condominiums Sold Past 2 Years
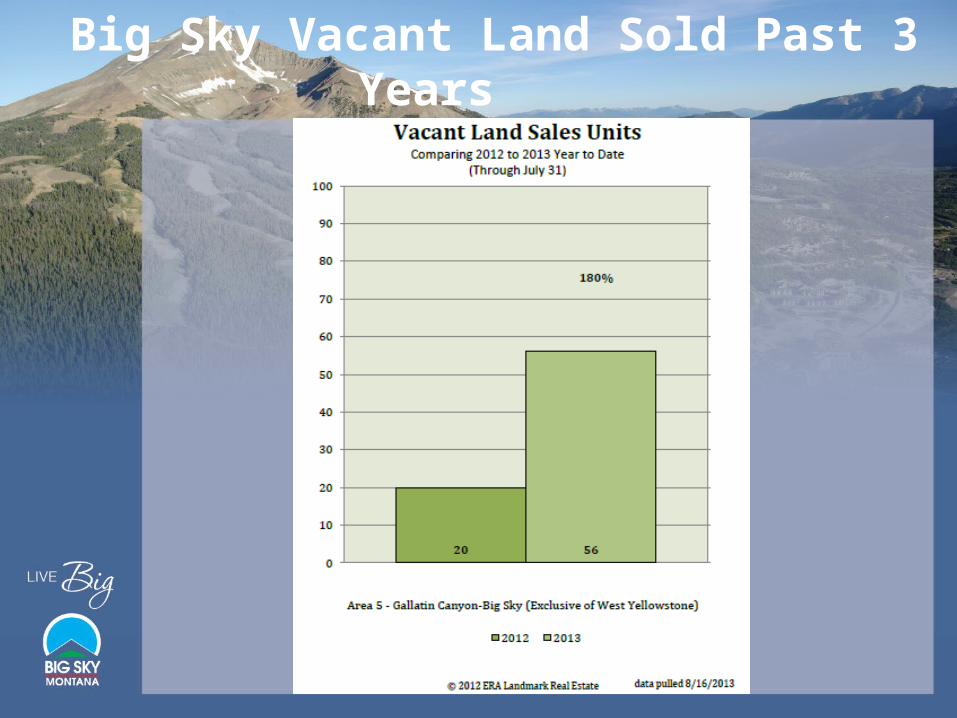
Big Sky Vacant Land Sold Past 3 Years
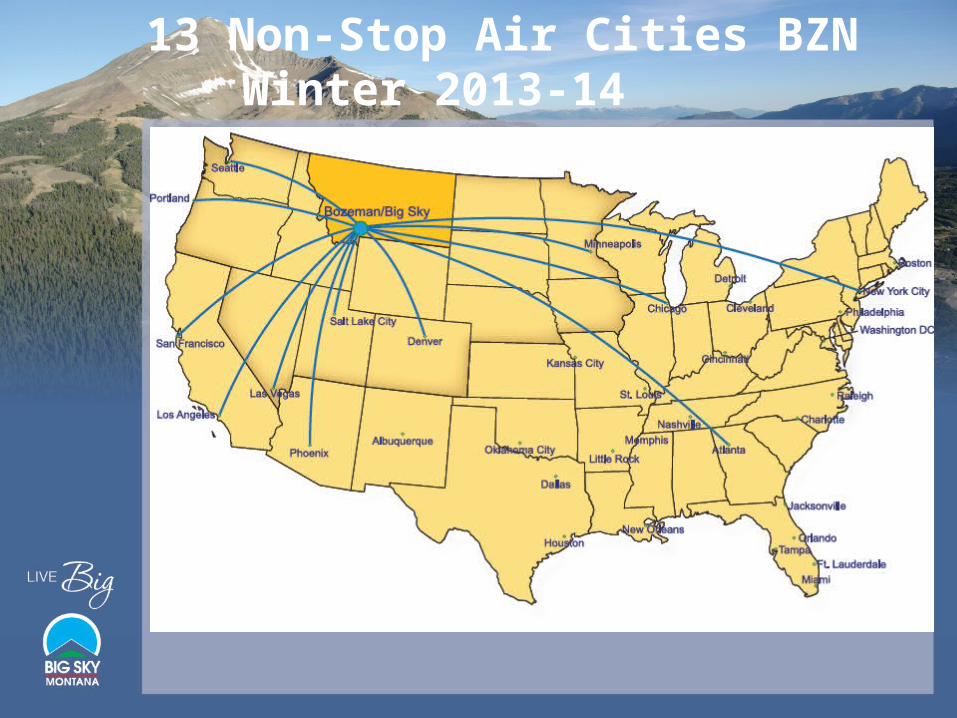
13 Non-Stop Air Cities BZN Winter 2013-14
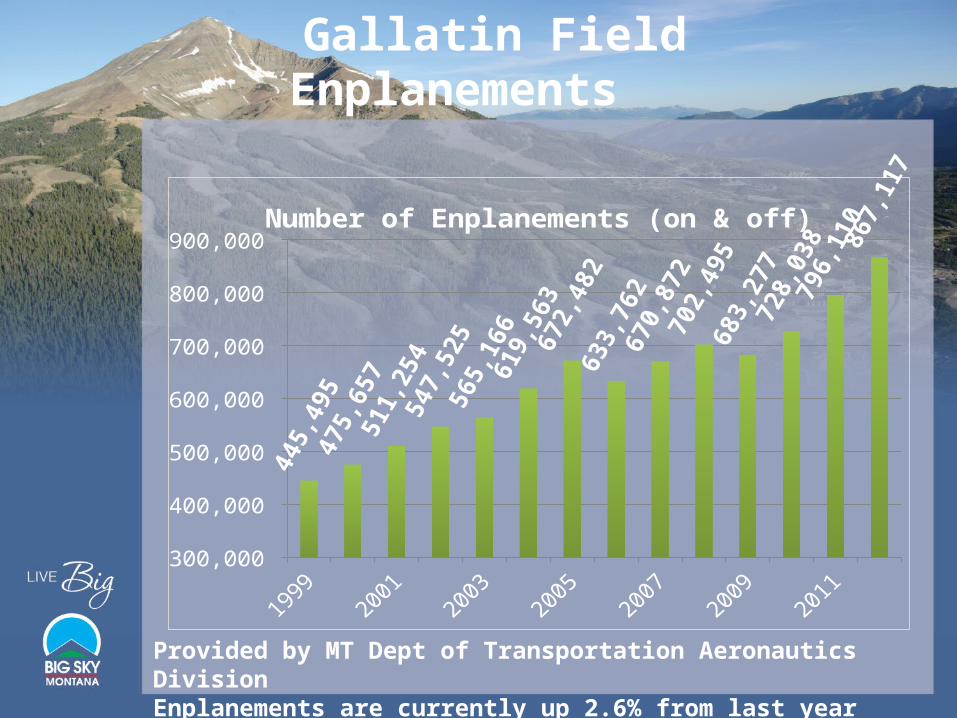
Gallatin Field Enplanements
300,000
400,000
500,000
600,000
700,000
800,000
900,000 Number of Enplanements (on & off)
Provided by MT Dept of Transportation Aeronautics DivisionEnplanements are currently up 2.6% from last year through July ‘13
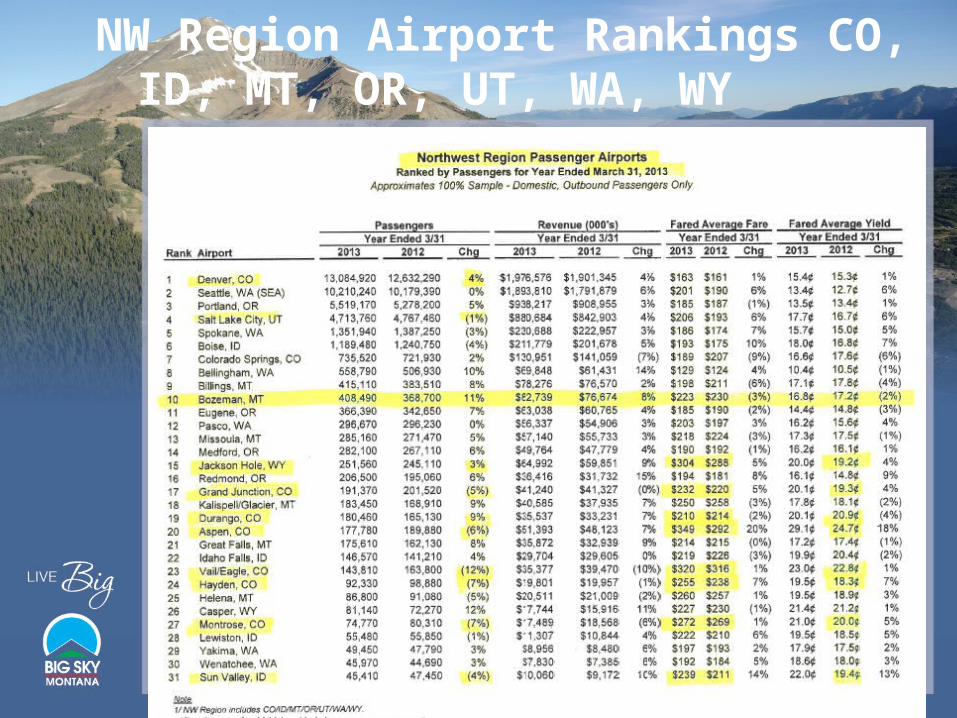
NW Region Airport Rankings CO, ID, MT, OR, UT, WA, WY

Mountain Counties Among the Tops in U.S for Longevity Longevity (in years): Men 1) Fairfax County, VA 81.672) Gunnison, CO (Crested Butte) 81.653) Pitkin, CO (Aspen 81.654) Montgomery, MD 81.575) Marin, CA 81.446) Douglas, CO 81.417) Eagle, CO (Vail) 81.018) Loudon, VA 819) Santa Clara, CA 80.9810) Teton, WY (Jackson) 80.93
Longevity (in years): Women1) Marin, CA 85.02 2) Montgomery, MD 84.873) Collier, FL 84.624) Santa Clara, CA 84.545) Fairfax County, VA 84.526) San Francisco, CA 84.387) Gunnison, CO 84.338) Pitkin, CO 84.339) San Mateo, CA 84.310) Bergen, NJ 84.26
Average longevity in Gallatin County is 3.9 years longer than national average.
-University of Washington, Institute of Health Metrics.
Mountain Town News, 8.1.13
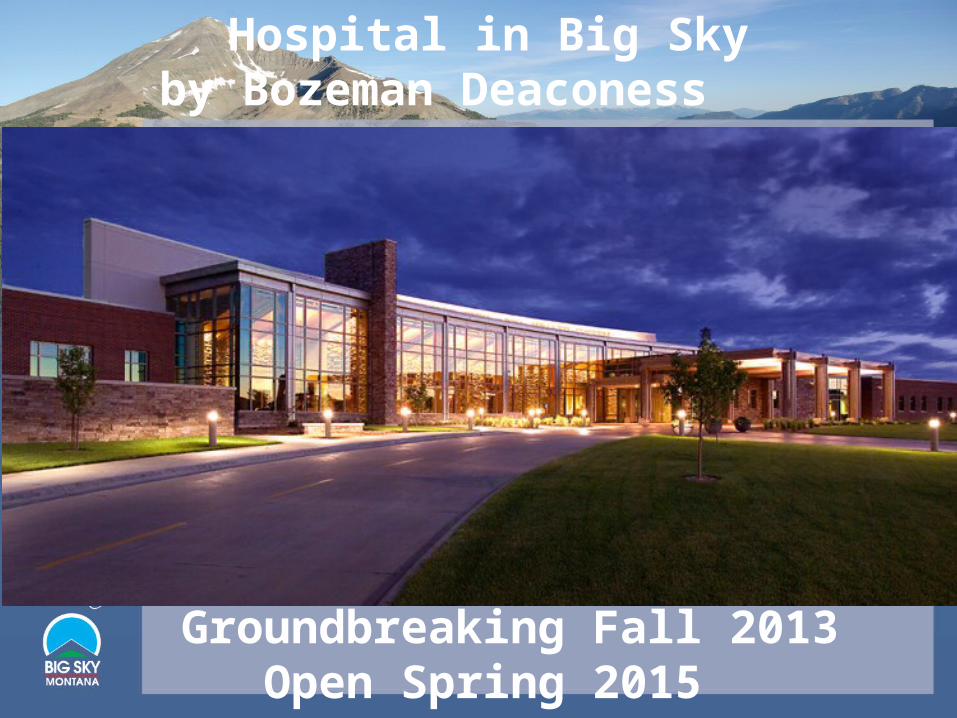
Hospital in Big Sky by Bozeman Deaconess
Groundbreaking Fall 2013 Open Spring 2015