The Anisotropy of the Mesophyll and CO Capture Sites in...
19
Journal of Experimental Botany, Vol.34,No. 149,pp. 1676-1694, December 1983 The Anisotropy of the Mesophyll and CO 2 Capture Sites in Viciafaba L. Leaves at Low Light Intensities AYODEJI JEJE 1 AND MARTIN ZIMMERMANN Harvard University, Cabot Foundation, Petersham, Massachusetts 01366, U.S.A. Received 16 June 1983 ABSTRACT Experiments are reported on the spatial distributions of isotopic carbon within the mesophyll of detached leaves of the C 3 plant Viciafaba L. fed I4 CO 2 at different light intensities. Each leaf was isolated in a cuvette and ten artificial stomata provided spatial continuity between the ambient atmosphere (0-03-0-05% v/v CO 2 ) and the mesophyll from the abaxial leaf side. Paradermal leaf layers exhibited spatial profiles of radioactivity which varied with the intensity of incident light in 2 min exposures. At low light, when biochemical kinetics should limit CO 2 uptake, sections through palisade cells contained most radioactivity. As the light intensity was increased to approximately 20% of full sunlight, peak radioactivity was observed in the spongy cells near the geometric mid-plane of the mesophyll. The results indicate that diffusion of carbon dioxide within the mesophyll regulated the relative photosynthetic activity of the palisade and spongy cells at incident photosynthetically active light intensities as little as 110 /iE m~ 2 s~' when CO 2 entered only through the lower leaf surface. Key words: CO 2 capture sites; Viciafaba L.; Artificial stomata. INTRODUCTION The mesophyll of the leaves of many higher plants is structurally anisotropic and often differentiated into distinct palisade and spongy layers (Esau, 1965). Stomata in the epidermal cell layers permit the access of ambient gases into the mesophyll and the outward movement of water vapour and oxygen. The stomata may be more numerous in, or even restricted to, the lower epidermis (Meidner and Mansfield, 1968). Palisade cells, densely packed with chloroplasts, are normally found next to the upper epidermis and are therefore better illuminated than spongy cells. The palisade cells are usually packed close together with only narrow intercellular spaces through which CO 2 can diffuse for the full length of the cells to be involved with CO 2 uptake. For hypostomatous leaves, the palisade layer is also further from the inlet of CO 2 than the spongy layer. Because leaves are thin, normal diffusion of gases from the air should lead to small concentration gradients in the mesophyll. Therefore, the functional significance of the cellular arrangement in the mesophyll has, generally, been neglected. This study shows that under some conditions mesophyll structure may limit photosynthesis because of the low concentrations (~0-03% v/v) of CO 2 in ambient air. The basic issues The transport of CO 2 from air to the chloroplasts is probably by passive diffusion in consecutive and different domains (Nobel, 1974). Typically, the pathway traversed by CO 2 1 Permanent address: University of Calgary, Calgary, Alberta, Canada T2N 1N4. at Harvard University on May 1, 2012 http://jxb.oxfordjournals.org/ Downloaded from
Transcript of The Anisotropy of the Mesophyll and CO Capture Sites in...
Journal of Experimental Botany, Vol.34,No. 149,pp. 1676-1694, December 1983
The Anisotropy of the Mesophyll and CO2 Capture Sites
in Viciafaba L. Leaves at Low Light Intensities
AYODEJI JEJE1 AND MARTIN ZIMMERMANN
Harvard University, Cabot Foundation, Petersham, Massachusetts 01366, U.S.A.
Received 16 June 1983
A B S T R A C TExperiments are reported on the spatial distributions of isotopic carbon within the mesophyll ofdetached leaves of the C3 plant Viciafaba L. fed I4CO2 at different light intensities. Each leaf wasisolated in a cuvette and ten artificial stomata provided spatial continuity between the ambientatmosphere (0-03-0-05% v/v CO2) and the mesophyll from the abaxial leaf side. Paradermal leaflayers exhibited spatial profiles of radioactivity which varied with the intensity of incident light in 2 minexposures. At low light, when biochemical kinetics should limit CO2 uptake, sections through palisadecells contained most radioactivity. As the light intensity was increased to approximately 20% of fullsunlight, peak radioactivity was observed in the spongy cells near the geometric mid-plane of themesophyll. The results indicate that diffusion of carbon dioxide within the mesophyll regulated therelative photosynthetic activity of the palisade and spongy cells at incident photosynthetically activelight intensities as little as 110 /iE m~2 s~' when CO2 entered only through the lower leaf surface.
Key words: CO2 capture sites; Viciafaba L.; Artificial stomata.
I N T R O D U C T I O NThe mesophyll of the leaves of many higher plants is structurally anisotropic and oftendifferentiated into distinct palisade and spongy layers (Esau, 1965). Stomata in the epidermalcell layers permit the access of ambient gases into the mesophyll and the outward movementof water vapour and oxygen. The stomata may be more numerous in, or even restricted to, thelower epidermis (Meidner and Mansfield, 1968). Palisade cells, densely packed withchloroplasts, are normally found next to the upper epidermis and are therefore betterilluminated than spongy cells. The palisade cells are usually packed close together with onlynarrow intercellular spaces through which CO2 can diffuse for the full length of the cells to beinvolved with CO2 uptake. For hypostomatous leaves, the palisade layer is also further fromthe inlet of CO2 than the spongy layer. Because leaves are thin, normal diffusion of gasesfrom the air should lead to small concentration gradients in the mesophyll. Therefore, thefunctional significance of the cellular arrangement in the mesophyll has, generally, beenneglected. This study shows that under some conditions mesophyll structure may limitphotosynthesis because of the low concentrations (~0-03% v/v) of CO2 in ambient air.
The basic issuesThe transport of CO2 from air to the chloroplasts is probably by passive diffusion in
consecutive and different domains (Nobel, 1974). Typically, the pathway traversed by CO21 Permanent address: University of Calgary, Calgary, Alberta, Canada T2N 1N4.
at Harvard U
niversity on May 1, 2012
http://jxb.oxfordjournals.org/D
ownloaded from
Jeje and Zimmermann—Spatial Distribution oflsotopic Carbon 1677
consists of the following: a stagnant air layer apposed to the external surfaces of leaves, oftencalled the boundary layer, stagnant gas within stomata pores (Jarman, 1974), a mesophyllintercellular space, and 'liquid' phase comprised of moist mesophyll cell walls, cellularcytoplasm, the membranes and the chloroplast stroma. The resistances contributed, in series,by each domain are frequently deduced from experimental data for transpiration and CO2
assimilation rates. This approach may be adequate for describing the drying of a porous bedwith the diffusing species generated within narrow planar zones. For the leaf, there areimportant but subtle differences.
In the mesophyll intercellular space, some CO2 is continuously withdrawn as the bulkdiffuses inwards. The diffusion resistance for the domain should, therefore, not be lumped intoa constant parameter. A concentration gradient for CO2 must be established within the gasspace, and no matter how small, this gradient is present when the rate of photosynthesisexceeds that of respiration. The population and physical dimensions of the stomata, whilephotosynthesis takes place, would partly determine the CO2 concentration profiles in theintercellular space. The net photosynthetic efficiency of cells may depend on the profilesachieved at different light intensities. Approximately five times the normal concentration ofCO2 in ambient air has been reported optimal for photosynthesis in higher terrestrial plants(Stalfelt, 1960). This indicates that leaves normally function below capacity as a result of CO2
deficiency.Blackman (1895), Brown and Escombe (1900) and Chapman and Loomis (1953), amongst
others, studied how CO2 concentrations external to the leaf affect leaf photosynthetic rates.Various qualitative and empirical schemes have been proposed to relate the rates to theconductance of the diffusion pathways and CO2 concentration differences (Verduin, 1949;Heath, 1969; Jarvis, 1971). Cowan and Farquhar (1977), Schulze and Hall (1982) and othersin recent studies evaluated the lumped conductance exhibited by leaves by the technique ofvariational calculus. From the mechanistic perspective, the epidermal layers are porouspartitions between two gas diffusion domains and diffusion through the partitions shoulddepend on the stomata population densities (Hall, 1982) and transient changes in stomatalapertures. Apart from diffusion resistances, the rates of biochemical reactions in thechloroplasts may limit the rapidity of CO2 uptake. These reactions are regulated by light asrelated to the activity of chloroplasts, and other cellular factors (enzyme activities, theconcentrations of ions and intermediate compounds involved in the fixation cycles) (Lilleyand Walker, 1975). Even the accumulation of products has been reported to inhibitphotosynthesis (Moss, 1962). The net CO2 transport could, under certain conditions, beenhanced by CO2-bicarbonate ion transformations catalyzed by carbonic anhydrase in thecytoplasm (Nielsen, 1960).
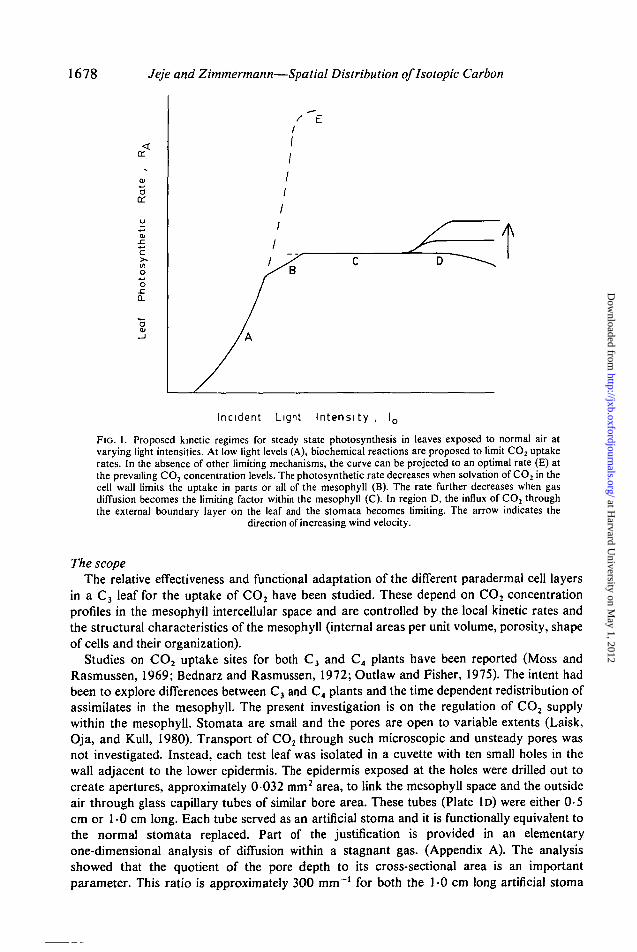
For endothermic chemical reactions catalyzed at solid surfaces (Satterfield, 1970), it hasbeen established that, as the temperature is increased, either kinetics of transformation or thediffusion of the reacting species to the catalytic surfaces may control the overall rate. It issuggested that the net rates of CO2 assimilation by higher leaves is controlled similarly aslight intensity is changed. The proposed kinetic regimes are illustrated in Fig. 1. At low lightintensities (region A), biochemical reactions in the chloroplast stroma and cell cytoplasmshould limit CO2 uptake rates. As the light intensity is increased, the solvation and diffusionof CO2 in the 'liquids' (moist cell walls, cytoplasm and stroma) may become limiting (regionB). This resistance, however, has not been proven significant and is probably less importantthan kinetic limitations (von Caemmerer and Farquhar, 1981). At still higher light levels, thediffusion of gases in the mesophyll intercellular spaces and the stomata should becomelimiting (region C). Finally, for further increases in light intensity, the supply of CO2 from theambient to the external leaf surface would become limiting. The different curves in region Dreflect convective boundary conditions external to the leaf.
at Harvard U
niversity on May 1, 2012
http://jxb.oxfordjournals.org/D
ownloaded from
1678 Jeje and Zimmermann—Spatial Distribution oflsotopic Carbon
aen
1/1ooa.
Incident Light In tens i t y , l o
FIG. 1. Proposed kinetic regimes for steady state photosynthesis in leaves exposed to normal air atvarying light intensities. At low light levels (A), biochemical reactions are proposed to limit CO2 uptakerates. In the absence of other limiting mechanisms, the curve can be projected to an optimal rate (E) atthe prevailing CO, concentration levels. The photosynthetic rate decreases when solvation of CO2 in thecell wall limits the uptake in parts or all of the mesophyll (B). The rate further decreases when gasdiffusion becomes the limiting factor within the mesophyll (C). In region D, the influx of CO2 throughthe external boundary layer on the leaf and the stomata becomes limiting. The arrow indicates the
direction of increasing wind velocity.
The scopeThe relative effectiveness and functional adaptation of the different paradermal cell layers
in a C3 leaf for the uptake of CO2 have been studied. These depend on CO2 concentrationprofiles in the mesophyll intercellular space and are controlled by the local kinetic rates andthe structural characteristics of the mesophyll (internal areas per unit volume, porosity, shapeof cells and their organization).
Studies on CO2 uptake sites for both C3 and C4 plants have been reported (Moss andRasmussen, 1969; Bednarz and Rasmussen, 1972; Outlaw and Fisher, 1975). The intent hadbeen to explore differences between C3 and C4 plants and the time dependent redistribution ofassimilates in the mesophyll. The present investigation is on the regulation of CO2 supplywithin the mesophyll. Stomata are small and the pores are open to variable extents (Laisk,Oja, and Kull, 1980). Transport of CO2 through such microscopic and unsteady pores wasnot investigated. Instead, each test leaf was isolated in a cuvette with ten small holes in thewall adjacent to the lower epidermis. The epidermis exposed at the holes were drilled out tocreate apertures, approximately 0032 mm2 area, to link the mesophyll space and the outsideair through glass capillary tubes of similar bore area. These tubes (Plate ID) were either 0-5cm or 1 -0 cm long. Each tube served as an artificial stoma and it is functionally equivalent tothe normal stomata replaced. Part of the justification is provided in an elementaryone-dimensional analysis of diffusion within a stagnant gas. (Appendix A). The analysisshowed that the quotient of the pore depth to its cross-sectional area is an importantparameter. This ratio is approximately 300 mm"1 for both the 1 -0 cm long artificial stoma
at Harvard U
niversity on May 1, 2012
http://jxb.oxfordjournals.org/D
ownloaded from

Jeje and Zimmermann—Spatial Distribution oflsotopic Carbon 1679
and a normal fully open leaf stoma. One artificial stoma also has the same volume of themesophyll under its immediate influence as would the stomata it replaces.
The combined pore areas for all stomata (in the lower epidermis) of the leaf area sampledfor analysis and fed CO2 through an artificial stoma were between 0-03 mm2 and 0-035 mm2.Within statistical error, the pore of the artificial stoma encompassed a single stoma on theleaf (Plate lc) since stomatal density on the lower epidermis was 26-38 per mm2 area.Evaporative stresses which could modify the photosynthetic activities of the leaf cells wereconsequently considered unimportant. An advantage to having only ten widely-spacedartificial stomata is that transitions between different rate limiting processes for the uptake ofCO2 is more obviously displayed. Parts of the leaf not near the artificial stomata wouldaccumulate radioactivity to reflect CO2 diffusion anisotropy in the mesophyll structures andalso, the interaction of concentration fields as suggested for normal stomata (Heath, 1969)would be reduced or eliminated.
M A T E R I A L S AND M E T H O D SYoung leaves of 8 week old broad beans, Viciafaba L., 70-90% expanded and grown at 20 °C underfluorescent light (16 h light at approximately 300//E m~2 s"1 daily) in the greenhouse were used. Fullymature leaves were up to 400 jum thick with relatively thin epidermal layers (c. 25-30 //m), palisade
PLATE 1. The cross-section and abaxial surface views of Viciafaba. L. leaves, A and B. Cross-sectionsof leaf segments. The size of the vascular bundles with the xylem vessels on the adaxial side is typical forthe portions of the leaf which excludes the mid-rib and major veins. Chloroplasts, the bright spots withinthe cells, are absent in the epidermal layers (xl75). c. Abaxial surface view of a leaf with thechlorophyll removed. The distribution of the stomata and some vessel ends are shown. The hole drilledin the epidermis in a test leaf would have a diameter approximately equal to 90% of the smallerdimension of the picture (x 175). D. A view of the lower surface of the cuvette enclosing a leaf and thetransfer capillary tubes inserted into guide tubes (x 2). The transfer tubes touch the lower leaf epidermis.
at Harvard U
niversity on May 1, 2012
http://jxb.oxfordjournals.org/D
ownloaded from

1680 Jeje and Zimmermann—Spatial Distribution oflsotopic Carbon
layers of approximately half the thickness of the spongy layers (Plate 1A, B), and with approximatelyequal numbers of stoma on upper and lower epidermal layers. Young leaves importing assimilates butphotosynthetically active (Lurie, Pax, Struch, and Bravdo, 1979) were employed.
Leaves were harvested with the petiole under tap water and kept in the dark (with petiole immersed)usually for more than 12 h but less than 48 h to ensure the depletion of stored starch. After 3 d, theleaves sometimes exhibit a diminution of photosynthetic activity and may become limp althoughpigmentation levels appear unchanged even for a longer period. Sometimes, leaves were harvested andused shortly after the entire plant had been in the dark for 8-12 h. No starch was detected in suchleaves. It wcs initially considered desirable to feed leaves 2-5 mM sucrose solutions to inhibit therelease of sucrose from cell cytoplasm with the apoplast (Kursanov and Brovchenko, 1970) and toclose normal stomata by spraying leaves with 0-001 M abscisic acid (ABA) solutions with 0-01%Tween 80. These procedures were abandoned since they did not prove particularly effective.
The cuvette, 7 0 cm long by 4-5 cm wide by 0-53 cm thick, consisted of a glass slide, a 0-25 cmthick acrylic plate and a rectangular spacer. Ten 1 • 1 mm o.d. guide tubes were sealed into the acrylicplate in a staggered arrangement as in Plate ID. 10 cm or 0-5 cm long transfer capillary tubes, 0-65mm o.d. and 197-4 //m i.d., were inserted into the guide tubes to touch the lower epidermis of theenclosed leaf and held in position with vacuum grease in the annulus. Holes were drilled in the lowerepidermis with a 150 fim diameter platinum wire which protruded no more than 50 urn out of acapillary tube of the same diameter as the transfer tube before the latter was inserted. This 'drill' was
FIG. 2. The temperature controlled chamber with the cuvette (C) in position. The light from the lamp(L) passed through a liquid filter and an infrared absorbing glass (G) before reaching the cuvette. Thetemperature within the chamber was regulated by four thermoelectric devices (T) cooled on the outsidewith chilled water (W). The air with MCO2 was admitted at (F) and exhausted at (E) at the end of an
experiment.
at Harvard U
niversity on May 1, 2012
http://jxb.oxfordjournals.org/D
ownloaded from
Jeje and Zimmermann—Spatial Distribution oflsotopic Carbon 1681
passed through the guide tube until it touched the lower leaf epidermis and then twisted on its axis a fewtimes for the wire only to puncture the epidermis. The resulting holes were away from major veins.Minor vascular bundles (Plate 1A and B) were usually within the area subtended by the holes (Platelc). Because punctured epidermal cells retract, the hole diameters were often slightly larger than 200jUm, but because the epidermis was very thin compared to overall diffusion path length, errors wereconsidered insignificant. Five 1-0 cm long transfer tubes were arranged on one side of the leaf mid-riband another five 0-5 cm long tubes on the other side. When stomatal pore resistances are significant,the fluxes of CO2 through these tubes should be different since the exchange of gases between the leafand the environment occurred only through them.
0.16
0.12
>-I—
>
<oQ<
<zo
0.08
0.04 -
0.00
•
0.2 0.6 0.8 1.0
LOWEREPIDERMIS
RELATIVEDISTANCE
UPPEREPIDERMIS
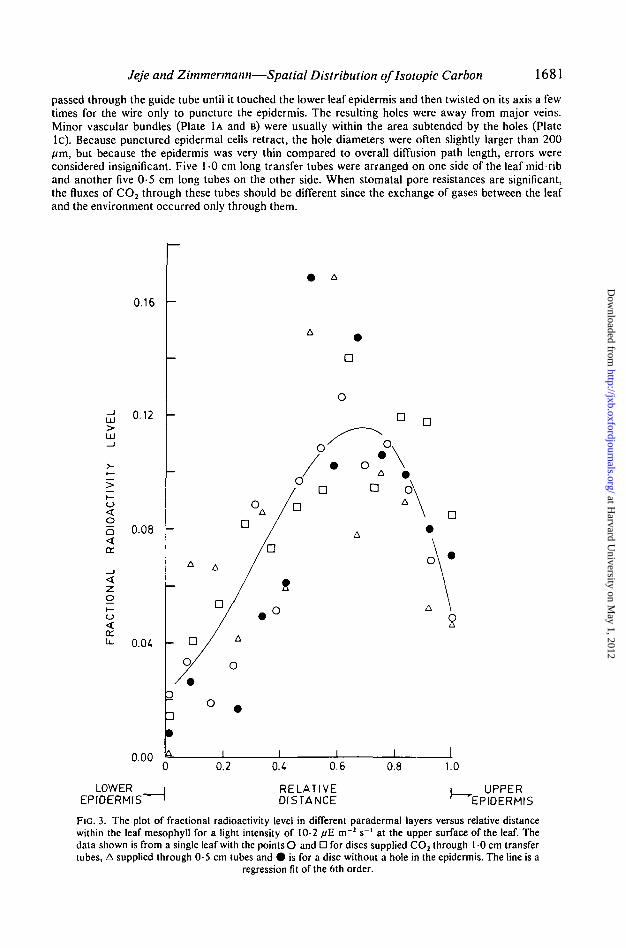
FIG. 3. The plot of fractional radioactivity level in different paradermal layers versus relative distancewithin the leaf mesophyll for a light intensity of 10-2 fiE m"2 s~' at the upper surface of the leaf. Thedata shown is from a single leaf with the points O and D for discs supplied CO2 through 1 0 cm transfertubes, A supplied through 0-5 cm tubes and • is for a disc without a hole in the epidermis. The line is a
regression fit of the 6th order.
at Harvard U
niversity on May 1, 2012
http://jxb.oxfordjournals.org/D
ownloaded from
1682 Jeje and Zimmermann—Spatial Distribution ofhotopic Carbon
The cuvette with a leaf mounted was sealed in a temperature controlled chamber (Fig. 2) at 24 +0-2 °C in the dark. Air saturated with water vapour was passed through the chamber and the systemreached equilibrium in 15-20 min.
The light source was a projection lamp (ELH) regulated by a rheostat. The intensity and spectrum oflight from such a lamp depend on the applied voltage. The light traversed a 3-5 cm absorption cellthrough which chilled 0-01% aqueous acid fuchsin solution circulated. Infra-red component of thelamp emission was thus filtered out by the fluorochrome which also modified the radiation spectrum tobetween 600 nm and 800 nm. The spectral maximum occurred at 650 nm and the photon flux between650 nm and 700 nm was 90% of the total. Photosynthetic efficiency of leaves is maximized at thesewavelengths. Light intensities at the leaf upper epidermis provided between 10 and 420/iE rrr2 s"1. Thehighest light level was therefore about 20% of full sunlight. Since test specimens were grown in 300 //Em~2 s~' light, it was anticipated that the leaves would exhibit photosynthetic capacities similar to shadeleaves.
The test procedureDuring a run, light was turned on for an initial 15 s with conditioned ambient air flow through the
test chamber. The intent was to activate chloroplast enzymes at the prescribed light intensity (van derDeen, 1960). Light was turned off for 2-3 min while radioactive I4CO2, prepared from 1-0 mCi Ba
0.12
LU
LU
<o
oi—u
u.
0.08
0.04
0.00
O
o
0.2
LOWEREPIDERMIS
U 0.6
RELATIVEDISTANCE
0.8 1.0
UPPER'EPIDERMIS
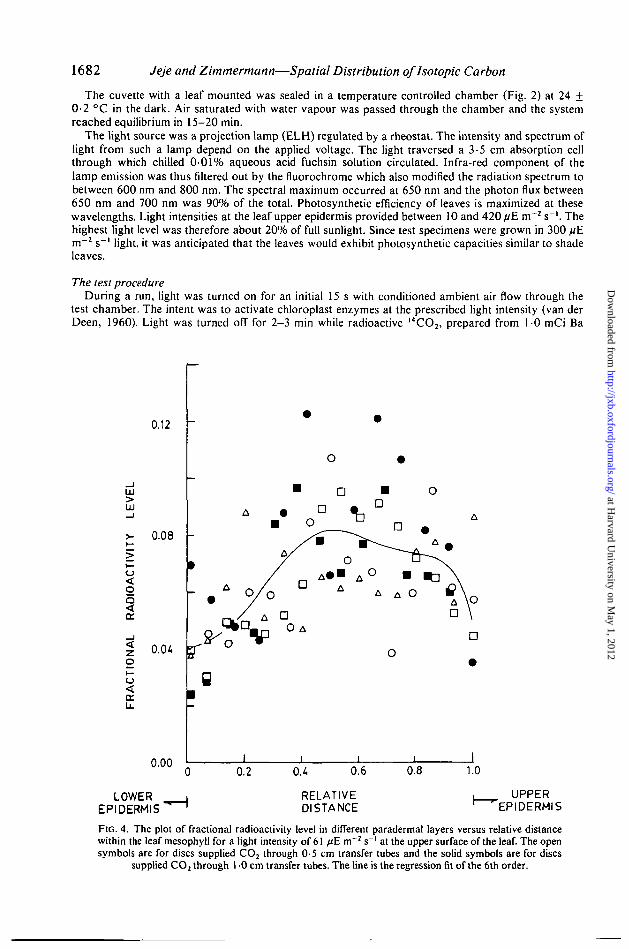
FIG. 4. The plot of fractional radioactivity level in different paradermal layers versus relative distancewithin the leaf mesophyll for a light intensity of 61 //E m~2 s"1 at the upper surface of the leaf. The opensymbols are for discs supplied CO2 through 0-5 cm transfer tubes and the solid symbols are for discs
supplied CO2 through 1 -0 cm transfer tubes. The line is the regression fit of the 6th order.
at Harvard U
niversity on May 1, 2012
http://jxb.oxfordjournals.org/D
ownloaded from
Jeje and Zimmermann—Spatial Distribution oflsotopic Carbon 1683
14CO2 (39-5 mg) and 90% lactic acid and mixed with CO2-free air, was admitted into the chamber. Theleaf was then illuminated for 2 min without gas flow in the chamber while UCO2 was assimilated. Thevolume of the test chamber relative to the cuvette's was large and the reservoir 14CO2 concentrationsshould not change significantly in a run.
After photosynthesis, the leaf was removed from the cuvette and 4-0 mm diameter discs werepunched out around the holes in the epidermis. The discs were gently mounted between 2 glass slides,chilled and kept in liquid nitrogen. 2-2-5 min were required from removing the cuvette from thechamber to freezing the samples. From other areas of the leaves other discs were retrieved andpreserved frozen. Each frozen disc was mounted flat on an ice block in a cryostat-microtome operatedbetween —25 °C and —30 °C and serial paradermal sections (16 /im thick) made. The sections werewashed from the forceps into 4-0 ml vials with 10-15 drops of citrate buffer solution. Between 10 and22 vials contained the sections from each disc.
The polysaccharides in each vial were digested enzymatically with a few drops of 5% w/v cellulasefrom Aspergillus niger augmented with /?-glucosidase (cellobiase) in 10 nM citrate buffer (pH 4-5), anddiastase (4-6 mg per ml) from malt at 35 °C and room temperature, respectively. Each enzyme wasallowed to act for more than 2 h, preferably overnight. After digestion, which was not always complete,a few drops of cellosolve (ethylene glycol monomethyl ether, C3H8O2) was added to each vial asdiluent before the solvent-surfactant-fluor base cocktail (liquid scintillation counting solution) was
012
LJJl
>-I—
>
OQ<tr
<
o
o
a:
0 08
0 00
OO
02
LOWEREPIDERMIS
)U 06
RELATIVEDISTANCE
08 10
UPPER'EPIDERMIS
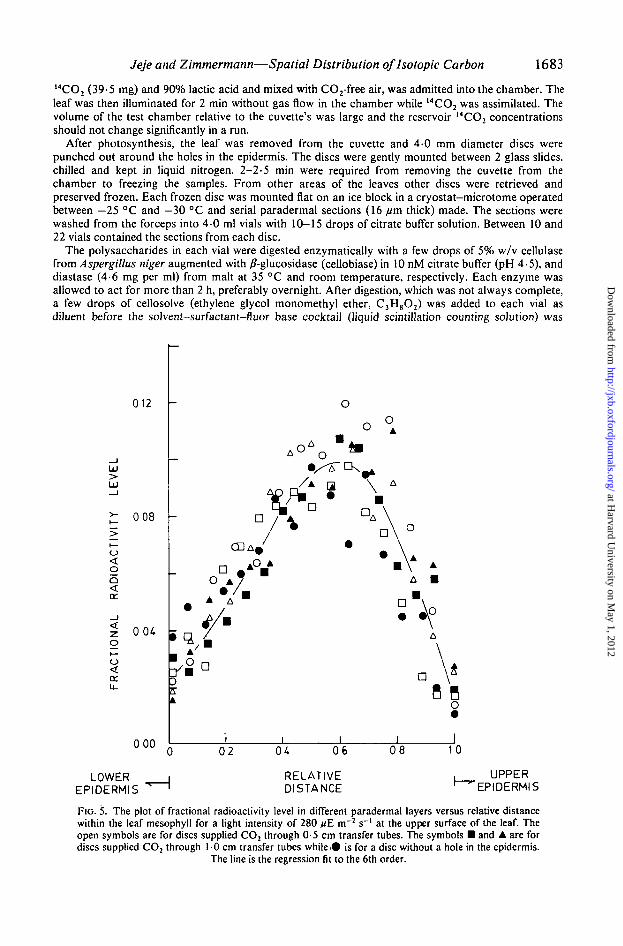
FIG. 5. The plot of fractional radioactivity level in different paradermal layers versus relative distancewithin the leaf mesophyll for a light intensity of 280 fiE m~2 s"1 at the upper surface of the leaf. Theopen symbols are for discs supplied CO2 through 0-5 cm transfer tubes. The symbols • and • are fordiscs supplied CO2 through 1 0 cm transfer tubes while.© is for a disc without a hole in the epidermis.
The line is the regression fit to the 6th order.
at Harvard U
niversity on May 1, 2012
http://jxb.oxfordjournals.org/D
ownloaded from
1684 Jeje and Zimmermann—Spatial Distribution ofhotopic Carbon
added. Radioactivity in each vial was counted on Beckman Scintillation Liquid Counters for a durationof 10 min.
Other fresh leaf specimens were preserved in modified FAA. These were embedded in paraffin and10 /im sections in both paradermal and cross sections were made for detailed analysis of the mesophyllstructures on an image analyzer coupled with a microscope.
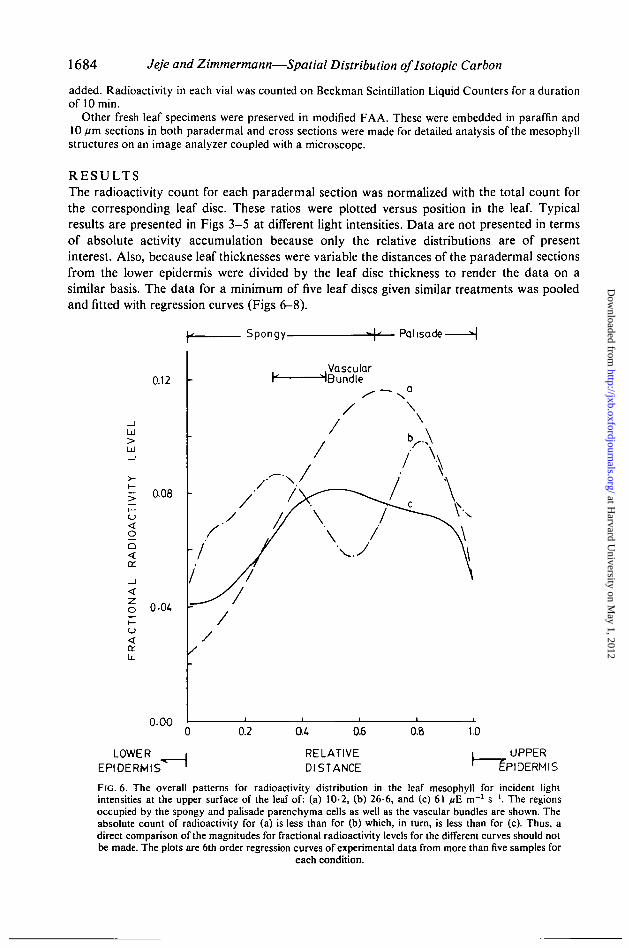
R E S U L T SThe radioactivity count for each paradermal section was normalized with the total count forthe corresponding leaf disc. These ratios were plotted versus position in the leaf. Typicalresults are presented in Figs 3—5 at different light intensities. Data are not presented in termsof absolute activity accumulation because only the relative distributions are of presentinterest. Also, because leaf thicknesses were variable the distances of the paradermal sectionsfrom the lower epidermis were divided by the leaf disc thickness to render the data on asimilar basis. The data for a minimum of five leaf discs given similar treatments was pooledand fitted with regression curves (Figs 6-8).
Spongy-
0.12
>l±J
> 0.08
oQ<cr
5 0-04t—o
or
0-00
LOWEREPIDERMIS
.VascularH HBundle
Palisade -
0.2 0.4 0.6 0.B 1.0
RELATIVEDISTANCE
I UPPER1 EPIDERMIS
FIG. 6. The overall patterns for radioactivity distribution in the leaf mesophyll for incident lightintensities at the upper surface of the leaf of: (a) 10-2, (b) 26-6, and (c) 61 pE m~2 s"1. The regionsoccupied by the spongy and palisade parenchyma cells as well as the vascular bundles are shown. Theabsolute count of radioactivity for (a) is less than for (b) which, in turn, is less than for (c). Thus, adirect comparison of the magnitudes for fractional radioactivity levels for the different curves should notbe made. The plots are 6th order regression curves of experimental data from more than five samples for
each condition.
at Harvard U
niversity on May 1, 2012
http://jxb.oxfordjournals.org/D
ownloaded from
Jeje and Zimmermann—Spatial Distribution oflsotopic Carbon
[* Spongy •+« Palisade-
VascularBundle
1685
0 08
0 04
<oQ
zo
u.
0 00
LOWEREPIDERMIS""
0.2 0.4 0.6 0.8 1.0
RELATIVEDISTANCE
UPPEREPIDERMIS
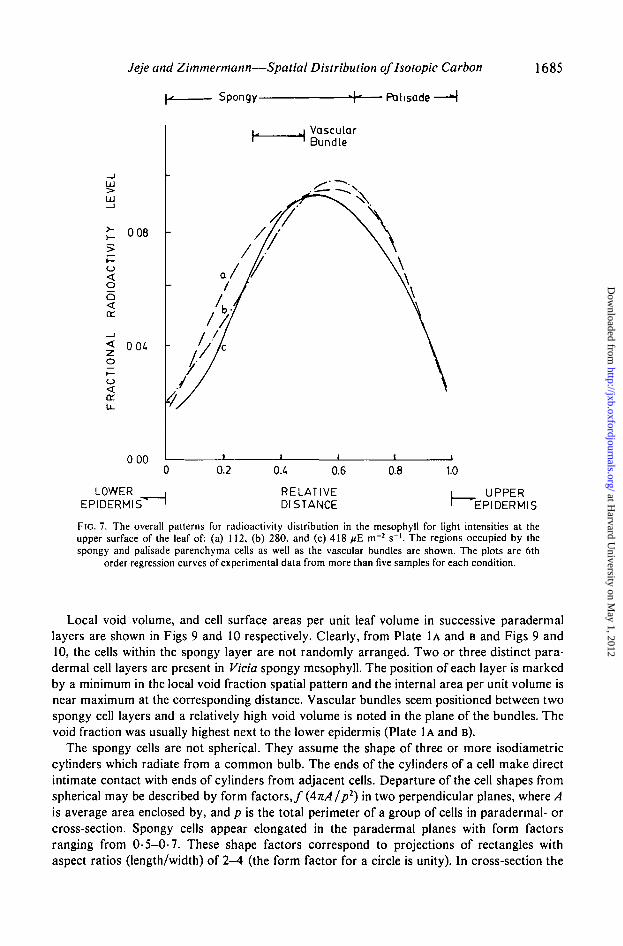
FIG. 7. The overall patterns for radioactivity distribution in the mesophyll for light intensities at theupper surface of the leaf of: (a) 112. (b) 280. and (c) 418 ^E m"2 s"1. The regions occupied by thespongy and palisade parenchyma cells as well as the vascular bundles are shown. The plots are 6th
order regression curves of experimental data from more than five samples for each condition.
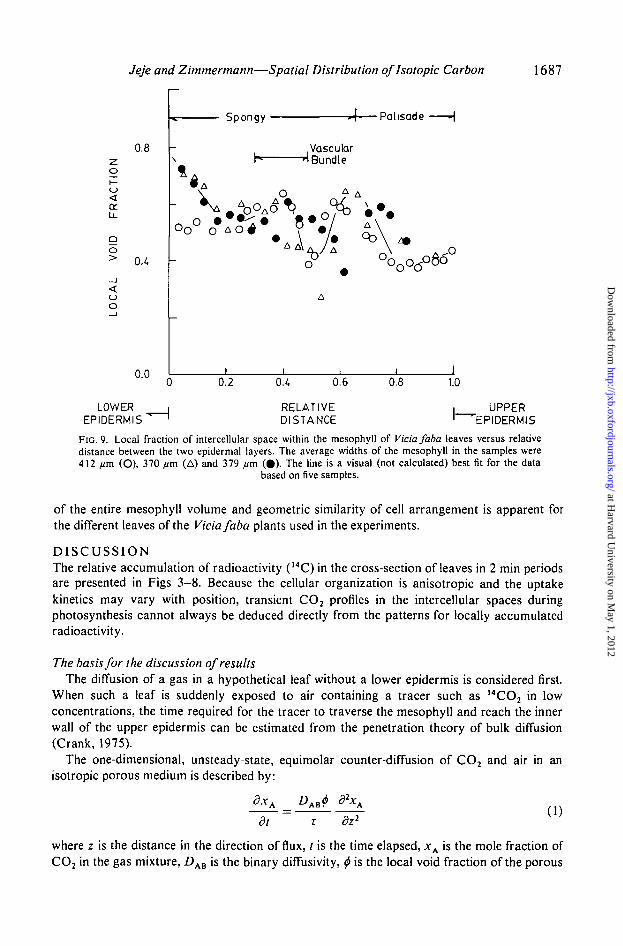
Local void volume, and cell surface areas per unit leaf volume in successive paradermallayers are shown in Figs 9 and 10 respectively. Clearly, from Plate 1A and B and Figs 9 and10, the cells within the spongy layer are not randomly arranged. Two or three distinct para-dermal cell layers are present in Vicia spongy mesophyll. The position of each layer is markedby a minimum in the local void fraction spatial pattern and the internal area per unit volume isnear maximum at the corresponding distance. Vascular bundles seem positioned between twospongy cell layers and a relatively high void volume is noted in the plane of the bundles. Thevoid fraction was usually highest next to the lower epidermis (Plate 1A and B).
The spongy cells are not spherical. They assume the shape of three or more isodiametriccylinders which radiate from a common bulb. The ends of the cylinders of a cell make directintimate contact with ends of cylinders from adjacent cells. Departure of the cell shapes fromspherical may be described by form factors,/ (4nA I p1) in two perpendicular planes, where Ais average area enclosed by, and p is the total perimeter of a group of cells in paradermal- orcross-section. Spongy cells appear elongated in the paradermal planes with form factorsranging from 0-5-0-7. These shape factors correspond to projections of rectangles withaspect ratios (length/width) of 2-4 (the form factor for a circle is unity). In cross-section the
at Harvard U
niversity on May 1, 2012
http://jxb.oxfordjournals.org/D
ownloaded from

1686 Jeje and Zimmermann—Spatial Distribution oflsotopic Carbon
0 10 -
0 06
>-I—>
I—o<§ 0 08<
ot—
<
004 -
0 00
LOWEREPIDERMIS"
RELATIVEDISTANCE
UPPER"EPIDERMIS
FIG. 8. Comparisons of radioactivity patterns in leaves for different 14CO2 concentrations extenal to theleaf at light intensities of 26-6 fiE m~' s~' (a, b) and 280 ftE m~l s~' (c, d). The CO2 concentration was
approximately 0 0 3 % v/v for curves b and d, and 0 0 5 % v/v for curves a and c.
form factor for spongy cells averaged about 0-7 and the longer dimensions, 40-75 fim. are inthe paradermal planes. For most cells the lengths are around 50 /um.
The palisade cells were almost cylindrical and the form factors (in the paradermal plane)were approximately 0-8. That is, the cross-section was somewhere between a square and acircle. The averaged length to diameter ratio was about 4. The palisade cells were typicallysingle-layered but some cells were displaced from the upper epidermis. Stomata are oftenpresent at the upper epidermis where the palisade is retracted. The palisade occupies 30-40%
at Harvard U
niversity on May 1, 2012
http://jxb.oxfordjournals.org/D
ownloaded from
Jeje and Zimmermann—Spatial Distribution oflsotopic Carbon 1687
0.8
o>
0.0
Spongy -Palisade
Vascular-* Bundle
0.2 O.i, 0.6 0.8 1.0
LOWEREPIDERMIS
RELATIVEDISTANCE
UPPER"EPIDERMIS
FIG. 9. Local fraction of intercellular space within the mesophyll of Vicia faba leaves versus relativedistance between the two epidermal layers. The average widths of the mesophyll in the samples were412 //m (O), 370 fim (A) and 379 //m (0) . The line is a visual (not calculated) best fit for the data
based on five samples.
of the entire mesophyll volume and geometric similarity of cell arrangement is apparent forthe different leaves of the Vicia faba plants used in the experiments.
D I S C U S S I O NThe relative accumulation of radioactivity (14C) in the cross-section of leaves in 2 min periodsare presented in Figs 3-8. Because the cellular organization is anisotropic and the uptakekinetics may vary with position, transient CO2 profiles in the intercellular spaces duringphotosynthesis cannot always be deduced directly from the patterns for locally accumulatedradioactivity.
The basis for the discussion of resultsThe diffusion of a gas in a hypothetical leaf without a lower epidermis is considered first.
When such a leaf is suddenly exposed to air containing a tracer such as 14CO2 in lowconcentrations, the time required for the tracer to traverse the mesophyll and reach the innerwall of the upper epidermis can be estimated from the penetration theory of bulk diffusion(Crank, 1975).
The one-dimensional, unsteady-state, equimolar counter-diffusion of CO2 and air in anisotropic porous medium is described by:
SxA
8t
DAJdz1 (1)
where z is the distance in the direction of flux, l is the time elapsed, xA is the mole fraction ofCO2 in the gas mixture, DAB is the binary diffusivity, <j> is the local void fraction of the porous
at Harvard U
niversity on May 1, 2012
http://jxb.oxfordjournals.org/D
ownloaded from

1688 Jeje and Zimmermann—Spatial Distribution oflsotopic Carbon
Spongy »+•> Palisade—H
h H VascularBundle
LOWEREPIDERMIS
RELATIVEDISTANCE
UPPEREPIDERMIS
F r c 10. Local specific areas (per unit volume) of exposed cell surfaces within the mesophyll of Viciafaba leaves versus relative distance between the two epidermal layers. The average width of mesophyllin the samples were 412 ,um (A), 370 nm (O) and 379 //m ( • ) . The line is a visual (not calculated) bestfit for the data based on five samples. The maxima and minima are obvious in every specimen but the
positions are not always coincident.
medium, and r is a tortuosity factor for non-straight pores. This equation is solved subject tothe conditions that at the exposed porous solid surface, the concentration of CO2 is constant(*AO) a n d at the upper epidermis the flux of CO2 is zero. The latter is equivalent to anassumption of an impervious upper epidermis. The solution is:
— 1(-1)"n *— 2 n + l
n=0
e(~ln + l)V/3/4 COS •2n+ 1
(2)
where /? = •yl?
and C= —
In equation 2, L is the thickness of the leaf.
at Harvard U
niversity on May 1, 2012
http://jxb.oxfordjournals.org/D
ownloaded from

Jeje and Zimmermann—Spatial Distribution oflsotopic Carbon 1689
If the leaf mesophyll is assumed isotropic (e.g. consisting mainly of spongy cells uniformlydistributed), is 500 fim thick, has 50% void spaces and a tortuosity factor of 1-3, the timerequired at 20 °C for 14CO2 to penetrate up to the upper epidermal wall is approximately 2-5ms. At this inner wall, the 14CO2 concentration would be 90% of that in ambient air in lessthan 40 ms. Within a second, the concentration throughout the mesophyll is substantially thesame as in ambient air. When photosynthetic rates by such a leaf is low, the time scales forthe transport of CO2 will not be substantially altered.
Clearly, a rapid uptake of the diffusing 14CO2 by the cells and/or a restricted access forCO2 is required for significant CO2 concentration gradients to exist in a leaf in 2 min afterexposure. Rapid uptake of CO2 would occur in intense light, and stomata and narrowmesophyll intercellular spaces would restrict diffusion.
Moss and Rasmussen (1969) and Bednarz and Rasmussen (1972) investigatedqualitatively the sites of CO2 fixation in C3 and C4 plants at low and near saturating lightintensities. Micro-autoradiograms of Beta vulgaris L. leaf cross-sections, after 14CO2 wasassimilated by the leaf for 1 or 2 min, showed preferential radioactivity accumulation inneither the palisade nor spongy layers. Furthermore, the autoradiograms show only atwo-dimensional picture.
Outlaw and Fisher (1975) investigated the time-dependent distribution of assimilates inleaves still on plants at 170 JUE m"2 s~' illumination. Fully expanded leaves fed 14CO2 for lessthan 5 min exhibited more radioactivity in mobile soluble products than insolubleproducts, and the accumulation of radioactivity in the palisade region exceeded that in thespongy mesophyll. Paradermal sectioning was employed simply to separate tissues—spongycells without veins, spongy cells with vascular bundles and palisade cells (Plate 1A, B) ratherthan to obtain spatial distribution profiles for 14C. The authors suggested that 'shading',interpreted here as light attenuation, explains the differential accumulation of radioactivity.The authors commented without further explanation tha t ' . . . the leaves were illuminated at alight intensity which results in the maximum difference in photosynthesis between the tissues'.They also ' . . . discounted the possibility of a CO2 gradient within the leaf since epidermalstomatal densities are similar . . . in the upper epidermis and . . . in the lower epidermis and therate of CO2 fixation was low'.
Similar epidermal stomatal densities, however, should not preclude the existence of CO2
and water vapour concentration gradients in a photosynthesizing leaf. The stomatal aperturesizes are important. Presented in Table 1 are the transpiration rates of single Viciafaba leavesover 7 min periods. The temperature and relative humidity of air in the room are as shown.The other conditions such as stomatal densities, air currents and illumination levels wereessentially constant. The data showed variable transpiration rates with only slight differences
T A B L E 1. Transpiration rates for single fresh Vicia faba leaves in air over 7 min periods
Leaf stomatal density was 32-36 per mm2 leaf surface area.
Sample Transpiration rate x 105 Room temperature Room relative humidity(//Imm-^s-1) (°C) (%)
1 0-861234 (0-7 min)
(52-59 min)(94-101 min)
•43•616•159•482•338
30-030-630-630-63 1 031-2
747575757777-3
at Harvard U
niversity on May 1, 2012
http://jxb.oxfordjournals.org/D
ownloaded from

1690 Jeje and Zimmermann—Spatial Distribution oflsotopic Carbon
in ambient temperature and relative humidity. The results for sample 4 can be ascribed totransient opening and closure of stomata (Raschke, 1975). The assimilation of CO2 at lowlight levels would be expected to vary similarly.
The current findingsIf gaseous diffusion was non-limiting, the concentration of 14CO2 would be almost uniform
within the intercellular space. The exact concentration distribution could then be evaluatedfrom the two-dimensional form of equation 1 with a term for the disappearance of the diffusingspecies, and the boundary condition of an epidermis with microscopic pores. Theaccumulation of radioactivity would reflect primarily that either the kinetics of photosynthesisor the rates of dissolution of 14CO2 in the mesophyll cell walls controlled CO2 uptake. Withthe kinetics controlling, radioactivity accumulated in the palisade with active chloroplastsshould be much higher than in the spongy mesophyll. If the liquid phase diffusion wascontrolling, the distribution of radioactivity would be correlated to the local internal area perunit volume (Fig. 10). Under such conditions the average radioactivity per unit volume in thespongy layer should be about 85% of that in the palisade layer. Data at the lowest light levelsuggest that kinetics rather than liquid phase diffusion is limiting.
At low incident light intensity /„, the radioactivity accumulated locally in the mesophylldepends directly on the photosynthetic rate. This local rate is a function of how light isattenuated in passing through the leaf. That is
* A = / l O ) (3)
where the local light intensity, / , is a function of the transverse distance through the leaf. Thisfunction should normally be more complex than suggested by the Beer—Lambert's Law.
I = Ioe'kz (4)
Cells which intercept the light are not uniformly dispersed and usually have large vacuoles.The cytoplasm of a palisade is bound by plasmalemma and tonoplast membranes whichcould confine light rays through it by total internal reflection. Such rays are effectivelyabsorbed by the chloroplasts. Rays through the vacuoles and outside the cell are littleattenuated in the palisade layer. The spongy cells, however, because of their irregular shapesand distribution can attenuate light by absorption enhanced by scatter from cell surfaces. Anappropriate function for equation 3 has yet to be established.
When the supply of CO2 to the cells becomes limiting in some parts of the mesophyll,photosynthetic rates must be defined by another function:
*A=/2(/,CA) (5)
where CA is the local concentration of CO2. In the appropriate function, the local CA is lessthan the ambient CO2 concentration, CAO, and depends on both position and time. Thephotosynthetic rates and carbon dioxide concentration profiles are consequently no moresimply related to the accumulated radioactivity.
Explicit forms for equation (5) have been proposed as listed by Thornley (1976, Table 4.1).The most commonly used expression is (Marshall and Biscoe, 1980):
(6)al + eCA0
which relates the apparent photosynthetic rate of the entire leaf, i?A, to the local intensity oflight, / , and the ambient concentration of carbon dioxide, CAO. This two parameter equationin c and e is an approximation which describes photosynthesis as a pseudo-first order
at Harvard U
niversity on May 1, 2012
http://jxb.oxfordjournals.org/D
ownloaded from
Jeje and Zimmermann—Spatial Distribution oflsotopic Carbon 1691
reaction. Any spatial dependence of CO2 concentration in the mesophyll is not reflected inequation (6).
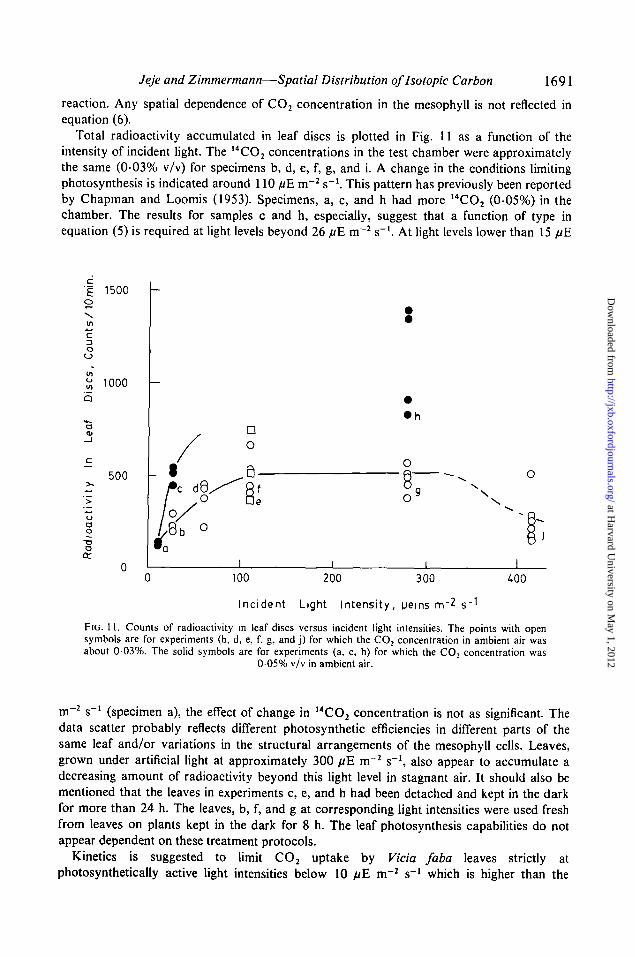
Total radioactivity accumulated in leaf discs is plotted in Fig. 11 as a function of theintensity of incident light. The 14CO2 concentrations in the test chamber were approximatelythe same (0-03% v/v) for specimens b, d, e, f, g, and i. A change in the conditions limitingphotosynthesis is indicated around 110 //E m~2 s"1. This pattern has previously been reportedby Chapman and Loomis (1953). Specimens, a, c, and h had more 14CO2 (0-05%) in thechamber. The results for samples c and h, especially, suggest that a function of type inequation (5) is required at light levels beyond 26 fiE m~2 s"1. At light levels lower than 15 //E
I 1500o
Oo
o
>
ao
1000
500
• h
O
O
100 200 300 400
Incident Light Intensity, perns m~2 s~^
FIG. 11. Counts of radioactivity in leaf discs versus incident light intensities. The points with opensymbols are for experiments (b, d, e, f, g, and j) for which the CO2 concentration in ambient air wasabout 0 0 3 % . The solid symbols are for experiments (a, c, h) for which the CO2 concentration was
0 0 5 % v/v in ambient air.
m 2 s ' (specimen a), the effect of change in 14CO2 concentration is not as significant. Thedata scatter probably reflects different photosynthetic efficiencies in different parts of thesame leaf and/or variations in the structural arrangements of the mesophyll cells. Leaves,grown under artificial light at approximately 300 fiE m~2 s"1, also appear to accumulate adecreasing amount of radioactivity beyond this light level in stagnant air. It should also bementioned that the leaves in experiments c, e, and h had been detached and kept in the darkfor more than 24 h. The leaves, b, f, and g at corresponding light intensities were used freshfrom leaves on plants kept in the dark for 8 h. The leaf photosynthesis capabilities do notappear dependent on these treatment protocols.
Kinetics is suggested to limit CO2 uptake by Vicia faba leaves strictly atphotosynthetically active light intensities below 10 //E m~2 s"1 which is higher than the
at Harvard U
niversity on May 1, 2012
http://jxb.oxfordjournals.org/D
ownloaded from

1692 Jeje and Zimmermann—Spatial Distribution oflsotopic Carbon
compensation light intensity of approximately 0-5 fiE m"2 s~'. Light intensities much lowerthan 10 juE m~2 s"1 could not be studied because respiration rates relative to photosynthesisshould become significant and radioactivity counting errors are unacceptable. Under kineticscontrol, radioactivity accumulated preferentially in the palisade and in the spongy mesophyllabove the vascular bundle zone (Fig. 6a). The liquid phase resistance does not appearcontrolling since the radioactivity distribution is not correlated to specific surface areapatterns. The activity distribution profiles and total counts in leaf discs with and withoutpores were also essentially indentical. Hence, gas phase diffusion resistance is considerednegligible at low lights.
At a light level of 26-6 //E m~2 s~\ the distribution pattern for radioactivity shows twomaxima (one in each of the spongy and palisade layers) for CO2 concentration in external airabout 0-03% (Fig. 8b) but only one peak is observed for 0-05% (Fig. 8a). With 0-05% v/vCO2 in air, most radioactivity is found a little beyond the vascular bundle zone where specificarea is also highest. The bimodal distribution in Fig. 8b suggests competing limitingconditions for assimilation. Chloroplast activity as controlled by light appears limiting in thespongy layer while the local CO2 concentration is indicated to limit uptake in the palisadezone. The absence of the second peak in Fig. 8a and the relative shift in the position of themaxima in the spongy layer in Fig. 8a, and b supports the conclusion.
At the light intensity of 61 fiE m~2 s~\ the accumulation of radioactivity (Fig. 6c), issimilar to that in Fig. 8a. Between 110 and 420 /uE m~2 s"1 (Figs 7a, b, and c), essentiallyparabolic profiles are observed and the peaks occur in the spongy layer just above thevascular bundle zone. With increasing light intensity, the peaks are displaced slightly towardsthe vascular bundle region. The curves for leaves exposed to 0-03% CO2 and 0-05% CO2
(Figs 8c and d) are similar but more radioactivity was detected when 0-05% CO2 was used.In the experiments, no significant differences in radioactivity distributions were noted when
the leaf surface was supplied 14CO2 through 1 -0 cm or 0-5 cm transfer tubes. This indicatedthat pore resistance was not limiting for light levels below 420 juE m~2 s~'. Moreover, data inFigs 3 and 5 show similar patterns for discs with and without pores. The accumulatedradioactivity is, however, lower for discs without artificial stomata. This is attributed to apreferred lateral diffusion of 14CO2 in the highly porous spongy zone near the lowerepidermis. That is, the spongy mesophyll of the Viciafaba L. leaves is itself anisotropic.
A C K N O W L E D G E M E N T SThe expert technical assistance of Ann Lewis and Monica Mattmuller in the execution of theexperiments is appreciated. Professor Parkinson of the University of Calgary kindly allowedus the use of his image analyzer for examining leaf structural details. The work was supportedby grants from The University of Calgary Research Policy and Grants Committee and theNatural Science and Engineering Research Council of Canada.
A P P E N D I XA capillary tube which has constant but different concentrations of a diffusing species A at itsopposite ends would have a steady state concentration profile of species A which satisfy theequation:
H I rn _ dY. \= 0 (A-l)
dZ\\ - XK dZK
at Harvard U
niversity on May 1, 2012
http://jxb.oxfordjournals.org/D
ownloaded from
Jeje and Zimmermann—Spatial Distribution oflsotopic Carbon 1693
where XA is the local mole fraction of A, c is the molar concentration of the gas mixture andDAB is the binary diffusion coefficient. This is the diffusion equation in a stagnant medium. Ifthe tube ends are denoted with subscripts 1 and 2, the solution to equation 1 is:
(A-2)l-XAl) \l-XAl
where L is the length of the tube and Z is the distance from the end with higher mole fraction
The flux of substance A is then:
N^ = ~T'(\~_XxK1) (A"3)
The mass transfer rate of A is:
WA = NAZxSx MA (A-4)
where S is the channel cross-sectional area and MA is the molar mass of A. From the fore-going, it is obvious that if the concentrations XAJ and XA2 as well as c and DAB are kept con-stant, the mass transfer rate WA is simply proportional to the ratio S/L and does not dependon the exact physical dimensions of the transport channel.
L I T E R A T U R E C I T E DBEDNARZ, R. M., and RASMUSSEN, H. P., 1972. CO2-fixation sites in leaves of Maize and Oats.
Journal of Experimental Botany, 23,415-21.BLACKMAN, F. F.. 1895. Experimental researches on vegetable assimilation and respiration. II. On the
paths of gaseous exchange between aerial leaves and the atmosphere. Philosophical Transactionsof the Royal Society. Series B, 186,503-62.
BROWN, H. T.. and ESCOMBE, F., 1900. Static diffusion of gases and liquids in relation to theassimilation of carbon and translocation in plants. Ibid. 193, 223-91.
CAEMMERER VON, S., and FARQUHAR, G. D., 1981. Some relationships between the biochemistry ofphotosynthesis and the gas exchange of leaves. Planta, 153, 376-87.
CHAPMAN, H. W., and LOOMIS, W. E., 1953. Photosynthesis in the potato under field conditions. PlantPhysiology, 28, 703-16.
COWAN, J. R.. and FARQUHAR, G. D., 1977. Stomatal function in relation to leaf metabolism and theenvironment. In Integration of activity in the higher plant. Ed. D. H. Jennings. Society ofExperimental Biology Symposium, 31, Cambridge University. 471-505.
CRANK, J., 1975. The mathematics of diffusion. Second edition. Clarendon Press, Oxford.VAN DER DEEN, R.. 1960. Induction phenomena. In Encyclopedia of plant physiology. Volume 1. Ed.
W. Ruhland. Springer-Verlag. Berlin. Pp. 675-88.ESAU, K.. 1965. Plant anatomy. Second Edtion. J. Wiley, New York.HALL. A. E.. 1982. Mathematics models of plant water loss and plant water relations. In Encyclopedia
of plant physiology. Volume 12B. Eds O. L. Lange, P. S. Nobel, C. B. Osmond and H. Ziegler.Springer-Verlag. Chapter 8.
HEATH. O. V. S., 1969. The physiological aspects of photosynthesis. Heineman, London. Chapter 2.JARMAN, P. D.. 1974. The diffusion of CO2 and water vapour through stomata. Journal of
Experimental Botany. 25,927-36.JARVIS, P. G., 1971. The estimation of resistances to CO2 transfer. In Plant photosyntheticproduction;
manuals of methods. Eds Z. Sestak, J. Catsky and P. G. Jarvis. W. Junk Publishers, The Hague.566-631.
KURSANOV, L. L., and BROVCHENKO, M. I., 1970. Sugars in the free space of leaf plates; their originand possible involvement in transport. Canadian Journal of Botany, 48, 1243-50.
LAISK. A.. OJA. V.. and KULL. K., 1980. Statistical distribution of stomatal apertures of Viciafaba andHordeum vulgare and the Spannungsphase of stomatal opening. Journal of ExperimentalBotany, 31,49-58.
at Harvard U
niversity on May 1, 2012
http://jxb.oxfordjournals.org/D
ownloaded from
1694 Jeje and Zimmermann—Spatial Distribution oflsotopic Carbon
LILLEY, R. McC, and WALKER, D. A., 1975. Carbon dioxide assimilation by leaves, isolatedchloroplasts and ribulose bisphosphate carboxylase from spinach. Plant Physiology, 55,1087-92.
LURI, S., PAX. N., STRUCH, N., and BRAVDO, B. A.. 1979. Effect of leaf age on photosynthesis andphotorespiration. In Photosynthesis and plant development. Eds R. Marcelle, H. Clijsters and M.van Poucke. W. Junk Publishers, Boston. Pp. 31.
MARSHALL, B., and BISCOE, P. V., 1980. A model for C3 leaves describing the dependence of netphotosynthesis on irradiance. Journal of Experimental Botanv. 31, 29-39.
MEIDNER, H., and MANSFIELD, T. A., 1968. Physiology ofstomaia. McGraw-Hill, London.Moss, D. N., 1962. Photosynthesis and barrenness. Crop Science, 2, 366-7.
and RASMUSSEN, H. P., 1969. Cellular localization of CO2 fixation and translocation ofmetabolites. Plant Physiology, 44,1063-8.
NIELSEN, E. S., 1960. Uptake of CO2 by the plant. In Encyclopedia of plant physiology. Volume 1. Ed.W. Ruhland. Springer-Verlag, Berlin. Pp. 70-84.
NOBEL, P. S., 1974. Introduction to biophysical plant physiology. W. H. Freeman and Co., SanFrancisco.
OUTLAW, W. H. JR., and FISHER, D. B., 1975. Compartmentation in Viciafaba leaves. I. Kinetics of14C in the tissues following pulse-labelling. Plant Physiology, 55, 699-703.
RASCHKE, K., 1975. Stomatal action. Annual Review of Plant Physiology, 26, 309-40.SATTERFIELD, C. N., 1970. Mass transfer in heterogeneous catalvsis. M. I. T. Press., Camb., Mass.,
U.S.A.SCHULZE, E. D., and HALL, A. E., 1982. Stomatal responses, water loss, and CO2 assimilation rates of
plants in contrasting environments. In Encyclopedia of plant physiology. Volume 12B. Eds O. L.Lange, P. S. Nobel, C. B. Osmond and H. Ziegeer. Springer-Verlag, Berlin. Chapter 7.
STALFELT, M. G., 1960. Das Kohlendioxyd. In Encyclopedia of plant physiology. Volume 2. Ed. W.Ruhland, Springer-Verlag, Berlin. Pp. 81-99.
THORNLEY, J. H. M., 1976. Mathematical models in plant physiology. Academic Press, New York.Chapter 4.
VERDUIN, J., 1949. Diffusion through multiperforate septa. In Photosynthesis in plants. Eds J. Franckand W. E. Loomis. Iowa University Press. Pp. 95—112.
at Harvard U
niversity on May 1, 2012
http://jxb.oxfordjournals.org/D
ownloaded from


