The Anatomy of the CDS Market - Columbia University
33
The Anatomy of the CDS Market Martin Oehmke (Columbia University) Adam Zawadowski (Boston University) June 21, 2013
Transcript of The Anatomy of the CDS Market - Columbia University

The Anatomy of the CDS Market
Martin Oehmke (Columbia University)
Adam Zawadowski (Boston University)
June 21, 2013

Martin Oehmke and Adam Zawadowski The Anatomy of the CDS Market
The CDS market
Credit Default Swap is a derivative contract:
• insurance on the default of the reference entity’s bonds (typically 5 yr)
• buyer pays fixed insurance premium called CDS spread
• upon default seller pays: (face value) - (recovery value)
• amount of insured bonds is the notional amount (typically $10m)
Size of market:
• BIS statistics (Nov 2011): 18 trillion USD gross single name
• also large CDS index market
Derivatives Regulation after the Crisis, Oxford, June 21, 2013 2

Martin Oehmke and Adam Zawadowski The Anatomy of the CDS Market
Motivation
CDS markets have become major markets for credit risk transfer
• tremendous growth in market size over the last decade
CDS markets are at center of multiple policy debates (Stulz 2010)
• role of CDS markets in recent crisis
• impact on debtor-creditor relationship
• etc.
BUT: Little is known about positions in CDS markets
• What determines CDS market existence and size of position?
• What is the economic role of the CDS market?
Derivatives Regulation after the Crisis, Oxford, June 21, 2013 3

Martin Oehmke and Adam Zawadowski The Anatomy of the CDS Market
This Paper
Investigate determinants of positions taken in CDS market
• using novel position data from DTCC
• actual positions at the reference entity level
Main message: CDS markets are “alternative trading venues”
• hedging (bonds and other types of debt)
• speculation (as proxied by disagreement)
• arbitrage (CDS-bond basis)
Why alternative trading venues?
CDS more likely to be used when reference entity’s bonds are hard to trade:
• illiquid
• fragmented ∼ CDS is a unified trading venue
Derivatives Regulation after the Crisis, Oxford, June 21, 2013 4

Martin Oehmke and Adam Zawadowski The Anatomy of the CDS Market
Related Literature
• Role of CDS in risk transfer: Duffee and Zhou (2001), Parlour and
Plantin (2008), Thompson (2009), Parlour and Winton (2012)
• Debtor-creditor relationship: Hu and Black (2007), Stulz (2010),
Bolton and Oehmke (2011), Subrahmanyam et al. (2012)
• Disagreement: Geanakoplos and Fostel (2011), Che and Sethi (2011)
• Liquidity of Bonds and CDS: Oehmke and Zawadowski (2013)
• Microstructure of CDS market: Shachar (2011), Chen et al.
(2011), Qiu and Yu (2012)
• Informational role of CDS: Acharya and Johnson (2007)
• Usage of CDS and effect on credit supply: Minton et al. (2009),
Ashcraft and Santos (2009), Hirtle (2009), Saretto and Tookes (2013)
• CDS-bond basis: Blanco et al. (2005), Nashikkar et al. (2010), Bai
and Collin-Dufresne (2010), Fontana (2011)
Derivatives Regulation after the Crisis, Oxford, June 21, 2013 5

Martin Oehmke and Adam Zawadowski The Anatomy of the CDS Market
Data: DTCC Trade Information Warehouse
• weekly snapshots: October 31, 2008 to December 2011
• net and gross notional amount on top 1000 reference entities
• includes all major CDS dealers and 1100+ hedge funds and managers;
altogether 1700+ buy side firms
⇒ Most comprehensive CDS position data available (95% of market)
Gross notional outstanding
• sum of all contracts on a given reference entity
Net notional outstanding
• sum of net contracts bought (netting within counterparty)
• maximum amount that can change hands (with zero recovery)
Derivatives Regulation after the Crisis, Oxford, June 21, 2013 6

Martin Oehmke and Adam Zawadowski The Anatomy of the CDS Market
Gross and Net Notional
• Net notional nets out contracts within each counterparty
Example (b): Gross and net notional positions
A
Example (b): Gross and net notional positions
BC
10m
B
Gross CDS bought Gross CDS sold Net CDS
C 10m
Gross CDS bought Gross CDS sold Net CDS
A 0 10 (10)
B 10 10 0
C 10 0 10
Total Gross Notional Bought =20
Gross Notional Sold =20
Net NotionalBought/Sold=10
Derivatives Regulation after the Crisis, Oxford, June 21, 2013 7

Martin Oehmke and Adam Zawadowski The Anatomy of the CDS Market
Single-name CDS gross and net notional in DTCC data
050
0010
000
1500
0
2009m1 2010m1 2011m1 2012m1time
total single name net CDS (billions)total single name gross CDS (billions)
Derivatives Regulation after the Crisis, Oxford, June 21, 2013 8

Martin Oehmke and Adam Zawadowski The Anatomy of the CDS Market
Net single-name CDS positions in the data0
400
800
1200
1600
2009m1 2010m1 2011m1 2012m1time
total single name net CDS (billions)top 1000 single name net CDS (billions)top 1000 single name net CDS excl. states and sovereigns (billions)single name net CDS in rated sample (billions)
Derivatives Regulation after the Crisis, Oxford, June 21, 2013 9

Martin Oehmke and Adam Zawadowski The Anatomy of the CDS Market
Other Data Sources
• Compustat (international + domestic): assets, debt, accounts payable
• Compustat ratings: S&P monthly ratings
• Trace: all transactions involving US issued bonds
• Mergent FISD: all US bond issues
• IBES: analyst earnings forecasts
• Capital IQ: detailed debt structure (annual only)
• Bloomberg: CDS spreads and CDS-bond basis
Our sample: use all rated Compustat firms
• DTCC data hand-matched with Compustat: 481 companies
• all data transformed into monthly: 39 months
• exclude all firms with multiple CDS markets
Derivatives Regulation after the Crisis, Oxford, June 21, 2013 10

Martin Oehmke and Adam Zawadowski The Anatomy of the CDS Market
Summary Statistics: All Rated Firms
(1) (2) (3) (4) (5)
VARIABLES N mean std p10 p90
assets (USD billions) 58,035 33.33 151.2 0.806 48.35
net CDS (USD billions) 16,523 1.096 0.897 0.320 2.080
gross CDS (USD billions) 16,525 14.36 13.56 2.847 29.47
number of CDS 16,525 2,178 1,518 573 4,184
net CDS / assets 16,523 0.0841 0.125 0.00701 0.208
net CDS / debt 16,394 0.300 0.461 0.0340 0.698
Derivatives Regulation after the Crisis, Oxford, June 21, 2013 11

Martin Oehmke and Adam Zawadowski The Anatomy of the CDS Market
-5-4
-3-2
-10
12
log(
net)
-2 0 2 4 6 8log(assets)
in DTCC and Bloomberg censored, no Bloombergin DTCC, no Bloomberg censored, in Bloomberg
Censoring in net notional at approx. 170 million dollars (Dec 2009)
Derivatives Regulation after the Crisis, Oxford, June 21, 2013 12

Martin Oehmke and Adam Zawadowski The Anatomy of the CDS Market
Estimation using Maximum Likelihood
yi,t = log (Net CDSi,t) = β ·Xi,t + εi,t
Lt =n∏
i=1
[1
σ· φ(yi,t − β ·Xi,t
σ
)]di,t
·
Φ
yi,t − β ·Xi,t√σ2 + σ2
n2g,t
1−di,t
yi,t = log (NetCutofft) = log(GrossCutofft) + µn2g,t
• µn2g is the average observed log(net/gross) in a given month
• σn2g is the std. of the observed log(net/gross) in a given month
• di,t is an indicator for observing net notional CDS outstanding
Derivatives Regulation after the Crisis, Oxford, June 21, 2013 13

Martin Oehmke and Adam Zawadowski The Anatomy of the CDS Market
Three regressions
1. all: all observations assuming censoring only
2. if exist: conditional on the existence of CDS
3. probit: whether or not the CDS market exists
Existence of CDS market:
• at least one CDS spread quoted on Bloomberg after Jan 2007
• in DTCC data at least once
Other:
• Fixed effects: time, industry (first digit SIC)
• Rating buckets: baseline is BB (includes BB-, BB, BB+)
• Standard errors clustered at the firm level
Derivatives Regulation after the Crisis, Oxford, June 21, 2013 14

Martin Oehmke and Adam Zawadowski The Anatomy of the CDS Market
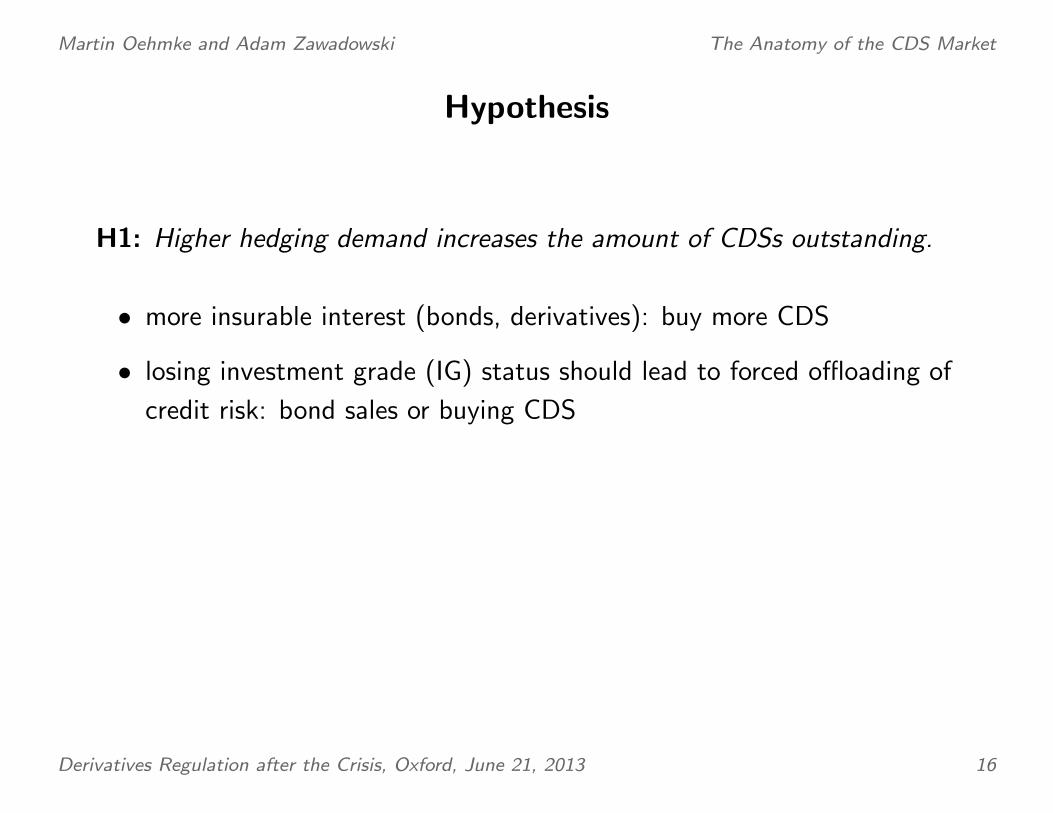
Hypotheses
H1: Higher hedging demand increases the amount of CDSs outstanding.
H2: Higher speculative demand increases the amount of CDSs
outstanding.
H3: Illiquidity of the bond market increases the amount of CDSs
outstanding. Furthermore, H1 and H2 should be more pronounced if the
bond market is illiquid.
H4: Higher demand from arbitrageurs increases the amount of CDSs
outstanding.
Derivatives Regulation after the Crisis, Oxford, June 21, 2013 15
Martin Oehmke and Adam Zawadowski The Anatomy of the CDS Market
Hypothesis
H1: Higher hedging demand increases the amount of CDSs outstanding.
• more insurable interest (bonds, derivatives): buy more CDS
• losing investment grade (IG) status should lead to forced offloading of
credit risk: bond sales or buying CDS
Derivatives Regulation after the Crisis, Oxford, June 21, 2013 16

Martin Oehmke and Adam Zawadowski The Anatomy of the CDS Market
Table 2: Baseline Regression, log(net CDS)
all if exist probit
log(assets) 0.443∗∗∗ 0.172∗∗∗ 0.339∗∗∗
(5.32) (2.87) (5.61)
log(debt) 0.513∗∗∗ 0.333∗∗∗ 0.217∗∗∗
(7.22) (6.37) (4.22)
credit enhancement (dummy) 3.276∗∗∗ 1.789∗∗∗ perfect +
(6.05) (6.16) (omitted)
industry: finance -1.920∗∗∗ -0.606∗∗∗ -1.300∗∗∗
(-10.96) (-5.08) (-10.00)
systemic 0.578∗ 0.560∗∗∗ perfect +
(1.71) (2.58) (omitted)
Number of Firms 1784 609 1784
Number of Observations 57220 21095 57220
Derivatives Regulation after the Crisis, Oxford, June 21, 2013 17

Martin Oehmke and Adam Zawadowski The Anatomy of the CDS Market
all if exist probit
AA or higher rating 0.108 -0.280 0.289
(0.40) (-1.46) (1.31)
A rating 0.907∗∗∗ 0.116 0.764∗∗∗
(4.66) (0.80) (5.53)
BBB rating 1.149∗∗∗ 0.358∗∗∗ 0.854∗∗∗
(6.92) (2.65) (7.76)
B rating 0.0324 -0.156 0.0743
(0.20) (-1.15) (0.70)
CCC or lower rating 0.359 0.152 0.237
(1.10) (0.52) (1.28)
lost inv. grade in last 5 years 1.926∗∗∗ 0.862∗∗∗ 1.268∗∗∗
(9.42) (5.81) (8.50)
Number of Firms 1784 609 1784
Number of Observations 57220 21095 57220
Derivatives Regulation after the Crisis, Oxford, June 21, 2013 18

Martin Oehmke and Adam Zawadowski The Anatomy of the CDS Market
Hypothesis 1: Results
H1: Higher hedging demand increases the amount of CDSs outstanding.
Conditional on CDS market existing:
• 10% more debt, 3.33% more CDS
• sellers of credit enhancement have 498% more CDS
(Zawadowski 2011)
• companies that lost investment grade status have 137% more CDS
• NEW RESULT: regressing net CDS on forms of debt:
– 8.5 cents*** of CDS for every $ of bonds outstanding
– 1.6 cents** of CDS for every $ of accounts payable
– all other borrowing are insignificant
– $2.2 billion*** more CDS if sell credit enhancement
Derivatives Regulation after the Crisis, Oxford, June 21, 2013 19

Martin Oehmke and Adam Zawadowski The Anatomy of the CDS Market
Why trade in CDS?
Investors have a choice:
• trade in the derivative (CDS)
• trade in the bond directly
Conjecture: CDS are attractive when
• reference entity’s bonds are illiquid
– lower trading costs when using CDS
• reference entity’s bond issues are fragmented
– CDS provide a standardized trading place for credit risk
Derivatives Regulation after the Crisis, Oxford, June 21, 2013 20

Martin Oehmke and Adam Zawadowski The Anatomy of the CDS Market
Liquidity measures
3 liquidity buckets formed using below measures (low, medium, high)
# of bond trades
• for each issuer: trades over previous 12 months from Trace
• related to measure: # of zero trading days
• scales with size of bond market
bond turnover
• for each issuer: turnover from previous 12 months using Trace
• also a measure of trading demand?
Herfindahl index
• for issuer: calculate Herfindahl of bond issuances (fragmentation)
• take logs and orthogonalize to log(bonds outstanding)
Derivatives Regulation after the Crisis, Oxford, June 21, 2013 21

Martin Oehmke and Adam Zawadowski The Anatomy of the CDS Market
Hypotheses 2&3
H2: Higher speculative demand increases the amount of CDSs
outstanding.
• speculative demand: use analyst earnings forecast dispersion
(normalized by price)
H3: Illiquidity of the bond market increases the amount of CDSs
outstanding. Furthermore, H1 and H2 should be more pronounced if the
bond market is illiquid.
• more fragmented bond market: more CDS
• effect of losing IG larger for low liquidity firms
• effect of earnings diagreement larger for low liquidity firms
Derivatives Regulation after the Crisis, Oxford, June 21, 2013 22

Martin Oehmke and Adam Zawadowski The Anatomy of the CDS Market
Table 2 (cont’d) for US firms in Mergent FISD
all if exist probit
log(bonds outstanding) 0.559∗∗∗ 0.301∗∗∗ 0.501∗∗∗
(3.56) (2.62) (3.13)
log(debt) -0.147 0.0718 -0.192
(-1.23) (0.74) (-1.60)
bond turnover (last 12 months) 0.264 0.0303 0.328∗
(1.52) (0.19) (1.94)
adj. log(bond Herfindahl) -0.645∗∗∗ -0.313∗∗∗ -0.559∗∗∗
(-4.50) (-2.58) (-3.59)
disagree: analyst std/price 4.046∗∗∗ 3.352∗∗∗ 1.224
(3.67) (3.94) (1.07)
Number of Firms 685 335 685
Number of Observations 19966 11101 19966
Derivatives Regulation after the Crisis, Oxford, June 21, 2013 23

Martin Oehmke and Adam Zawadowski The Anatomy of the CDS Market
Hypothesis 2&3: Results
H2: Higher speculative demand increases the amount of CDSs
outstanding.
Conditional on CDS market existing:
• one std increase in analyst disagreement: 10.2% increase in CDS
• similar results for other disagreement measures
H3 (1): Illiquidity of the bond market increases the amount of CDSs
outstanding.
Conditional on CDS market existing:
• one std decrease in adj. Herfindahl: 13.3% more CDS
H3 (2): H1 and H2 more pronounced if the bond market is illiquid.
Derivatives Regulation after the Crisis, Oxford, June 21, 2013 24

Martin Oehmke and Adam Zawadowski The Anatomy of the CDS Market
Hypothesis 3: Results
Conditional on CDS market existing (using # of Bond Trades):
• a one std increase in disagreement increases CDS by:
5.8% for high liquidity companies,
19.2% for medium liquidity companies
61.2% for low liquidity companies (t-stat of high-low diff.: 4.03)
• losing IG increases CDS by:
122% for high liquidity companies,
179% for medium liquidity companies
580% for low liquidity companies (t-stat of high-low diff.: 2.77)
• turnover gives similar results, adj. Herfindahl weaker results
• NEW RESULT: regressing net CDS on bonds outstanding:
– small bond markets: 5.4 cents*** of CDS for every $ of bonds
– large bond markets: 30.3 cents*** of CDS for every $ of bonds
Derivatives Regulation after the Crisis, Oxford, June 21, 2013 25

Martin Oehmke and Adam Zawadowski The Anatomy of the CDS Market
Hypothesis
H4: Higher demand from arbitrageurs increases the amount of CDSs
outstanding.
• CDS-bond basis = CDS spread - (bond yield - rf )
• negative basis trade:
buy bond
buy CDS
• positive basis trade:
short bond (harder)
sell CDS
Derivatives Regulation after the Crisis, Oxford, June 21, 2013 26

Martin Oehmke and Adam Zawadowski The Anatomy of the CDS Market
Hypothesis 4: Results
H4: Higher demand from arbitrageurs increases the amount of CDSs
outstanding.
• for bonds with a negative basis, a one standard deviation decrease in
the basis leads to 32.9% more CDS
• insignificant effect for positive basis
• channel through which CDS can lower firms’ borrowing cost
(Saretto and Tookes 2013, Oehmke and Zawadowski 2013)
• regressing net CDS on basis:
– $308 million more CDS for every % point of negative basis
Derivatives Regulation after the Crisis, Oxford, June 21, 2013 27

Martin Oehmke and Adam Zawadowski The Anatomy of the CDS Market
Conclusion
CDS emerge as “alternative trading venues”
CDS markets used for hedging and speculation:
• insuring bond and OTC derivatives exposure
• ’taking views’ on default probability (disagreement)
Liquidity matters:
• CDS attractive when firm’s bonds are fragmented (Herfindahl)
• effect of downgrades and disagreement larger if underlying bond illiquid
CDS markets also used for arbitrage:
• arbitrage mispricing: CDS-bond basis
Derivatives Regulation after the Crisis, Oxford, June 21, 2013 28

Martin Oehmke and Adam Zawadowski The Anatomy of the CDS Market
References
Acharya, Viral V. and Timothy C. Johnson, “Insider Trading in Credit
Derivatives,” Journal of Financial Economics, 2007, 84 (1), 110–141.
Ashcraft, Adam B. and Joao A. C. Santos, “Has the CDS Market
Lowered the Cost of Corporate Debt,” Journal of Monetary
Economics, 2009, 56 (4), 514–523.
Bai, Jennie and Pierre Collin-Dufresne, “The Determinants of the
CDS-Bond Basis During the Financial Crisis of 2007-2009,” 2010.
Working Paper, Columbia University.
Blanco, Roberto, Simon Brennan, and Ian W. Marsh, “An Empirical
Analysis of the Dynamic Relation between Investment-Grade Bonds
and Credit Default Swaps,” The Journal of Finance, 2005, 60 (5), pp.
2255–2281.
Bolton, Patrick and Martin Oehmke, “Credit Default Swaps and the
Derivatives Regulation after the Crisis, Oxford, June 21, 2013 29

Martin Oehmke and Adam Zawadowski The Anatomy of the CDS Market
Empty Creditor Problem,” Review of Financial Studies, 2011, 24 (8),
2617–2655.
Che, Yeon-Koo and Rajiv Sethi, “Credit Derivatives and the Cost of
Capital,” 2011. Working Paper, Columbia University.
Chen, Kathryn, Michael Fleming, John Jackson, Ada Li, and Asani
Sarkar, “An Analysis of CDS Transactions: Implications for Public
Reporting,” Federal Reserve Bank of New York Staff Reports, 2011,
517.
Duffee, Gregory R. and Chunsheng Zhou, “Credit derivatives in
banking: Useful tools for managing risk?,” Journal of Monetary
Economics, 2001, 48 (1), 25 – 54.
Fontana, Alessandro, “The Negative CDS-bond Basis and Convergence
Trading during the 2007/09 Financial Crisis,” 2011. Working Paper,
Geneva Finance Research Institute.
Geanakoplos, John and Ana Fostel, “Tranching, CDS and Asset Prices:
Derivatives Regulation after the Crisis, Oxford, June 21, 2013 30

Martin Oehmke and Adam Zawadowski The Anatomy of the CDS Market
How Financial Innovation can Cause Bubbles and Crashes,” 2011.
Working Paper, Yale University.
Hirtle, Beverly, “Credit Derivatives and Bank Credit Supply,” Journal of
Financial Intermediation, 2009, 18 (2), 125–150.
Hu, Henry T. C. and Bernard Black, “Hedge Funds, Insiders, and the
Decoupling of Economic and Voting Ownership: Empty Voting and
Hidden (Morphable) Ownership,” Journal of Corporate Finance, 2007,
13, 343–367.
Minton, Bernadette, Rene M. Stulz, and Rohan Williamson, “How
Much Do Banks Use Credit Derivatives to Hedge Loans,” Journal of
Financial Services Research, 2009, 35 (1), 1–31.
Nashikkar, Amrut, Marti G. Subrahmanyam, and Sriketan Mahanti,
“Liquidity and Arbitrage in the Market for Credit Risk,” Journal of
Financial and Quantitative Analysis, 2010. (forthcoming).
Oehmke, Martin and Adam Zawadowski, “Synthetic or Real? The
Derivatives Regulation after the Crisis, Oxford, June 21, 2013 31
Martin Oehmke and Adam Zawadowski The Anatomy of the CDS Market
equilibrium effect of CDSs on bonds,” 2013. Working Paper,
Columbia University.
Parlour, Christine A. and Andrew Winton, “Laying off Credit Risk:
Loan Sales versus Credit Default Swaps,” Journal of Financial
Economics, 2012. (forthcoming).
and Guillaume Plantin, “Loan Sales and Relationship Banking,”
Journal of Finance, 2008, 63 (3), 1291–1314.
Qiu, Jiaping and Fan Yu, “Endogenous liquidity in credit derivatives,”
Journal of Financial Economics, 2012, 103 (3), 611 – 631.
Saretto, Alessio and Heather Tookes, “Corporate Leverage, Debt
Maturity and Credit Default Swaps: The Role of Credit Supply,”
Review of Financial Studies, 2013. (forthcoming).
Shachar, Or, “Exposing the Exposed: Intermediation Capacity in the
Credit Default Swap Market,” 2011. Working Paper, NYU Stern.
Stulz, Rene M., “Credit Default Swaps and the Credit Crisis,” Journal of
Derivatives Regulation after the Crisis, Oxford, June 21, 2013 32

Martin Oehmke and Adam Zawadowski The Anatomy of the CDS Market
Economic Perspectives, 2010, 24 (1), 73–92.
Thompson, James R., “Credit Risk Transfer: To Sell or to Insure,” 2009.
Working Paper, University of Waterloo.
Zawadowski, Adam, “Entangled Financial Systems,” 2011. Working
Paper, Boston University.
Derivatives Regulation after the Crisis, Oxford, June 21, 2013 33