The Analysis ofTransitions in Economic Performance Using...
7
The Analysis of Transitions in Economic Performance Using Covariate Dependent Markov Model l/ Adam Baharum I and M. Ataharul Islam 2 ISchool of Mathematical Sciences, Universiti Sains Malaysia 11800 Minden,Pulau Pinang, Malaysia Phone:+60-4-653 3942, Fax: +60-4-657 0910 Email: [email protected] 20epartment of Statistics and OR, College of Science, King Saud University Riyadh, Saudi Arabia Email: [email protected] Abstract.:The GDP or GNP as a measure of economic peljormance of a country changes We can identify the factors that precede its ups and downs. For such forecasting. the use of Markov models are not nell', but in this paper, an attempt is made to propose a covariate-dependent Markov model to identify the factors that contribute to the estimation of transition probabilities. The proposed model is employed to estimate the transition probabilities, the factors that contribute to transitIOn in economic peljormance, and other relevant charactenstics. The cross-country data have been employedfor the period 1980-2000 for fitting the model. This can prOVide a usefUL model for forecasting the economic performance in both developing and developed countries. Introduction The measure of GOP depends on several components such as private consumption, investment, government consumption, changes in inventories, total exports and total imports. It is observed by Swamy and Fikkert (2002) that the determinants of economic growth which rely on cross-country growth regressions may be affected by bias from two sources: (i) omitted variables, and simultaneity. The first one is attributable to country characteristics that affect growth but omitted by the econometricians. The second one is due to the fact that the determinants of growth of GOP, such as investment in physical capital, may also affected by this growth. Currently, there is evidence of relationship between human capital accumulation and economic growth. Asteriou and Agiomirgianakis (200 I) demonstrated such relationship between education variables and GOP as well as the causal direction between them for Greece. Similar relationship was observed in Iran as well (Yousefi, 1995). The transition from agrarian to predominantly industrial economy had been successful in raising the pace of economic growth in some Asian countries during the recent past. In this paper, the growth of GOP has been analyzed in order to identify the factors that contribute to the change in the economic performance. For the purpose of this study, we have employed the cross- country data. Due to missing observations for many variables, we have used only some selected variables that are associated with the change in the economic performance in the cross-country setting. The main objective of this paper is to demonstrate the utility of Markov models in identifying the role of the selected characteristics in explaining the growth in GOP over time. The advantage of such model is that we can use repeated observations to identify the factors that attribute to the change in economic performance. Data and Methods We have used the cross-country data for the period 1980-2000. To demonstrate a distinct trend over time, we have taken into consideration data after every five years from the World Development Reports for the years 1980, 1985, 1990, 1995, and 2000. The gross domestic product (GOP) is considered as the outcome variable, which measures the economic performance of a country. The selected variables are: growth of industry (indgr), population growth (popgr), labor force growth (Ifgr), use of energy (eneruse) We have used both linear regression as well as logistic regression models in this study for different time periods. Then a covariate dependent Markov model is used to examine the change in performance in economic growth over time.
Transcript of The Analysis ofTransitions in Economic Performance Using...

The Analysis of Transitions in Economic Performance Using Covariate DependentMarkov Model
l/Adam Baharum I and M. Ataharul Islam2
ISchool of Mathematical Sciences, Universiti Sains Malaysia11800 Minden,Pulau Pinang, Malaysia
Phone:+60-4-653 3942, Fax: +60-4-657 0910Email: [email protected]
20epartment of Statistics and OR,College of Science, King Saud University
Riyadh, Saudi ArabiaEmail: [email protected]
Abstract.:The GDP or GNP as a measure ofeconomic peljormance ofa country changes continuous~v. We canidentify the factors that precede its ups and downs. For such forecasting. the use of Markov models are not nell',but in this paper, an attempt is made to propose a covariate-dependent Markov model to identify the factors thatcontribute to the estimation of transition probabilities. The proposed model is employed to estimate the transitionprobabilities, the factors that contribute to transitIOn in economic peljormance, and other relevant charactenstics.The cross-country data have been employedfor the period 1980-2000 for fitting the model. This can prOVide ausefUL model for forecasting the economic performance in both developing and developed countries.
Introduction
The measure of GOP depends on several components such as private consumption, investment,government consumption, changes in inventories, total exports and total imports. It is observed by Swamyand Fikkert (2002) that the determinants of economic growth which rely on cross-country growthregressions may be affected by bias from two sources: (i) omitted variables, and simultaneity. The first oneis attributable to country characteristics that affect growth but omitted by the econometricians. The secondone is due to the fact that the determinants of growth of GOP, such as investment in physical capital, mayalso affected by this growth. Currently, there is evidence of relationship between human capitalaccumulation and economic growth. Asteriou and Agiomirgianakis (200 I) demonstrated such relationshipbetween education variables and GOP as well as the causal direction between them for Greece. Similarrelationship was observed in Iran as well (Yousefi, 1995). The transition from agrarian to predominantlyindustrial economy had been successful in raising the pace of economic growth in some Asian countriesduring the recent past.
In this paper, the growth of GOP has been analyzed in order to identify the factors that contributeto the change in the economic performance. For the purpose of this study, we have employed the crosscountry data. Due to missing observations for many variables, we have used only some selected variablesthat are associated with the change in the economic performance in the cross-country setting. The mainobjective of this paper is to demonstrate the utility of Markov models in identifying the role of the selectedcharacteristics in explaining the growth in GOP over time. The advantage of such model is that we can userepeated observations to identify the factors that attribute to the change in economic performance.
Data and Methods
We have used the cross-country data for the period 1980-2000. To demonstrate a distinct trendover time, we have taken into consideration data after every five years from the World DevelopmentReports for the years 1980, 1985, 1990, 1995, and 2000. The gross domestic product (GOP) is consideredas the outcome variable, which measures the economic performance of a country. The selected variablesare: growth of industry (indgr), population growth (popgr), labor force growth (Ifgr), use of energy(eneruse)
We have used both linear regression as well as logistic regression models in this study fordifferent time periods. Then a covariate dependent Markov model is used to examine the change inperformance in economic growth over time.

Linear Regression Model for Economic Growth
The linear regression model for economic growth is presented here. The outcome variable is GDPand the explanatory variables are: growth of industry (indgr), population growth (popgr), labor forcegrowth (lfgr), use of energy (eneruse). We have employed two different sets of models here, one for eachselected year and the other sets of models include the lag variables. The models are shown below for the ithcountry in the jth year:Modella:
GDPij = POj + Plj indgrij + P2j popgrij + P3j Ifgrij + P4j eneruseij + &ij
Modellb:
GDPij =PO) + Plj indgrj_S + P2j popgrj_S + P3j Ifgrj_S + P4j eneruse j-S + &ij
The first model (Model la) considers both the outcome and explanatory variables during the same year forthe selected cOlliltries. However the second model (Model Ib) employs explanatory variables observed fiveyears before the outcome variable. This model is expected to take account of the time-lag in explaining theoutcome variable, GDP.
The results for Model Ia are displayed in Table I. It is evident from Table I that growth ofindustry is positively associated (p<O.O I) during the period 1980-2000 with a steadily increasing effect onthe growth of GOP. Population growth results in the growth of economy but this is significant only in 1980(p<O.IO) and 1990 (p<O.O I). Growth in labor force appears to have no statistical association with growth inGOP. However, use of energy appears to have positive association with economic performance in 1990(p<0.05).
Model Ib uses the 5-year lag between observed GOP and explanatory variables. Table 2 showsthat only growth of industry seems to have positive association with GDP for the years 1985-90 and 19952000.
Logistic Regression Models
To explore the underlying association between growth in GDP and the selected explanatoryvariables, two sets of logistic regression models are fitted in this section. Let us define the followingdichotomous variables for the ith country in year j:
Yij = 0, if GDPij < 3.2 percent
Yij = 1, if GOPij 2:: 3.2 percent
Then let us defme the following models:
Model2a:
g(Xij) =
POj + Plj indgrij + P2j popgrij + P3j lfgrij + P4j eneruseij + &ij.
Model2b:
g(Xij-S) =
POj + Plj indgrj_5 + P2j popgrj_5 + P3j Ifgrj_5 + P4j eneruse j-5 + &ij'
Then the logistic regression models for both 2a and 2b are:Model2a:
2

eg(Xij)
p(Yij =1/ X ij )= --g(-X-..-)1+ e U
Model2b:
g(Xij-S)p(y.. = 11 X·· 5)= _e _
lJ lJ- g(X.-s)l+e U
Table 3 shows the estimates for Model 2a. It is clearly observed from the results that growth of industry hasbeen positively associated with for all the years dW'ing 1980-2000 (p<O.O 1). The impact of growth ongrowth ofGDP appears to exert the largest impacts in the years 1990 and 2000. Similarly, growth of laborforce shows statistically significant positive association with growth in GDP for the years 1990 and 1995(p<0.05). However, growth in population appears to have negative association in 1995 (p<0.05). Use ofenergy is associated positively with growth in GDP in 1990 (p<0.05).
Model 2b confirms the result that growth of industry increases the growth of GDP during theperiods 1980-85, 1985-90 and 1995-2000 (p<O.O I). However, all other selected variables do not show anystatistically significant association with the outcome variable.
Markov Model
The covariate dependent Markov model was proposed by Muenz and Rubinstein (1985) and thenIslam, Chowdhury and Baharum (2003) extended the model for higher order. Let us give a brief overviewof the model here from Muenz and Rubinstein and Islam, Chowdhury and Baharum. See these papers formore details.
Let us consider a two state Markov chain for a discrete time binary sequence as follows:
where /'rOO = 1-/'r0 I and /'rIO = l-/'rll . Here, 0 and I are the two possible outcomes of a dependent
variable, Y. Each row of the above transition probability matrix provides a model on the basis of
conditional probabilities. For instance, the probability of a transition from 0 at time t) -I to I at time t) is
/'r01 = P(Y) = 1/ Y)_I = 0) and similarly the probability ofa transition from I at time t)-1 to 1 at time
t) is /'rll = P(Y) = 1/ Y)-l = 1). It is evident that /'rOO + /'r01 = 1and similarly /'rIO + /'rll = 1.
For covariate dependence, let us define the following notations:
Xi = ll, Xi I, , X ip J= vector of covariates for the ith person;
/36 = lfJoo, /301, , /3op J = vector of parameters for the transition from 0,
/3i = lfJlO' /311, , /31 PJ = vector of parameters forthe transition from I.
Then the transition probabilities can be defmed in terms offw1ction of the covariates as follows:
Model for Increase in the growth of GDP
3
n'xef/O
Jrol(Yj =lIYj - 1 =O,X)= [XX ,and1+ e 0
Model for Decrease in the growth of GDP
fJ 'Xe 1Jrll (Yj =0/ Yj _ 1 = 1, X) = , T
1+ efJ1A:Table 5 shows the summary of the results for both increase and decrease in the growth of GDP forcovariate dependent Markov models. As expected, growth of industry is positively associated with increasein GDP growth and negatively associated with decrease in GDP growth during the period 1980-2000.Similarly, increased growth in labor force appears to have negative association, while the opposite is truefor the model on decrease in GDP growth. Use of energy appears to have significant association at 10percent level.
Summary and Conclusion
This paper examines the factors influencing the change in economic growth of countries. Theeconomic performance of countries may depend on factors related to capital investment, investment onhuman capital accumulation, expenditure on health, and many other factors that are associated directly orindirectly with the economic growth. This paper provides only a preliminary overview of the problemsassociated with the relationship with growth in GDP. The main purpose of this paper is to demonstratedifferent techniques that can be employed to explain such relationships. Due to data limitations, some ofthe important variables could not be used.
In this paper, three different methods have been used: (i) regression models, (ii) logistic regressionmodels, and (iii) Markov models with covariate dependence. First two models take account of both crosssection data as well as data with a lag oftive years. The third models uses the Markov model for explainingthe transitions from low or moderate economic performance to high performance as well as transition fromhigh economic performance to moderate or low performance. It is surprising that in all these models, itappears that growth in industry is the most dominating factor in explaining the growth in GDP. In somemodels, the role of growth in labor force seems to have statistically significant association. For the EastAsian economies, the transition to high performance was preceded by the demographic transitions that ledto high growth of labor force during the period of population momentum. The Markov models reveals thefindings more explicitly due to use of repeated measures of economic performance. It provides two sets ofequations for increase in the growth ofGDP as well as decrease in the growth ofGDP from the same modeland thus the role of variables can be determined for both directions in the change of economic performance.With more detailed data, the advantage of the covariate dependent Markov model will be more precise andobvious.
4

·'
Table I: Regression Model for Estimates of Regression Models for Growth of GDP for Year1980,1985,1990,1995 and 2000.
Estimates (standard error)Variable 1980 1985 1990 1995 2000Intercept
0.80858 0.83301 1.23444*** 0.95373 1.22931 ***(0.70167 ) (0.51638) (0.42579) (0.74983) (0.38210)
Growth ofIndustry 0.47570**'" 0.52173**'" 0.53080"'** 0.52964"''''''' 0.55038"'*",
(0.04325) (0.03162) (0.03443) (0.03977) (0.03010)PopulationGrowth 0.833/4* -0.12925 0.00/79*** -0.39395 -0.05071
(0.49722) (0.39179) (0.00042140) (0.48711) (0.24924)Labor ForceGrowth -0.41322 0.38654 -0.08754 0.49647 0.09998
(0.49053) (0.38508) (0.14535) (0.50052) (0.23716)Energy in Use(percapita) -0.00015486 0.00018287** -0.0000238 1 0.00013866 0.00003298
(0.00010384) (0.00009097) 0.00007162 (0.00012298) (0.00006546)
••• Significant at I % level •• Significant at 5% level • Significant at 10% level
Table 2 : Regression Model for Estimates of Regression Models for Growth of GDP during the Period1980-1985,1985-1990,1990-1995 and 1995-2000.
Estimates (standard error)Variable 1980-1985 1985-1990 1990-1995 1995-2000Intercept
2.19365 2.94733*** 1.82865 2.41922***(l.l1311) (0.91451) ( 1.53763) (0.79922)
Growth of Industry0.34073 0.30810*** 0.13861 0.18851 *"''''
(0.06949) (0.05461) (0.12556) (0.04239)Population Growth
0.64148 -0.93755 0.00175 -0.22683(0.76319) (0.67394) (0.00145) (0.51920)
Labor Force Growth-0.83000 0.24039 0.20549 0.28121(0.75429) (0.66343) (0.52906) (0.53349)
Energy in Use(percapita) -0.00011388 -0.00006818 -0.00010532 0.00007276
(0.000 16172) (0.00015756) 0.00026058 (0.00013108)
... Significant at 1% level •• Significant at 5% level • Significant at 10% level
5
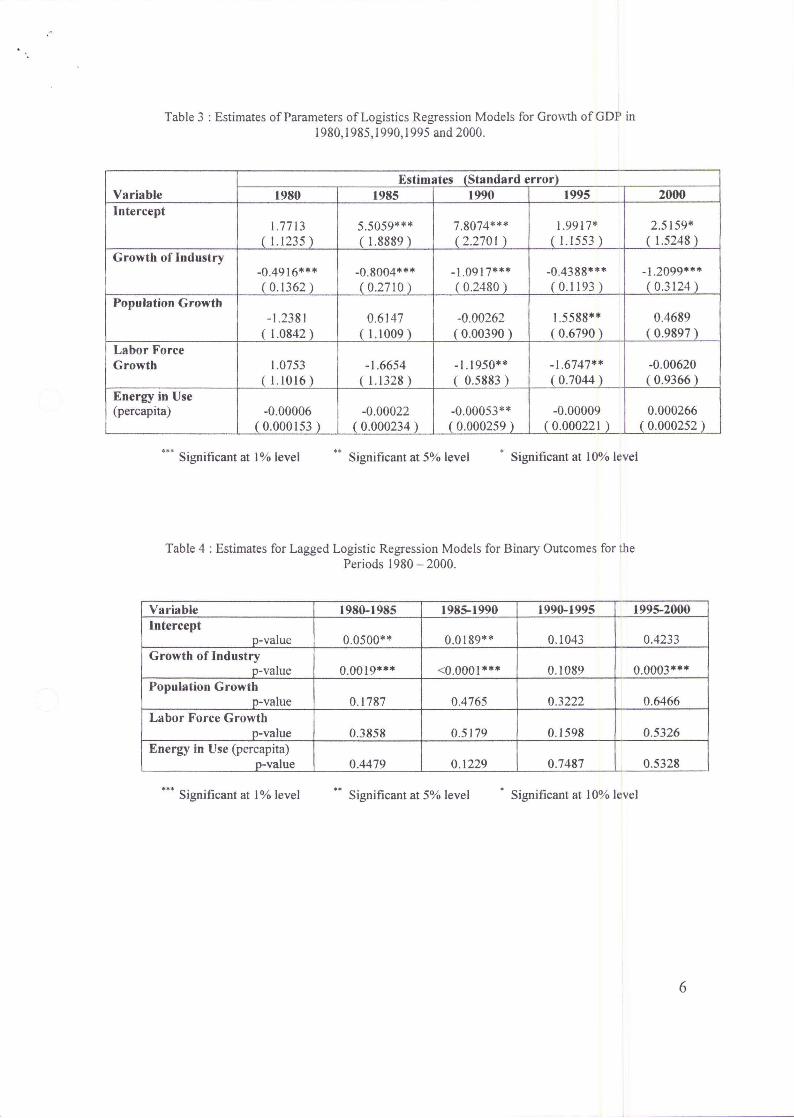
Table 3 : Estimates of Parameters of Logistics Regression Models for Growth ofGDP in1980,1985,1990,1995 and 2000.
Estimates (Standard error)Variable 1980 1985 1990 1995 2000Intercept
1.7713 5.5059*** 7.8074*** 1.9917* 2.5159*( 1.1235 ) ( 1.8889) (2.2701 ) ( 1.1553 ) ( 1.5248)
Growth of Industry-0.4916*"'* -0.8004*** -1.0917*"'* -0.4388*** -1.2099"'**(0.1362 ) (0.2710 ) (0.2480 ) (0.1193 ) ( 0.3124 )
Population Growth-1.2381 0.6147 -0.00262 1.5588** 0.4689
( 1.0842) ( 1.1009) (0.00390 ) (0.6790 ) ( 0.9897)Labor ForceGrowth 1.0753 -1.6654 -1.1950** -1.6747** -0.00620
( 1.1016) (1.1328) ( 0.5883) ( 0.7044 ) (0.9366 )Energy in Use(percapita) -0.00006 -0.00022 -0.00053** -0.00009 0.000266
(0.000153 ) (0.000234 ) (0.000259 ) (0.000221 ) (0.000252 )
••• Significant at I% level •• Significant at 5% level • Significant at 10% level
Table 4 : Estimates for Lagged Logistic Regression Models for Binary Outcomes for thePeriods 1980 - 2000.
Variable 1980-1985 1985-1990 1990-1995 1995-2000Intercept
p-value 0.0500** 0.0189** 0.1043 0.4233Growth of Industry
p-value 0.0019*** <0.0001*** 0.1089 0.0003***Population Growth
p-value 0.1787 0.4765 0.3222 0.6466Labor Force Growth
p-value 0.3858 0.5179 0.1598 0.5326Energy in Use (percapita)
p-value 0.4479 0.1229 0.7487 0.5328
... Significant at 1% level •• Significant at 5% level • Significant at 10% level
6

Table 5: Covariate Dependent Markov Model for Increasing and Decreasing in the Growth ofGDP for thePeriod 1980-2000.
Estimates (Standard Error)Variables Increase DecreaseIntercept
-2.0669*** 2.9073***(0.6567 ) (0.8925 )
Growth of Industry-0.2007*** 0.1208**(0.0532 ) (0.0538 )
Population Growth-0.00568 0.00116
(0.00493 ) (0.00245 )Labor Force Growth
0.6919*** -1.0248***(0.2261 ) ( 0.2983)
Energy in Use (percapita)0.000268* 0.000054
(0.000159 ) (0.000139 )
••• Significant at I% level
References
•• Significant at 5% level • Significant at 10% level
1. A. V. Swamy & B. Fikkert, Estimating the Contributions of Capital and Labor to ODP: AnInstrumental Variable Approach, Eco. Dev. & Cultural Change (2002), 693 - 708.
2. D. Asteriou, G. M. Agiomirgianakis, Human Capital and Economic Growth Time SeriesEvidence from Greece, Journal of Policy Modelling 23 (200 I), 481-489.
3. L.R. Muenz, and L.V Rubinstein, Markov Models for Covariate Dependence of BinarySequences. Biometrics, 41 (1985), 91- I0 I.
4. M. A. Islam, R. 1. Chowdury & A. Baharum, A Higher Order Markov Model for AnalyzingCovariate Dependence, National Conference Mgmt Sci. and Operations Research 2003 (2003),25-33.
5. M. G. Yousefi, The Role of Education in Economic Development of Iran: An EmpiricalInvestigation, ASIAN Eco. Review (1995),24 - 35.
7


![SEISMIC PERFORMANCE AND ECONOMIC …SEISMIC PERFORMANCE AND ECONOMIC FEASIBILITY ... ... 4]](https://static.fdocuments.us/doc/165x107/5e730ef63a752763c8260684/seismic-performance-and-economic-seismic-performance-and-economic-feasibility-.jpg)