The AHRQ Hospital Survey on Patient Safety Culture: A Tool to Plan
22
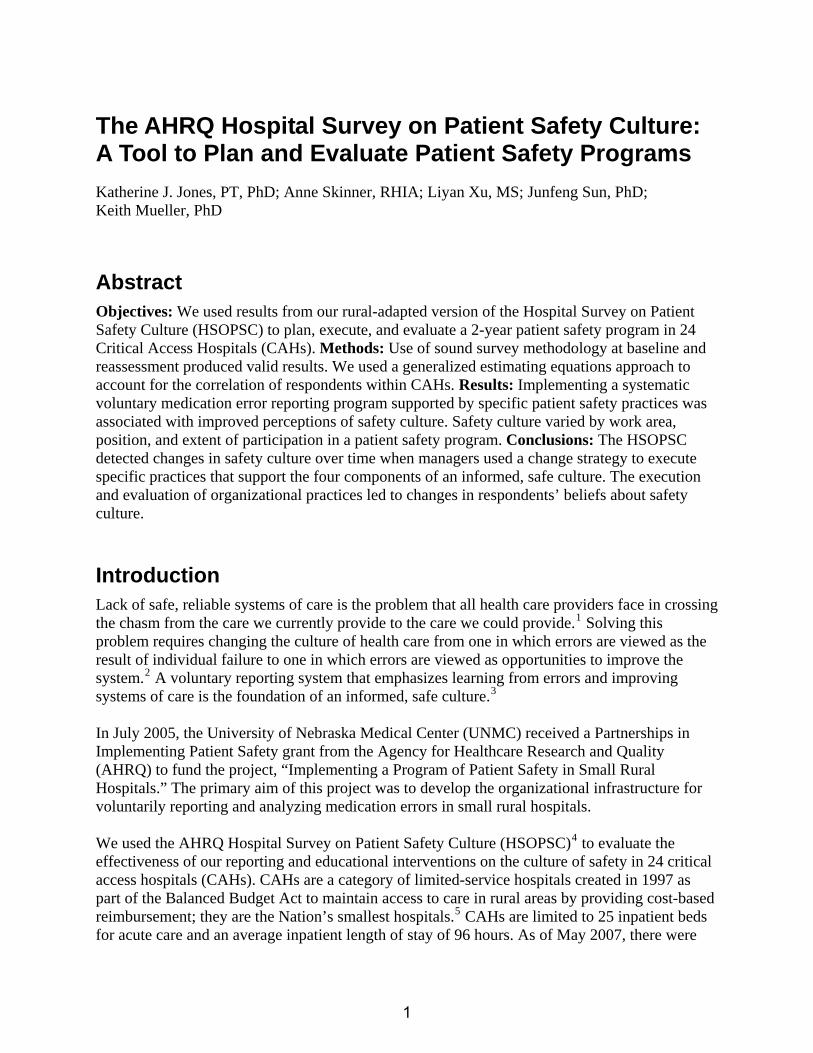
The AHRQ Hospital Survey on Patient Safety Culture: A Tool to Plan and Evaluate Patient Safety Programs Katherine J. Jones, PT, PhD; Anne Skinner, RHIA; Liyan Xu, MS; Junfeng Sun, PhD; Keith Mueller, PhD Abstract Objectives: We used results from our rural-adapted version of the Hospital Survey on Patient Safety Culture (HSOPSC) to plan, execute, and evaluate a 2-year patient safety program in 24 Critical Access Hospitals (CAHs). Methods: Use of sound survey methodology at baseline and reassessment produced valid results. We used a generalized estimating equations approach to account for the correlation of respondents within CAHs. Results: Implementing a systematic voluntary medication error reporting program supported by specific patient safety practices was associated with improved perceptions of safety culture. Safety culture varied by work area, position, and extent of participation in a patient safety program. Conclusions: The HSOPSC detected changes in safety culture over time when managers used a change strategy to execute specific practices that support the four components of an informed, safe culture. The execution and evaluation of organizational practices led to changes in respondents’ beliefs about safety culture. Introduction Lack of safe, reliable systems of care is the problem that all health care providers face in crossing the chasm from the care we currently provide to the care we could provide. 1 Solving this problem requires changing the culture of health care from one in which errors are viewed as the result of individual failure to one in which errors are viewed as opportunities to improve the system. 2 A voluntary reporting system that emphasizes learning from errors and improving systems of care is the foundation of an informed, safe culture. 3 In July 2005, the University of Nebraska Medical Center (UNMC) received a Partnerships in Implementing Patient Safety grant from the Agency for Healthcare Research and Quality (AHRQ) to fund the project, “Implementing a Program of Patient Safety in Small Rural Hospitals.” The primary aim of this project was to develop the organizational infrastructure for voluntarily reporting and analyzing medication errors in small rural hospitals. We used the AHRQ Hospital Survey on Patient Safety Culture (HSOPSC) 4 to evaluate the effectiveness of our reporting and educational interventions on the culture of safety in 24 critical access hospitals (CAHs). CAHs are a category of limited-service hospitals created in 1997 as part of the Balanced Budget Act to maintain access to care in rural areas by providing cost-based reimbursement; they are the Nation’s smallest hospitals. 5 CAHs are limited to 25 inpatient beds for acute care and an average inpatient length of stay of 96 hours. As of May 2007, there were 1
Transcript of The AHRQ Hospital Survey on Patient Safety Culture: A Tool to Plan
The AHRQ Hospital Survey on Patient Safety Culture: A Tool to Plan and Evaluate Patient Safety Programs Katherine J. Jones, PT, PhD; Anne Skinner, RHIA; Liyan Xu, MS; Junfeng Sun, PhD; Keith Mueller, PhD
Abstract Objectives: We used results from our rural-adapted version of the Hospital Survey on Patient Safety Culture (HSOPSC) to plan, execute, and evaluate a 2-year patient safety program in 24 Critical Access Hospitals (CAHs). Methods: Use of sound survey methodology at baseline and reassessment produced valid results. We used a generalized estimating equations approach to account for the correlation of respondents within CAHs. Results: Implementing a systematic voluntary medication error reporting program supported by specific patient safety practices was associated with improved perceptions of safety culture. Safety culture varied by work area, position, and extent of participation in a patient safety program. Conclusions: The HSOPSC detected changes in safety culture over time when managers used a change strategy to execute specific practices that support the four components of an informed, safe culture. The execution and evaluation of organizational practices led to changes in respondents’ beliefs about safety culture.
Introduction Lack of safe, reliable systems of care is the problem that all health care providers face in crossing the chasm from the care we currently provide to the care we could provide.1 Solving this problem requires changing the culture of health care from one in which errors are viewed as the result of individual failure to one in which errors are viewed as opportunities to improve the system.2 A voluntary reporting system that emphasizes learning from errors and improving systems of care is the foundation of an informed, safe culture.3 In July 2005, the University of Nebraska Medical Center (UNMC) received a Partnerships in Implementing Patient Safety grant from the Agency for Healthcare Research and Quality (AHRQ) to fund the project, “Implementing a Program of Patient Safety in Small Rural Hospitals.” The primary aim of this project was to develop the organizational infrastructure for voluntarily reporting and analyzing medication errors in small rural hospitals. We used the AHRQ Hospital Survey on Patient Safety Culture (HSOPSC)4 to evaluate the effectiveness of our reporting and educational interventions on the culture of safety in 24 critical access hospitals (CAHs). CAHs are a category of limited-service hospitals created in 1997 as part of the Balanced Budget Act to maintain access to care in rural areas by providing cost-based reimbursement; they are the Nation’s smallest hospitals.5 CAHs are limited to 25 inpatient beds for acute care and an average inpatient length of stay of 96 hours. As of May 2007, there were
1
1,283 CAHs,6 representing approximately one-fourth of the community hospitals in the Nation.7 CAHs are characterized by limited resources and low patient volume.8 The primary objective of this paper is to demonstrate how the AHRQ HSOPSC can be used to plan and evaluate patient safety interventions across CAHs. A secondary aim is to demonstrate that safety culture varies by work area and position across this sample of the Nation’s smallest hospitals. Defining a Culture of Safety The various definitions of safety culture9, 10 contain several common elements. Safety culture refers to the enduring and shared beliefs and practices of organization members regarding the organization’s willingness to detect and learn from errors. The Institute of Medicine (IOM)11 states that a culture of safety in health care requires three elements: 1. A belief that although health care processes are high risk, they can be designed to prevent
failure. 2. A commitment at the organizational level to detect and learn from errors. 3. An environment that is perceived as just because managers discipline only when an
employee knowingly increases risk to patients and peers.12 A culture of safety is present in high-reliability organizations, which are characterized by complex, risky processes but very low error rates. Such organizations achieve high reliability, because they are preoccupied with failure, sensitive to how each team member affects a process, allow those who are most knowledgeable about a process to make decisions, and resist the temptation to blame individuals for errors within complex processes.13 Components of Culture Efforts to assess safety culture are based on the organizational psychology perspective, which views safety culture as shared beliefs and practices that can be categorized, measured, and changed.9 Reason categorized a culture of safety into four components, which reflect his assertion that an informed culture is a safe culture.3 These components identify the beliefs and practices present in an organization that is informed about risks and hazards and takes action to become safe. Fundamentally, a safe organization depends on the willingness of front-line workers to report their errors and near-misses; organizational practices support a reporting culture. This willingness of workers to report depends on their belief that management will support and reward reporting and that discipline occurs based on risk-taking12; organizational practices support a just culture. The willingness of workers to report also depends on their belief that authority patterns relax when safety information is exchanged because those with authority respect the knowledge of front-line workers; organizational practices support a flexible culture. Ultimately, the willingness of workers to report depends on their belief that the organization will analyze reported information and then implement appropriate change; organizational practices support a learning culture. The interaction of these four components results in an informed, safe organization that is highly reliable. We recognized that the organizational beliefs and practices associated with these components of culture are assessed by the HSOPSC.
2
Assessing Safety Culture Achieving an informed, safe culture depends on how leaders at all levels of an organization obtain, use, and disseminate information.14, 15 Consequently, to identify areas of culture in need of improvement, increase awareness of patient safety concepts, evaluate the effectiveness of patient safety interventions over time, and conduct internal and external benchmarking, organizations must assess safety culture at the unit/department level and at the organizational level.16 Internal comparisons require assessment using the unit/department and position as the unit of analysis to allow organizations to prioritize interventions by unit and department. External comparisons allow organizations to identify how their culture may differ from that of others and to prioritize organization-wide improvement efforts.17 AHRQ established the HSOPSC Comparative Database to enable hospitals that administer this survey to conduct valid external comparisons by using standardized data.18 The biggest challenge in assessing culture is to establish a link between safety culture and patient outcomes.16, 19, 20 When assessing culture, organizations must follow specific processes to obtain valid results. These processes include selecting an appropriate survey instrument, using effective and unbiased data collection procedures, and using the survey results to plan targeted interventions. All health care organizations face challenges when independently administering a safety culture survey. Inappropriate sampling, bias in data collection procedures (e.g., administering the survey in a group setting), and respondent concerns about confidentiality can result in poor response rates and useless results.16 The limited resources in CAHs make it especially difficult for them to independently administer and analyze a safety culture survey and take action to improve systems. Methods Study Design and Population In the fall of 2005, we conducted the HSOPSC in 24 CAHs to obtain a baseline assessment of their cultures of safety and to raise awareness about safety culture. We used the results to create benchmarks and plan educational activities to address components of culture in need of improvement. In the spring of 2007, 21 of these 24 CAHs chose to participate in a reassessment using the HSOPSC. In both years, we conducted a mailed, self-administered survey of all eligible personnel in the participating CAHs. Eligible personnel included those employees for whom the survey was intended: those with direct patient contact, those whose work directly affects patient care, physicians and mid-level providers, and those who identify themselves as supervisors, managers, or administrators.4 This paper focuses on the HSOPSC results for the 21 CAHs that participated in the baseline assessment and reassessment. These CAHs serve 21 counties that had a median 2006 population of 5,317.21 They are all nonprofit, and 12 are county-owned. Implementing Practices to Support a Reporting Culture Since the primary aim of our project was to develop the organizational infrastructure for voluntarily reporting and analyzing medication errors, we trained personnel in the 24 CAHs to use MEDMARX®, the Internet-based, anonymous medication error-reporting program operated by the United States Pharmacopeia.22 MEDMARX uses standardized classifications of the
3

severity, type, cause(s) of the error, and phase of the medication use system in which the error originated. CAH personnel used this standardized taxonomy and MEDMARX tools to analyze their medication errors from a systems perspective and to compare their data with data from hospitals of similar and larger sizes. Prior to implementing MEDMARX, these CAHs did not report and analyze near misses or categorize errors by phase of origination or cause. We chose MEDMARX to provide the infrastructure for reporting medication errors because it embodies the characteristics of successful voluntary error reporting systems.3 In addition, because MEDMARX is Internet-based, we were able to remotely monitor reporting for accuracy and provide assistance with data analysis to multiple CAHs. Use of Baseline Assessment Through monthly telephone conference calls, quarterly newsletters, and workshops, we engaged and educated CAH personnel about the components of an informed, safe culture in response to the results of the baseline survey. The 21 CAHs that participated in the baseline survey and reassessment used the MEDMARX reporting program. However, only 17 CAHs chose to participate in followup safety culture educational activities. We combined didactic presentations with team-based action planning and opportunities to perform desired practices, such as a mock root cause analysis (RCA). We partnered with the Nebraska Hospital Association and the national Quality Improvement Organization Support Center to disseminate lessons learned. We assisted six CAHs to conduct RCAs within their organizations to further model this practice that supports a learning culture. The key interventions we used to build on the MEDMARX reporting program and support the just, flexible, and learning components of an informed, safe culture are available on our Web site (www.unmc.edu/rural/patient-safety/) and are listed below. Interventions to Support a Just Culture • Education regarding the nature of human error and organizational accidents.3 • Education regarding the concept of just culture.12 • Education regarding the concept that the same individual who is responsible for employee
discipline should not collect and analyze safety information.3 • Tool: algorithm for determining the blameworthiness of unsafe acts.3
Interventions to Support a Flexible Culture • Education regarding teamwork knowledge, skills (e.g., leadership, communication, situation
monitoring, and mutual support), and beliefs.23 • Tools: team huddles, team briefs, team debriefs, Patient Safety Leadership WalkRounds™
and safety briefings.23, 24 Interventions to Support a Learning Culture
• Education regarding individual RCA and aggregate RCA.25 • Education regarding use of MEDMARX charts and graphs to analyze errors.
4
• Education regarding evidence-based safe medication practices using resources from the Institute for Safe Medication Practice.
• Tool: Mapping the medication use process. Adapting the HSOPSC for CAHs AHRQ funded the development of the HSOPSC to provide health care organizations with a valid tool to assess safety culture. The HSOPSC consists of 42 items that are categorized in 12 dimensions (Table 1). Seven dimensions measure safety culture at the unit/department level: supervisor/manager expectations and actions promoting patient safety, organizational learning, teamwork within departments, communication openness, feedback and communication about error, nonpunitive response to error, and staffing. Three dimensions measure safety culture at the hospital level: hospital management support for patient safety, teamwork across hospital departments, and hospital handoffs and transitions. Two dimensions are outcome measures: overall perceptions of safety and frequency of events reported. Two additional items are outcome measures: patient safety grade and number of events reported. Pilot testing ensured that the survey had sound psychometric properties.4 We modified the demographic sections of the survey to fit the CAH environment and protect the anonymity of survey respondents in these small organizations. We modified the Customized Excel™ Data Tool26 available for entering and analyzing the survey data to incorporate these demographic changes and to allow sorting by work area or position when there were five or more respondents per category, rather than 11 or more as required by the original tool. We posted these adaptations of the survey and data tool on our Web site and shared them with quality improvement organizations that used the HSOPSC in their work with rural hospitals. Survey Administration and Data Preparation We followed the same process to administer the survey in 2005 and 2007. Our key contact at each hospital provided a list of names and positions of personnel potentially eligible to participate in the survey. We reviewed the list to verify each participant’s eligibility according to the categories described above. We assigned a unique identification number to each participant to track response rate and hospital affiliation and to prevent duplicate entries. We assigned each participant the same identification number in both years to track change at the respondent level. Following the Dillman tailored design methodology,27 each survey participant received four contacts at 2-week intervals. The first contact was a personalized letter from the hospital administrator, explaining the purpose of the survey and the importance of participation. The second contact was a personalized envelope that contained a cover letter, the survey, and a postage-paid envelope addressed to a post office box at UNMC. The third contact was a personalized postcard thanking participants for their response and reminding them to return the survey if they had not already done so. The fourth contact was tailored to response status: respondents received a personalized envelope that contained a thank-you letter; nonrespondents received a cover letter encouraging response, the survey, and the postage-paid return envelope. All survey materials were mailed in bulk at 2-week intervals to our key contact for internal
5
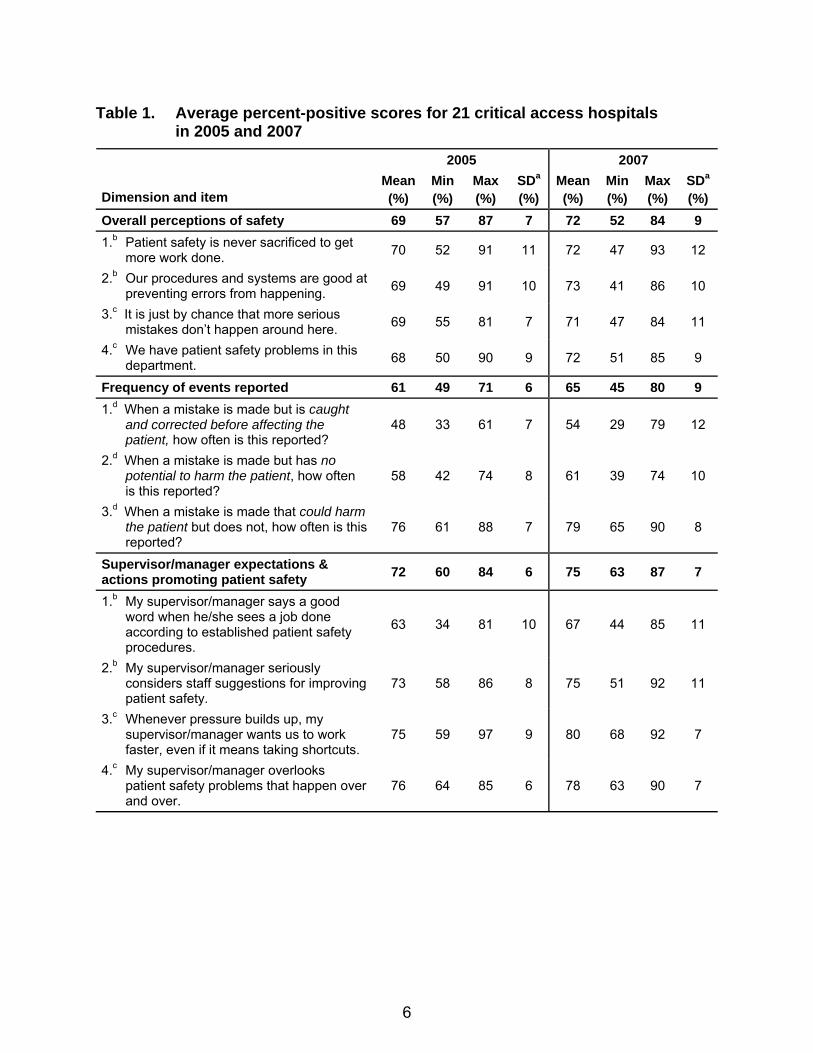
Table 1. Average percent-positive scores for 21 critical access hospitals in 2005 and 2007
2005 2007
Dimension and item Mean(%)
Min (%)
Max (%)
SDa (%)
Mean (%)
Min (%)
Max(%)
SDa (%)
Overall perceptions of safety 69 57 87 7 72 52 84 9 1.b Patient safety is never sacrificed to get
more work done. 70 52 91 11 72 47 93 12
2.b Our procedures and systems are good at preventing errors from happening. 69 49 91 10 73 41 86 10
3.c It is just by chance that more serious mistakes don’t happen around here. 69 55 81 7 71 47 84 11
4.c We have patient safety problems in this department. 68 50 90 9 72 51 85 9
Frequency of events reported 61 49 71 6 65 45 80 9 1.d When a mistake is made but is caught
and corrected before affecting the patient, how often is this reported?
48 33 61 7 54 29 79 12
2.d When a mistake is made but has no potential to harm the patient, how often is this reported?
58 42 74 8 61 39 74 10
3.d When a mistake is made that could harm the patient but does not, how often is this reported?
76 61 88 7 79 65 90 8
Supervisor/manager expectations & actions promoting patient safety 72 60 84 6 75 63 87 7
1.b My supervisor/manager says a good word when he/she sees a job done according to established patient safety procedures.
63 34 81 10 67 44 85 11
2.b My supervisor/manager seriously considers staff suggestions for improving patient safety.
73 58 86 8 75 51 92 11
3.c Whenever pressure builds up, my supervisor/manager wants us to work faster, even if it means taking shortcuts.
75 59 97 9 80 68 92 7
4.c My supervisor/manager overlooks patient safety problems that happen over and over.
76 64 85 6 78 63 90 7
6
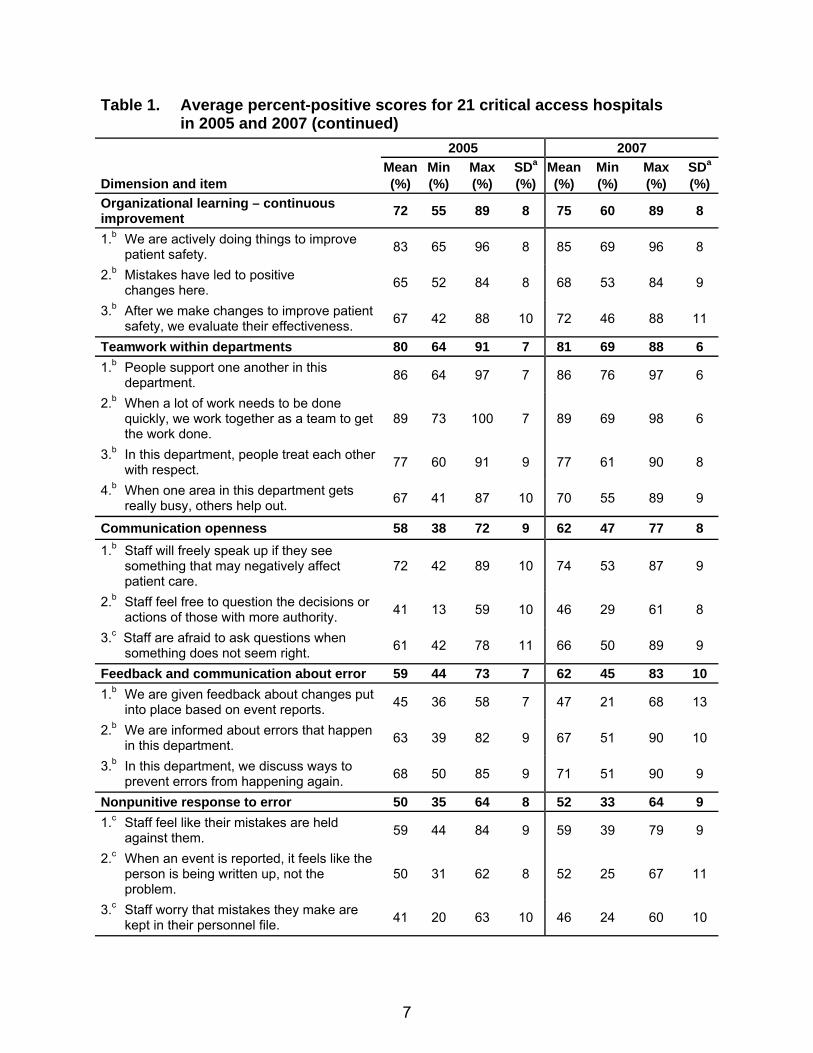
Table 1. Average percent-positive scores for 21 critical access hospitals in 2005 and 2007 (continued)
2005 2007
Dimension and item Mean(%)
Min (%)
Max (%)
SDa
(%) Mean (%)
Min (%)
Max (%)
SDa (%)
Organizational learning – continuous improvement 72 55 89 8 75 60 89 8
1.b We are actively doing things to improve patient safety. 83 65 96 8 85 69 96 8
2.b Mistakes have led to positive changes here. 65 52 84 8 68 53 84 9
3.b After we make changes to improve patient safety, we evaluate their effectiveness. 67 42 88 10 72 46 88 11
Teamwork within departments 80 64 91 7 81 69 88 6 1.b People support one another in this
department. 86 64 97 7 86 76 97 6
2.b When a lot of work needs to be done quickly, we work together as a team to get the work done.
89 73 100 7 89 69 98 6
3.b In this department, people treat each other with respect. 77 60 91 9 77 61 90 8
4.b When one area in this department gets really busy, others help out. 67 41 87 10 70 55 89 9
Communication openness 58 38 72 9 62 47 77 8 1.b Staff will freely speak up if they see
something that may negatively affect patient care.
72 42 89 10 74 53 87 9
2.b Staff feel free to question the decisions or actions of those with more authority. 41 13 59 10 46 29 61 8
3.c Staff are afraid to ask questions when something does not seem right. 61 42 78 11 66 50 89 9
Feedback and communication about error 59 44 73 7 62 45 83 10 1.b We are given feedback about changes put
into place based on event reports. 45 36 58 7 47 21 68 13
2.b We are informed about errors that happen in this department. 63 39 82 9 67 51 90 10
3.b In this department, we discuss ways to prevent errors from happening again. 68 50 85 9 71 51 90 9
Nonpunitive response to error 50 35 64 8 52 33 64 9 1.c Staff feel like their mistakes are held
against them. 59 44 84 9 59 39 79 9
2.c When an event is reported, it feels like the person is being written up, not the problem.
50 31 62 8 52 25 67 11
3.c Staff worry that mistakes they make are kept in their personnel file. 41 20 63 10 46 24 60 10
7
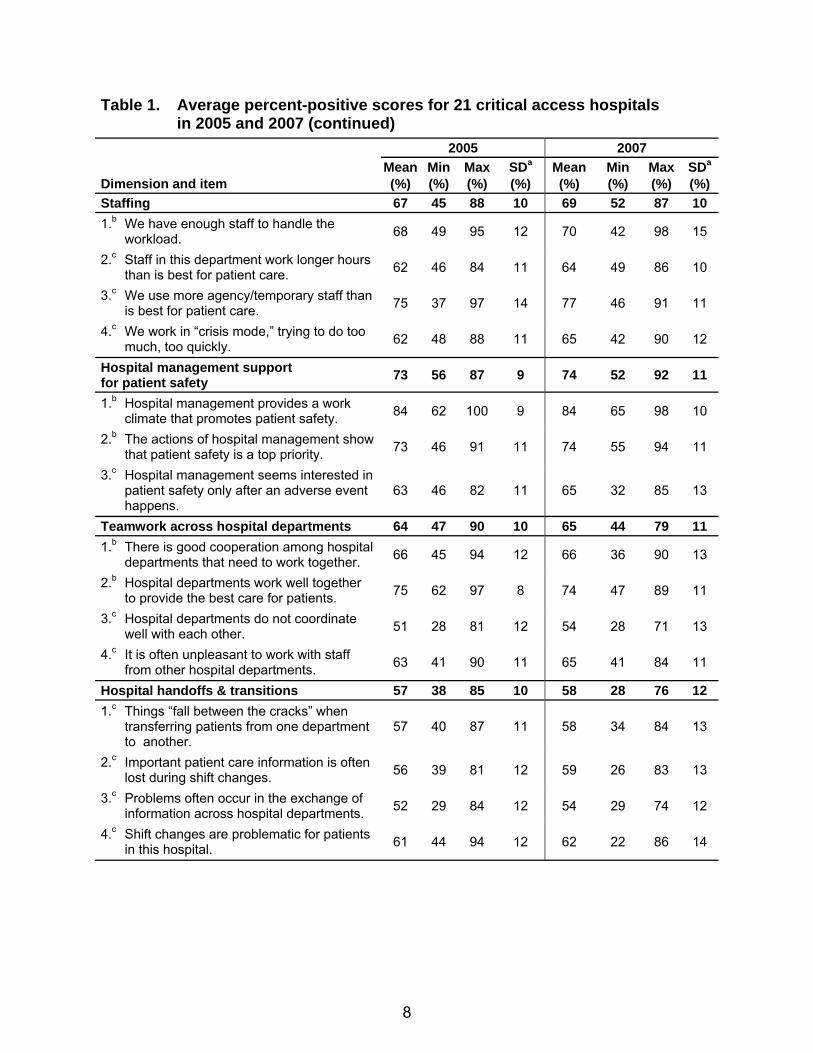
Table 1. Average percent-positive scores for 21 critical access hospitals in 2005 and 2007 (continued)
2005 2007
Dimension and item Mean(%)
Min (%)
Max(%)
SDa (%)
Mean (%)
Min (%)
Max(%)
SDa (%)
Staffing 67 45 88 10 69 52 87 10 1.b We have enough staff to handle the
workload. 68 49 95 12 70 42 98 15
2.c Staff in this department work longer hours than is best for patient care. 62 46 84 11 64 49 86 10
3.c We use more agency/temporary staff than is best for patient care. 75 37 97 14 77 46 91 11
4.c We work in “crisis mode,” trying to do too much, too quickly. 62 48 88 11 65 42 90 12
Hospital management support for patient safety 73 56 87 9 74 52 92 11
1.b Hospital management provides a work climate that promotes patient safety. 84 62 100 9 84 65 98 10
2.b The actions of hospital management show that patient safety is a top priority. 73 46 91 11 74 55 94 11
3.c Hospital management seems interested in patient safety only after an adverse event happens.
63 46 82 11 65 32 85 13
Teamwork across hospital departments 64 47 90 10 65 44 79 11 1.b There is good cooperation among hospital
departments that need to work together. 66 45 94 12 66 36 90 13
2.b Hospital departments work well together to provide the best care for patients. 75 62 97 8 74 47 89 11
3.c Hospital departments do not coordinate well with each other. 51 28 81 12 54 28 71 13
4.c It is often unpleasant to work with staff from other hospital departments. 63 41 90 11 65 41 84 11
Hospital handoffs & transitions 57 38 85 10 58 28 76 12 1.c Things “fall between the cracks” when
transferring patients from one department to another.
57 40 87 11 58 34 84 13
2.c Important patient care information is often lost during shift changes. 56 39 81 12 59 26 83 13
3.c Problems often occur in the exchange of information across hospital departments. 52 29 84 12 54 29 74 12
4.c Shift changes are problematic for patients in this hospital. 61 44 94 12 62 22 86 14
8
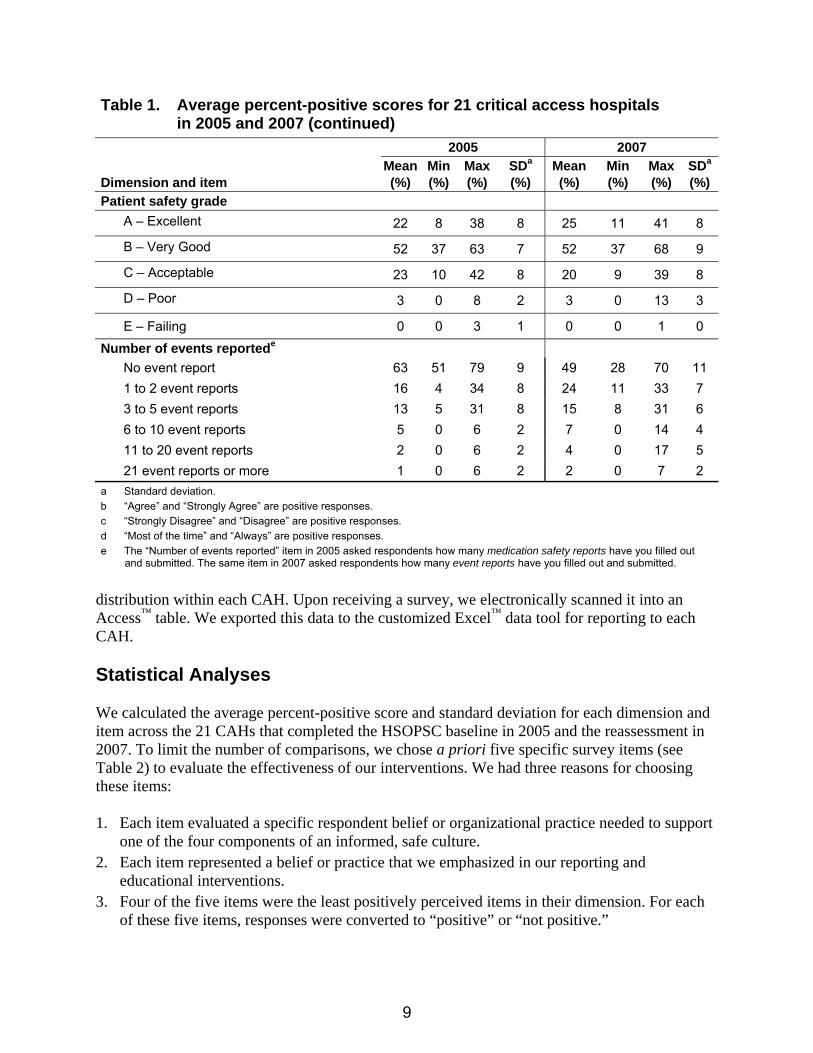
Table 1. Average percent-positive scores for 21 critical access hospitals in 2005 and 2007 (continued)
2005 2007
Dimension and item Mean(%)
Min (%)
Max(%)
SDa (%)
Mean (%)
Min (%)
Max(%)
SDa (%)
Patient safety grade A – Excellent 22 8 38 8 25 11 41 8
B – Very Good 52 37 63 7 52 37 68 9
C – Acceptable 23 10 42 8 20 9 39 8
D – Poor 3 0 8 2 3 0 13 3
E – Failing 0 0 3 1 0 0 1 0 Number of events reportede No event report 63 51 79 9 49 28 70 11 1 to 2 event reports 16 4 34 8 24 11 33 7 3 to 5 event reports 13 5 31 8 15 8 31 6 6 to 10 event reports 5 0 6 2 7 0 14 4 11 to 20 event reports 2 0 6 2 4 0 17 5 21 event reports or more 1 0 6 2 2 0 7 2 a Standard deviation. b “Agree” and “Strongly Agree” are positive responses. c “Strongly Disagree” and “Disagree” are positive responses. d “Most of the time” and “Always” are positive responses. e The “Number of events reported” item in 2005 asked respondents how many medication safety reports have you filled out
and submitted. The same item in 2007 asked respondents how many event reports have you filled out and submitted.
distribution within each CAH. Upon receiving a survey, we electronically scanned it into an Access™ table. We exported this data to the customized Excel™ data tool for reporting to each CAH. Statistical Analyses We calculated the average percent-positive score and standard deviation for each dimension and item across the 21 CAHs that completed the HSOPSC baseline in 2005 and the reassessment in 2007. To limit the number of comparisons, we chose a priori five specific survey items (see Table 2) to evaluate the effectiveness of our interventions. We had three reasons for choosing these items: 1. Each item evaluated a specific respondent belief or organizational practice needed to support
one of the four components of an informed, safe culture. 2. Each item represented a belief or practice that we emphasized in our reporting and
educational interventions. 3. Four of the five items were the least positively perceived items in their dimension. For each
of these five items, responses were converted to “positive” or “not positive.”
9

Table 2. Odds ratio of responding positively in 2007 compared to 2005 for five survey items
Survey item Odds ratio (95% CI) P-value
When a mistake is made but is caught and corrected before affecting the patient, how often is this reported?b (Evidence of a reporting culture)
1.30 (1.14, 1.47) <0.0001a
Staff worry that mistakes they make are kept in their personnel file.c (Evidence of a just culture) 1.24 (1.04, 1.46) 0.01a
Staff feel free to question the decisions and actions of those with more authority.d (Evidence of a flexible culture) 1.23 (1.07, 1.41) 0.004a
In this department, we discuss ways to prevent errors from happening again.d (Evidence of a learning culture) 1.08 (0.86, 1.36) 0.51
Mistakes have led to positive changes here.d (Evidence of an informed culture) 1.09 (0.90, 1.32) 0.36
a Significant at P ≤0.01. b “Most of the time” and “Always” are positive responses. c “Strongly Disagree” and “Disagree” are positive responses. d “Agree” and “Strongly Agree” are positive responses.
A logistic regression was used to model the odds ratio (OR) of a respondent reacting positively to an item in 2007 compared with 2005. We used a Bonferroni correction (P = 0.05/5 = 0.01) to control the Type 1 error rate due to the five comparisons. A generalized estimating equations (GEE)28 approach was used to account for the correlation among the data. Specifically, we used alternating logistic regressions (ALR)29 with 1-nested log ORs to account for the repeated measurement of respondents and the clustering of respondents within hospitals. We used the GENMOD procedure in SAS® version 9.1 (SAS Institute, Cary, NC) to fit the model. We used the same five items to compare responses among three work areas and three positions across the 21 CAHs using the 2007 survey data. We used a GEE with an exchangeable covariance structure to account for the correlation of respondents within the same hospitals. We used a Bonferroni correction (P = 0.05/3 = 0.017) to control the Type 1 error rate for the comparisons among the three work areas and three positions. We used a t-test to compare the average change in the percent-positive score for each dimension from 2005 to 2007, according to whether a hospital participated in our safety culture educational activities. We did not adjust for multiple testing in this comparison. Coding of Open-Ended Comments The final section of the HSOPSC invites respondents to write comments about patient safety, error, or event reporting in their hospital. We used an integrated approach to coding these comments by starting with a literature-based organizing framework and then identifying themes that emerged from the experiences of the respondents. 30 All comments were coded by consensus of two researchers (Jones and Skinner).
10

Results Response and Demographics In the 2005 baseline assessment, there were 1,995 eligible employees in the 21 CAHs, and we obtained an aggregate response rate of 70.4 percent. In the 2007 reassessment, there were 1,963 eligible employees, and we obtained an aggregate response rate of 70.0 percent. The range of the number of respondents from the 21 hospitals was 29 to 160 in 2005 and 28 to 144 in 2007. The range of response rates from the 21 hospitals was 51 to 92 percent in 2005 and 58 to 95 percent in 2007. Respondent demographics by position were consistent in 2005 and 2007: nurses, 35 and 37 percent, respectively; allied health personnel, 28 and 24 percent, respectively; support personnel, 12 and 12 percent, respectively; administrators/managers, 12 and 12 percent, respectively; providers, 7 and 6 percent, respectively; and other, 7 and 8 percent, respectively. Respondent demographics by work area were also consistent in 2005 and 2007: acute/skilled care, 32 and 31 percent, respectively; dietary, 12 and 13 percent, respectively; no specific department, 8 and 12 percent, respectively; laboratory, 7 and 6 percent, respectively; surgery/OR, 5 and 5 percent, respectively; pharmacy, 2 and 2 percent, respectively; and other, 8 and 7 percent, respectively. Approximately 87 percent of respondents reported having direct patient contact in both years. Six hospitals had attached long-term care units; 99 respondents (5 percent) in 2005 and 63 respondents (3 percent) in 2007 identified their primary department as long-term care. Since this paper focuses on hospital culture, we excluded long-term care respondents from these results. Safety Culture Similarities and Variations Across Hospitals The pattern of percent-positive responses by dimension and item across hospitals was similar in 2005 and 2007 (Table 1). The most positively perceived dimensions were teamwork within departments, 80 and 81 percent, respectively; hospital management support for patient safety, 73 and 74 percent, respectively; organizational learning, 72 and 75 percent, respectively; and supervisor/manager expectations and actions promoting patient safety, 72 and 75 percent, respectively. The least positively perceived dimensions were nonpunitive response to error, 50 and 52 percent, respectively; hospital handoffs and transitions, 57 and 58 percent, respectively; communication openness, 58 and 62 percent, respectively; and feedback and communication about error, 59 and 62 percent, respectively. The least positively perceived items were the same in both years: from the communication openness dimension, “staff feel free to question the decisions and actions of those with more authority,” 41 and 46 percent, respectively; and from the nonpunitive response to error dimension, “staff worry that mistakes they make are kept in their personnel file,” 41 and 46 percent, respectively. Hospital-level dimensions across the CAHs were less uniform (had greater standard deviations) than unit/department level dimensions.
11
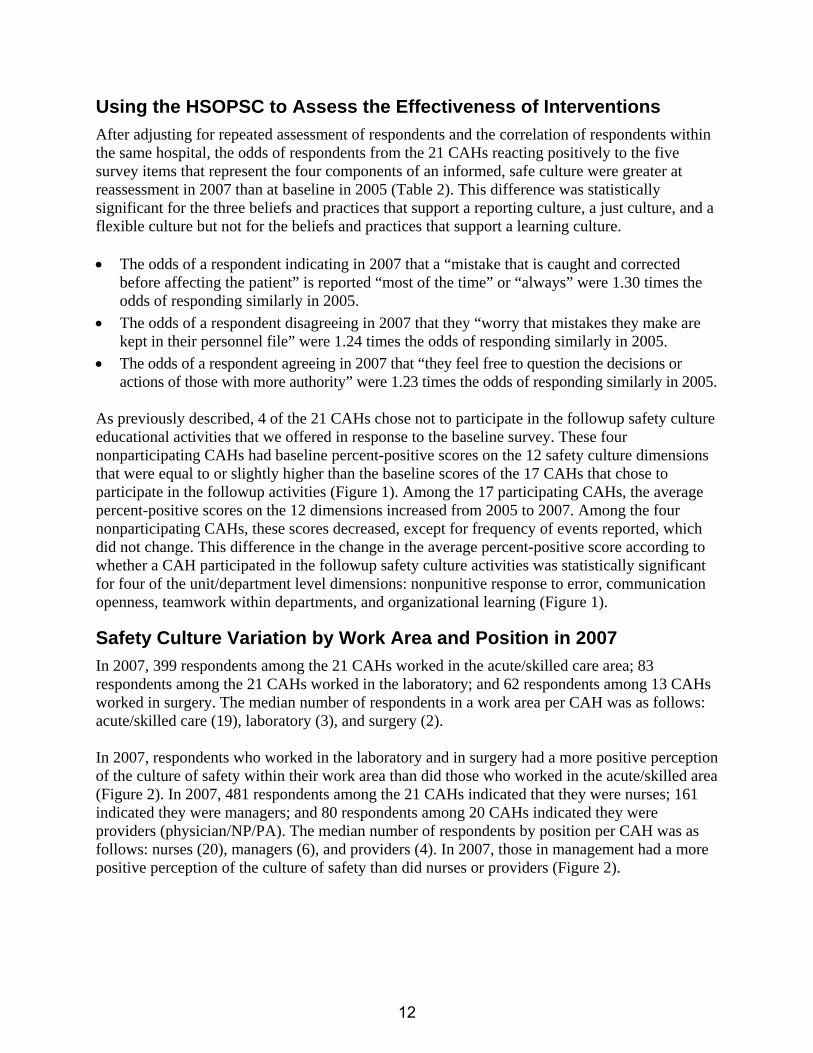
Using the HSOPSC to Assess the Effectiveness of Interventions After adjusting for repeated assessment of respondents and the correlation of respondents within the same hospital, the odds of respondents from the 21 CAHs reacting positively to the five survey items that represent the four components of an informed, safe culture were greater at reassessment in 2007 than at baseline in 2005 (Table 2). This difference was statistically significant for the three beliefs and practices that support a reporting culture, a just culture, and a flexible culture but not for the beliefs and practices that support a learning culture. • The odds of a respondent indicating in 2007 that a “mistake that is caught and corrected
before affecting the patient” is reported “most of the time” or “always” were 1.30 times the odds of responding similarly in 2005.
• The odds of a respondent disagreeing in 2007 that they “worry that mistakes they make are kept in their personnel file” were 1.24 times the odds of responding similarly in 2005.
• The odds of a respondent agreeing in 2007 that “they feel free to question the decisions or actions of those with more authority” were 1.23 times the odds of responding similarly in 2005.
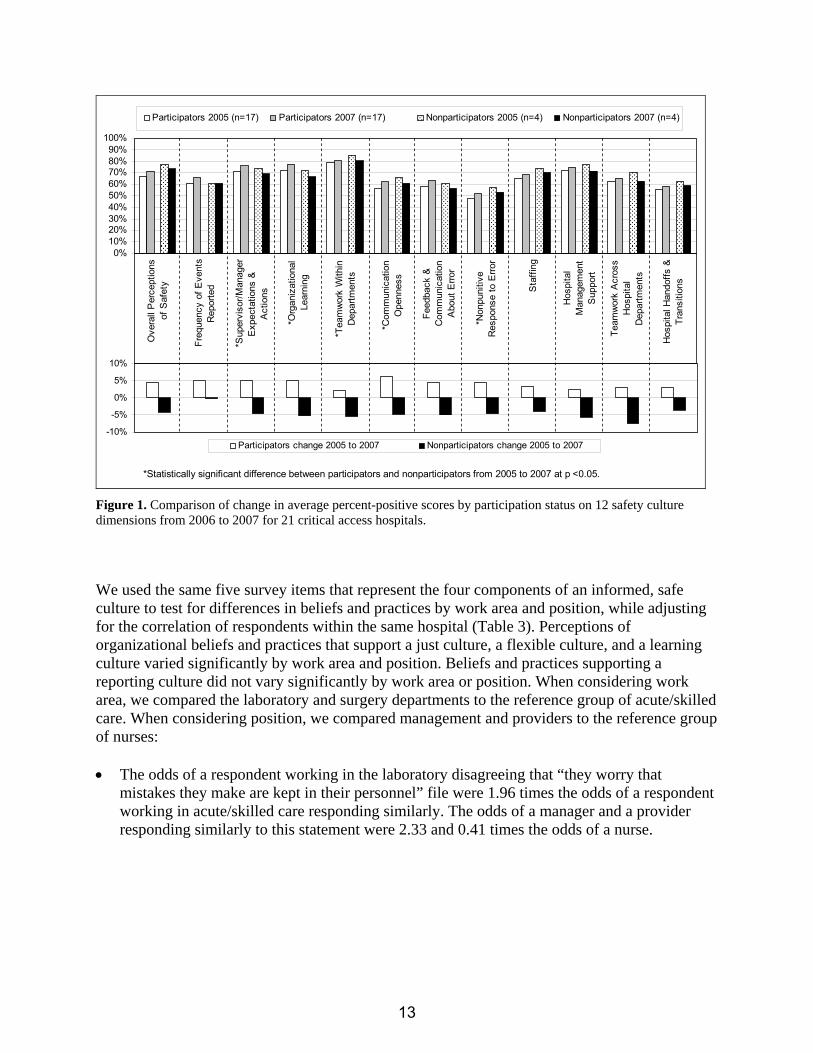
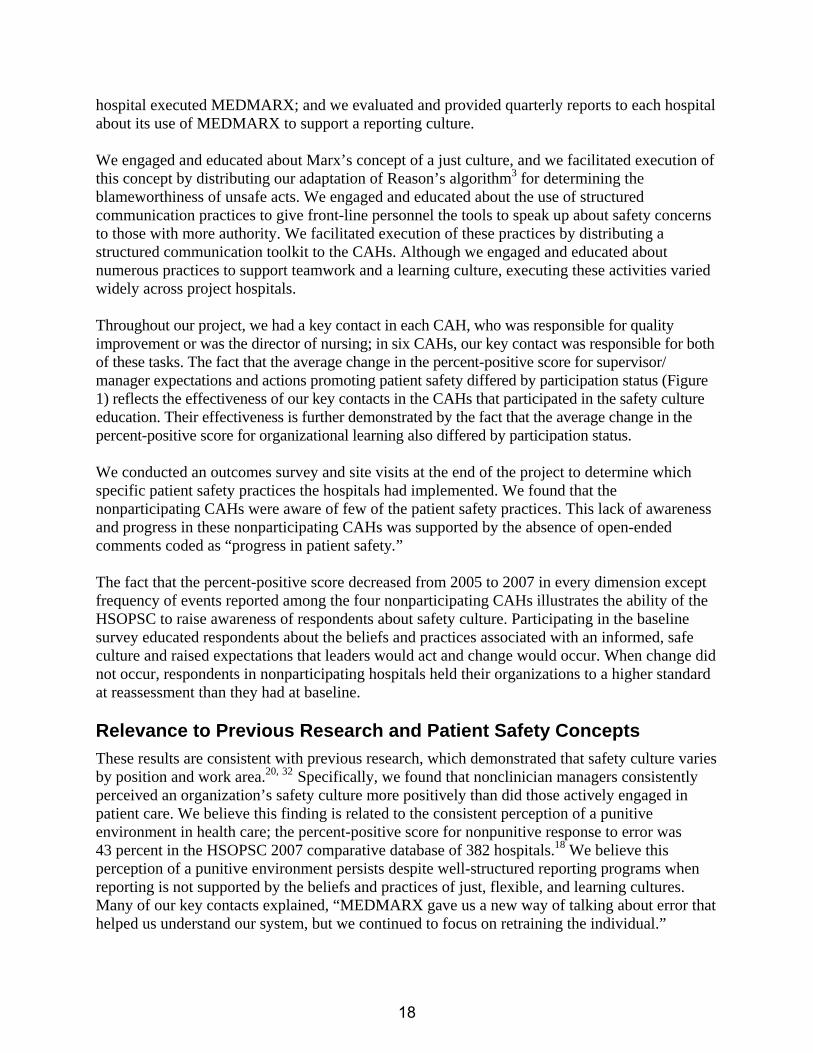
As previously described, 4 of the 21 CAHs chose not to participate in the followup safety culture educational activities that we offered in response to the baseline survey. These four nonparticipating CAHs had baseline percent-positive scores on the 12 safety culture dimensions that were equal to or slightly higher than the baseline scores of the 17 CAHs that chose to participate in the followup activities (Figure 1). Among the 17 participating CAHs, the average percent-positive scores on the 12 dimensions increased from 2005 to 2007. Among the four nonparticipating CAHs, these scores decreased, except for frequency of events reported, which did not change. This difference in the change in the average percent-positive score according to whether a CAH participated in the followup safety culture activities was statistically significant for four of the unit/department level dimensions: nonpunitive response to error, communication openness, teamwork within departments, and organizational learning (Figure 1).
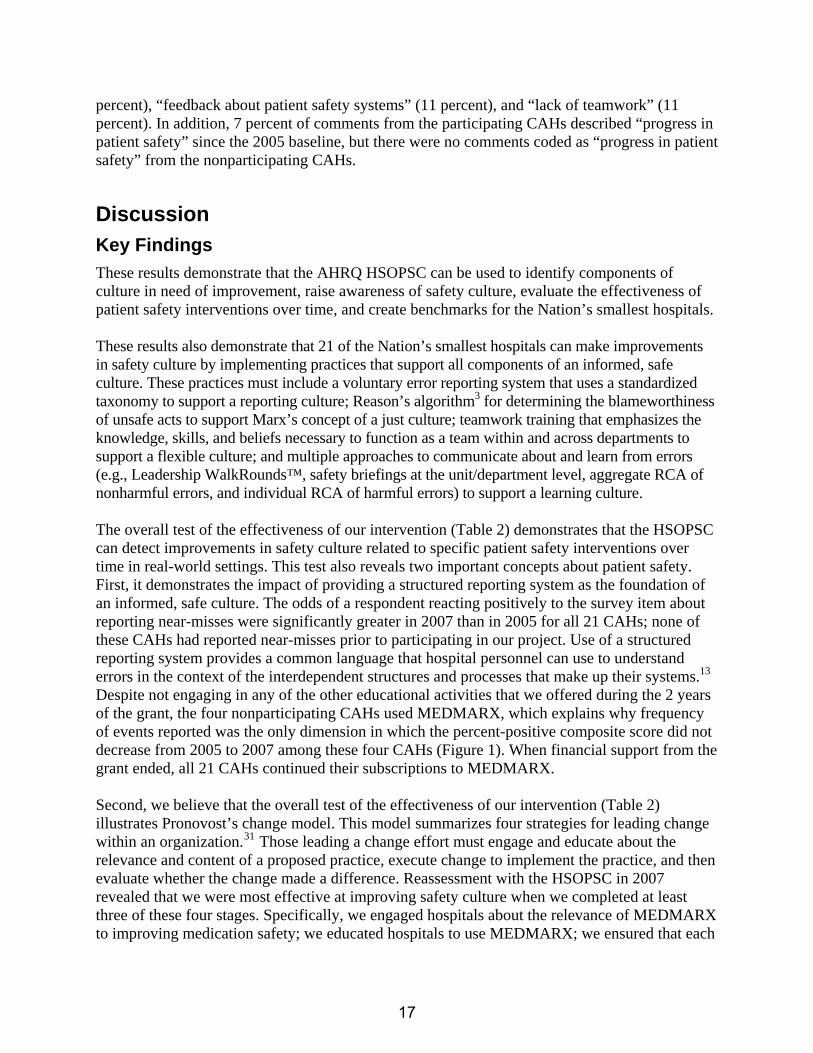
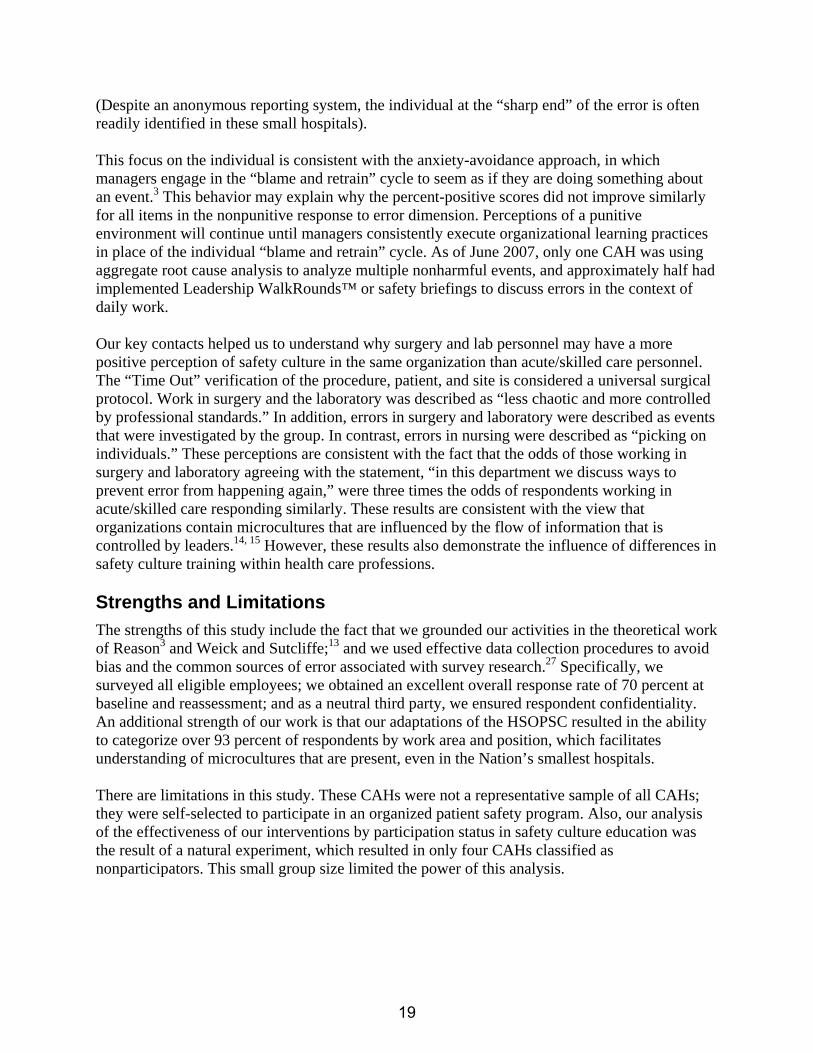
Safety Culture Variation by Work Area and Position in 2007 In 2007, 399 respondents among the 21 CAHs worked in the acute/skilled care area; 83 respondents among the 21 CAHs worked in the laboratory; and 62 respondents among 13 CAHs worked in surgery. The median number of respondents in a work area per CAH was as follows: acute/skilled care (19), laboratory (3), and surgery (2). In 2007, respondents who worked in the laboratory and in surgery had a more positive perception of the culture of safety within their work area than did those who worked in the acute/skilled area (Figure 2). In 2007, 481 respondents among the 21 CAHs indicated that they were nurses; 161 indicated they were managers; and 80 respondents among 20 CAHs indicated they were providers (physician/NP/PA). The median number of respondents by position per CAH was as follows: nurses (20), managers (6), and providers (4). In 2007, those in management had a more positive perception of the culture of safety than did nurses or providers (Figure 2).
12
-10%
-5%
0%
5%
10%
Participators change 2005 to 2007 Nonparticipators change 2005 to 2007
0%10%20%30%40%50%60%70%80%90%
100%O
vera
ll P
erce
ptio
nsof
Saf
ety
Freq
uenc
y of
Eve
nts
Rep
orte
d
*Sup
ervi
sor/M
anag
erE
xpec
tatio
ns &
Act
ions
*Org
aniz
atio
nal
Lear
ning
*Tea
mw
ork
With
inD
epar
tmen
ts
*Com
mun
icat
ion
Ope
nnes
s
Feed
back
&C
omm
unic
atio
nA
bout
Erro
r
*Non
puni
tive
Res
pons
e to
Erro
r
Sta
ffing
Hos
pita
lM
anag
emen
tS
uppo
rt
Team
wor
k A
cros
sH
ospi
tal
Dep
artm
ents
Hos
pita
l Han
doffs
&Tr
ansi
tions
Participators 2005 (n=17) Participators 2007 (n=17) Nonparticipators 2005 (n=4) Nonparticipators 2007 (n=4)
*Statistically significant difference between participators and nonparticipators from 2005 to 2007 at p <0.05. Figure 1. Comparison of change in average percent-positive scores by participation status on 12 safety culture dimensions from 2006 to 2007 for 21 critical access hospitals.
We used the same five survey items that represent the four components of an informed, safe culture to test for differences in beliefs and practices by work area and position, while adjusting for the correlation of respondents within the same hospital (Table 3). Perceptions of organizational beliefs and practices that support a just culture, a flexible culture, and a learning culture varied significantly by work area and position. Beliefs and practices supporting a reporting culture did not vary significantly by work area or position. When considering work area, we compared the laboratory and surgery departments to the reference group of acute/skilled care. When considering position, we compared management and providers to the reference group of nurses: • The odds of a respondent working in the laboratory disagreeing that “they worry that
mistakes they make are kept in their personnel” file were 1.96 times the odds of a respondent working in acute/skilled care responding similarly. The odds of a manager and a provider responding similarly to this statement were 2.33 and 0.41 times the odds of a nurse.
13

Position
Work Area
0%
20%
40%
60%
80%
100%O
vera
ll P
erce
ptio
nsof
Saf
ety
Freq
uenc
y of
Eve
nts
Rep
orte
dS
uper
viso
r/Man
ager
Exp
ecta
tions
&A
ctio
nsO
rgan
izat
iona
lLe
arni
ng
Team
wor
k W
ithin
Dep
artm
ents
Com
mun
icat
ion
Ope
nnes
sFe
edba
ck &
Com
mun
icat
ion
Abo
ut E
rror
Non
puni
tive
Res
pons
e to
Erro
r
Sta
ffing
Man
agem
ent
Sup
port
Team
wor
k A
cros
sH
ospi
tal
Dep
artm
ents
Hos
pita
l Han
doffs
&Tr
ansi
tions
Surgery (n=62) Lab (n=83) Acute/Skilled Care (n=399)
0%
20%
40%
60%
80%
100%
Ove
rall
Perc
eptio
nsof
Saf
ety
Freq
uenc
y of
Even
ts R
epor
ted
Supe
rvis
or/M
anag
erEx
pect
atio
ns &
Actio
nsO
rgan
izat
iona
lLe
arni
ng
Team
wor
k W
ithin
Dep
artm
ents
Com
mun
icat
ion
Ope
nnes
sFe
edba
ck &
Com
mun
icat
ion
Abou
t Err
orN
onpu
nitiv
eR
espo
nse
to E
rror
Staf
fing
Man
agem
ent
Supp
ort
Team
wor
k Ac
ross
Hos
pita
lD
epar
tmen
tsH
ospi
tal H
ando
ffs &
Tran
sitio
ns
Providers (n=80) Management (n=161) Nurses (n=481)
Figure 2. Comparison of percent-positive scores on 12 safety culture dimensions by work area and position, 2007.
14
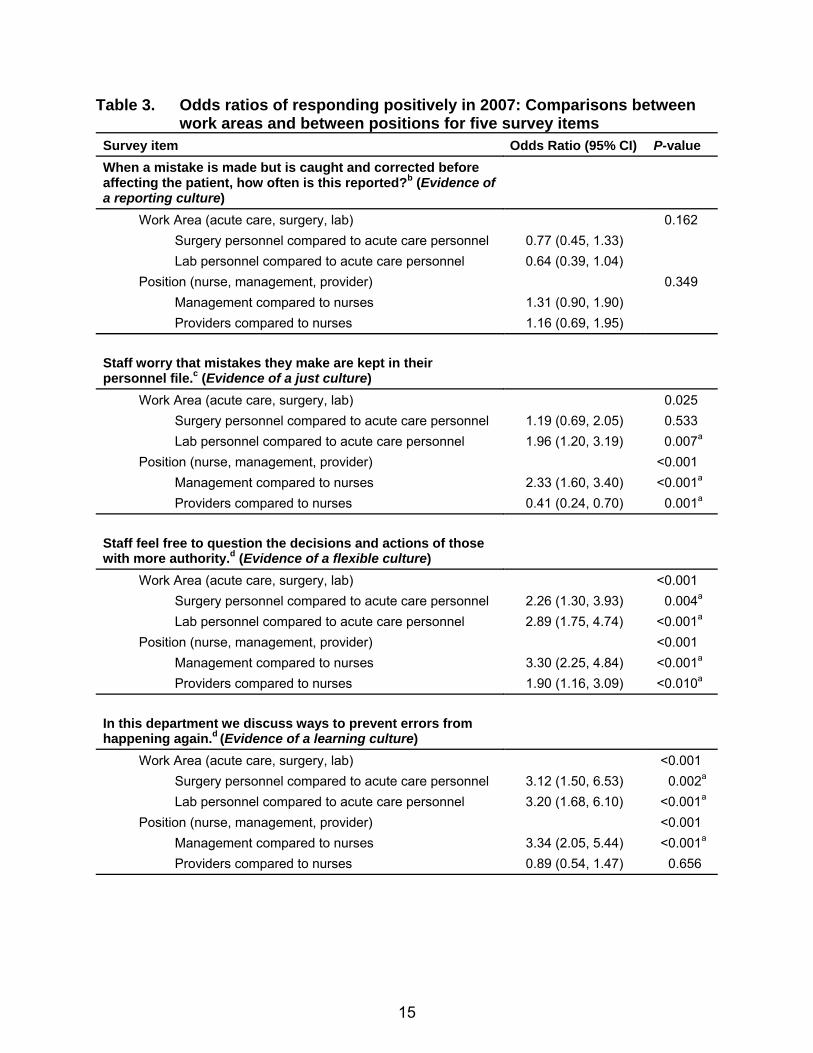
Table 3. Odds ratios of responding positively in 2007: Comparisons between work areas and between positions for five survey items Survey item Odds Ratio (95% CI) P-value When a mistake is made but is caught and corrected before affecting the patient, how often is this reported?b (Evidence of a reporting culture)
Work Area (acute care, surgery, lab) 0.162 Surgery personnel compared to acute care personnel 0.77 (0.45, 1.33) Lab personnel compared to acute care personnel 0.64 (0.39, 1.04) Position (nurse, management, provider) 0.349 Management compared to nurses 1.31 (0.90, 1.90) Providers compared to nurses 1.16 (0.69, 1.95) Staff worry that mistakes they make are kept in their personnel file.c (Evidence of a just culture)
Work Area (acute care, surgery, lab) 0.025 Surgery personnel compared to acute care personnel 1.19 (0.69, 2.05) 0.533 Lab personnel compared to acute care personnel 1.96 (1.20, 3.19) 0.007a Position (nurse, management, provider) <0.001 Management compared to nurses 2.33 (1.60, 3.40) <0.001a Providers compared to nurses 0.41 (0.24, 0.70) 0.001a Staff feel free to question the decisions and actions of those with more authority.d (Evidence of a flexible culture)
Work Area (acute care, surgery, lab) <0.001 Surgery personnel compared to acute care personnel 2.26 (1.30, 3.93) 0.004a Lab personnel compared to acute care personnel 2.89 (1.75, 4.74) <0.001a Position (nurse, management, provider) <0.001 Management compared to nurses 3.30 (2.25, 4.84) <0.001a Providers compared to nurses 1.90 (1.16, 3.09) <0.010a In this department we discuss ways to prevent errors from happening again.d (Evidence of a learning culture)
Work Area (acute care, surgery, lab) <0.001 Surgery personnel compared to acute care personnel 3.12 (1.50, 6.53) 0.002a Lab personnel compared to acute care personnel 3.20 (1.68, 6.10) <0.001a Position (nurse, management, provider) <0.001 Management compared to nurses 3.34 (2.05, 5.44) <0.001a Providers compared to nurses 0.89 (0.54, 1.47) 0.656
15
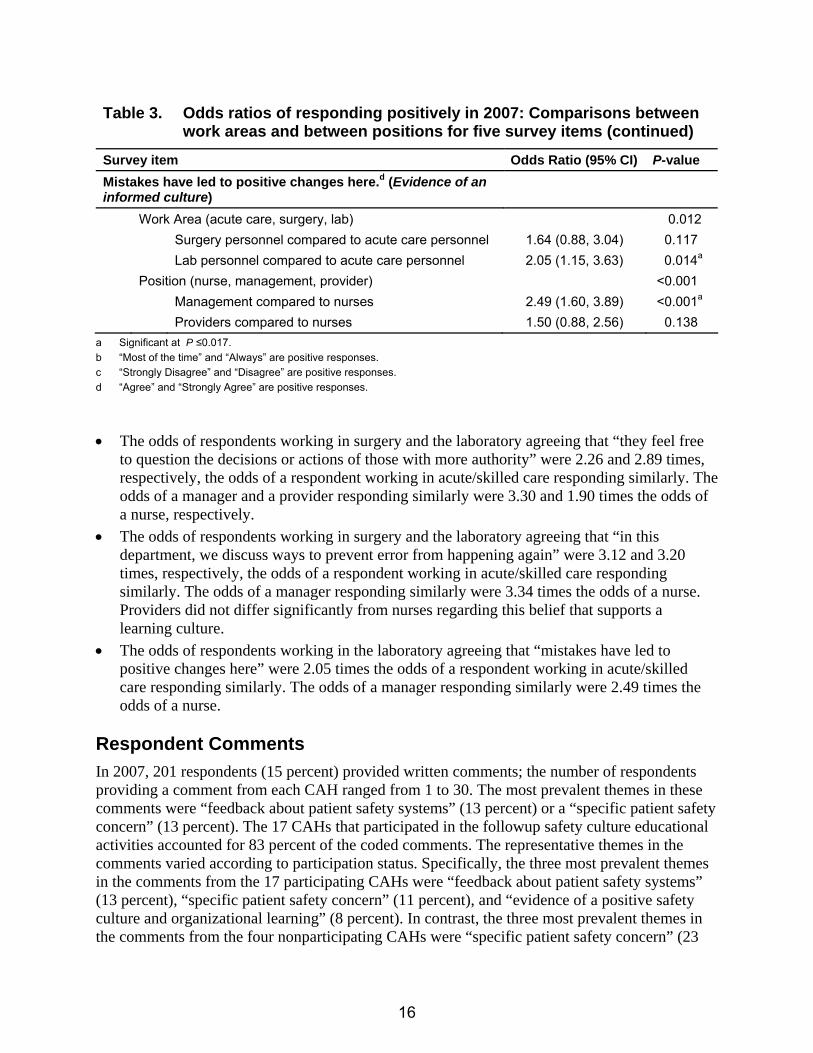
Table 3. Odds ratios of responding positively in 2007: Comparisons between work areas and between positions for five survey items (continued)
Survey item Odds Ratio (95% CI) P-value Mistakes have led to positive changes here.d (Evidence of an informed culture) Work Area (acute care, surgery, lab) 0.012 Surgery personnel compared to acute care personnel 1.64 (0.88, 3.04) 0.117 Lab personnel compared to acute care personnel 2.05 (1.15, 3.63) 0.014a Position (nurse, management, provider) <0.001 Management compared to nurses 2.49 (1.60, 3.89) <0.001a Providers compared to nurses 1.50 (0.88, 2.56) 0.138
a Significant at P ≤0.017. b “Most of the time” and “Always” are positive responses. c “Strongly Disagree” and “Disagree” are positive responses. d “Agree” and “Strongly Agree” are positive responses.
• The odds of respondents working in surgery and the laboratory agreeing that “they feel free to question the decisions or actions of those with more authority” were 2.26 and 2.89 times, respectively, the odds of a respondent working in acute/skilled care responding similarly. The odds of a manager and a provider responding similarly were 3.30 and 1.90 times the odds of a nurse, respectively.
• The odds of respondents working in surgery and the laboratory agreeing that “in this department, we discuss ways to prevent error from happening again” were 3.12 and 3.20 times, respectively, the odds of a respondent working in acute/skilled care responding similarly. The odds of a manager responding similarly were 3.34 times the odds of a nurse. Providers did not differ significantly from nurses regarding this belief that supports a learning culture.
• The odds of respondents working in the laboratory agreeing that “mistakes have led to positive changes here” were 2.05 times the odds of a respondent working in acute/skilled care responding similarly. The odds of a manager responding similarly were 2.49 times the odds of a nurse.
Respondent Comments In 2007, 201 respondents (15 percent) provided written comments; the number of respondents providing a comment from each CAH ranged from 1 to 30. The most prevalent themes in these comments were “feedback about patient safety systems” (13 percent) or a “specific patient safety concern” (13 percent). The 17 CAHs that participated in the followup safety culture educational activities accounted for 83 percent of the coded comments. The representative themes in the comments varied according to participation status. Specifically, the three most prevalent themes in the comments from the 17 participating CAHs were “feedback about patient safety systems” (13 percent), “specific patient safety concern” (11 percent), and “evidence of a positive safety culture and organizational learning” (8 percent). In contrast, the three most prevalent themes in the comments from the four nonparticipating CAHs were “specific patient safety concern” (23
16
percent), “feedback about patient safety systems” (11 percent), and “lack of teamwork” (11 percent). In addition, 7 percent of comments from the participating CAHs described “progress in patient safety” since the 2005 baseline, but there were no comments coded as “progress in patient safety” from the nonparticipating CAHs. Discussion Key Findings These results demonstrate that the AHRQ HSOPSC can be used to identify components of culture in need of improvement, raise awareness of safety culture, evaluate the effectiveness of patient safety interventions over time, and create benchmarks for the Nation’s smallest hospitals. These results also demonstrate that 21 of the Nation’s smallest hospitals can make improvements in safety culture by implementing practices that support all components of an informed, safe culture. These practices must include a voluntary error reporting system that uses a standardized taxonomy to support a reporting culture; Reason’s algorithm3 for determining the blameworthiness of unsafe acts to support Marx’s concept of a just culture; teamwork training that emphasizes the knowledge, skills, and beliefs necessary to function as a team within and across departments to support a flexible culture; and multiple approaches to communicate about and learn from errors (e.g., Leadership WalkRounds™, safety briefings at the unit/department level, aggregate RCA of nonharmful errors, and individual RCA of harmful errors) to support a learning culture. The overall test of the effectiveness of our intervention (Table 2) demonstrates that the HSOPSC can detect improvements in safety culture related to specific patient safety interventions over time in real-world settings. This test also reveals two important concepts about patient safety. First, it demonstrates the impact of providing a structured reporting system as the foundation of an informed, safe culture. The odds of a respondent reacting positively to the survey item about reporting near-misses were significantly greater in 2007 than in 2005 for all 21 CAHs; none of these CAHs had reported near-misses prior to participating in our project. Use of a structured reporting system provides a common language that hospital personnel can use to understand errors in the context of the interdependent structures and processes that make up their systems.13 Despite not engaging in any of the other educational activities that we offered during the 2 years of the grant, the four nonparticipating CAHs used MEDMARX, which explains why frequency of events reported was the only dimension in which the percent-positive composite score did not decrease from 2005 to 2007 among these four CAHs (Figure 1). When financial support from the grant ended, all 21 CAHs continued their subscriptions to MEDMARX. Second, we believe that the overall test of the effectiveness of our intervention (Table 2) illustrates Pronovost’s change model. This model summarizes four strategies for leading change within an organization.31 Those leading a change effort must engage and educate about the relevance and content of a proposed practice, execute change to implement the practice, and then evaluate whether the change made a difference. Reassessment with the HSOPSC in 2007 revealed that we were most effective at improving safety culture when we completed at least three of these four stages. Specifically, we engaged hospitals about the relevance of MEDMARX to improving medication safety; we educated hospitals to use MEDMARX; we ensured that each
17
hospital executed MEDMARX; and we evaluated and provided quarterly reports to each hospital about its use of MEDMARX to support a reporting culture. We engaged and educated about Marx’s concept of a just culture, and we facilitated execution of this concept by distributing our adaptation of Reason’s algorithm3 for determining the blameworthiness of unsafe acts. We engaged and educated about the use of structured communication practices to give front-line personnel the tools to speak up about safety concerns to those with more authority. We facilitated execution of these practices by distributing a structured communication toolkit to the CAHs. Although we engaged and educated about numerous practices to support teamwork and a learning culture, executing these activities varied widely across project hospitals. Throughout our project, we had a key contact in each CAH, who was responsible for quality improvement or was the director of nursing; in six CAHs, our key contact was responsible for both of these tasks. The fact that the average change in the percent-positive score for supervisor/ manager expectations and actions promoting patient safety differed by participation status (Figure 1) reflects the effectiveness of our key contacts in the CAHs that participated in the safety culture education. Their effectiveness is further demonstrated by the fact that the average change in the percent-positive score for organizational learning also differed by participation status. We conducted an outcomes survey and site visits at the end of the project to determine which specific patient safety practices the hospitals had implemented. We found that the nonparticipating CAHs were aware of few of the patient safety practices. This lack of awareness and progress in these nonparticipating CAHs was supported by the absence of open-ended comments coded as “progress in patient safety.” The fact that the percent-positive score decreased from 2005 to 2007 in every dimension except frequency of events reported among the four nonparticipating CAHs illustrates the ability of the HSOPSC to raise awareness of respondents about safety culture. Participating in the baseline survey educated respondents about the beliefs and practices associated with an informed, safe culture and raised expectations that leaders would act and change would occur. When change did not occur, respondents in nonparticipating hospitals held their organizations to a higher standard at reassessment than they had at baseline. Relevance to Previous Research and Patient Safety Concepts These results are consistent with previous research, which demonstrated that safety culture varies by position and work area.20, 32 Specifically, we found that nonclinician managers consistently perceived an organization’s safety culture more positively than did those actively engaged in patient care. We believe this finding is related to the consistent perception of a punitive environment in health care; the percent-positive score for nonpunitive response to error was 43 percent in the HSOPSC 2007 comparative database of 382 hospitals.18 We believe this perception of a punitive environment persists despite well-structured reporting programs when reporting is not supported by the beliefs and practices of just, flexible, and learning cultures. Many of our key contacts explained, “MEDMARX gave us a new way of talking about error that helped us understand our system, but we continued to focus on retraining the individual.”
18
(Despite an anonymous reporting system, the individual at the “sharp end” of the error is often readily identified in these small hospitals). This focus on the individual is consistent with the anxiety-avoidance approach, in which managers engage in the “blame and retrain” cycle to seem as if they are doing something about an event.3 This behavior may explain why the percent-positive scores did not improve similarly for all items in the nonpunitive response to error dimension. Perceptions of a punitive environment will continue until managers consistently execute organizational learning practices in place of the individual “blame and retrain” cycle. As of June 2007, only one CAH was using aggregate root cause analysis to analyze multiple nonharmful events, and approximately half had implemented Leadership WalkRounds™ or safety briefings to discuss errors in the context of daily work. Our key contacts helped us to understand why surgery and lab personnel may have a more positive perception of safety culture in the same organization than acute/skilled care personnel. The “Time Out” verification of the procedure, patient, and site is considered a universal surgical protocol. Work in surgery and the laboratory was described as “less chaotic and more controlled by professional standards.” In addition, errors in surgery and laboratory were described as events that were investigated by the group. In contrast, errors in nursing were described as “picking on individuals.” These perceptions are consistent with the fact that the odds of those working in surgery and laboratory agreeing with the statement, “in this department we discuss ways to prevent error from happening again,” were three times the odds of respondents working in acute/skilled care responding similarly. These results are consistent with the view that organizations contain microcultures that are influenced by the flow of information that is controlled by leaders.14, 15 However, these results also demonstrate the influence of differences in safety culture training within health care professions. Strengths and Limitations The strengths of this study include the fact that we grounded our activities in the theoretical work of Reason3 and Weick and Sutcliffe;13 and we used effective data collection procedures to avoid bias and the common sources of error associated with survey research.27 Specifically, we surveyed all eligible employees; we obtained an excellent overall response rate of 70 percent at baseline and reassessment; and as a neutral third party, we ensured respondent confidentiality. An additional strength of our work is that our adaptations of the HSOPSC resulted in the ability to categorize over 93 percent of respondents by work area and position, which facilitates understanding of microcultures that are present, even in the Nation’s smallest hospitals. There are limitations in this study. These CAHs were not a representative sample of all CAHs; they were self-selected to participate in an organized patient safety program. Also, our analysis of the effectiveness of our interventions by participation status in safety culture education was the result of a natural experiment, which resulted in only four CAHs classified as nonparticipators. This small group size limited the power of this analysis.
19

Conclusion Our focus on CAHs reflects the IOM’s belief that the health care environment should be safe for all patients.2 We used support from AHRQ to develop a sound methodology for conducting and analyzing the HSOPSC in the Nation’s smallest hospitals. This methodology produces valid results, which we link to the practices required to achieve an informed, safe culture. Reason has asserted that an informed, safe culture must be socially engineered by executing these interacting practices.3 Hospital leaders influence beliefs about organizational culture by supporting front-line managers and workers as they execute these practices. Reporting practices provide a common language for describing error in terms of a system and provide the foundation for an informed, safe culture. Using the taxonomies associated with the MEDMARX voluntary medication error-reporting program resulted in improvements in reporting culture across 21 CAHs. However, a reporting culture must interact with just, flexible, and learning cultures. Consequently only the 17 CAHs that participated in our safety culture educational interventions demonstrated improvements in all dimensions of the survey. Safety culture emerges gradually from sustained attention to engineering the interactions between the practices associated with the four components. In CAHs, directors of nursing and quality improvement must engineer these interactions while often continuing to provide care at the bedside. Consequently, they require support from their senior leaders and education and tools from network hospitals, quality improvement organizations, and other organizations that advocate for rural hospitals. This study exemplifies the type of field-based, mixed-methods research that is necessary to understand how patient safety interventions can change the beliefs and practices that define an organization’s safety culture.17 Acknowledgments Funding was provided by the Agency for Health Care Research and Quality grant number 1 U18 HS015822. We acknowledge the support of Charles Denham, MD, which enabled Katherine Jones to attend the Institute for Healthcare Improvement Patient Safety Officer Executive Development Program. Address correspondence to: Katherine J. Jones, PT, PhD, Assistant Professor, Physical Therapy Education, University of Nebraska Medical Center, 984420 Nebraska Medical Center, Omaha, NE 68198-4420; e-mail: [email protected]
20

References
1. Kohn L, Corrigan J, Donaldson M. (editors.) To err is
human: Building a safer health system. Institute of Medicine. Washington, DC: National Academies Press; 2000.
15. Edmonson AC. Learning from failure in health care: Frequent opportunities, pervasive barriers. Qual Saf Health Care 2004; 13(Suppl II): ii3-ii9.
16. Nieva VF, Sorra J. Safety culture assessment: A tool for improving patient safety in healthcare organizations. Qual Saf Health Care 2003; 12(Suppl II): ii17-ii23.
2. Institute of Medicine. Crossing the quality chasm: A new health system for the 21st century. Washington, DC: National Academies Press; 2001.
3. Reason J. Managing the risks of organizational accidents. Aldershot, UK: Ashgate; 1997.
17. Gaba DM, Singer SJ, Rosen AK. Safety culture: Is the “unit” the right “unit of analysis”? Crit Care Med 2007; 35: 314-316. 4. Sorra JS, Nieva VF. Hospital Survey on Patient Safety
Culture. Rockville, MD; 2004. Agency for Healthcare Research and Quality. Available at:http://www.ahrq.gov/qual/patientsafetyculture/hospcult.pdf
18. Sorra J, Nieva V, Famolaro T, et al. Hospital Survey on Patient Safety Culture: 2007 comparative database report. Rockville, MD: Agency for Healthcare Research and Quality; 2007. Available at: Accessed February 23, 2008. www.ahrq.gov/qual/hospsurveydb/hospsurveydb1.pdf5. Mueller KJ. The Medicare Prescription Drug,
Improvement, and Modernization Act of 2003 (P.L. 108-173): A summary of provisions important to rural health care delivery. RUPRI Center for Rural Health Policy Analysis; Policy Paper P2004-1; 2004.
. Accessed February 23, 2008.
19. Colla JB, Bracken AC, Kinney LM. Measuring patient safety climate: A review of surveys. Qual Saf Health Care 2005; 14: 364-366.
6. Flex Monitoring Team Site. A complete list of critical access hospitals. May 2007. Available at:
20. Huang DT, Clermont G, Sexton JB. Perceptions of safety culture vary across the intensive care units of a single institution. Crit Care Med 2007; 35: 165-176. www.flexmonitoring.org/documents/CAH_LIST_08_
06_07.xls. Accessed February 23, 2008. 21. U.S. Census Bureau Site. American Fact Finder.
Population for all counties in Nebraska, 2006. Available at:
7. American Hospital Association. AHA hospital statistics. Chicago: Health Forum, LLC; 2006. factfinder.census.gov. Accessed
February 23, 2008. 8. Moscovice I, Rosenblatt R. Quality-of-care challenges for rural health. J Rural Health 2000; 16: 168-176. 22. MEDMARX® National Medication Error Database
(database online). United States Pharmacopeia. Available at: 9. Wiegmann DA, Zhang H, von Thaden T, et al. A
synthesis of safety culture and safety climate research. Federal Aviation Administration; 2002 Jun. Technical Report No.: ARL-02-3/FAA-02-2. Contract No. DTFA 01-G-015. Available at:
www.medmarx.com/. Accessed February 23, 2008.
23. TeamSTEPPS™: Strategies and tools to enhance performance and patient safety. Agency for Healthcare Research and Quality, Rockville, MD. Available at: www.humanfactors.uiuc.edu/Reports&PapersPDFs/Te
chReport/02-03.pdf. Accessed February 23, 2008. www.ahrq.gov/qual/teamstepps/. Accessed February 23, 2008. 10. Health and Safety Commission. Organising for safety:
Third report of the human factors study group of ACSNI. Sudbury, UK: HSE Books; 1993.
24. Institute for Healthcare Improvement. Available at: www.ihi.org/IHI/Programs/IMPACTNetwork. Accessed February 23, 2008. 11. Institute of Medicine. Patient safety: Achieving a new
standard of care. Washington, DC: The National Academies Press; 2004.
25. Neily J, Ogrinc G, Mills P, et al. Using aggregate root cause analysis to improve patient safety. Jt Comm J Qual Safe 2003; 29: 434-439. 12. Marx D. Patient safety and the “Just Culture”: A
primer for health care executives. Available at: 26. Premier customized Excel™ data tool. Premier. Available at: http://www.psnet.ahrq.gov/resource.aspx?resourceID=
1582www.premierinc.com/quality-
safety/tools-services/safety/store/#custom-tool. Accessed February 23, 2008. . Accessed February 23, 2008. 13. Weick KE, Sutcliffe KM. Managing the unexpected:
Assuring high performance in an age of complexity. San Francisco: Josey-Bass; 2001.
27. Dillman DA. Mail and internet surveys: The tailored design method. New York: John Wiley & Sons; 2000.
14. Westrum R. A typology of organizational cultures. Qual Saf Health Care 2004; 13: 22-27.
28. Liang KY, Zeger SL. Longitudinal data analysis using generalized linear models. Biometrika 1986; 73: 13-22.
21

29. Carey V, Zeger S, Diggle P. Modeling multivariate
binary data with alternating logistic regressions. Biometrika 1993; 80: 517-526.
31. Pronovost PJ, Berenholtz SM, Goeschel CA, et al. Creating high reliability in health care organizations. Health Serv Res 2006; 41: 1599-1617.
30. Bradley EH, Curry LA, Devers KJ. Qualitative data analysis for health services research: Developing taxonomy, themes, and theory. Health Serv Res 2007; 42: 1758-1772.
32. Singer SJ, Gaba DM, Geppert JJ, et al. The culture of safety: Results of an organization-wide survey in 15 California hospitals. Qual Saf Health Care 2003; 12: 112-118.
22