The AGA Survey of Casino Entertainment
44
Transcript of The AGA Survey of Casino Entertainment


2013 AGA Sur vey of CASino en t er tAinmen t i
The American Gaming Association (AGA) is proud to present the 2013 edition of State of the States: The AGA Survey of Casino Entertainment.
As you sit down to review this report, I hope you’ll agree with me that the commercial casino industry is back. 2012 marks three consecutive years of increasing growth rates for gross gaming revenue. In fact, revenue figures were the second-highest in history, which is excellent news for all of those involved in the U.S. gaming industry. As the following pages show, by almost all measures, our industry is expanding and growing, which is good for our employees and the communities where they live and work.
Just as it has for the previous 14 years, this year’s State of the States report gives readers a comprehensive look at the commercial casino industry. The core of the report is made up of national and state-by-state economic impact data, including gaming revenues, direct gaming tax contributions, employment and wages for the 23 commercial casino states. Once again, we partnered with the Association of Gaming Equipment Manufacturers (AGEM) to also present the economic impact of the important — and growing — gaming equipment manufacturing sector.
While the bulk of the report is focused on economic impact data, I know that readers also look forward to the results of the AGA’s annual public opinion polling, which is another important part of State of the States. The primary goal of any casino property or gaming company is to entertain our customers, so taking a look at what they enjoy and how they spend their time when they visit is vital to our industry’s success. That is why this year’s polling not only includes an analysis of Americans’ attitudes about the acceptability of casino gaming and the gambling habits and activities of casino visitors, but also an in-depth look at young adult casino visitors — the very people with whom the future of our business lies.
Each year, we compile State of the States with the goal of providing the most comprehensive information resource about the valuable contributions the commercial gaming industry makes to national, state and local economies as well as the habits and preferences of casino customers. This year, I am especially confident that we have achieved our aim. I hope that you will find this to be a useful research tool throughout the year.
Frank J. Fahrenkopf, Jr.President and CEO American Gaming Association
President’s Message
ii 2013 AGA Sur vey of CASino en t er tAinmen t
notesStatiStical noteSThe American Gaming Association (AGA) represents the commercial casino industry; this survey strives to give the reader a detailed picture of that particular segment of the gaming industry.
For the purposes of this survey, the AGA defines “commercial casinos” as land-based, riverboat, dockside and racetrack casinos.
It should be noted that, in many cases, effective tax rates are higher at racetrack casino facilities where gaming machines are operated by the state lottery, as opposed to the more traditional regulatory structure in which gaming licensees are the owners and operators of the machines. In the case of the former, the gaming machines are called video lottery terminals (VLTs), and the lottery commission takes in all revenues before making distributions to stakeholders such as track owners, breeders and others. States that operate in this manner include Delaware, Maryland, New York, Ohio, Rhode Island and West Virginia. Because of this important difference in the regulatory structure in these states, the survey details the percentage of revenue retained by operators as opposed to state gaming tax rate. The percentage of revenues retained by operators should in no way be interpreted as profit margin. These are revenues earned before paying other non-gaming taxes, employee salaries as well as a host of other operating expenses.
Eight other racetrack casino states — Florida, Indiana, Iowa, Louisiana, Maine, New Mexico, Oklahoma and Pennsylvania — operate and tax their gaming machines at pari-mutuel facilities more similarly to traditional casino states. That is, regulations allow operators to earn gross revenues before requiring those operators to pay out taxes and supplements to purses at the tracks, among
other things. One exception is Maine, where the state levies a 1 percent tax on handle, the industry term for total amount wagered, before taxing net revenue as well. For these states, the individual state sections detail state gaming tax rates, not revenue retained by the operator.
Finally, for the third year, this year’s survey attempts to report on employee wage and benefits data in all states with either land-based, riverboat or racetrack casinos. Not all casinos chose to participate in data collection, so the report reflects those figures that the AGA was able to obtain.
As in past years, Native American casinos are noted only in the Casino Locations by Category chart on page 4. The chart and accompanying map include Class III locations, which are compacted (state-negotiated), Las Vegas-style casinos, as well as Class II locations, which are non-compacted casinos offering bingo and/or electronic bingo devices.
State visitation figures reported in the State-by-State Economic Impact section will not equal the total visitor figure reported in the Casino Visitation section on page 28 because most riverboat states have controlled access and, therefore, count individual visits (each time a patron enters a casino), while land-based casino jurisdictions tend to calculate visitor volume less precisely and use varying methodologies to arrive at their visitation assessments.
Unless otherwise noted, all statistics in this survey are for calendar year 2012.
Polling noteSFigures reported in the polling data may not add up to 100 percent because of rounding.

2013 AGA Sur vey of CASino en t er tAinmen t 1
table of Contentsexecutive summary ...................................................................................................... 2
national economic impact of Casino entertainment ............................................4
ageM spotlight on gaming equipment Manufacturers .......................................9
state-by-state economic impact: Commercial Casinos ......................................11Colorado .................................................................................................................................. 11delaware .................................................................................................................................. 12florida ...................................................................................................................................... 12illinois ...................................................................................................................................... 13indiana ..................................................................................................................................... 13iowa ...........................................................................................................................................14Kansas.......................................................................................................................................14louisiana .................................................................................................................................15Maine ........................................................................................................................................15Maryland ..................................................................................................................................16Michigan ..................................................................................................................................16Mississippi ............................................................................................................................... 17Missouri ................................................................................................................................... 17nevada ......................................................................................................................................18new Jersey ...............................................................................................................................18new Mexico .............................................................................................................................19new York ..................................................................................................................................19ohio ......................................................................................................................................... 20oklahoma ............................................................................................................................... 20Pennsylvania ...........................................................................................................................21rhode island ...........................................................................................................................21south dakota ..........................................................................................................................22West Virginia ...........................................................................................................................22
Profile of Casino Visitors ........................................................................................... 23Casino Visitation....................................................................................................................25beyond the Casino floor ......................................................................................................27entertainment outside the Casino ................................................................................... 29gambling responsibly ..........................................................................................................30
american Perceptions of Casino entertainment .................................................. 32
spotlight on gaming Machines ................................................................................ 35
spotlight on sports betting ...................................................................................... 36
appendixglossary of gaming terms ............................................................................ 37index of Charts ............................................................................................. 38Methodology ................................................................................................. 39acknowledgements ....................................................................................... 40

2 2013 AGA Sur vey of CASino en t er tAinmen t
exeCutiVe suMMarYnational economic impact of Casino entertainment 2012 national economic impact data reveals the U.S. commercial casino industry is going strong. On the strength of a third consecutive year with increased rates of growth, national gross gaming revenues for 2012 reached their second-highest level in history — behind only 2007, the last year before the recession hit. Add in the impacts of direct gaming tax revenues, casino employment and wages, and a growing gaming equipment manufacturing sector, and one can see that both the present and the future of the U.S. gaming industry look bright.
When compared with figures from 2011, total consumer spending on gambling at commercial casinos — the equivalent of gross gaming revenue — rose 4.8 percent in 2012 to $37.34 billion. The increase in revenues expectedly led to an increase in direct gaming tax contributions as well, with companies returning $8.6 billion to states and local communities — an 8.5 percent increase over 2011 figures. The jobs created by the gaming industry continue to provide vital employment opportunities for more than 336,000 people — a slight .003 percent increase from 2011 totals — who earned $13.2 billion in wages, benefits and tips during 2012.
Most, but not all, gaming markets across the country are experiencing improved economic conditions, as 15 of the 22 states that had commercial casinos operating during 2011 saw their gross gaming revenues increase during 2012. The largest increases — in Kansas (+603.7 percent), Maryland (+142.6 percent), Maine (+66.9 percent) and New York (+43.1 percent) — were driven by the opening of new casinos or casinos that had their first full year of operations. Also of note, Ohio’s first four casinos opened during 2012, making it the nation’s 23rd commercial casino state and adding more than $400 million to the national revenue total.
Gaming tax contributions also rose in a strong majority of states, with 14 experiencing increases during 2012. As was the case for gaming revenues, the four states with the largest tax revenue increases — Kansas (+604.7 percent), Maryland (+143.7 percent), Maine (+48.3 percent) and New York (+38.6 percent) — each had the benefit of new properties or others with their first full year of operations.
Not all states saw their gaming revenue, tax receipts and employment rise during 2012, partly due to increased competition from new casinos in nearby markets. New Jersey experienced the largest drops in both gross gaming (-8.0 percent) and gaming tax (-8.2 percent) revenue, as it dealt with days of casino closings and reduced tourism in the wake of Hurricane Sandy and increased competition from new casinos in the mid-Atlantic region. Delaware felt the effects of mid-Atlantic competition as well, and had the second largest percentage decreases in both gaming revenue (-4.7 percent) and tax receipts (-5.5 percent).
gaming equipment Manufacturing and gaming MachinesDuring 2012, the gaming equipment manufacturing and technology sector of the commercial gaming industry continued its growth, reporting positive gains in all key measures of economic activity. Working with the Association of Gaming Equipment Manufacturers (AGEM), Applied Analysis, a Nevada-based economic research and analysis firm, conducted a comprehensive assessment of the sector in conjunction with a survey of AGEM members. The results of the analysis demonstrate the relative strength and growth of this key component of the broader gaming industry.
Direct economic output by the gaming equipment manufacturing and technology sector rose to $13.0 billion in 2012 — an all-time high and 5.7 percent increase compared to 2011 figures. Approximately 31,200 workers were directly employed in the sector during 2012, earning $2.3 billion in salaries and wages. The employment figure increased by 3.0 percent compared to 2011 figures, and the earnings number increased 4.6 percent. The average wage of the sector’s workers reached approximately $73,300, which represented a significant premium to the U.S. average annual wage of $45,790 (Bureau of Labor Statistics).
The equipment manufacturing and technology sector also has been supportive of its employees through a high rate of provision of company-sponsored health care programs. Nearly three-quarters (72.1 percent) of surveyed manufacturers indicated they offer employer-sponsored health care plans to at least 75 percent of their workers.
2013 AGA Sur vey of CASino en t er tAinmen t 3
The market is expected to continue its growth pattern in the near term as new technology and regulatory approvals position traditional gaming suppliers to capitalize on global online, interactive, mobile and content opportunities. When asked to consider their expectations for the market during the next 12 months, more than three-quarters (76.7 percent) of AGEM members think the sector is poised for further improvements, which is the second-highest level of optimism since the recession hit in 2008.
According to recently-conducted public opinion polling, electronic gaming machines are named as the favorite casino game by more than three-fifths of casino visitors (61 percent). The popularity of gaming machines is in line with the percentage of revenue collected from them. Of the states that report slot and table game revenue separately, all of them receive at least 62 percent of their revenues from electronic gaming machines. Properties in Iowa (91.0 percent) and South Dakota (90.3 percent) receive the largest percentage of revenues from slots, and Nevada (62.5 percent) receives the smallest portion.
Profile of Casino VisitorsCasino gambling is an activity that adults 21 and over across the United States enjoy every day, and those casino customers are the lifeblood of the gaming industry. To provide a better understanding of the gaming habits and behaviors of those customers, VP Communications, in conjunction with national pollster Peter D. Hart, conducted a national public opinion survey with specific questions directed at individuals who had visited a casino in the past year. They focused an additional battery of questions on 300 young adults age 21-35 who had visited a casino during the past year. The two surveys reveal a great deal about the casino customer in general and young adult casino visitors in particular.
According to public opinion polling, more than one-third (34 percent) of Americans visited a casino in the past 12 months, while 32 percent of Americans say they gambled at a casino in the past 12 months. Young adults age 21-35 had the highest rate of casino visitation, as nearly two out of five (39 percent) went to a casino.
Among the general population of survey respondents, playing the lottery was the most popular form of gambling in 2012, with more than half (53 percent) participating in the past year. The
lottery was also most popular with overall casino visitors (68 percent) and young adult casino visitors (72 percent). However, young adult casino visitors had higher participation rates than overall casino visitors in other forms gambling like casual betting with friends, playing poker and wagering on the Internet.
In addition to visiting casinos at a higher rate than other age groups, young adult casino-goers are more likely to come back, as nine out of 10 say they plan to return to a casino in the next 12 months. This is a higher rate than the more than three-quarters (79 percent) of the general population of casino visitors who say the same.
As was mentioned earlier, electronic gaming machines are the most popular game among the overall sample of casino visitors, and the same holds true among young adult casino visitors, as more than half (51 percent) choose slot machines or video poker as their favorite game. However, the gap between machines and the second-most popular game — blackjack — is much smaller among young casino visitors (27 points) than casino visitors in general (42 points).
Non-gaming activities are an important part of the casino experience for both young adult and general casino-goers. Fine dining is the most popular amenity for the general population of visitors (69 percent) and young adult visitors (76 percent). However, young adult visitors are more likely to take advantage of non-gaming amenities like shopping, live entertainment and recreational facilities like spas or pools. Interestingly, more than one-quarter (26 percent) of casino visitors say they never or rarely gamble during their trips, while a smaller percentage of young adult visitors (19 percent) say the same.
american Perceptions of Casino entertainmentThe 2013 public opinion polling conducted by VP Communications and Peter D. Hart also reveals that 85 percent of Americans think that casino gaming is acceptable for themselves or others. While overall acceptability is above 80 percent for all age groups, it is highest among those respondents age 21-39 (89 percent) and the lowest among those age 60 and over (82 percent).
executive summary Continued

4 2013 AGA Sur vey of CASino en t er tAinmen t
national eConoMiC iMPaCt of Casino entertainMent
1 In Rhode Island, there are video lottery terminals operating at a closed jai alai fronton, not considered a racetrack casino, but a pari-mutuel facility.
2 The states with racetrack casinos operate Class III gaming machines. There are two racinos in Alabama — not indicated on this map — that have Class II machines only, which are legal only in the counties where they operate.
3 Native American casinos noted here include both Class II and Class III facilities. States with Class II gaming are Alabama, Alaska, Nebraska and Texas.
4 The states with card rooms indicated here do not include states that have commercial casinos with poker facilities.
5 The card rooms in Washington operate blackjack and other house- or player-banked card games in addition to poker.
6 The electronic gaming devices operating in the states indicated on this map are recognized as legal operations. There are some states with similar facilities, but the machines may not be authorized.
Sources: American Gaming Association, National Indian Gaming Commission, State Gaming Regulatory Agencies
casinos per State (as of Dec. 31, 2012)
* Class II games onlyº Limited-stakes gamingnVideo lottery terminals1 Refers to number of non-casino locations in states where electronic
gaming devices are present2 Number during FY 20123 Locations have 15 or fewer machines
Sources: American Gaming Association, National Indian Gaming Commission, State Gaming Regulatory Agencies
1
casino locations by category
in 2012, u.s. commercial casinos:•employed 336,272 people•Paid wages of $13.2 billion•Contributed $8.60 billion in direct gaming taxes•earned $37.34 billion in gross gaming revenue
STATE Alabama 3 * Alaska 2 * Arizona 26 California 70 88 Colorado 41 º 2 Connecticut 2 Delaware 3 n Florida 6 8 25 Idaho 7 Illinois 10 1,194 n
Indiana 11 2 Iowa 15 3 3 Kansas 3 4 Louisiana 14 4 3 2,071 Maine 1 1 Maryland 2 n 1 n Michigan 3 22 Minnesota 39 2 Mississippi 30 3 Missouri 13 Montana 14 227 2 1,503 2
Nebraska 7 * Nevada 265 2 3 2,003 3 New Jersey 12 New Mexico 5 21 New York 9 n 8 North Carolina 2 North Dakota 11 Ohio 3 1 n Oklahoma 2 114 Oregon 8 2,322 n
Pennsylvania 5 6 Rhode Island 2 n South Dakota 35 º 14 1,459 2
Texas 1 * Washington 34 71 2 West Virginia 1 4 n 1,490 n
Wisconsin 31 Wyoming 4 Total 464 49 466 413 12,042 Number of States 17 14 28 5 7
2013 AGA Sur vey of CASino en t er tAinmen t 5
national economic impact of Casino entertainment Continued
U.S. consumer Spending on commercial casino gaming, 2003-2012
$ Billions
$ Billions2007 20122003 2004 2005 2006 2008 2009 2010
25
30
35
40
201125
30
35
40
$34.60
$28.72
$32.77
$31.17
$35.27
$37.52
$36.22
$28.07
$34.28
$35.64
$37.34
Commercial Casinos
Source: State Gaming Regulatory Agencies
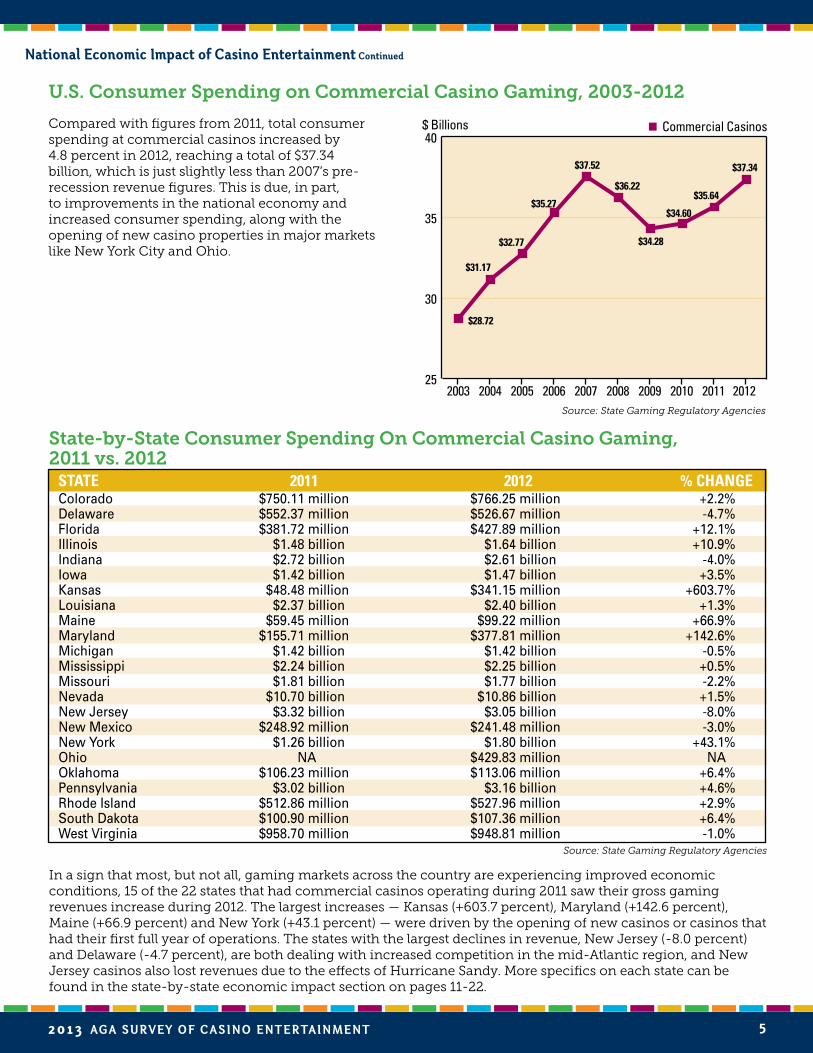
Compared with figures from 2011, total consumer spending at commercial casinos increased by 4.8 percent in 2012, reaching a total of $37.34 billion, which is just slightly less than 2007’s pre-recession revenue figures. This is due, in part, to improvements in the national economy and increased consumer spending, along with the opening of new casino properties in major markets like New York City and Ohio.
State-by-State consumer Spending on commercial casino gaming, 2011 vs. 2012 STATE 2011 2012 % ChAngE
Colorado $750.11 million $766.25 million +2.2%Delaware $552.37 million $526.67 million -4.7%Florida $381.72 million $427.89 million +12.1%Illinois $1.48 billion $1.64 billion +10.9%Indiana $2.72 billion $2.61 billion -4.0%Iowa $1.42 billion $1.47 billion +3.5%Kansas $48.48 million $341.15 million +603.7%Louisiana $2.37 billion $2.40 billion +1.3%Maine $59.45 million $99.22 million +66.9%Maryland $155.71 million $377.81 million +142.6%Michigan $1.42 billion $1.42 billion -0.5%Mississippi $2.24 billion $2.25 billion +0.5%Missouri $1.81 billion $1.77 billion -2.2%Nevada $10.70 billion $10.86 billion +1.5%New Jersey $3.32 billion $3.05 billion -8.0%New Mexico $248.92 million $241.48 million -3.0%New York $1.26 billion $1.80 billion +43.1%Ohio NA $429.83 million NAOklahoma $106.23 million $113.06 million +6.4%Pennsylvania $3.02 billion $3.16 billion +4.6%Rhode Island $512.86 million $527.96 million +2.9%South Dakota $100.90 million $107.36 million +6.4%West Virginia $958.70 million $948.81 million -1.0%
Source: State Gaming Regulatory Agencies
In a sign that most, but not all, gaming markets across the country are experiencing improved economic conditions, 15 of the 22 states that had commercial casinos operating during 2011 saw their gross gaming revenues increase during 2012. The largest increases — Kansas (+603.7 percent), Maryland (+142.6 percent), Maine (+66.9 percent) and New York (+43.1 percent) — were driven by the opening of new casinos or casinos that had their first full year of operations. The states with the largest declines in revenue, New Jersey (-8.0 percent) and Delaware (-4.7 percent), are both dealing with increased competition in the mid-Atlantic region, and New Jersey casinos also lost revenues due to the effects of Hurricane Sandy. More specifics on each state can be found in the state-by-state economic impact section on pages 11-22.

6 2013 AGA Sur vey of CASino en t er tAinmen t
commercial casino Spending vs. other Spending choices, 2012
$37.34
$204.0
1. Commercial Casinos
2. Consumer Electronics
3. Full-service Restaurants
4. Outdoor Equipment
5. U.S. Box Office Receipts
6. Craft Beer $10.2
$10.8
$11.4
$202.2
0 50 100 150 200 250
$ Billions
Sources: 1-American Gaming Association; 2-Consumer Electronics Association; 3-National Restaurant Association; 4-Outdoor Industry Association; 5-Boxofficemojo.com; 6-Brewers Association
During 2012, consumers spent more at commercial casinos than they did on movies, craft beer and outdoor equipment combined, but spending on casino gambling was significantly less than spending on nights out at full-service restaurants or consumer electronics.
commercial casino tax Revenue by State, 2011 vs. 2012 STATE 2011 2012 % ChAngE
Colorado $102.17 million $104.26 million +2.0% Delaware $230.16 million $217.44 million -5.5%Florida $143.60 million $161.76 million +12.6%Illinois $489.42 million $574.34 million +17.4%Indiana $846.37 million $806.56 million -4.7%Iowa $321.53 million $334.43 million +4.0%Kansas $13.08 million $92.17 million +604.7%Louisiana $573.19 million $579.45 million +1.1%Maine $29.06 million $43.11 million +48.3%Maryland $89.53 million $218.20 million +143.7% Michigan $320.67 million $319.75 million -0.3% Mississippi $274.42 million $272.73 million -0.6% Missouri $484.83 million $471.41 million -2.8%Nevada $865.25 million $868.60 million +0.4%New Jersey $277.60 million $254.84 million -8.2%New Mexico $64.72 million $62.79 million -3.0%New York $593.40 million $822.67 million +38.6%Ohio NA $138.18 million NA Oklahoma $18.30 million $20.38 million +11.4% Pennsylvania $1.456 billion $1.487 billion +2.1%Rhode Island $308.71 million1 $328.98 million2 +6.6%South Dakota $16.36 million $16.62 million +1.6%West Virginia $406.46 million $402.50 million -1.0%
1FY 2011 Source: State Gaming Regulatory Agencies2FY 2012
During 2012, commercial casinos contributed a total of $8.60 billion in direct gaming taxes to states and localities nationwide — an 8.5 percent increase compared to 2011 figures. Of the 22 states with operating commercial casinos in 2011, 14 experienced increases in gaming tax receipts during 2012. As was the case for gaming revenues, the four states with the largest tax revenue increases — Kansas (+604.7 percent), Maryland (+143.7 percent), Maine (+48.3 percent) and New York (+38.6 percent) — each had the benefit of new properties or others with their first full year of operations. New Jersey (-8.2 percent) saw its tax receipts decline the most. More specifics on each state can be found in the state-by-state economic impact section on pages 11-22.
national economic impact of Casino entertainment Continued

2013 AGA Sur vey of CASino en t er tAinmen t 7
commercial casino Jobs by State, 2011 vs. 2012
0
1-10,000
10,001-20,000
20,001-30,000
30,001-40,000
150,000+
*One or more properties from these states declined to participate in data gathering, see state-by-state data charts for more information. 1Figure for locations with gross gaming revenue in excess of $1 million for FY 2011.2Figure for locations with gross gaming revenue in excess of $1 million for FY 2012. 32011 data was used for one or more properties that did not provide 2012 data. 42011 employment figure was changed to remove data from properties that have not participated since 2010.5FY 20116FY 20127CY 20108CY 2011
Sources: State Gaming Regulatory Agencies, State Gaming Associations, Individual Properties
Based on the data from the commercial casino properties that provided employment data, more than 336,000 people were employed by commercial casinos nationwide in 2012. This figure was up slightly (+.003%) from 2011 figures.
commercial casino Wages, 2003-2012
$ Billions
9
12
15
$11.8
$13.2
$12.2$12.6
$13.3$13.8
$13.1
$14.1
201220112003 2004 2005 2006 2007 2008 2009 2010
9
12
15
$12.9
$13.3
Based on the data that was available from participating properties, during 2012, commercial casino employees earned $13.2 billion in wages, benefits and tips — a 2.3 percent increase compared to 2011 figures.
Sources: State Gaming Regulatory Agencies, Individual Properties
STATE 2011 2012 % ChAngENevada 174,381 170,206 -2.4%New Jersey 32,823 34,726 +5.8%Mississippi 23,721 23,377 -1.5% Louisiana 17,207 15,061 -12.5%Indiana* 14,079 12,543 -10.9%Pennsylvania* 9,897 10,162 +2.7%Missouri 10,435 9,631 -7.7%Iowa 9,384 9,558 +1.9%Colorado 9,263 9,278 +0.2%Michigan* 7,303 7,972 +9.2%Illinois 7,911 7,687 -2.8%New York* 4,762 5,233 +9.9%West Virginia* 4,475 4,351 -2.8%Ohio* N/A 4,197 N/AFlorida* 2,601 3,319 +27.6%Delaware* 2,730 2,775 +1.6%South Dakota 1,647 1,686 +2.4%Kansas* N/A 1,344 N/ANew Mexico* 930 918 -1.3%Maine 364 879 +141.8%Oklahoma 905 870 -3.9%Maryland* 290 499 +72.1%Rhode Island* N/A N/A N/ATotal 335,108 336,272 + .003%
1
4
5
4
7
4
2
6
3
3
3
3
8
3
national economic impact of Casino entertainment Continued

8 2013 AGA Sur vey of CASino en t er tAinmen t
top 10 U.S. Racetrack casino Markets, 2012
1. Philadelphia, Pa. $835.33 million 2. New York City, N.Y. $672.57 million 3. Yonkers, N.Y. $544.70 million 4. Charles Town, W.V. $536.99 million 5. Providence, R.I. $477.83 million 6. Indianapolis, Ind. $445.40 million 7. Dade County, Fla. $427.89 million 8. Dover/Harrington, Del. $297.57 million 9. Meadow Lands, Pa. $284.38 million10. Grantville, Pa. $282.60 million
Source: The Innovation Group
Resorts World New York’s first full year of operations helped the New York City market enter the rankings at number two, while Philadelphia, Pa. was the largest racetrack casino market by revenue for the third consecutive year.
Top 20 U.S. Casino Markets
Top 10 U.S. Racetrack Casino Markets
top U.S. casino Markets, 2012
1. Las Vegas Strip, Nev. $6.207 billion2. Atlantic City, N.J. $3.052 billion3. Chicagoland, Ill./Ind. $2.243 billion4. Detroit, Mich. $1.417 billion 5. Connecticut $1.230 billion1
6. Philadelphia, Pa. $1.167 billion7. St. Louis, Mo./Ill. $1.108 billion8. Gulf Coast, Miss.2 $1.095 billion9. The Poconos, Pa.3 $902.48 million10. Tunica/Lula, Miss. $821.95 million
1Includes only revenue from slot machines. Source: The Innovation Group2Includes casinos in Gulfport, Bay St. Louis and unincorporated Hancock County, Miss.3Includes casinos in Bethlehem, Mt. Airy and Wilkes-Barre, Pa.
The merging of smaller markets into larger, regional markets for tabulation purposes led to one new market — The Poconos, Pa., — on the list of the top casino markets. Another market that entered the rankings for the first time was New York City, based on the strength of the first full year of operations for Resorts World New York in Queens.
11. Kansas City, Mo. $799.85 million12. Boulder Strip, Nev. $796.71 million13. Shreveport/Bossier City, La. $715.65 million14. Lake Charles, La. $686.99 million15. New York City, N.Y. $672.57 million16. Reno/Sparks, Nev. $644.92 million17. Pittsburgh/Meadow Lands, Pa. $636.24 million18. Black Hawk, Colo. $633.09 million19. Lawrenceburg/Rising Sun/Belterra, Ind. $632.14 million20. New Orleans, La. $622.19 million
top 20 U.S. casino Markets, 2012
national economic impact of Casino entertainment Continued

2013 AGA Sur vey of CASino en t er tAinmen t 92013 aga sur VeY of Casino en t er tainMen t 9
During 2012, the global gaming equipment manufacturing and technology sector of the commercial gaming industry
continued its expansion, reporting positive gains in all key measures of economic activity. Working with the Association of Gaming Equipment Manufacturers (AGEM), Applied Analysis, a Nevada-based economic research and analysis firm, conducted a comprehensive assessment of the sector in conjunction with a survey of AGEM members. The results of the analysis demonstrate the relative strength and growth of this key component of the broader gaming industry.
Direct economic output by the gaming equipment manufacturing sector rose to $13.0 billion in 2012 — an all-time high and 5.7 percent increase compared to 2011 figures. Approximately 31,200 workers were directly employed in the sector during 2012, earning $2.3 billion in salaries and wages. The employment figure was a 3.0 percent increase compared to 2011 figures, and the earnings number was a 4.6 percent uptick.
Overall, the gaming equipment manufacturing and technology sector continues to generate increasing demand for its products and services. Market improvements, technological advancements and continued investments have translated into positive job growth and increased income profiles for workers within the industry. The market is expected to continue its growth pattern in the near term as new technology and regulatory approvals position traditional gaming suppliers to capitalize on global online, interactive, mobile and content opportunities.
gaming equipment Manufacturing economic output, 2007-2012
$6.17
2007 20122008
$ Billions
2009 2010
Direct Indirect
0
5
10
15
20
25
30
$11.9 $12.7
$11.2$11.9
$12.1
$11.4
$11.5
$10.8
$12.3
$11.6
2011 0
5
10
15
20
25
30
$13.0
$12.2
Source: Association of Gaming Equipment Manufacturers (AGEM)
Direct economic output sourced to the gaming equipment manufacturing and technology sector reached an all-time high in 2012 as the expansion of gaming continued, replacements sales resumed and broader economic recovery took hold in selected markets. Direct output rose 5.7 percent when compared to 2011 figures, reaching $13.0 billion. When combined with indirect output, total economic activity sourced to the sector reached $25.2 billion — a 5.4 percent increase over 2011 totals.
gaming equipment Manufacturing employment, 2007-2012
0
10000
20000
30000
40000
50000
60000
0
10,000
20,000
30,000
40,000
50,000
60,000
2007 20122008
Employees
2009 2010
Direct Indirect
2011
30,300
20,500
29,600
22,100
28,200
21,600
30,000
21,800
29,400
21,400
31,200
22,700
Source: Association of Gaming Equipment Manufacturers (AGEM)
During 2012, overall employment in the sector trended in a positive direction for the second year as direct employment within the industry reached a new high of 31,200 jobs — a 3.0 percent increase over 2011 totals. Direct employment helped to support an additional 22,700 indirect positions for a total employment impact estimated at 53,900 individuals.
gaming equipment Manufacturing Salaries and Wages, 2007-2012
Direct Indirect$ Billions
0.0
0.5
1.0
1.5
2.0
2.5
3.0
3.5
4.0
4.5
5.0
5.5
6.0
6.5
7.0
7.5
8.0
0.0
0.5
1.0
1.5
2.0
2.5
3.0
3.5
4.0
$1.3
$2.3$1.9 $2.0
$1.3$1.4
$2.1
$1.4
$2.1
$1.4$1.5
$2.2
2007 20122008 2009 2010 2011
$1.5
Source: Association of Gaming Equipment Manufacturers (AGEM)
Salaries and wages for gaming manufacturing employees edged up to an aggregate $2.3 billion in 2012, which was a 4.6 percent increase over 2011 figures. Direct employment helped to support another $1.5 billion in indirect wages. The average wage of industry workers reached approximately $73,300, which represented a significant premium to the United States average annual wage of $45,790 (Bureau of Labor Statistics).
gaMing eQuiPMent ManufaCturerssPotlight on

10 2013 AGA Sur vey of CASino en t er tAinmen t10 2013 aga sur VeY of Casino en t er tainMen t
gaming equipment Manufacturers with employees covered by employer-sponsored Health care Plans
0
10
20
30
40
50
60
70
80
16.3%
Less than 50% of employees
50% to 75% of employees
More than 75% of employees
11.6%
72.1%
Source: Association of Gaming Equipment Manufacturers (AGEM)
Overall, the equipment manufacturing and technology sector has been supportive of its employees, which is demonstrated by the relatively high participation rate of company-sponsored health care programs. Nearly three-quarters (72.1 percent) of surveyed firms indicated they offer employer-sponsored health care plans to at least 75 percent of their workers, while an additional 11.6 percent offer health care plans to between 50 and 75 percent of their workers.
Historical expectations of Market improvement for the next 12 Months
76.7%
10.7%
73.7%75.0%
86.8%
20122008 2009 20112010
0
20
40
60
80
100
Source: Association of Gaming Equipment Manufacturers (AGEM)
More than three-quarters (76.7 percent) of AGEM members think that market conditions will improve during the next 12 months. This is the second-highest level of optimism since the recession hit, but slightly below 2011’s figure.
Purchases Made from local Vendors by gaming equipment Manufacturers
19.0%
1% to 10%
11% to 25%
26% to 50%
50% or More31.0% 31.0%
19.0%
Source: Association of Gaming Equipment Manufacturers (AGEM)
All surveyed gaming equipment manufacturers noted making purchases from local vendors, and more than three out of 10 (31.0 percent) made more than 50 percent of their purchases from local suppliers. Half of surveyed equipment manufacturers (50.0 percent) purchase at least 25 percent of their supplies and services from companies in their local market.
gaming equipment Manufacturers’ Market expectations for the next 12 Months
Worsen
Remain the Same
Improve
0
10
20
30
40
50
60
70
80
18.6%
4.7%
76.7%
Source: Association of Gaming Equipment Manufacturers (AGEM)
When asked to consider their expectations for the market during the next 12 months, more than three-quarters (76.7 percent) of AGEM members think the sector is poised for further improvements. Only a modest 4.7 percent of manufacturers expect conditions to worsen.
ageM spotlight on gaming equipment Manufacturers Continued

state-bY-state eConoMiC iMPaCt: CoMMerCial CasinosWhen compared with figures from 2011, total consumer spending on gambling at commercial casinos — the
equivalent of gross gaming revenue — rose 4.8 percent in 2012 to $37.34 billion. National gross gaming revenues for 2012 reached their second-highest level in history — behind only 2007, the last year before the recession hit. The increase in revenues expectedly led to an increase in direct gaming tax contributions as well, with companies returning $8.6 billion to states and local communities — an 8.5 percent increase over 2011 figures. The jobs created by the gaming industry continue to provide vital employment opportunities for more than 336,000 people — a slight .003 percent increase from 2011 — who earned $13.2 billion in wages, benefits and tips during 2012.
Most, but not all, gaming markets across the country are experiencing improved economic conditions, as 15 of the 22 states that had commercial casinos operating during 2011 saw their gross gaming revenues increase during 2012. The largest increases — in Kansas (+603.7 percent), Maryland (+142.6 percent), Maine (+66.9 percent) and New York (+43.1 percent) — were driven by the opening of new casinos or casinos that had their first full year of operations. Also of note, Ohio’s first four casinos opened during 2012, making it the nation’s 23rd commercial casino state and adding more than $400 million to the national revenue total.
Gaming tax contributions also rose in a strong majority of states, with 14 experiencing increases during 2012. As was the case for gaming revenues, the four states with the largest tax revenue increases — Kansas (+604.7 percent), Maryland (+143.7 percent), Maine (+48.3 percent) and New York (+38.6 percent) — each had the benefit of new properties or others with their first full year of operations.
Not all states saw their gaming revenue, tax receipts and employment rise during 2012, partly due to increased competition from new casinos in nearby markets. New Jersey experienced the largest drops in both gross gaming (-8.0 percent) and gaming tax (-8.2 percent) revenue, as it dealt with days of casino closings and reduced tourism in the wake of Hurricane Sandy and increased competition from new casinos in the mid-Atlantic region. Delaware felt the effects of mid-Atlantic competition as well, and had the second largest percentage decreases in both gaming revenue (-4.7 percent) and tax receipts (-5.5 percent).
COLORADOCurrent # of operating Casinos 41
Casino format Land-based
Casino employees 9,278
Casino employee Wages $216.74 million (includes tips and benefits)
gross Casino gaming revenue $766.25 million
gaming tax revenue $104.26 million
how taxes spent Local communities, historic preservation, community colleges, general fund, state tourism promotion
legalization date 1990
first Casino opening date 1991
state gaming tax rate Graduated tax rate with a maximum tax of 20% on gaming revenue
Mode of legalization Statewide vote, legislative action
Visitor Volume Data not availableSources: Colorado Gaming Association, Colorado Division of Gaming
Central CityBlack Hawk
Cripple Creek
Improvements in the general economy helped casinos in Colorado achieve a 2.2 percent increase in gaming revenue and a 2.0 percent increase in gaming tax revenue.
2013 aga sur VeY of Casino en t er tainMen t 11
12 2013 AGA Sur vey of CASino en t er tAinmen t
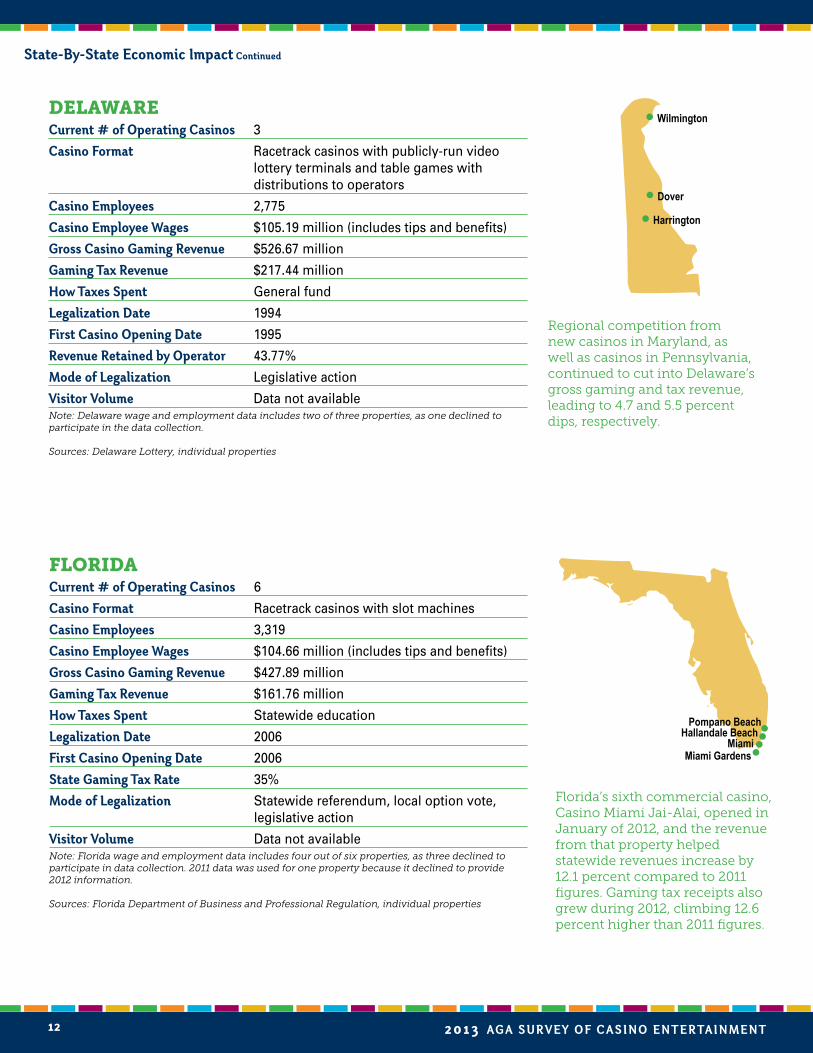
DELAWARECurrent # of operating Casinos 3
Casino format Racetrack casinos with publicly-run video lottery terminals and table games with distributions to operators
Casino employees 2,775
Casino employee Wages $105.19 million (includes tips and benefits)
gross Casino gaming revenue $526.67 million
gaming tax revenue $217.44 million
how taxes spent General fund
legalization date 1994
first Casino opening date 1995
revenue retained by operator 43.77%
Mode of legalization Legislative action
Visitor Volume Data not availableNote: Delaware wage and employment data includes two of three properties, as one declined to participate in the data collection.
Sources: Delaware Lottery, individual properties
Dover
Wilmington
Harrington
FLORIDACurrent # of operating Casinos 6
Casino format Racetrack casinos with slot machines
Casino employees 3,319
Casino employee Wages $104.66 million (includes tips and benefits)
gross Casino gaming revenue $427.89 million
gaming tax revenue $161.76 million
how taxes spent Statewide education
legalization date 2006
first Casino opening date 2006
state gaming tax rate 35%
Mode of legalization Statewide referendum, local option vote, legislative action
Visitor Volume Data not availableNote: Florida wage and employment data includes four out of six properties, as three declined to participate in data collection. 2011 data was used for one property because it declined to provide 2012 information.
Sources: Florida Department of Business and Professional Regulation, individual properties
Regional competition from new casinos in Maryland, as well as casinos in Pennsylvania, continued to cut into Delaware’s gross gaming and tax revenue, leading to 4.7 and 5.5 percent dips, respectively.
Florida’s sixth commercial casino, Casino Miami Jai-Alai, opened in January of 2012, and the revenue from that property helped statewide revenues increase by 12.1 percent compared to 2011 figures. Gaming tax receipts also grew during 2012, climbing 12.6 percent higher than 2011 figures.
state-by-state economic impact Continued
Miami Gardens
Pompano BeachHallandale Beach
Miami
2013 AGA Sur vey of CASino en t er tAinmen t 13
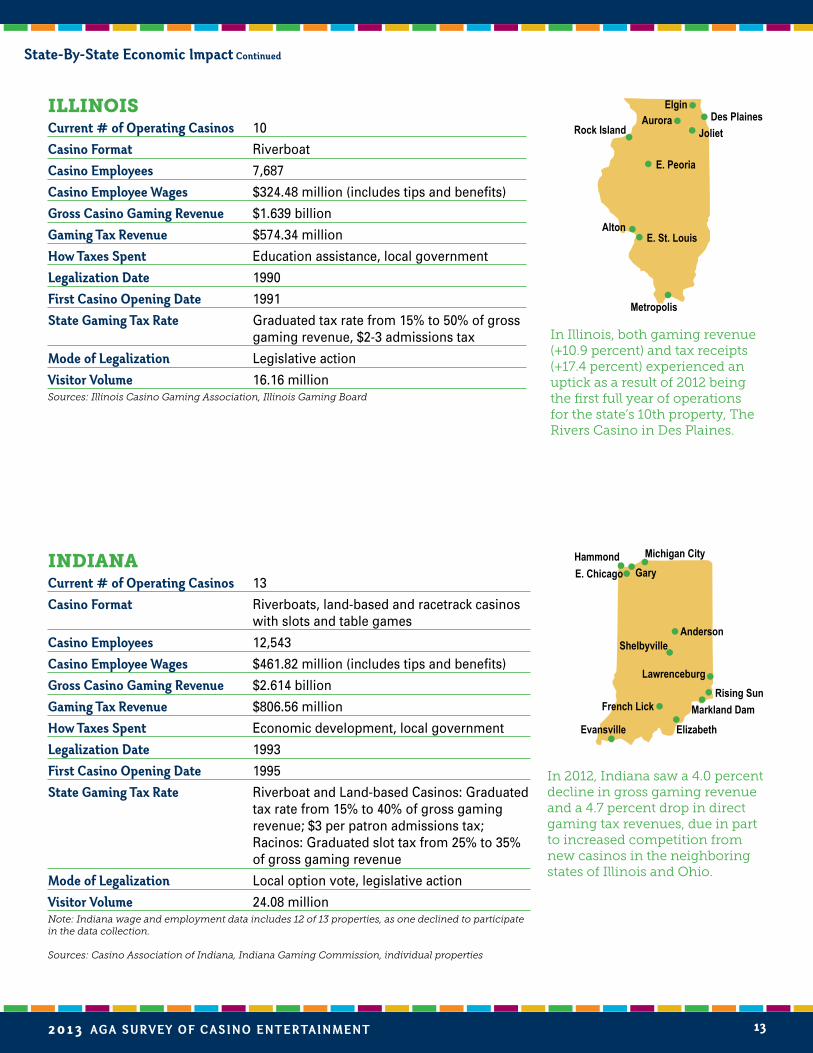
ILLINOISCurrent # of operating Casinos 10
Casino format Riverboat
Casino employees 7,687
Casino employee Wages $324.48 million (includes tips and benefits)
gross Casino gaming revenue $1.639 billion
gaming tax revenue $574.34 million
how taxes spent Education assistance, local government
legalization date 1990
first Casino opening date 1991
state gaming tax rate Graduated tax rate from 15% to 50% of gross gaming revenue, $2-3 admissions tax
Mode of legalization Legislative action
Visitor Volume 16.16 millionSources: Illinois Casino Gaming Association, Illinois Gaming Board
Joliet Aurora
Elgin
Rock Island
E. Peoria
E. St. LouisAlton
Metropolis
In Illinois, both gaming revenue (+10.9 percent) and tax receipts (+17.4 percent) experienced an uptick as a result of 2012 being the first full year of operations for the state’s 10th property, The Rivers Casino in Des Plaines.
state-by-state economic impact Continued
Des Plaines
INDIANACurrent # of operating Casinos 13
Casino format Riverboats, land-based and racetrack casinos with slots and table games
Casino employees 12,543
Casino employee Wages $461.82 million (includes tips and benefits)
gross Casino gaming revenue $2.614 billion
gaming tax revenue $806.56 million
how taxes spent Economic development, local government
legalization date 1993
first Casino opening date 1995
state gaming tax rate Riverboat and Land-based Casinos: Graduated tax rate from 15% to 40% of gross gaming revenue; $3 per patron admissions tax; Racinos: Graduated slot tax from 25% to 35% of gross gaming revenue
Mode of legalization Local option vote, legislative action
Visitor Volume 24.08 millionNote: Indiana wage and employment data includes 12 of 13 properties, as one declined to participate in the data collection.
Sources: Casino Association of Indiana, Indiana Gaming Commission, individual properties
Michigan City
GaryE. Chicago
Hammond
French Lick
Evansville Elizabeth
Markland Dam
Rising Sun
Lawrenceburg
ShelbyvilleAnderson
In 2012, Indiana saw a 4.0 percent decline in gross gaming revenue and a 4.7 percent drop in direct gaming tax revenues, due in part to increased competition from new casinos in the neighboring states of Illinois and Ohio.

14 2013 AGA Sur vey of CASino en t er tAinmen t
IOWACurrent # of operating Casinos 18
Casino format Riverboat, land-based and racetrack casinos with slots and table games
Casino employees 9,558
Casino employee Wages $341.09 million (includes tips and benefits)
gross Casino gaming revenue $1.467 billion
gaming tax revenue $334.43 million
how taxes spent Infrastructure, schools and universities, the environment, tourism projects, cultural initiatives, general fund
legalization date 1989
first Casino opening date 1991
state gaming tax rate Graduated tax rate with a maximum of up to 22% on gross gaming revenue at riverboats and up to 24% at racetracks with slots and table games with gaming revenue exceeding $100 million
Mode of legalization Local option vote, legislative action
Visitor Volume 22.59 millionSources: Iowa Gaming Association, Iowa Racing and Gaming Commission
Emmetsburg
Sioux City
Council Bluffs
OsceolaBurlington
Davenport
Altoona RiversideBettendorf
Clinton
Dubuque
MarquetteNorthwood
Waterloo
An improving economy, along with the first full year of operations at Grand Falls Casino Resort in Larchwood, helped to drive increases in gaming revenue (+3.5 percent) and direct gaming tax receipts (+4.0 percent) in Iowa in 2012.
Larchwood
state-by-state economic impact Continued
KANSASCurrent # of operating Casinos 3Casino format Land-based (state-owned)Casino employees 1,344Casino employee Wages $50.45 million (includes tips and benefits)gross Casino gaming revenue $341.15 milliongaming tax revenue $92.17 millionhow taxes spent State debt reduction, infrastructure improvements, property tax relief, problem gambling treatmentlegalization date 2007first Casino opening date 2009state gaming tax rate 22% state tax, 3% local government tax, 2% tax to fund problem gambling treatmentMode of legalization Legislative action, local option voteVisitor Volume Data not availableNote: Kansas wage and employment data includes two of three properties, as one declined to participate in the data collection.
Sources: Kansas Lottery, individual properties
Dodge City
A full year of operations at Kansas Star Casino in Mulvane and the opening of Hollywood Casino at Kansas Speedway led to a six-fold increase in gaming revenues (+603.7 percent) and gaming taxes (+604.7 percent) in Kansas during 2012.
Mulvane
Kansas City

2013 AGA Sur vey of CASino en t er tAinmen t 15
LOUISIANACurrent # of operating Casinos 18
Casino format Riverboat, land-based and racetrack casinos with slots and table games
Casino employees 15,061
Casino employee Wages $631.00 million (includes tips and benefits)
gross Casino gaming revenue $2.404 billion
gaming tax revenue $579.45 million
how taxes spent General fund, city of New Orleans, public retirement systems, state capital improvements, rainy day fund
legalization date 1991
first Casino opening date 1993
state gaming tax rate Riverboat Casinos: 21.5%1; Land-based casino: $60 million annual tax or 21.5% of gross gaming revenue, whichever is greater; Racinos: 18% of gross gaming revenue paid to horsemen; 18.5% of net to state taxes and 4% to local parish
Mode of legalization Local option vote, legislative action
Visitor Volume 31.55 million1Riverboat casinos pay an additional 4 to 6 percent to local governing authorities under the terms of “local boarding fee” agreements.
Sources: Louisiana Casino Association, Louisiana Gaming Control Board, individual properties
Bossier City
Shreveport
Baton Rouge
New Orleans
Kenner
Amelia
OpelousasVinton
Lake Charles
Louisiana casinos took in more gross gaming (+1.3 percent) and gaming tax (+1.1 percent) revenue in 2012 than they did in 2011, due in part to the August opening of L’Auberge Casino Hotel in Baton Rouge.
state-by-state economic impact Continued
MAINECurrent # of operating Casinos 2
Casino format Land-based and racetrack casinos with slot machines and table games
Casino employees 879
Casino employee Wages $11.90 million (includes tips and benefits)
gross Casino gaming revenue $99.22 million
gaming tax revenue $43.11 million
how taxes spent Education, health care, agriculture, gambling control board administration, city of Bangor
legalization date 2004
first Casino opening date 2005
state gaming tax rate 1% tax on handle or the amount wagered; 39% tax on gross gaming revenue; 3% tax on gross gaming revenue to the city of Bangor
Mode of legalization Local option vote, legislative action
Visitor Volume Data not availableNote: Maine wage data includes one of two properties, as one declined to participate in data collection.
Sources: Maine Gambling Control Board, individual properties
Bangor
Compared to 2011, employment (+141.8 percent), gross gaming revenues (+66.9 percent) and direct gaming tax receipts (+48.3 percent) increased dramatically in Maine during 2012 as a result of the June opening of Oxford Casino in Oxford and the March addition of live table games at Hollywood Casino Hotel & Raceway in Bangor.
Harvey
Oxford
16 2013 AGA Sur vey of CASino en t er tAinmen t
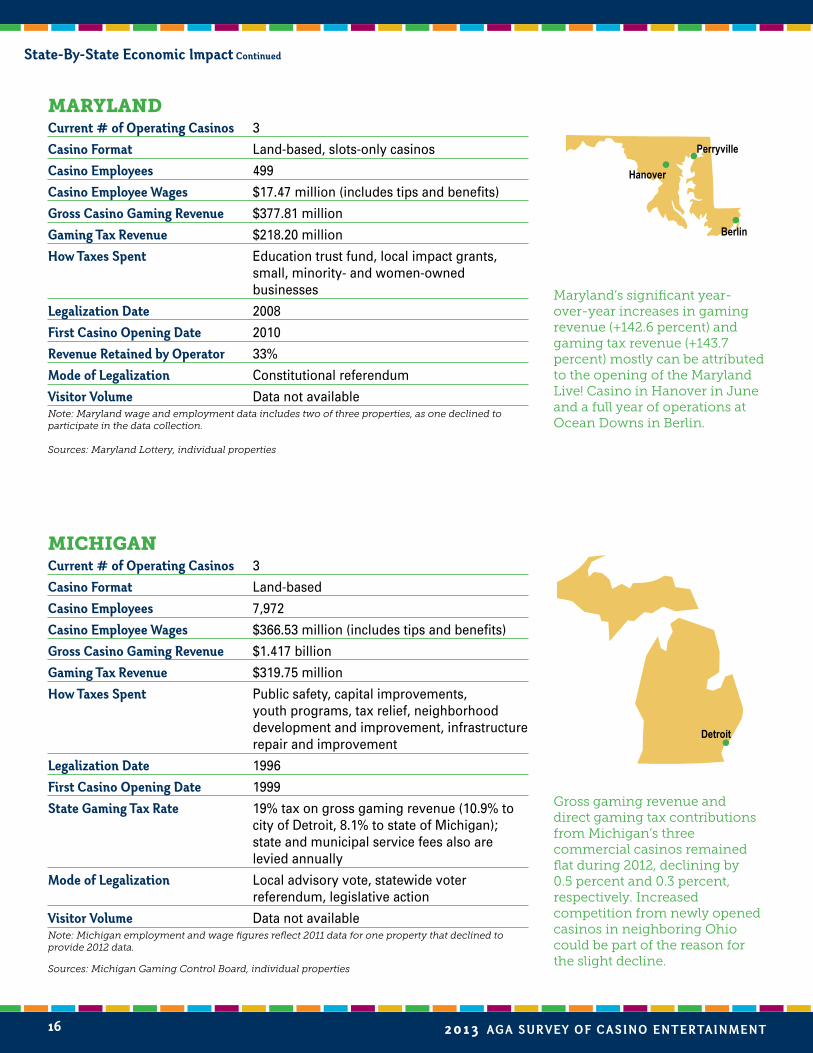
MICHIGANCurrent # of operating Casinos 3
Casino format Land-based
Casino employees 7,972
Casino employee Wages $366.53 million (includes tips and benefits)
gross Casino gaming revenue $1.417 billion
gaming tax revenue $319.75 million
how taxes spent Public safety, capital improvements, youth programs, tax relief, neighborhood development and improvement, infrastructure repair and improvement
legalization date 1996
first Casino opening date 1999
state gaming tax rate 19% tax on gross gaming revenue (10.9% to city of Detroit, 8.1% to state of Michigan); state and municipal service fees also are levied annually
Mode of legalization Local advisory vote, statewide voter referendum, legislative action
Visitor Volume Data not availableNote: Michigan employment and wage figures reflect 2011 data for one property that declined to provide 2012 data.
Sources: Michigan Gaming Control Board, individual properties
Detroit
MARyLANDCurrent # of operating Casinos 3
Casino format Land-based, slots-only casinos
Casino employees 499
Casino employee Wages $17.47 million (includes tips and benefits)
gross Casino gaming revenue $377.81 million
gaming tax revenue $218.20 million
how taxes spent Education trust fund, local impact grants, small, minority- and women-owned businesses
legalization date 2008
first Casino opening date 2010
revenue retained by operator 33%
Mode of legalization Constitutional referendum
Visitor Volume Data not availableNote: Maryland wage and employment data includes two of three properties, as one declined to participate in the data collection.
Sources: Maryland Lottery, individual properties
Perryville
Maryland’s significant year-over-year increases in gaming revenue (+142.6 percent) and gaming tax revenue (+143.7 percent) mostly can be attributed to the opening of the Maryland Live! Casino in Hanover in June and a full year of operations at Ocean Downs in Berlin.
Gross gaming revenue and direct gaming tax contributions from Michigan’s three commercial casinos remained flat during 2012, declining by 0.5 percent and 0.3 percent, respectively. Increased competition from newly opened casinos in neighboring Ohio could be part of the reason for the slight decline.
Berlin
state-by-state economic impact Continued
Hanover

2013 AGA Sur vey of CASino en t er tAinmen t 17
MISSISSIPPICurrent # of operating Casinos 30
Casino format Dockside, land-based
Casino employees 23,377
Casino employee Wages $847.66 million (includes tips and benefits)
gross Casino gaming revenue $2.251 billion
gaming tax revenue $272.73 million
how taxes spent Housing, education, transportation, health care services, youth counseling programs, local public safety programs
legalization date 1990
first Casino opening date 1992
state gaming tax rate Graduated tax of 8% on gaming revenues; up to 4% additional tax on gaming revenues may be imposed by local governments in casino counties
Mode of legalization Legislative action, local option votes
Visitor Volume 24.77 millionSources: Mississippi Casino Operators Association, Mississippi Gaming Commission
Tunica/Robinsonville
Lula
Vicksburg
Greenville
Bay St. Louis
Natchez
Gulfport
Biloxi
Recovery from 2011’s Mississippi River flooding helped gaming revenues at Mississippi’s 30 casinos increase 0.5 percent in 2012. Despite the increase in gaming revenues, however, tax receipts fell by 0.6 percent.
state-by-state economic impact Continued
MISSOURICurrent # of operating Casinos 13
Casino format Riverboat
Casino employees 9,631 (FY 2012)1
Casino employee Wages $335.90 million (includes tips and benefits) (FY 2012)
gross Casino gaming revenue $1.769 billion
gaming tax revenue $471.41 million
how taxes spent Education, local public safety programs, compulsive gambling treatment, veterans’ programs, early childhood programs
legalization date 1993
first Casino opening date 1994
state gaming tax rate 21% tax on gross gaming revenue; $2 per patron admission fee, per excursion, split between home dock community and the state
Mode of legalization Statewide vote, local option vote, legislative action
Visitor Volume 24.57 million1Increased employment from the opening of Isle Casino in Cape Girardeau is not reflected in the employment figures since the fiscal year ended before the property opened.
Sources: Missouri Gaming Association, Missouri Gaming Commission
Caruthersville
St. Louis
La GrangeSt. Joseph
Riverside
Kansas City North Kansas City
Boonville
St. Charles
Maryland Heights
The impact of increased competition from new Kansas casinos on the Kansas City market contributed to the declines Missouri saw in both gross gaming revenue (-2.2 percent) and gaming tax receipts (-2.8 percent). Also of note, the state’s 13th casino, Isle Casino in Cape Girardeau, opened in October.
Cape Girardeau

18 2013 AGA Sur vey of CASino en t er tAinmen t
NEW JERSEyCurrent # of operating Casinos 12
Casino format Land-based
Casino employees 34,726
Casino employee Wages $912.22 million (includes tips)
gross Casino gaming revenue $3.051 billion
gaming tax revenue $254.84 million
how taxes spent Senior citizens, disabled, economic revitalization programs
legalization date 1976
first Casino opening date 1978
state gaming tax rate 8% tax on gross gaming revenue, plus a community investment alternative obligation of 1.25% of gross gaming revenue (or an investment alternative 2.5% on gross gaming revenue)
Mode of legalization Statewide vote, legislative action
Visitor Volume 27.70 millionSources: New Jersey Casino Control Commission, South Jersey Transportation Authority
NEVADACurrent # of operating Casinos 265 (FY 2012)
Casino format Land-based
Casino employees 170,206 (FY 2012)
Casino employee Wages $7.693 billion (includes tips and benefits) (FY 2012)
gross Casino gaming revenue $10.860 billion
gaming tax revenue $868.60 million
how taxes spent Education, local governments, general fund, problem gambling programs
legalization date 1931
first Casino opening date 1931
state gaming tax rate Graduated tax rate with a maximum tax of 6.75% on gross gaming revenue; additional fees and levies may be imposed by counties, municipalities and the state adding approximately 1% to the tax burden
Mode of legalization Legislative action
Visitor Volume 52.30 millionSources: Nevada Gaming Control Board, Nevada Commission on Tourism
McDermitt Jackpot
WellsElkoWinnemucca
Battle Mtn.Reno
Carson City Gardnerville
Lake Tahoe
Lovelock Fallon
Hawthorne
Beatty Tonopah
West Wendover
Ely
MesquiteN. Las Vegas
Las VegasHenderson
LaughlinSearchlightPrimm
Pahrump Indian Spgs.
Amargosa Valley
Atlantic City
The opening of the state’s newest casino, Revel Atlantic City, in April led to a 5.8 percent increase in employment compared to 2011, but the strength and growth of regional competition and Hurricane Sandy led to an 8.0 percent decline in gross gaming revenue and an 8.2 percent drop in gaming tax revenue.
When compared to 2011 figures, Nevada casinos experienced a 1.5 percent increase in gross gaming revenue, while state and local governments received 0.4 percent more gaming tax revenue.
state-by-state economic impact Continued

2013 AGA Sur vey of CASino en t er tAinmen t 19
NEW MEXICOCurrent # of operating Casinos 5
Casino format Racetrack casinos with slot machines
Casino employees 918
Casino employee Wages $29.77 million (includes tips and benefits)
gross Casino gaming revenue $241.48 million
gaming tax revenue $62.79 million
how taxes spent General fund, problem gambling treatment
legalization date 1997
first Casino opening date 1999
state gaming tax rate 26% tax on gross gaming revenue; 20% to purse supplements; 0.25% to fund disordered gambling treatment and awareness
Mode of legalization Legislative action
Visitor Volume Data not availableNote: New Mexico wage and employment data includes two of five properties, as three declined to participate in data collection. 2011 data was used for the second property because they declined to provide 2012 information.
Sources: New Mexico Gaming Control Board, individual properties
Farmington
Albuquerque
Ruidoso
Sunland Park
Hobbs
During 2012, gross gaming and direct gaming tax revenues at New Mexico’s five racetrack casinos each declined by 3.0 percent when compared to 2011 figures. Revenue declines at some of the state’s racinos are due in part to increased competition from tribal properties nearby.
state-by-state economic impact Continued
NEW yORKCurrent # of operating Casinos 9
Casino format Racetrack casinos with publicly-run video lottery terminals with distributions to operators
Casino employees 5,233
Casino employee Wages $189.63 million (includes tips and benefits)
gross Casino gaming revenue $1.802 billion
gaming tax revenue $822.67 million
how taxes spent Education
legalization date 2001
first Casino opening date 2004
revenue retained by operator 34.90%
Mode of legalization Legislative action
Visitor Volume Data not availableNote: New York wage and employment data includes eight of nine properties, as one declined to participate in data collection. 2011 data was used for two properites because they declined to provide 2012 information.
Sources: New York Racing and Wagering Board, New York Lottery, individual properties
Saratoga SpringsVernon
FarmingtonBatavia
Hamburg
Nichols Monticello
Yonkers
The first full year of operations of Resorts World New York in Queens, New York City was the driving force behind significant gains in gaming revenue (+43.1 percent) and tax receipts (+38.6 percent) when compared to 2011 figures.
New York City

20 2013 AGA Sur vey of CASino en t er tAinmen t
OHIOCurrent # of operating Casinos 4
Casino format Land-based and racetrack casinos with publicly-run video lottery terminals with distributions to operators
Casino employees 4,197
Casino employee Wages $91.27 million (includes tips and benefits)
gross Casino gaming revenue $429.83 million
gaming tax revenue $138.18 million
how taxes spent Local governments, education, casino control commission, racing commission, law enforcement training, problem gambling and addictions
legalization date 2009
first Casino opening date 2012
state gaming tax rate Land-based casinos: 33%; Racino (VLT): revenue retained by operator is 66.5%
Mode of legalization Statewide referendum, local option vote
Visitor Volume Data not availableNote: Ohio wage and employment data includes three of four properties, as one declined to participate in the data collection.
Source: Ohio Casino Control Commission, individual properties
During 2012, Ohio’s first casinos opened in Cleveland, Columbus and Toledo, while the state’s first racino also opened in Columbus. The state’s fourth casino opened in Cincinnati in March 2013, and more racinos are scheduled to begin operations during 2013 and 2014.
state-by-state economic impact Continued
OKLAHOMACurrent # of operating Casinos 2
Casino format Racetrack casinos with slot machines
Casino employees 870
Casino employee Wages N/A1
gross Casino gaming revenue $113.06 million
gaming tax revenue $20.38 million
how taxes spent Education
legalization date 2004
first Casino opening date 2005
state gaming tax rate Graduated state tax from 10-30% on gross gaming revenue; 9% tax to state racing commission, varying payments to horsemen, breeders and purses depending on track gaming revenues
Mode of legalization Statewide question on ballot
Visitor Volume Data not available1Both properties in Oklahoma declined to provide wage data.
Sources: Oklahoma Horse Racing Commission, State of Oklahoma-Office of the State Auditor and Inspector
Oklahoma City
Claremore
Year-over-year increases in both gross gaming revenue (+6.4 percent) and direct gaming tax receipts (+11.4 percent) are signs that Oklahoma’s commercial gaming industry is continuing to grow and rebound from the recent economic recession.
Cleveland
Columbus
Toledo

2013 AGA Sur vey of CASino en t er tAinmen t 21
state-by-state economic impact Continued
PENNSyLVANIACurrent # of operating Casinos 11
Casino format Land-based and racetrack casinos with slots and table games
Casino employees 10,162
Casino employee Wages $339.77 million (includes tips and benefits)
gross Casino gaming revenue $3.158 billion
gaming tax revenue $1.487 billion
how taxes spent Property tax relief, economic development, tourism, horse racing industry, host local government
legalization date 2004
first Casino opening date 2007
state gaming tax rate Slot Machines: 55% tax – 34% to state gaming fund,12% to horse racing industry, 5% to economic development, 4% to local and county governments; Table Games: 16% tax – 14% to general fund, 2% to local county municipalities
Mode of legalization Legislative action
Visitor Volume Data not availableNote: Pennsylvania wage and employment data includes seven of 11 properties, as four declined to participate in data collection.
Sources: Pennsylvania Gaming Control Board, individual properties
Erie
Wilkes-Barre Mount Pocono
Meadow LandsBensalem
ChesterGrantville
BethlehemPittsburgh
RHODE ISLANDCurrent # of operating Casinos 2
Casino format Racetrack casinos with publicly-run video lottery terminals with distributions to operators
Casino employees N/A
Casino employee Wages N/A
gross Casino gaming revenue $527.96 million
gaming tax revenue $328.98 million (FY 2012)
how taxes spent General fund
legalization date 1992
first Casino opening date 1992
revenue retained by operator 27.58%1
Mode of legalization Legislative action
Visitor Volume Data not availableNote: Both properties in Rhode Island declined to provide employment and wage data.1FY 2012 data was used to calculate the percentage of revenue retained by operator.
Sources: Rhode Island Lottery, individual properties
Lincoln
Newport
Philadelphia
Economic recovery and the continued success of existing properties combined with the opening of the state’s 11th casino in Valley Forge to drive Pennsylvania’s 2012 increases in gaming revenue (+4.6 percent) and tax receipts (+2.1 percent) when compared to 2011 figures. Pennsylvania’s statewide gaming revenue was the second largest in the country during 2012, moving past New Jersey for the first time.
Due in part to the recovering overall economy, Rhode Island’s two casinos brought in more gross gaming revenue (+2.9 percent) in 2012 than in 2011, and generated more tax revenue (+6.6 percent) in FY 2012 than they did in FY 2011.
Valley Forge

22 2013 AGA Sur vey of CASino en t er tAinmen t
WEST VIRGINIACurrent # of operating Casinos 5
Casino format Racetrack casinos with publicly run video lottery terminals and table games with distributions to operators, one land-based commercial casino
Casino employees 4,351
Casino employee Wages $134.68 million
gross Casino gaming revenue $948.81 million
gaming tax revenue $402.50 million
how taxes spent Education, senior citizens, tourism
legalization date 1994
first Casino opening date 1994
revenue retained by operator 47.11%
Mode of legalization Local option vote, legislative action
Visitor Volume Data not availableNote: West Virginia wage and employment data includes four of five properties, as one declined to participate in data collection. 2011 data was used for two properties because they declined to provide 2012 information.
Sources: West Virginia Lottery, individual properties
Chester
Wheeling
Charles Town
Cross Lanes
SOUTH DAKOTACurrent # of operating Casinos 35
Casino format Land-based (limited-stakes; $100 maximum bet)
Casino employees 1,686 (CY 2011)
Casino employee Wages $38.17 million (CY 2011) (includes tips)
gross Casino gaming revenue $107.36 million
gaming tax revenue $16.62 million
how taxes spent 50% commission fund; 40% Department of Tourism; 10% Lawrence County
legalization date 1989
first Casino opening date 1989
state gaming tax rate 9% tax on gross gaming revenue; gaming device tax ($2,000 per machine per year)
Mode of legalization Statewide vote, local option vote, legislative action
Visitor Volume Data not availableSources: South Dakota Gaming Commission, Labor Market Information Center, South Dakota Department of Labor
Deadwood
White Sulphur Springs
After enduring shrinking revenue in 2011 due to a smoking ban, South Dakota’s commercial casinos saw gaming (+6.4 percent) and tax (+1.6 percent) revenues bounce back in 2012 thanks to improvements in the overall economy.
Increased competition from new casinos in neighboring states played a role in keeping West Virginia from experiencing the gaming growth seen by other states. Compared to 2011 figures, casinos in West Virginia saw their gross gaming revenues and direct gaming tax receipts both decline by 1.0 percent in 2012.
state-by-state economic impact Continued

casino Visitation Rates by age, 2012
Young people age 21-35 exhibit the highest rate of casino visitation, with nearly four out of 10 (39 percent) having gone to a casino in the past year. However, this visitation rate is only slightly higher than that among respondents age 50-64 (36 percent) and those age 36-49 (34 percent). Only just more than one quarter (28 percent) of older Americans age 65 and over visited a casino during 2012.
Profile of Casino VisitorsCasino gambling is an activity that adults 21 and over across the United States enjoy every day, and
those casino customers are the lifeblood of the gaming industry. The polling results on the pages that follow have been compiled to provide a better understanding of the gambling habits and behaviors of those customers.
An important segment of the gaming customer base is young adult casino visitors. To get a more complete picture of this group’s opinions and activities, VP Communications, in conjunction with national pollster Peter D. Hart, polled 300 young adults age 21-35 who had visited a casino during the past year. Those results have been collected in the following pages. In many cases, opinion polling results focusing on young adult casino visitors have been juxtaposed with results for the total population of casino visitors from the overall national polling sample. Visitors age 21-35 also are part of that sample.
The comparison of the two groups illustrates two complementary facts. First, young casino visitors have very similar gambling habits to those of the overall population of casino visitors. Similar percentages of each group set budgets before visiting a casino, electronic gaming machines are the favorite casino game of each group, and fine dining is the most popular non-gaming amenity. Additionally, both groups visit local attractions and restaurants outside the casino during their trips, and significant numbers of them never or rarely gamble when they visit a casino.
However, there are underlying differences that show young adult casino visitors, as a group, have distinct gambling habits that could shape the casino of the future. Table games are more popular with younger casino visitors than with the overall sample, as are bars, shopping, spas and pools. Young adult casino visitors also are more likely to participate in other forms of gambling like casual betting with friends, playing poker or gambling on the Internet. They are more likely to return to a casino in the next 12 months than the general visitor population, but young adult visitors say they will return less often.
The following pages provide a brief but telling snapshot of the activities, behaviors and attitudes of the casino visitors of today and those who are most likely to be visiting in the years to come.
0
5
10
15
20
25
30
35
40
28%
36%39%
34%
Age 21-35 Age 65 and over
Age 36-49 Age 50-64
Source: VP Communications, Inc. and Peter D. Hart
total casino Visitors, 2012
VP Communications, Inc. and Peter D. Hart and U.S. Census Bureau12011 Census figures were used because 2012 data was not available at press time
76.1 Million Casino Visitors
34%
More than one-third (34 percent) of the U.S. adult population visited casinos during 2012, whether they chose to gamble or not.
Total U.S. population age 21 and older = 223.7 million1
2013 aga sur VeY of Casino en t er tainMen t 23

24 2013 AGA Sur vey of CASino en t er tAinmen t
All Casino Visitors
Young Adult Casino Visitors
All Survey Respondents
0
5
10
15
20
25
30
26%
19%
15%
18%
Less than $35,000 $100,000 to $149,000$35,000 to $60,000 $60,000 to $99,000
25%26%
16%15%
8%6%
18%
9%
Don’t Know/RefusedMore than $150,000
22% 22%
19%
8%7%
22%
Profile of Casino Visitors Continued
casino Visitation by level of education, 2012
What describes your formal level of education?
When compared with the national sample of survey respondents, casino visitors tend to have higher levels of education. More than half (52 percent) have completed college, compared to 46 percent of the overall survey sample. Young adult casino visitors reach even higher education levels, with two-thirds (66 percent) having completed college.
10%
14%
2% 2%
Some High School Completed CollegeCompleted High School
Vocational School or Some College
0
10
20
30
40
50
31%
21%
31%
42%
21%24%
1% 0%Don’t Know/RefusedPost Graduate
Degree
All Casino Visitors
Young Adult Casino Visitors
1%
22%
28% 29%
17%
All Survey Respondents
2%
Source: VP Communications, Inc. and Peter D. Hart
casino Visitation by Household income, 2012
What is your total household income?
Casino visitors have similar household incomes to national survey respondents, with casino visitor households making slightly more. Nearly half (49 percent) of all casino visitors’ households make more than $60,000 per year, while only 34 percent of households in the overall national sample have the same annual income. Household incomes for young adult casino visitors are in line with the broader population of casino visitors, as 47 percent make more than $60,000 annually.
Source: VP Communications, Inc. and Peter D. Hart

2013 AGA Sur vey of CASino en t er tAinmen t 25
Forms of gambling Participated in During the last 12 Months: U.S. Population, 2012
For the general population of survey respondents, playing the lottery was the most popular form of gambling in 2012, with more than half (53 percent) participating in the past year. Casino gambling was the next most popular option, with a participation rate of nearly one-third (32 percent), followed by casual betting with friends on things like fantasy sports or a game of golf (26 percent).
0
10
20
30
40
50
60
12%
26%
53%
32%
Playing theLottery
PlayingPoker
Wageringon a Race
Casino Gambling
Internet Gambling
3%6%
CasualBetting w/Friends*
*Includes fantasy sports, a game of golf, etc.Source: VP Communications, Inc. and Peter D. Hart
caSino ViSitation
other Forms of gambling Participated in During the last 12 Months: casino Visitors, 2012
13%
48%
68%
37%
Playing theLottery
PlayingPoker
Wageringon a Race
Internet Gambling
8%3%
CasualBetting w/Friends*
*Includes fantasy sports, a game of golf, etc.
13%
72%
20%
33%
0
10
20
30
40
50
60
70
80
All Casino Visitors
Young Adult Casino Visitors
Source: VP Communications, Inc. and Peter D. Hart
As would be expected, casino visitors of all ages are more likely to participate in other forms of gambling than the general public (see the chart above), but young adult casino visitors have higher participation rates in four out of the five other forms of gambling mentioned in the survey. The most notable participation gaps were 13 points for playing poker, 11 points for casual betting and five points for Internet gambling.
total casino gamblers, 2012
Source: VP Communications, Inc. and Peter D. Hart and U.S. Census Bureau12011 Census figures were used because 2012 data was not available at press time
71.6 Million Casino Gamblers
32%
Nearly one-third (32 percent) of the U.S. adult population gambled in casinos during 2012. This is a significant increase from the 27 percent who visited casinos to gamble in 2011.
Total U.S. population age 21 and older = 223.7 million1
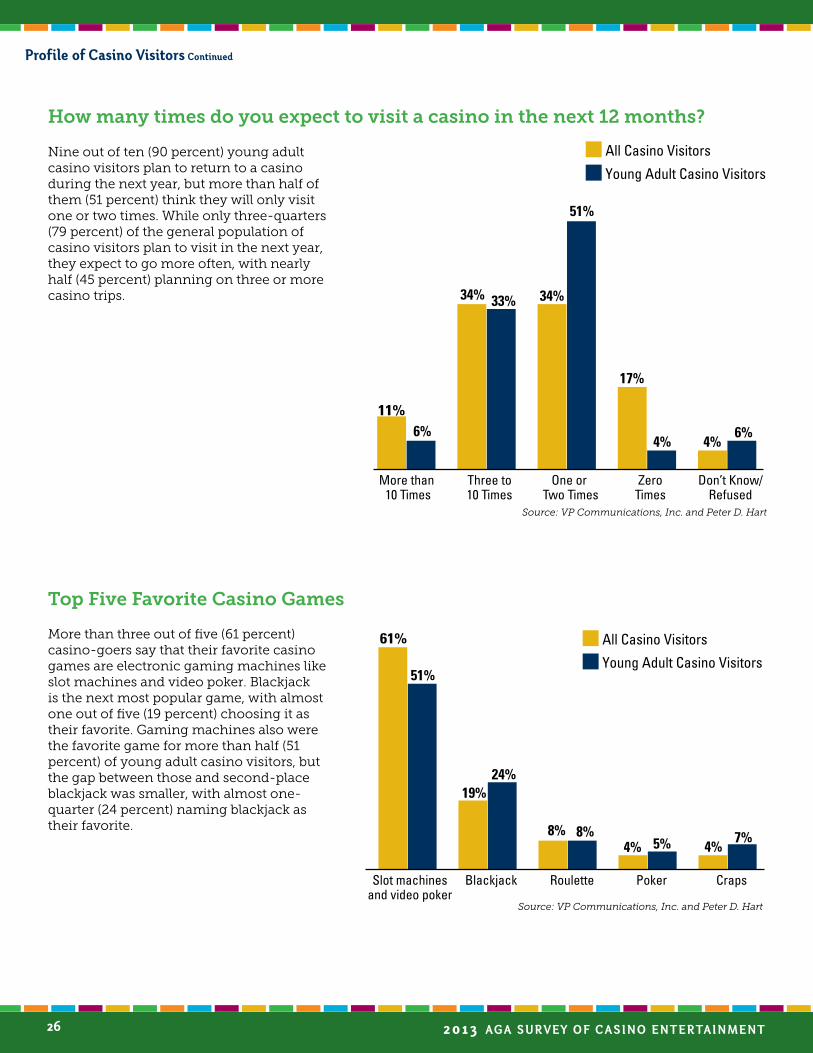
26 2013 AGA Sur vey of CASino en t er tAinmen t
0
10
20
30
40
50
60
70
80
24%19%
61%
51%
8%
Slot machinesand video poker
Poker CrapsBlackjack Roulette
All Casino Visitors
Young Adult Casino Visitors
7%4%5%4%
8%
Source: VP Communications, Inc. and Peter D. Hart
top Five Favorite casino games
0
10
20
30
40
50
60
33%34%
11%6%
34%
More than 10 Times
ZeroTimes
Don’t Know/Refused
Three to10 Times
One or Two Times
All Casino Visitors
Young Adult Casino Visitors
6%4%4%
17%
51%
How many times do you expect to visit a casino in the next 12 months?
Nine out of ten (90 percent) young adult casino visitors plan to return to a casino during the next year, but more than half of them (51 percent) think they will only visit one or two times. While only three-quarters (79 percent) of the general population of casino visitors plan to visit in the next year, they expect to go more often, with nearly half (45 percent) planning on three or more casino trips.
Source: VP Communications, Inc. and Peter D. Hart
Profile of Casino Visitors Continued
More than three out of five (61 percent) casino-goers say that their favorite casino games are electronic gaming machines like slot machines and video poker. Blackjack is the next most popular game, with almost one out of five (19 percent) choosing it as their favorite. Gaming machines also were the favorite game for more than half (51 percent) of young adult casino visitors, but the gap between those and second-place blackjack was smaller, with almost one-quarter (24 percent) naming blackjack as their favorite.

2013 AGA Sur vey of CASino en t er tAinmen t 27
When you visited a casino this past year, in what other activities did you participate?
BeyonD tHe caSino FlooR
01020304050607080
69%
Ate at a fine dining restaurant
All Casino Visitors
Young Adult Casino Visitors
Went shopping Used recreationalfacilities, such as a
spa, pool, fitness area or golf course
Visited a bar or club
Saw a show, concert or other live
entertainment
42%45%
62%55%
76%
65%
50%
35%
58%
Source: VP Communications, Inc. and Peter D. Hart
When you visit a casino, how often do you gamble?
Considering the array of entertainment options at casinos, it should come as no surprise that not all visitors choose to gamble during their visits. In fact, more than a quarter (26 percent) of visitors say they never or rarely gamble when they go to casinos. The percentage who never or rarely gamble is smaller for young adult casino-goers, but so is the percentage who say they always do.
Source: VP Communications, Inc. and Peter D. Hart
0
10
20
30
40
50
60
All Casino Visitors
Young Adult Casino Visitors
Never or RarelyUsually or Sometimes
Always or Almost Always
26%22%
46%53%
34%
19%
Modern casinos offer a wide range of activities besides gambling, and adult visitors of all ages take advantage of these amenities. Eating at a fine dining restaurant and seeing a show or concert were the most popular among all casino-goers, with 69 percent and 55 percent participating in those activities, respectively. Young adult casino visitors are more likely to participate in all of the activities mentioned, and while eating at a fine dining restaurant (76 percent) was still the most popular activity, visiting a bar or a club (65 percent) was the second most popular pastime for visitors age 21-35.

28 2013 AGA Sur vey of CASino en t er tAinmen t
Profile of Casino Visitors Continued
All CASiNo ViSiTorS
1. Dining – 65%
2. Shows – 39%
3. Shopping – 33%
4. Bars and Nightclubs – 17%
5. Spa Treatments – 14%
Dining tops the list of activities for non-gambling casino visitors in both the overall (65 percent) and young adult (68 percent) survey samples. Young adult visitors who never or rarely gamble participate in more activities, with about half taking advantage of bars and nightclubs (51 percent), shopping (47 percent) or shows (46 percent).
YouNg AdulT CASiNo ViSiTorS
1. Dining – 68%
2. Bars and Nightclubs – 51%
3. Shopping – 47%
4. Shows – 46%
5. Pool Area – 32%
if you never or rarely gamble, what are your favorite things to do at a casino?
(Respondents could give multiple answers, and the top five are listed)
Source: VP Communications, Inc. and Peter D. Hart
When you think about going to a casino for an evening out, how good of a value for your money is it compared to other entertainment options you might enjoy?
Source: VP Communications, Inc. and Peter D. Hart
35%
2%
64%
An Excellent/Very Good/Good Value
A Not So Good/Poor ValueDon’t Know/Refused
28% 69%
3%
When casino visitors are asked to compare the value of their evening at a casino to other entertainment options, almost seven out of 10 (69 percent) say it is an excellent, very good or good value for the money, and almost two-thirds (64 percent) of young adult casino visitors agree.
all Casino VisitorsYoung adult
Casino Visitors

2013 AGA Sur vey of CASino en t er tAinmen t 29
enteRtainMent oUtSiDe tHe caSino When you visited a casino this past year, how often did you visit other attractions in the area outside the casino property?
Source: VP Communications, Inc. and Peter D. Hart
34%
1%
64%
Always/Usually/Sometimes
Never/Rarely Don’t Know/Refused
48% 53%
When you visited a casino this past year, how often did you shop or eat at other places in the area outside the casino property?
Source: VP Communications, Inc. and Peter D. Hart
Casinos are important parts of their communities’ tourism mix, and casino-goers often visit other attractions as part of their casino visits. In fact, more than half (53 percent) of all casino visitors also go to other attractions in the area. Among young adult casino visitors, the percentage is even higher, with almost two-thirds (64 percent) taking advantage of other tourism opportunities outside the casino.
29%
1%
71%
Always/Usually/Sometimes
Never/Rarely Don’t Know/Refused
34% 65%
1%
Casinos often help other businesses by bringing new tourists and visitors to an area. Public opinion polling supports this, as almost two-thirds (65 percent) of all casino visitors shop or eat at places outside the casino property, while more than seven out of 10 (71 percent) young adult casino visitors do the same.
all Casino VisitorsYoung adult
Casino Visitors
all Casino VisitorsYoung adult
Casino Visitors

30 2013 AGA Sur vey of CASino en t er tAinmen t
gaMBling ReSPonSiBly
Profile of Casino Visitors Continued
Do you set a budget when you go casino gambling?
Source: VP Communications, Inc. and Peter D. Hart
8% 1%
91%
Yes
NoDon’t Know/Refused
13% 86%
1%
For vast majorities of visitors, setting a budget goes hand-in-hand with a trip to a casino, as 86 percent of those surveyed set a budget prior to gambling. The number of young adult casino visitors who set a budget is even higher at more than nine out of 10 (91 percent).
all Casino VisitorsYoung adult
Casino Visitors
What budget do you usually set for a day of casino gambling?
Gambling budgets vary, but a majority of all casino visitors (53 percent) and young adult casino visitors (57 percent) set a budget of less than $100 for a day of casino gambling. At least 75 percent of both groups set a budget of less than $200 per visit.
Source: VP Communications, Inc. and Peter D. Hart
0
10
20
30
40
50
60
All Casino Visitors
Young Adult Casino Visitors
$200-$299 Don’t Know/Refused
$100-$199Less than $100
11%
22%
57%53%
21%
8%9%12%
5%1%
$300 or more

2013 AGA Sur vey of CASino en t er tAinmen t 31
young adult casino-goers were asked to compare the amount of money they spend at casinos each year to the amount they spend on other hobbies or forms or entertainment they enjoy.
The relatively small budgets preferred by most young adult casino visitors go hand-in-hand with the amount of money they spend on casinos compared to other activities. Almost four out of five (79 percent) spend less at casinos each year than they do on other hobbies or forms of entertainment.
Source: VP Communications, Inc. and Peter D. Hart
young adult casino-goers were asked if, during their recent visits, they have seen or heard responsible gaming messages warning customers about the dangers of gambling more than they can afford and encouraging them to gamble responsibly.
Responsible gaming is an important issue for the casino industry, and most gaming properties provide patrons with information about how they can make responsible decisions. Young adult casino-goers are noticing these efforts, as more than seven out of 10 report seeing responsible gaming messages during their recent casino visits.
Source: VP Communications, Inc. and Peter D. Hart
Spend More at Casinos
Spend Less at CasinosSpend About the Same
14%
79% 1% 6% Don’t Know/Refused
Yes
No24%
71% 5% Don’t Know/Refused

32 2013 AGA Sur vey of CASino en t er tAinmen t
aMeriCan PerCePtions of Casino entertainMent
U.S. casino gaming acceptability, 2004-2013
49%
50%
52%
45%43%
54% 54%
4% 3%3% 2%3%1% 2%
0
10
20
30
40
50
60
2007 20122004 2005 20132006 2008 2009 2010 2011
Don’t Know/Refused
Not Acceptable for Anyone
Acceptable for Others but Not You Personally
Acceptable for You and Others*
30%
35%
29%27% 27%
36%38%
18%16%16%
14%15%17%17%
44%
3%
38%
15%
46%
35%
16%
2%
47%
38%
14%
1%
Source: VP Communications, Inc. and Peter D. Hart*Prior to 2012, survey participants were asked if casino gaming was “perfectly acceptable for anyone to do,” rather than the way it is currently asked, “acceptable for you and others.”
According to 2013 public opinion polling, a strong majority (85 percent) of Americans thinks that casino gaming is acceptable for themselves or others. This figure is the highest acceptability level in the past decade.

2013 AGA Sur vey of CASino en t er tAinmen t 33
Age 40-49 Age 60 and overAge 21-39
37%41%
50%54%
35%
41%39%
Age 50-59
0
10
20
30
40
50
60
45%
10%
1%1%3%0%
17%14%
11%
Don’t Know/Refused
Not Acceptable for Anyone
Acceptable for Others but Not You Personally
Acceptable for You and Others
U.S. casino gaming acceptability by age
While casino gaming acceptability rates are higher in younger cohorts of survey respondents, more than eight out of 10 Americans in each age category think that casino gaming is acceptable for them or others. Young adults are more favorable towards casino gaming — 89 percent of those age 21-39 say it is acceptable for themselves or others — while respondents over age 60 are the least favorable.
Source: VP Communications, Inc. and Peter D. Hart
DiVing DeePeR into tHe accePtaBility FigUReS
U.S. casino gaming acceptability among those Who Say they Know the industry Best
(Acceptability among those who answered that they know a great deal, quite a bit or some about the casino industry)
The more people know about the gaming entertainment industry, the more acceptable they are of the activity. Nine out of 10 (90 percent) survey respondents who say they know a great deal, quite a bit or at least some about the casino industry think that casino gaming is acceptable for them or others.
Source: VP Communications, Inc. and Peter D. Hart
Acceptable for Youand OthersAcceptable for Others but Not You Personally26%
64%
2%
Not Acceptablefor Anyone
8% Don’t Know/Refused

34 2013 AGA Sur vey of CASino en t er tAinmen t
Positive DirectionNo Direction
Having well-runand professionally-
managed companies
Offering more attractionsand activities
besides gambling
48%
70%
24%
17%
Giving back to the community
62%
28%24%
14%13%
Wrong Direction
01020304050607080
in which direction would you say the casino gaming industry is moving in how it deals with the following issues?
(Results are only for those respondents who expressed an opinion)
Source: VP Communications, Inc. and Peter D. Hart
american Perceptions of Casino entertainment Continued
The gaming industry is full of diverse, well-managed companies that are important parts of their community and provide world class entertainment to their customers, and survey respondents recognize this. Of those respondents who expressed an opinion on these questions, seven out of 10 (70 percent) say that the gaming industry is moving in a positive direction in terms of offering more non-gambling activities and attractions; more than three out of five (62 percent) acknowledge positive movement in the realm of having well-run and professionally-managed companies. Additionally, twice as many respondents say that gaming companies are making positive progress (48 percent) in giving back to the community as those who say they are moving in the wrong direction (24 percent).

2013 AGA Sur vey of CASino en t er tAinmen t 35
sPotlight on gaMing MaChinesnumber of gaming Machines per State, 2012
1As of December 31, 2011 Source: The Innovation Group2FY 2012
Across the U.S., there are more than 853,000 electronic gaming machines at commercial and tribal casinos and non-casino locations. More than half (52.3 percent) of the machines are in commercial casinos, while 38.5 percent are in tribal casino properties. Nevada has the most electronic gaming machines with a total of more than 178,000. The states with the next two largest totals — California (68,341) and Oklahoma (64,786) — have less than half of that number.
gaming Machine Revenue as Percentage of overall gaming Revenue in commercial casino States*, 2012
SD IN°MOCOIA MSKS IL NJWV NV
91.0 90.3 89.6 88.385.0 84.8 83.584.084.6
76.478.2
DE PA
71.8 71.5
0
20
40
60
80
100
62.5
OH°
*Commercial casino states not listed here either do not have table games or do not collect separate revenue data for table games and gaming machines. Only states where table games were operational for the same amount of time during the year as slot machines were included.
°Excludes slot machine win from slots-only racetrack casino properties.
Source: State gaming control boards
All commercial gaming states with table games and slot machines collect at least 62 percent of their revenues from electronic gaming machines. Properties in Iowa (91.0 percent) and South Dakota (90.3 percent) receive the largest percentage of revenues from slots, and Nevada (62.5 percent) receives the smallest portion, followed by Ohio (71.5 percent) and New Jersey (71.8 percent).
2013 aga sur VeY of Casino en t er tainMen t 35
Machines in Machines Machines in Commercial in Tribal non-Casino State Casinos Casinos1 Locations TotalAlabama 4,200 4,200Alaska 90 90Arizona 14,530 14,530Arkansas 1,900 1,900California 68,341 68,341Colorado 14,744 1,475 16,219Connecticut 11,788 11,788Delaware 6,595 6,595Florida 6,393 13,069 19,462Idaho 3,911 3,911Illinois 11,298 2,290 13,588Indiana 21,963 21,963Iowa 18,302 2,022 20, 324Kansas 4,200 3,675 7,875Louisiana 19,919 6,160 14,197 40,276Maine 1,739 1,739Maryland 7,050 7,050Michigan 9,640 24,519 34,159Minnesota 22,585 22,585Mississippi 32,414 3,618 36,032Missouri 18,336 18,336Montana 1,527 14,280 15,807Nebraska 483 483Nevada 158,660 1,134 18,930 178,724New Mexico 2,602 15,482 18,084New Jersey 26,883 26,883New York 17,211 11,934 29,145North Carolina 3,145 3,145North Dakota 3,647 3,647Ohio 9,023 9,023Oklahoma 1,250 63,536 64,786Oregon 7,373 12,163 19,536Pennsylvania 26,476 26,510Rhode Island 5,836 5,851South Dakota2 3,761 2,461 9,128 15,260Texas 1,858 1,858Washington 28,007 28,007West Virginia 8,475 7,467 15,942Wisconsin 17,997 17,997Wyoming 1,505 1,505Total 446,458 328,284 78,455 853,197

sPotlight on sPorts bet tingSports betting is a popular activity in America. Until 2009, Nevada was the only state with legal,
operational sports books. That year, Delaware began taking limited parlay wagers on National Football League (NFL) games. Nevada is still the only state where it is legal to place a wager on a full complement of sporting events and leagues, so the data below describes sports betting in Nevada only.
total amount Wagered vs. gross Revenue, 2008-2012
Casino visitors in Nevada wagered more than $3.4 billion on sporting events in 2012, but the revenue generated by the state’s race and sports books was much smaller. Gross gaming revenues totaled just more than $170 million, only 4.9 percent of the amount wagered.
Source: Nevada Gaming Control Board
What Sports are the Most Popular Bets?
During 2012, football was the most popular sport on which to bet at Nevada’s casinos, garnering 45 percent of total wagers. Basketball was the next most popular with more than a quarter (28 percent) of sports wagers, followed by baseball with 20 percent.
Super Bowl Betting History, 2006-2013
Gamblers in Nevada wager more on the Super Bowl each year than any other one-day sporting event. The overall amount wagered and the casinos’ revenue can vary based on the result of the game and the point spread. For the 2013 game, casino visitors wagered $98.9 million, and all but $7.2 million of that was returned to bettors.
Football: $1.567 Billion
Basketball: $975.01 Million 28%
45%
6%
Baseball: $693.17 Million 20%Other: $215.90 Million
Gross Revenue
2011 20122008 2009 2010.151.136 .141 .170
$ Billions
0.0
0.5
1.0
1.5
2.0
2.5
3.0
3.5
.136
$30.74
2 3 4 5 6 71
$10.6$29.3
$90.2
$164.9
$267.0
$5.1
2.570
3.451
2.578
Amount Wagered
0.0
0.5
1.0
1.5
2.0
2.5
3.0
3.5
2.761 2.879
Source: Nevada Gaming Control Board
0
20
40
60
80
100
2006 2007 2008 2009
$ Millions
5.066.68-2.6012.908.83
2010 20122011
93.9094.53 93.07 92.0681.51 82.73
6.87
87.49
0.72
Gross Revenue Amount Wagered
0
20
40
60
80
100
7.21
2013
98.94
Source: Nevada Gaming Control Board
36 2013 aga sur VeY of Casino en t er tainMen t

2013 AGA Sur vey of CASino en t er tAinmen t 37
bingo: A game of chance in which each player has one or more cards printed with differently numbered squares on which to place markers when the respective numbers are drawn and announced by a caller. The first player to mark a complete pattern of numbers (e.g., a row) wins.
Class i game*: A social game that is not considered a game of chance, played solely for prizes of minimal value; or a traditional form of Indian gaming engaged in by individuals as a part of or in connection with tribal ceremonies or celebrations.
Class ii game*: A game of chance including (if played in the same location) bingo, pull-tabs, lotteries, punchboard and other games similar to bingo, whether live or electronic, in which players bet against other players; an electronic game played on a “linked” video gaming device that is connected to a central computer system.
Class iii game*: Any form of gaming besides a Class I and Class II game, including electronic gaming devices with random-number generators and house-banked table games.
Commercial Casino: A private-sector establishment (i.e., nongovernmental) — whether land-based, riverboat, dockside, limited-stakes or racetrack casino — that offers games of chance and is regulated and taxed by the state where it is located.
dockside Casino: A casino on a body of water that is not required to cruise or is a permanently moored barge.
effective tax rate: The total percentage a casino pays in taxes, including taxes on direct gross gaming revenue and admissions as well as corporate, payroll, real estate and other taxes similar to those paid by other businesses.
electronic gaming device, or egd: Any mechanical or electronic game of chance, including slot machines, video lottery terminals (VLTs) and video bingo, video pull-tabs and video poker machines.
gross gaming revenue: The amount a gaming operation earns before taxes, salaries and other expenses are paid — the equivalent of “sales,” not “profit.”
handle: The estimated total amount wagered, including the winnings returned to players.
house advantage: A measure of how much a casino expects to win, expressed as a percentage of the player’s wager.
house-banked game: A game in which the player bets against the house; Class III games (e.g., blackjack and other table games).
land-based Casino: A casino that is built on an earth foundation, not on a waterway.
limited-stakes Casino: A casino in which the allowable bet on a single hand is limited to a maximum wager.
odds: 1) the probability of winning; 2) the payout in relation to amount wagered, e.g., winning odds.
Pari-mutuel: A system of betting on races whereby the winners divide the total amount bet, after deducting management expenses, in proportion to the sums they have wagered individually.
Player-banked game: A game in which the player bets against other players; Class II games (e.g., bingo and pull-tabs).
Pull-tabs: A game of chance in which a player opens perforated windows on a paper card, matching symbols on the card to win. Each group, referred to as a set, of pull-tabs has a unique prize structure; winners collect the prize that correlates to the specific pull-tab set.
racetrack Casino, or racino: A hybrid of a pari-mutuel venue — horse track, dog track or jai alai court — and a casino. Typically, the “casino” at a racino offers only slot machine games.
random-number generator: A mechanism inside the computer of a Class III game that ensures that each pull has an equal chance of hitting the jackpot.
slot Machine: Any mechanical or electronic device in which outcomes are determined by a random-number generator located inside the terminal.
Video bingo: An electronic version of traditional bingo.
Video lottery terminal, or Vlt: An electronic game of chance played on a video terminal that is networked and can be monitored, controlled and audited by a central computer system. These games are authorized through the state lottery and considered by law to be lotteries, not commercial gaming.
Video Pull-tabs: An electronic version of paper pull-tabs.
gloSSaRy oF gaMing teRMS
*Class I, Class II and Class III are legal terms in the context of the Indian Gaming Regulatory Act (IGRA), but for the purposes of this survey help define the type of gaming operating in different states.
Sources: American Gaming Association; The American Heritage® Dictionary of the English Language, Fourth Edition; Christiansen Capital Advisors; Indian Gaming Regulatory Act (IGRA); National Gambling Impact Study Commission Report; National Indian Gaming Commission; Nevada Gaming Control Board Regulation 29
aPPendix

38 2013 AGA Sur vey of CASino en t er tAinmen t
national economic impact of Casino entertainmentCasino Locations by Category (Map) ....................................4
Casinos per State (Data Table) ...............................................4
U.S. Consumer Spending on Commercial Casino Gaming, 2003-2012 ...............................5
State-by-State Consumer Spending on Commercial Casino Gaming, 2011 vs. 2012 .........................5
Commercial Casino Spending vs. Other Spending Choices, 2012 ..............................................6
Commercial Casino Tax Revenue by State, 2011 vs. 2012 ...........................................................................6
Commercial Casino Jobs by State, 2011 vs. 2012 ...............7
Commercial Casino Wages, 2003-2012 .................................7
Top 20 U.S. Casino Markets, 2012 .........................................8
Top 10 U.S. Racetrack Casino Markets, 2012 ........................8
Top U.S. Casino Markets, 2012 (Map) ...................................8
ageM spotlight on gaming equipment Manufacturers
Gaming Equipment Manufacturing Economic Output, 2007-2012 ...................................................................9
Gaming Equipment Manufacturing Employment, 2007-2012 .................................................................................9
Gaming Equipment Manufacturing Salaries and Wages, 2007-2012 ............................................................9
Gaming Equipment Manufacturers with Employees Covered by Employer-sponsored Health Care Plans .........10
Purchases Made from Local Vendors by Gaming Equipment Manufacturers .....................................10
Gaming Equipment Manufacturers’ Market Expectations for the Next 12 Months .....................10
Historical Expectations of Market Improvement for the Next 12 Months ................................10
Profile of Casino VisitorsTotal Casino Visitors, 2012 ...................................................23
Casino Visitation Rates by Age, 2012 ..................................23
Casino Visitation by Level of Education, 2012 ...................24
Casino Visitation by Household Income, 2012 ...................24
Forms of Gambling Participated in During the Last 12 Months: U.S. Population, 2012 .........................25
Total Casino Gamblers, 2012 ...............................................25
Other Forms of Gambling Participated in During the Last 12 Months: Casino Visitors, 2012 .............25
How many times do you expect to visit a casino in the next 12 months? ..................................26
Top Five Favorite Casino Games .........................................26
When you visited a casino this past year, in what other activities did you participate? ......................27
When you visit a casino, how often do you gamble?........27
If you never or rarely gamble, what are your favorite things to do at a casino? ...............................28
When you think about going to a casino for an evening out, how good of a value for the money is it compared to other entertainment options you might enjoy? ..................................................................28
When you visited a casino this past year, how often did you visit other attractions in the area outside the casino property? .......................................29
When you visited a casino this past year, how often did you shop or eat at other places in the area outside the casino property? ............................29
Do you set a budget when you go casino gambling? .......30
What budget do you usually set for a day of casino gambling? .............................................30
Young adult casino-goers were asked to compare the amount of money they spend at casinos each year to the amount they spend on other hobbies or forms of entertainment they enjoy .................................31
Young adult casino-goers were asked if, during their recent visits, they have seen or heard responsible gaming messages warning customers about the dangers of gambling more than they can afford and encouraging them to gamble responsibly ..................31
american Perceptions of Casino entertainmentU.S. Casino Gaming Acceptability, 2004-2013 ...................32
U.S. Casino Gaming Acceptability by Age ........................33
U.S. Casino Gaming Acceptability Among Those Who Say They Know the Industry Best ...................33
In which direction would you say the casino gaming industry is moving in how it deals with the following issues? ....................................................34
spotlight on gaming MachinesNumber of Gaming Machines per State, 2012 (Data Table) ...........................................................................35
Slots Revenue as Percentage of Overall Gaming Revenue in Commercial Casino States, 2012 ......35
spotlight on sports bettingTotal Amount Wagered vs. Gross Revenue, 2008-2012 ....36
What Sports Are the Most Popular Bets? ...........................36
Super Bowl Betting History, 2006-2013 ..............................36
inDex oF cHaRtS appendix Continued

2013 AGA Sur vey of CASino en t er tAinmen t 39
MetHoDologyVP Communications, inc. and Peter d. hartVP Communications, Inc. and Peter D. Hart jointly produced the national public opinion survey and the study of community leaders in casino jurisdictions for the 2013 States of the States report.
Peter Hart has collaborated on the survey research associated with the AGA State of the States report for more than a decade. He is chairman of Peter D. Hart Research Associates and co-director of the NBC/Wall Street Journal poll.
For the national survey, VP Communications interviewed a base sample of 800 American adults from February 25 – March 1, 2013. The margin of error for the total sample is +/- 3.5 percent. Interviews were conducted by telephone using Random Digit Dial sampling to ensure the universe was as representative as possible of the U.S. population 21 and older.
VP Communications also conducted the survey of 300 past year casino visitors age 21-35. The oversample polling was conducted via landline telephone, cellular telephone and online from March 2 – 7, 2013.
Founded in 1999 and based in Alexandria, Va., VP Communications conducts strategic public opinion research for corporate, political and trade association clients. The company specializes in quantitative, survey-based research as well as qualitative, focus group and dial testing studies.
contact: VP communications Andrew Smith 703-535-6553
contact: Peter D. Hart Research associates Peter Hart 202-234-5570
association of gaming equipment Manufacturers (ageM)/applied analysis (aa)In 2013, the Association of Gaming Equipment Manufacturers (AGEM) retained Applied Analysis (AA) to prepare an updated economic impact analysis for the global gaming supplier segment of the gaming industry.
Economic impact measures were segmented into direct impacts and indirect impacts. Direct impacts measure the effects of the specific force being considered. In this case, gaming equipment
manufacturing jobs are considered direct jobs, and the wages and salaries they are paid are considered direct personal income. Indirect impacts consider how other businesses respond to the impacting condition. Employees at part suppliers, for example, are considered indirect employees to the extent that their jobs are dependent, in full or in part, on the suppliers’ income generated by industry-related purchases.
To identify and model the interrelationships in the economy, IMPLAN (Impact Analysis for Planning) software and databases were used. IMPLAN is an input-output model (or econometric system) that utilizes complex economic equations to explain how the “outputs” of one industry become the “inputs” of others, and vice versa. This relationship is sometimes referred to as the “multiplier effect,” illustrating how changes in one sector of the economy can affect other sectors.
AGEM is a non-profit international trade association representing manufacturers and suppliers of electronic gaming devices, systems, table games, key components and support products and services for the gaming industry. AGEM works to further the interests of gaming equipment suppliers throughout the world. Through political action, regulatory influence, trade show partnerships, educational alliances, information dissemination and good corporate citizenship, the members of AGEM work together to create benefits for every company within the organization. Together, AGEM has assisted regulatory agencies and participated in the legislative process to solve problems and create a business environment where AGEM members can prosper while providing a strong level of support to education and responsible gaming initiatives.
Applied Analysis (AA) is a Nevada-based economic analysis and gaming consulting firm with extensive experience in preparing economic and fiscal impact analyses. AA also maintains a broad range of gaming experience and has performed work for some of the largest gaming companies in the world. AA has been retained by several organizations to review and analyze the economic, fiscal and social impacts of community investments and operations. This includes impacts on employment, wages and output, as well as impacts on tax collection and public service demands.
contact: ageM Marcus Prater 702-812-6932
appendix Continued

40 2013 AGA Sur vey of CASino en t er tAinmen t
acKnoWleDgMentSThe American Gaming Association would like to thank the following individuals and organizations for their assistance with the survey: the Association of Gaming Equipment Manufacturers (AGEM), Applied Analysis, Jason Pawlina, Derris Newman of the Innovation Group, Natsuko Graphic Design, TheWadeGroup, Inc., Alan Erskine, Shekinah Hoffman and the industry’s state associations and regulatory agencies.
Frank J. Fahrenkopf, Jr.President & CEO202-552-2675
Judy PattersonSenior Vice President& Executive Director202-552-2675
Dorothy R. JacksonVice President202-552-2675
Whitaker l. askewVice President202-552-2675
Holly WetzelVice President of Communications202-552-2686
Keli elkinsVice President ofIndustry Relations202-552-2685
andrew SmithDirector of Research202-552-2679
Brian lehmanCommunications Manager202-552-2680
Melanie RothrockExecutive Assistant& Office Manager202-552-2670
anne lynchProject and Social Media Coordinator 202-552-2682
Katie griffithStaff Assistant202-552-2675
*For specific questions about the 2013 State of the States survey, please contact Andrew Smith or Holly Wetzel.
inDUStRy aSSociationS
association of gamingequipment Manufacturers (ageM)Marcus Prater702-812-6932
Casino association of indianaMike Smith317-231-7030
Casino association of new Jerseytony Rodio609-731-3279
Colorado gaming associationlois Rice303-237-5480
deadwood (s.d.)gaming associationtom nelson605-578-3074
illinois Casinogaming associationtom Swoik217-546-0945
iowa gaming associationWes ehrecke515-267-9200
louisiana Casino associationWade Duty225-344-0037
Michigan gaming associationRob Russell517-507-3860
Mississippi Casino operatorsassociationlarry gregory601-965-6992
Missouri gaming associationMike Winter573-634-4001
national indian gaming associationJason giles202-546-7711
nevada resort associationVirginia Valentine702-735-4888
new York gaming associationJames Featherstonhaugh518-436-1122
aga contactS*
appendix Continued

1299 Pennsylvania Avenue, NWSuite 1175Washington, DC 20004tel: 202-552-2675 fax: 202-552-2676www.americangaming.org
© 2013 American Gaming AssociationAll rights reserved.


![APPLICATION FOR AN ADULT GAMING CENTRE PREMISES … · 2020. 9. 3. · Small Casino [2 Regional Casino C] Bingo a Betting (Track) Large Casino C] Adult Gaming Centre X Family Entertainment](https://static.fdocuments.us/doc/165x107/5feeb8301b834b013c5b9112/application-for-an-adult-gaming-centre-premises-2020-9-3-small-casino-2-regional.jpg)