The AES Corporation€¦ · Contains Forward Looking Statements 5 1. A non-GAAP financial measure...
38
The AES Corporation March 2012
Transcript of The AES Corporation€¦ · Contains Forward Looking Statements 5 1. A non-GAAP financial measure...

The AES Corporation March 2012

Contains Forward Looking Statements
2
Safe Harbor Disclosure
Certain statements in the following presentation regarding AES’ business operations may constitute “forward-looking statements.” Such forward-looking statements include, but are not limited to, those related to future earnings growth and financial and operating performance. Forward-looking statements are not intended to be a guarantee of future results, but instead constitute AES’ current expectations based on reasonable assumptions. Forecasted financial information is based on certain material assumptions. These assumptions include, but are not limited to accurate projections of future interest rates, commodity prices and foreign currency pricing, continued normal or better levels of operating performance and electricity demand at our distribution companies and operational performance at our generation businesses consistent with historical levels, as well as achievements of planned productivity improvements and incremental growth from investments at investment levels and rates of return consistent with prior experience. For additional assumptions see Slide 36 and the Appendix to this presentation. Actual results could differ materially from those projected in our forward-looking statements due to risks, uncertainties and other factors. Important factors that could affect actual results are discussed in AES’ filings with the Securities and Exchange Commission including but not limited to the risks discussed under Item 1A “Risk Factors” in AES’ 2011 Annual Report on Form 10-K, as well as our other SEC filings. AES undertakes no obligation to update or revise any forward-looking statements, whether as a result of new information, future events or otherwise.

Contains Forward Looking Statements
3
Agenda
n Who We Are Slides 4-8
n Investment Thesis Slides 9-17
n Delivering Results Slides 18-23
n Future Growth Slides 24-28

4
Who We Are

Contains Forward Looking Statements
5
1. A non-GAAP financial measure as reconciled above. Midpoint of 2012 guidance. See “definitions” and 2012 Reconciliation on slide 35.
Who We Are: A Diversified Power Generation & Distribution Company
2012 Proportional Adjusted Gross Margin1: $3.6 Billion
Utilities
n 13 Utilities companies serving 12 million customers
n Operate 8 GW of generating capacity
33%
67% Generation
Utilities
39%
29%
27%
5%
Coal
Natural Gas
Renewables
Other
Generation Portfolio by Fuel Type
Generation
n 39 Generation businesses
n 36 GW of generating capacity
Commodity and Currency Risks Limited by Contracts & Regulatory Structures, as well as Diversification Across Geographies, Asset & Fuel Types

Contains Forward Looking Statements
6
Who We Are: Concentrated in Both Stable & High Growth Markets
2012 Proportional Adjusted Gross Margin1: $3.6 Billion
Key Businesses = 61% of 2012 Proportional Adjusted Gross Margin1
33%
14% 14%
16%
23%
1. A non-GAAP financial measure as reconciled above. Midpoint of 2012 guidance. See “definitions” and 2012 Reconciliation on slide 35. 2. AES’ operations in Chile refers to AES Gener, which is publicly listed in Chile, with businesses in Chile, Colombia and Argentina.
United States
Chile2
Brazil
Other Latin America
Rest of the World
Faster Demand Growth in Emerging Markets Combined with Cash Flow Stability of Developed Markets
U.S.: IPL, DP&L, Contract Generation
Brazil: Eletropaulo,
Tiete, Sul
Chile: AES Gener2
Contains Forward Looking Statements
7
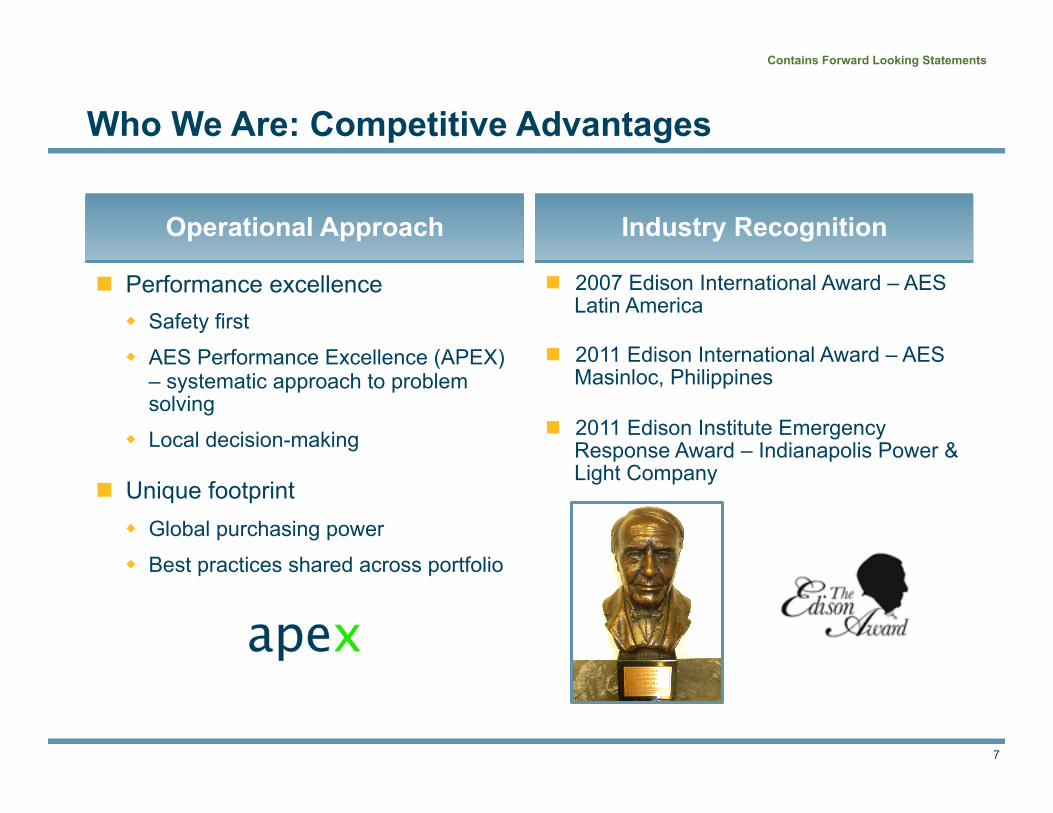
Who We Are: Competitive Advantages
Operational Approach Industry Recognition
n Performance excellence w Safety first
w AES Performance Excellence (APEX) – systematic approach to problem solving
w Local decision-making
n Unique footprint w Global purchasing power
w Best practices shared across portfolio
n 2007 Edison International Award – AES Latin America
n 2011 Edison International Award – AES Masinloc, Philippines
n 2011 Edison Institute Emergency Response Award – Indianapolis Power & Light Company

Contains Forward Looking Statements
8
Who We Are: Business Model Balances Risk Management & Growth
Commercial Strategy Conservative Financing Strategy
n Primarily regulated or contracted n Commodity risk generally mitigated with
fuel pass-throughs w Merchant exposure limited primarily to
DP&L (U.S.) and Argentina
n Currency risk limited by local debt financing, contract indexation and hedging
n Expand business in core markets
w Focus on value creation on each dollar to be invested (capital efficiency)
n Up to 80% of a project’s capital structure funded with non-recourse debt w Mostly fixed rate, long-term, in local
currency w Recourse only to project assets; no
cross-collateralization w Key component of AES’s capital structure
(71% of total debt)
n Equity contribution by AES Parent minimized by local funding sources w Debt and equity capacity available at
subsidiaries, e.g., in Brazil and Chile w Cash retained at subsidiaries, e.g., India w Partners who can help mitigate project risks,
e.g., CIC and Posco in Vietnam project
Commercial and Financing Strategies Designed to Minimize Risk to, and Equity Contribution Required by, AES Parent

9
Investment Thesis

Contains Forward Looking Statements
10
Investment Thesis: Valuation at a Discount to U.S. Utilities
n Trades at ~10.3x P/E multiple vs. diversified utilities’ average P/E multiple of 13.9x2
w Based on mid-point of 2012 Adjusted EPS1 guidance of $1.26
n Offers ~11.6% free cash yield w Based on mid-point of 2012 proportional free cash flow3 guidance of $1.15 billion
and market capitalization of approximately $9.9 billion
Compelling Valuation – At Price of $12.921, AES Stock:
1. Closing price as of March 23, 2012. 2. Source: Bank of America Merrill Lynch research note, March 13, 2012.
3. A non-GAAP financial measure. See Appendix for definition and reconciliation.
Executing on a Comprehensive Plan to Unlock Shareholder Value

Contains Forward Looking Statements
11
Based on 2012 Adjusted EPS1 of $1.26
1. A non-GAAP financial measure. See Appendix for definition and reconciliation.
Investment Thesis: Annual Total Return Target of 8% to 10% (2013 Through 2015)
3-Year CAGR Consists of:
7% to 9% Adjusted EPS1 Growth
n Organic growth at existing businesses n Completion of construction pipeline through 2015 n Planned cost reductions n Discretionary cash invested in debt paydown and share repurchases
w Growth investments and acquisitions would need to be accretive to the base case
1% Dividend Yield n $120 million annual dividend expected to be initiated in Q3 2012
Target Total Return Does Not Assume Any Expansion of Our P/E Multiple

Contains Forward Looking Statements
12
Investment Thesis: 3-Step Plan to Unlock Shareholder Value
1. Optimize capital allocation w Invest cash to maximize total returns
2. Narrow our geographic focus w Up to $2 billion in asset sale proceeds w Grow in markets of choice where we have a competitive advantage
3. Grow profitability w Cut costs and leverage footprint
Focus on Delivering Attractive Risk-Adjusted Total Shareholder Return

Contains Forward Looking Statements
13
1. A non-GAAP financial measure. See Appendix for definition and reconciliation.
Investment Thesis: Capital Allocation Framework
Disciplined Capital Allocation
Parent Free Cash Flow1 After Committed
Dividends
Asset Sale Proceeds
Debt Paydown
Share Buybacks
Growth Projects/ Acquisitions
Dividend Increases
n Reduce financial risk
n Support ‘per share’ value creation
n Growth projects benchmarked against debt paydown and share buybacks
n Drive total shareholder returns
Sources of Capital Investment Alternatives Rationale

Contains Forward Looking Statements
14
1. A non-GAAP financial measure. See Appendix for definition and reconciliation.
Investment Thesis: Narrow Geographic Focus
Today Medium-Term Goals
Core Markets: Operating Assets
% of Proportional Adjusted Gross
Margin1 from Core Markets
n 27 n Fewer than 20
n U.S., Brazil & Chile n Select other markets/
businesses
n U.S., Brazil & Chile n Select other markets/businesses
n 65%-75% n Targeting ~80%-90%
Countries
Focusing Growth in Countries Where We Have a Competitive Advantage; Opportunistically Exiting Certain Non-Core Markets

Contains Forward Looking Statements
15
Fuel Spending
General & Administrative
Costs
Investment Thesis: Growing Profitability Through Operational Excellence & Sourcing
Estimated 2012 Savings of $50 Million & Target of $100 Million in Annual Savings by End of 2013
n $18-$20 billion n Reduce non-technical losses n Working capital management
n $3.5-$4.0 billion, depending on commodity prices
n Coordinated fuel procurement n Fuel flexibility (blending)
n $325-$375 million n Reduced business development costs n Removal of reporting layers n Process optimization
n $1.1-$1.5 billion n Preferred suppliers n Go-to market strategies
2012 Estimate Approach Category
Maintenance (Operating & Capital
Expenditures)
Revenue

Contains Forward Looking Statements
16
AES Eletropaulo – Energy Recovered (GWh)
AES Eletropaulo – EBITDA Improvement (US$)
$53
$86 $100
$107
2008 2009 2010 2011
295
477
558 571
2008 2009 2010 2011
Performance Excellence Example: Non-Technical Loss Reduction at AES Eletropaulo in Brazil

Contains Forward Looking Statements
17
1. Past performance is not an indicator of future performance.
Performance Excellence Example: Switching to Dual-Fuel Operations at ESSA, Chile
2007 to 2009 2010 to 2011
379 MW CCGT in Chile
EBITDA Improvement of ~$177 Million in H1 2011 Compared to H1 20101
n As a result of Argentine gas curtailments, the plant had no access to natural gas, and thus could only operate as a back-up unit using diesel oil
n Transformation achieved by: w Obtaining a duel fuel permit which
secured capacity payments
w Negotiating a settlement with gas transport companies and obtaining source of liquefied natural gas to restart natural gas-fired operations
18
Delivering Results
Contains Forward Looking Statements
19
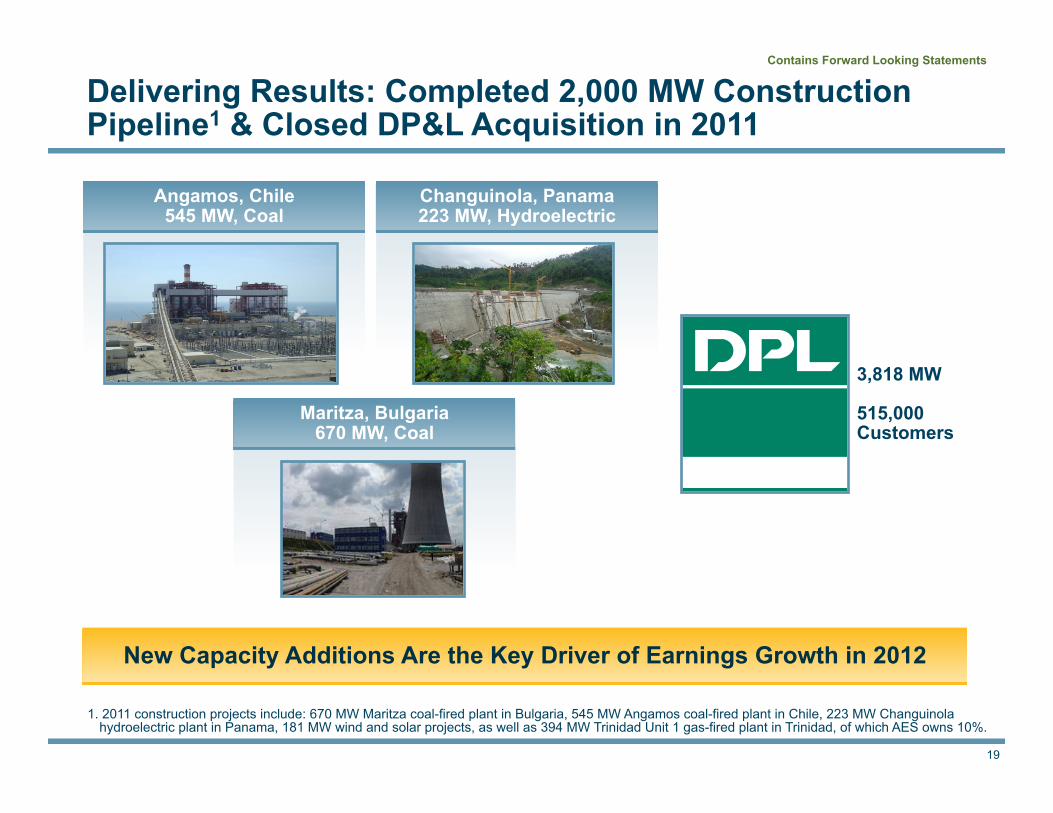
Maritza, Bulgaria 670 MW, Coal
Changuinola, Panama 223 MW, Hydroelectric
Angamos, Chile 545 MW, Coal
1. 2011 construction projects include: 670 MW Maritza coal-fired plant in Bulgaria, 545 MW Angamos coal-fired plant in Chile, 223 MW Changuinola hydroelectric plant in Panama, 181 MW wind and solar projects, as well as 394 MW Trinidad Unit 1 gas-fired plant in Trinidad, of which AES owns 10%.
Delivering Results: Completed 2,000 MW Construction Pipeline1 & Closed DP&L Acquisition in 2011
3,818 MW
515,000 Customers
New Capacity Additions Are the Key Driver of Earnings Growth in 2012

Contains Forward Looking Statements
20
1. A non-GAAP financial measure. See Appendix for definition and reconciliation. 2. Midpoint of 2012 guidance.
Delivering Results: 6% Adjusted EPS1 Growth in 2011 and Expect to Achieve 21% in 2012
$0.98 $1.04
$1.262
2010 2011 2012E
2012 Growth Reflects Contribution of $0.17 from New Businesses Added in 2011

Contains Forward Looking Statements
21
1. Mid-point of 2012 proportional free cash flow guidance range. A non-GAAP financial measure. See Appendix for definition and reconciliation.
Delivering Results: Announced Intent to Initiate a $120 Million Annual Dividend
n Annual dividend represents payout of ~20% of 2012 parent free cash flow1
w First $30 million quarterly payment expected to be made in Q4 2012
n Parent free cash flow1 is available for: w Dividends and share repurchases w Growth investments w Recourse debt repayments
Uses of $1.15 Billion of Proportional Free Cash Flow1 in 2012
52% 38%
10%
Cash Retained at Businesses & Other Uses
~$110 million
Parent Free Cash Flow1
~$600 million
Net Proportional Non-Recourse
Debt Amortization ~$440 million
Parent free cash flow is the driver of dividend capacity
Contains Forward Looking Statements
22
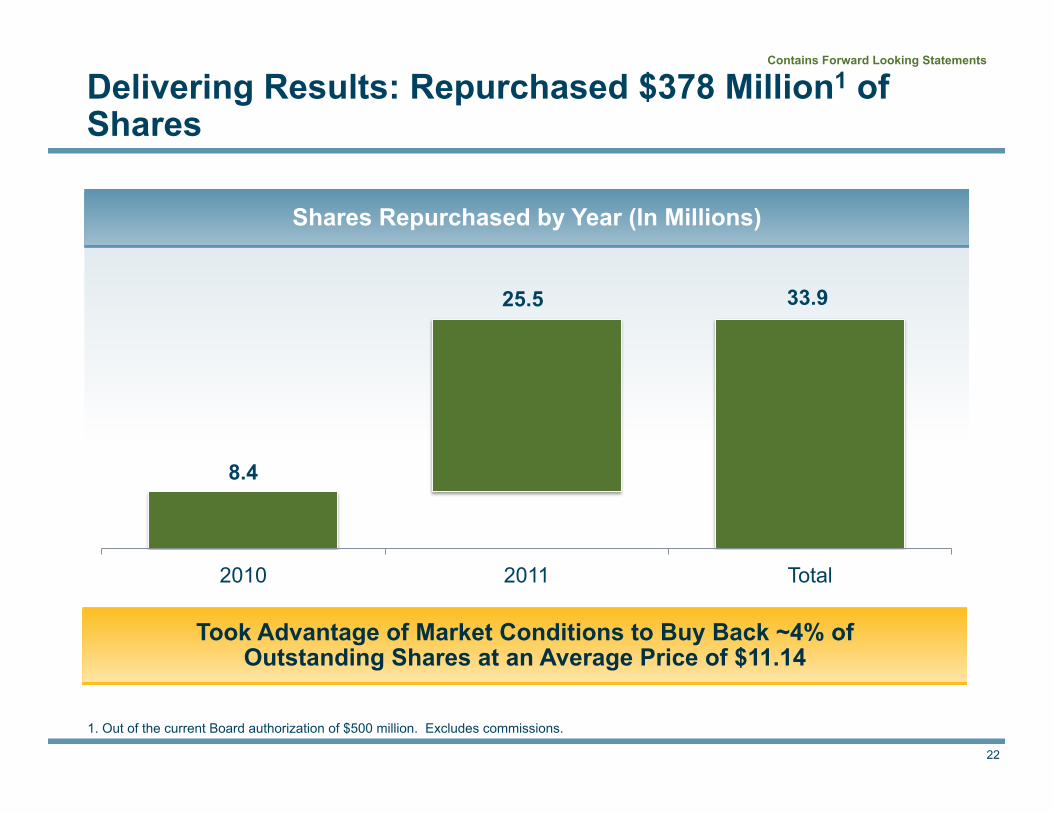
1. Out of the current Board authorization of $500 million. Excludes commissions.
Delivering Results: Repurchased $378 Million1 of Shares
Shares Repurchased by Year (In Millions)
8.4
33.9 25.5
2010 2011 Total
Took Advantage of Market Conditions to Buy Back ~4% of Outstanding Shares at an Average Price of $11.14
Contains Forward Looking Statements
23
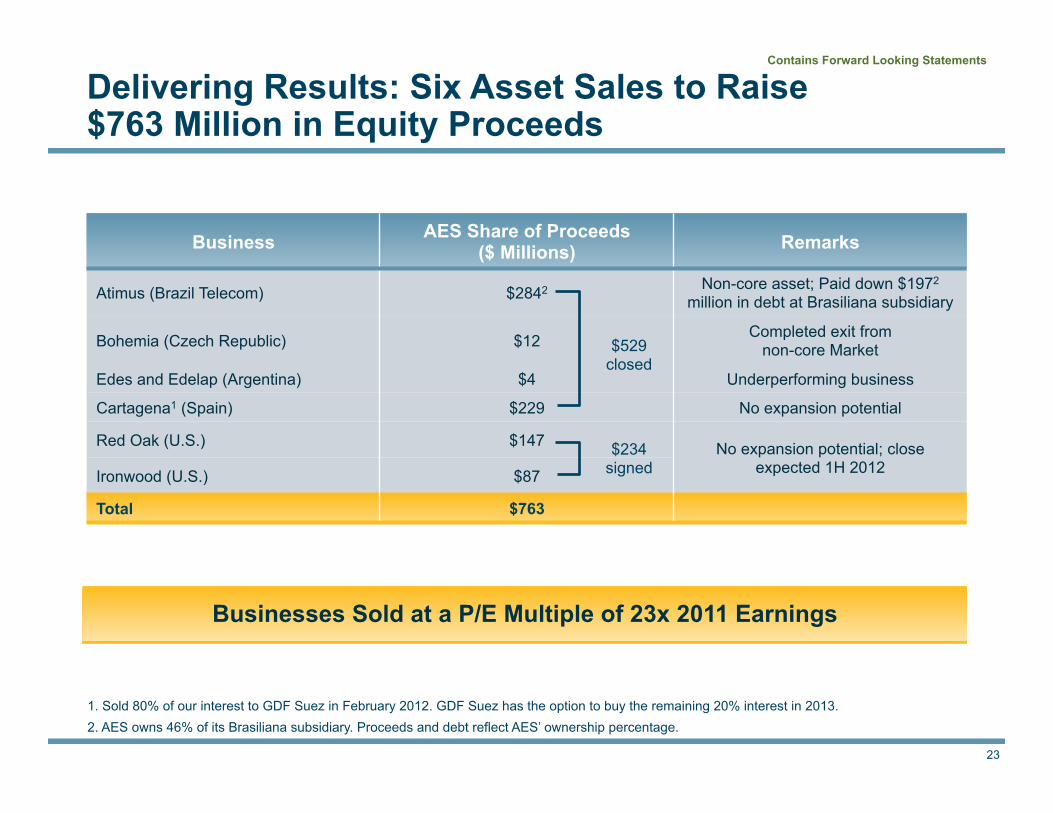
1. Sold 80% of our interest to GDF Suez in February 2012. GDF Suez has the option to buy the remaining 20% interest in 2013. 2. AES owns 46% of its Brasiliana subsidiary. Proceeds and debt reflect AES’ ownership percentage.
Delivering Results: Six Asset Sales to Raise $763 Million in Equity Proceeds
Business AES Share of Proceeds ($ Millions) Remarks
Atimus (Brazil Telecom) $2842 Non-core asset; Paid down $1972 million in debt at Brasiliana subsidiary
Bohemia (Czech Republic) $12 Completed exit from non-core Market
Edes and Edelap (Argentina) $4 Underperforming business
Cartagena1 (Spain) $229 No expansion potential
Red Oak (U.S.) $147 No expansion potential; close expected 1H 2012 Ironwood (U.S.) $87
Total $763
$529 closed
$234 signed
Businesses Sold at a P/E Multiple of 23x 2011 Earnings

24
Future Growth
Contains Forward Looking Statements
25
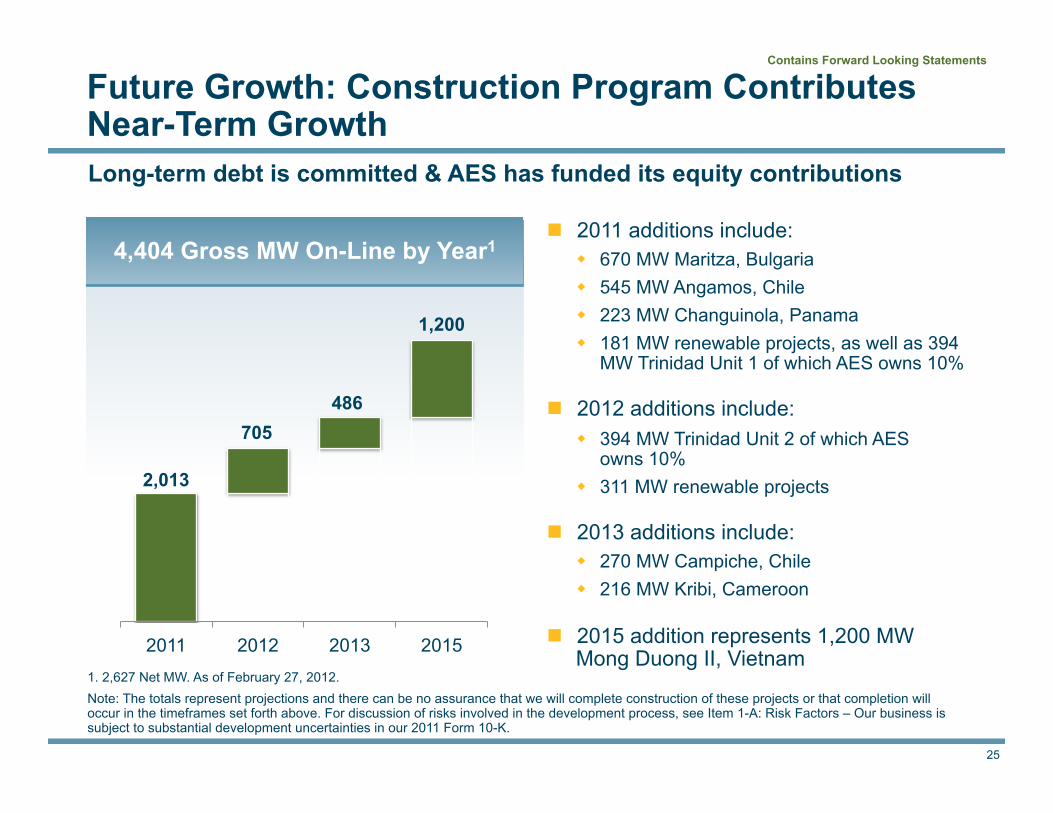
1. 2,627 Net MW. As of February 27, 2012. Note: The totals represent projections and there can be no assurance that we will complete construction of these projects or that completion will occur in the timeframes set forth above. For discussion of risks involved in the development process, see Item 1-A: Risk Factors – Our business is subject to substantial development uncertainties in our 2011 Form 10-K.
Future Growth: Construction Program Contributes Near-Term Growth
2,013
705 486
1,200
2011 2012 2013 2015
n 2011 additions include: w 670 MW Maritza, Bulgaria w 545 MW Angamos, Chile w 223 MW Changuinola, Panama w 181 MW renewable projects, as well as 394
MW Trinidad Unit 1 of which AES owns 10%
n 2012 additions include: w 394 MW Trinidad Unit 2 of which AES
owns 10% w 311 MW renewable projects
n 2013 additions include: w 270 MW Campiche, Chile w 216 MW Kribi, Cameroon
n 2015 addition represents 1,200 MW Mong Duong II, Vietnam
4,404 Gross MW On-Line by Year1
Long-term debt is committed & AES has funded its equity contributions

Contains Forward Looking Statements
26
Bogotá
Future Growth Examples: Strong Near-Term Growth Pipeline in Chile & Colombia (AES Gener)
Cochrane (532 MW Coal-Fired)
n Adjacent to Angamos facility; plant site owned by Angamos
n Includes 20 MW battery storage facility (BESS)
n Environmental permit and maritime concession granted
Alto Maipo (531 MW Run-of-River Hydro)
n 50 km East of Santiago n Environmental, water and civil
works permits obtained
Guacolda V (152 MW Coal-Fired)
n Environmental permit for plant granted
n Plant site owned by Guacolda
Antofagasta
Santiago
Tunjita (20 MW Hydro)
n Environmental permit obtained
n EPC agreement executed
n Financing closed, but not disbursed
n Working toward commencement of construction
Chile
Colombia

Contains Forward Looking Statements
27
India – OPGC 2 (1,320 MW Coal-Fired)
Future Growth Examples: Platform Expansion – India & the Philippines
n Adjacent to existing Masinloc facility (660 MW)
n Benefiting from existing infrastructure, including land, coal handling and ash disposal
n Environmental permit in place
n Currently working on EPC, power offtake contracts and financing
Philippines – Masinloc 2 (630 MW Coal-Fired)
n Adjacent to existing OPGC facility (420 MW)
n Limited Parent equity investment due to project cash reserves
n Permits for power plant already in place
n Coal mine with 530 million tons coal reserves allocated to the project
n Long-term contract for 50% of output already executed
n Currently working on EPC & financing

Contains Forward Looking Statements
28
Key Takeaways
n Diversified portfolio of power generation plants and electric utilities w U.S., Chile and Brazil represent 61% of proportional adjusted gross
margin1
w Limited commodity and currency exposure w 2012 adjusted earnings per share1 of $1.26
n Committed to delivering attractive risk-adjusted returns to shareholders w Initiating a dividend in Q3 2012, with first payment in Q4 2012 w Targeting 8%-10% annual total return (2013 through 2015)
n Unlocking the value by executing on a comprehensive plan
1. A non-GAAP financial measure as reconciled above. Midpoint of 2012 guidance. See “definitions” and 2012 Reconciliation on slide 34.
Contains Forward Looking Statements
29
Appendix
n Corporate Social Responsibility Slide 30
n Publicly Listed Subsidiaries Slide 31
n Capital Structure Slide 32
n Key Assumptions for 2012 Guidance Slide 33
n 2012 Guidance Estimated Sensitivities Slide 34
n Reconciliation of 2012 Guidance Slide 35
n Assumptions & Definitions Slides 36-38
Contains Forward Looking Statements
30
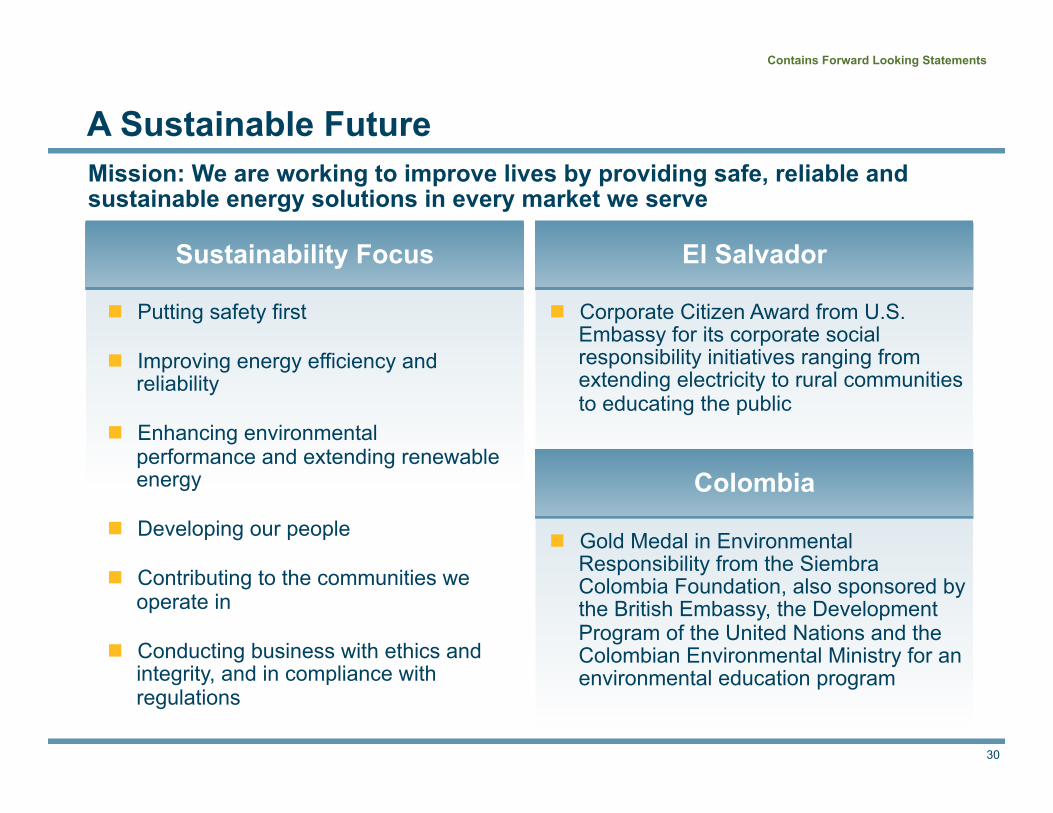
A Sustainable Future
Sustainability Focus El Salvador
Colombia
n Putting safety first
n Improving energy efficiency and reliability
n Enhancing environmental performance and extending renewable energy
n Developing our people
n Contributing to the communities we operate in
n Conducting business with ethics and integrity, and in compliance with regulations
n Corporate Citizen Award from U.S. Embassy for its corporate social responsibility initiatives ranging from extending electricity to rural communities to educating the public
n Gold Medal in Environmental Responsibility from the Siembra Colombia Foundation, also sponsored by the British Embassy, the Development Program of the United Nations and the Colombian Environmental Ministry for an environmental education program
Mission: We are working to improve lives by providing safe, reliable and sustainable energy solutions in every market we serve

Contains Forward Looking Statements
31
Credit Metrics Improve in 2012 Due to Full Year of DP&L Cash Flows1
1. 2012 ratios are based on current estimates. Actual ratios may be different than those presented here.
Improve Capital Structure: Strengthening Balance Sheet and Improving Credit Profile
Recourse Debt to Subsidiary Distributions Ratio
n Goal is to achieve strong BB metrics w Implying at least one notch upgrade w Targeting at least $500 million
recourse debt paydown
n In 2012 and beyond, balance sheet benefits from: w Cash flows from construction projects
coming on-line w Acquisition and integration of DPL w Organic growth and EBITDA
improvement within existing businesses
n Opportunities may exist for accelerated debt paydown depending on which assets are sold, price and other uses of capital
n Minimal ($21 million) scheduled recourse debt maturities in 2012 and 2013
4.4
3.8
4.9
4.4
2009 2010 2011 2012
Temporary Debt Reduction from
Equity Raise and Asset Sale
Proceeds
Pre-closing Financing for
DPL Acquisition
Full Year Benefit of Construction
Projects and DPL

Contains Forward Looking Statements
32
Stock Price Chart
Note: Graph reflects stock price performance from December 31, 2006 through December 31, 2011. Total Return reflects stock price changes and dividend payments.
Our Listed Subsidiaries’ Stock Prices Have Outperformed the Broader Markets, Primarily Driven by Stability & Performance of Underlying Assets
12/3
1/06
6/30
/07
12/3
1/07
6/30
/08
12/3
1/08
6/30
/09
12/3
1/09
6/30
/10
12/3
1/10
6/30
/11
12/3
1/11
5-Year Total Return in
USD
5-Year Broader Market Return
in USD
Gener, Chile 12.6% 9.7%
Eletropaulo, Brazil 26.9% 7.9%
Tiete, Brazil 24.7%

Contains Forward Looking Statements
33
Key Assumptions for 2012 Guidance
n Effective tax rate in line with 2011, which includes anticipated extension of TIPRA benefits
n 768 million shares; guidance does not assume any additional share repurchases
n Includes the impacts of closed asset sales as of February 2012, including Argentine utilities, Brazil Telecom, 80% of Cartagena plant in Spain and Bohemia plant in Czech Republic
n Does not include the impact of additional transactions recently announced (but not yet closed) including the Red Oak and Ironwood sales
n No use of proceeds from asset sales ($529 million closed and $234 million pending), except for debt repayment of approximately $197 million at Brasiliana subsidiary
n No use of parent free cash flow of approximately $600 million by the end of 2012
n Foreign currency and commodity assumptions from the forward curve as of December 30, 2011 w Brazilian Real assumption from the forward curve as of January 13, 2012

Contains Forward Looking Statements
§ 100 bps move in interest rates over a 12-month period is equal to change in EPS of approximately $0.02
§ 10% appreciation in USD against the following key currencies is equal to the following negative EPS impacts:
2012 Guidance Estimated Sensitivities
2012
Average Rate Sensitivity
Brazilian Real (BRL) 1.85 $0.030
Argentine Peso (ARS) 4.70 $0.010
Euro (EUR) 1.30 $0.015
Philippine Peso (PHP) 43.96 $0.010
2012 Average Rate Sensitivity
Newcastle Coal (Sensitivity $10/ton) negative correlation $112/ton $0.035
NYMEX Coal (Sensitivity $10/ton) negative correlation $71/ton
IPE Brent Crude Oil (Sensitivity $10/barrel) positive correlation $106/bbl $0.030 NYMEX WTI Crude Oil (Sensitivity $10/barrel) positive
correlation $99/bbl
Henry Hub Natural Gas (Sensitivity $1/mmbtu) positive correlation $3.2/mmbtu
$0.040 UK National Balancing Point Gas (Sensitivity $1/mmbtu) positive correlation £0.57/therm
Note: Sensitivities are provided on a standalone basis, assuming no change in the other factors, to illustrate the magnitude and direction of changing market factors on AES results. Estimates show the impact on 2012 adjusted EPS. Actual results may differ from the sensitivities provided due to execution of risk management strategies and operational factors. 2012 guidance is based on currency and commodity forward curves and forecasts as of December 30, 2011 except for Brazilian Real, where the forward curve as of January 13, 2012 has been used. There are inherent uncertainties in the forecasting process and actual results may differ from projections. The Company undertakes no obligation to update the guidance presented today. Please see Item 7A of the Form 10-K for a more complete discussion of this topic. AES has exposure to multiple coal, oil, and natural gas indices; forward curves are provided for representative liquid markets. Sensitivities are rounded to the nearest ½ cent per share. 1. The move is applied to the floating interest rate portfolio balances as of December 30, 2011. 2. These sensitivities do not include AES Eastern Energy.
Interest Rates1
Currencies
Commodity Sensitivity2
34

Contains Forward Looking Statements
35
$ in Millions, Except Earnings Per Share 2012 Guidance (Given 2/27/12)1
Consolidated Adjustment Factors2 Proportional2.3
Income Statement Elements Diluted Earnings Per Share from Continuing Operations $1.28-$1.36 Adjusted Earnings Per Share Factors3 ($0.06)4
Adjusted Earnings Per Share3 $1.22-$1.304
Cash Flow Elements Net Cash from Operating Activities $3,100-$3,300 $1,175 $1,925-$2,125 Operational Capital Expenditures (a) $1,050-$1,125 $300 $725-$850 Environmental Capital Expenditures (b) $100-$125 $25 $75-$100 Maintenance Capital Expenditures (a + b) $1,150-$1,250 $325 $800-$950 Free Cash Flow3 $1,900-$2,100 $850 $1,050-$1,250 Subsidiary Distributions5 $1,325-$1,525
Reconciliation of Parent Free Cash Flow Subsidiary Distributions5 (c) $1,325-$1,525 Cash Interest (d) $450-$500 Cash for Development, General & Administrative and Tax (e) $325-$375 Parent Free Cash Flow (c – d – e) $550-$650
Reconciliation of Free Cash Flow3
Net Cash from Operating Activities $3,100-$3,300 $1,175 $1,925-$2,125 Less: Maintenance Capital Expenditures $1,150-$1,250 $325 $800-$950
Free Cash Flow3 $1,900-$2,100 $850 $1,050-$1,250 Reconciliation of Adjusted Gross Margin3
Gross Margin6 $4,000-$4,200 $1,300 $2,700-$2,900 Plus: Depreciation & Amortization $1,400-$1,500 $300 $1,100-$1,200 Less: General & Administrative $300-$350 - $300-$350
Adjusted Gross Margin3 $5,125-$5,325 $1,600 $3,525-$3,725
1. 2012 guidance is based on expectations for future foreign exchange rates and commodity prices as of December 30, 2011, except for the Brazilian Real, which is updated through January 13, 2012. 2. The AES Corporation (the “Company”) is a holding company that derives its income and cash flows from the activities of its subsidiaries, some of which are not wholly-owned by the Company. Accordingly, the
Company has presented certain financial metrics which are defined as Proportional (a non-GAAP financial measure) to account for the Company’s ownership interest. In many cases, the Company has no legal claim on these cash flows. See “definitions.”
3. A non-GAAP financial measure as reconciled above. See “definitions.” 4. Reconciliation of Adjusted EPS includes unrealized foreign currency losses of $0.04, derivative losses of $0.01, debt retirement loses of $0.01, impairment losses of $0.03, and disposition gains of $0.15. 5. See “definitions.” 6. Utilities represent 28% of 2012 projected Gross Margin and Generation represents 72% Gross margin by country: U.S.: 16%, Brazil: 33%, Chile: 16%, Other Latin America: 15% and Rest of the World: 20%.
Reconciliation of 2012 Guidance, Including Proportional Metrics

Contains Forward Looking Statements
36
Assumptions
n Forecasted financial information is based on certain material assumptions. Such assumptions include, but are not limited to: (a) no unforeseen external events such as wars, depressions, or economic or political disruptions occur; (b) businesses continue to operate in a manner consistent with or better than prior operating performance, including achievement of planned productivity improvements including benefits of global sourcing, and in accordance with the provisions of their relevant contracts or concessions; (c) new business opportunities are available to AES in sufficient quantity to achieve its growth objectives; (d) no material disruptions or discontinuities occur in the Gross Domestic Product (GDP), foreign exchange rates, inflation or interest rates during the forecast period; and (e) material business-specific risks as described in the Company’s SEC filings do not occur individually or cumulatively. In addition, benefits from global sourcing include avoided costs, reduction in capital project costs versus budgetary estimates, and projected savings based on assumed spend volume which may or may not actually be achieved. Also, improvement in certain KPIs such as equivalent forced outage rate and commercial availability may not improve financial performance at all facilities based on commercial terms and conditions. These benefits will not be fully reflected in the Company’s consolidated financial results.
n The cash held at qualified holding companies (“QHCs”) represents cash sent to subsidiaries of the Company domiciled outside of the U.S. Such subsidiaries had no contractual restrictions on their ability to send cash to AES, the Parent Company, however, cash held at qualified holding companies does not reflect the impact of any tax liabilities that may result from any such cash being repatriated to the Parent Company in the U.S. Cash at those subsidiaries was used for investment and related activities outside of the U.S. These investments included equity investments and loans to other foreign subsidiaries as well as development and general costs and expenses incurred outside the U.S. Since the cash held by these QHCs is available to the Parent, AES uses the combined measure of subsidiary distributions to Parent and QHCs as a useful measure of cash available to the Parent to meet its international liquidity needs. AES believes that unconsolidated parent company liquidity is important to the liquidity position of AES as a parent company because of the non-recourse nature of most of AES’ indebtedness.

Contains Forward Looking Statements
37
Definitions
n Adjusted earnings per share (a non-GAAP financial measure) is defined as diluted earnings per share from continuing operations excluding gains or losses of the consolidated entity due to (a) mark-to-market amounts related to derivative transactions, (b) unrealized foreign currency gains or losses, (c) significant gains or losses due to dispositions and acquisitions of business interests, (d) significant losses due to impairments, and (e) costs due to the early retirement of debt. The GAAP measure most comparable to Adjusted EPS is diluted earnings per share from continuing operations. AES believes that adjusted earnings per share better reflects the underlying business performance of the Company, and is considered in the Company's internal evaluation of financial performance. Factors in this determination include the variability due to mark-to-market gains or losses related to derivative transactions, currency gains or losses, losses due to impairments and strategic decisions to dispose or acquire business interests or retire debt which affect results in a given period or periods. Adjusted earnings per share should not be construed as an alternative to earnings per share, which is determined in accordance with GAAP.
n Adjusted Gross Margin (a non-GAAP financial measure) is defined as gross margin plus depreciation and amortization less general and administrative expenses. AES believes adjusted gross margin is a useful measure for evaluating and comparing the operating performance of its businesses because it includes the direct operating costs of its business including overhead related expenses and excludes potential differences caused by variations in capital structures affecting interest income and expense, tax positions, such as the impact of changes in effective tax rates and the impact of depreciation and amortization expense.
n Free cash flow (a non-GAAP financial measure) is defined as net cash from operating activities less maintenance capital expenditures (including environmental capital expenditures), net of reinsurance proceeds from third parties. AES believes that free cash flow is a useful measure for evaluating our financial condition because it represents the amount of cash provided by operations less maintenance capital expenditures as defined by our businesses, that may be available for investing or for repaying debt. Free cash flow should not be construed as an alternative to net cash from operating activities, which is determined in accordance with GAAP.
n Parent Company Liquidity (a non-GAAP financial measure) is defined as cash at the Parent Company plus availability under corporate credit facilities plus cash at qualified holding companies (“QHCs”). AES believes that unconsolidated Parent Company liquidity is important to the liquidity position of AES as a Parent Company because of the non-recourse nature of most of AES’ indebtedness.
n Subsidiary Liquidity (a non-GAAP financial measure) is defined as cash and cash equivalents and bank lines of credit at various subsidiaries. n The AES Corporation (the “Company”) is a holding company that derives its income and cash flows from the activities of its subsidiaries, some of which are
not wholly-owned by the Company. Accordingly, the Company has presented certain financial metrics which are defined as Proportional (a non-GAAP financial measure) to account for the Company’s ownership interest.
Proportional metrics present the Company’s estimate of its share in the economics of the underlying metric. The Company believes that the Proportional metrics are useful to investors because they exclude the economic share in the metric presented that is held by non-AES shareholders. For example, Operating Cash Flow is a GAAP metric which presents the Company’s cash flow from operations on a consolidated basis, including operating cash flow allocable to noncontrolling interests. Proportional Operating Cash Flow removes the share of operating cash flow allocable to noncontrolling interests and therefore may act as an aid in the valuation the Company.
Proportional metrics are reconciled to the nearest GAAP measure. Certain assumptions have been made to estimate our proportional financial measures. These assumptions include: (i) the Company’s economic interest has been calculated based on a blended rate for each consolidated business when such business represents multiple legal entities; (ii) the Company’s economic interest may differ from the percentage implied by the recorded net income or loss attributable to noncontrolling interests or dividends paid during a given period; (iii) the Company’s economic interest for entities accounted for using the hypothetical liquidation at book value method is 100%; (iv) individual operating performance of the Company’s equity method investments is not reflected and (v) inter-segment transactions are included as applicable for the metric presented.
Non-GAAP Financial Measures

Contains Forward Looking Statements
38
Definitions, Cont’d.
n Subsidiary Distributions should not be construed as an alternative to Net Cash Provided by Operating Activities which is determined in accordance with GAAP. Subsidiary Distributions are important to the Parent Company because the Parent Company is a holding company that does not derive any significant direct revenues from its own activities but instead relies on its subsidiaries’ business activities and the resultant distributions to fund the debt service, investment and other cash needs of the holding company. The reconciliation of the difference between the Subsidiary Distributions and Net Cash Provided by Operating Activities consists of cash generated from operating activities that is retained at the subsidiaries for a variety of reasons which are both discretionary and non-discretionary in nature. These factors include, but are not limited to, retention of cash to fund capital expenditures at the subsidiary, cash retention associated with non-recourse debt covenant restrictions and related debt service requirements at the subsidiaries, retention of cash related to sufficiency of local GAAP statutory retained earnings at the subsidiaries, retention of cash for working capital needs at the subsidiaries, and other similar timing differences between when the cash is generated at the subsidiaries and when it reaches the Parent Company and related holding companies.
n Parent Free Cash Flow should not be construed as an alternative to Net Cash Provided by Operating Activities which is determined in accordance with GAAP. Parent Free Cash Flow is equal to Subsidiary Distributions less cash used for interest costs, development, general and administrative activities, and tax payments by the Parent Company. Parent Free Cash Flow is used for dividends, share repurchases, growth investments, recourse debt repayments, and other uses by the Parent Company.