The Advisors’ Inner Circle Fund III NorthPointe Small … · Statements of Operations ... Crocs*...
48
The Advisors’ Inner Circle Fund III NorthPointe Small Cap Value Fund NorthPointe Large Cap Value Fund Annual Report October 31, 2016 Investment Adviser: NorthPointe Capital, LLC
Transcript of The Advisors’ Inner Circle Fund III NorthPointe Small … · Statements of Operations ... Crocs*...
The Advisors’ Inner Circle Fund III
NorthPointe Small Cap Value FundNorthPointe Large Cap Value Fund
Annual Report October 31, 2016
Investment Adviser:
NorthPointe Capital, LLC
THE ADVISORS’ INNER CIRCLE FUND III NORTHPOINTE FUNDSOCTOBER 31, 2016
TABLE OF CONTENTS
Shareholders’ Letter . . . . . . . . . . . . . . . . . . . . . . . . . . . . . . . . . . . . . . . . . . 1
Schedules of Investments
NorthPointe Small Cap Value Fund . . . . . . . . . . . . . . . . . . . . . . . . . . . 5
NorthPointe Large Cap Value Fund . . . . . . . . . . . . . . . . . . . . . . . . . . . 9
Statements of Assets and Liabilities . . . . . . . . . . . . . . . . . . . . . . . . . . . . . 14
Statements of Operations . . . . . . . . . . . . . . . . . . . . . . . . . . . . . . . . . . . . . . 15
Statements of Changes in Net Assets . . . . . . . . . . . . . . . . . . . . . . . . . . . . . 16
Financial Highlights . . . . . . . . . . . . . . . . . . . . . . . . . . . . . . . . . . . . . . . . . . 18
Notes to Financial Statements . . . . . . . . . . . . . . . . . . . . . . . . . . . . . . . . . . 22
Report of Independent Registered Public Accounting Firm . . . . . . . . . . . 33
Disclosure of Fund Expenses . . . . . . . . . . . . . . . . . . . . . . . . . . . . . . . . . . . 34
Trustees and Officers of The Advisors’ Inner Circle Fund III . . . . . . . . . . 36
Notice to Shareholders . . . . . . . . . . . . . . . . . . . . . . . . . . . . . . . . . . . . . . . . 42
The Funds will file their complete schedule of investments of fund holdings with theSecurities and Exchange Commission (“Commission”) for the first and third quarters ofeach fiscal year on Form N-Q within sixty days after period end. The Funds’ Forms N-Qwill be available on the Commission’s website at http://www.sec.gov, and may bereviewed and copied at the Commission’s Public Reference Room in Washington, D.C.Information on the operation of the Public Reference Room may be obtained by calling1-800-SEC-0330.
A description of the policies and procedures that the Funds use to determine how to voteproxies relating to portfolio securities, as well as information relating to how a Fundvoted proxies relating to portfolio securities during the most recent 12-month periodended June 30, is available (i) without charge, upon request, by calling 1-877-457-NPF3 (6733); and (ii) on the Commission’s website at http://www.sec.gov.
THE ADVISORS’ INNER CIRCLE FUND III NORTHPOINTE FUNDSOCTOBER 31, 2016(Unaudited)
Dear Fellow Shareholders-
Thank you for your interest in the NorthPointe Mutual Funds. The NorthPointe LargeCap Value and the NorthPointe Small Cap Value mutual funds were launched onMarch 25th of 2014, bringing NorthPointe Capital’s long established institutionalinvestment processes to the mutual fund market place. Our mission is to provideassistance to individuals in their quest to reach their respective investment goals andobjectives.
Performance
For the period November 1, 2015 to October 31, 2016 the NorthPointe Small Cap ValueFund, Investor Shares, returned 2.64% versus the 8.81% return of the benchmark, theRussell 2000® Value Index. For the same period, the NorthPointe Large Cap ValueFund, Investor Shares, returned 1.62% versus the 6.37% return of the Russell 1000®
Value Index, the fund’s benchmark.
Small Cap Value Commentary
While headlines that tout geopolitical unrest and uncertainty over domestic monetarypolicy make for interesting reading, we continue to spend a majority of our researchefforts on tracking the progress of individual companies. The portfolio’s investments inthe Health Care sector remained the largest overweight exposure relative to the Russell2000 Value Index. The portfolio also maintained notable overweight positions to theMaterials and Industrials sectors. Exposure to Real Estate and Utilities were the fund’slargest underweighted sector positions. The fund failed to keep pace with the specifiedbenchmark over the previous twelve months, with stock selection being the primedeterminant of the fund’s relative performance. The most challenged areas were theInformation Technology, Energy, and Financials Sectors. Selectivity was a positivecontributor within the Consumer Staples, Real Estate, and Industrials Sectors.
Large Cap Value Commentary
The Large Cap Value Fund’s returns were hampered by weak stock selection within theFinancials and Information Technology Sectors. The bulk of the underperformance inthe Financial Sector occurred within the Consumer Finance Industry. Earlier in 2016fears of the United States falling back into an economic recession lead to a dramatic selloff in two fund Consumer Finance holdings. Both positions were eliminated from thefund because our forecasts suggested further pressure on their share prices. Highlightsfor the period occurred in the Health Care and Utilities Sectors. Stock selection positivelycontributed in these two classically defensive sectors.
1
THE ADVISORS’ INNER CIRCLE FUND III NORTHPOINTE FUNDSOCTOBER 31, 2016(Unaudited)
Outlook
As we review our investments, we are quite comfortable with the fundamentaladvancement of our names in general. We continue to believe strong fundamentalperformance combined with attractive valuations should deliver attractive investmentreturns over a longer time frame. Our portfolio management teams have positioned bothfunds to help navigate the ever changing market environment. This positioning has beenachieved by focusing our research efforts on individual companies and utilizing our riskmanagement techniques to deliver a portfolio of securities whose success or failure willbe defined by the team’s stock selection.
Respectfully submitted,
The NorthPointe Capital Portfolio Management Team
The material represents the manager’s assessment of the portfolio and marketenvironment at a specific point in time and should not be relied upon by the reader asresearch or investment advice regarding any stock. Portfolio holdings are subject tochange and should not be considered investment advice or a recommendation to buysecurities. Past performance is not a guarantee of future results.
There are risks involved with investing in mutual funds, including loss of principal. Inaddition to the normal risks involved with investing in mutual funds, investments insmaller companies typically exhibit higher volatility. Current and future holdings aresubject to risk.
Definition of Comparative Indices
Russell 1000 Value Index measures the performance of those Russell 1000 companieswith lower price-to-book ratios and lower forecasted growth values.
Russell 2000 Value Index measures the performance of those Russell 2000 Indexcompanies with lower price-to-book ratios and lower forecasted growth values.
2
THE ADVISORS’ INNER CIRCLE FUND III NORTHPOINTESMALL CAP VALUE FUNDOCTOBER 31, 2016 (Unaudited)
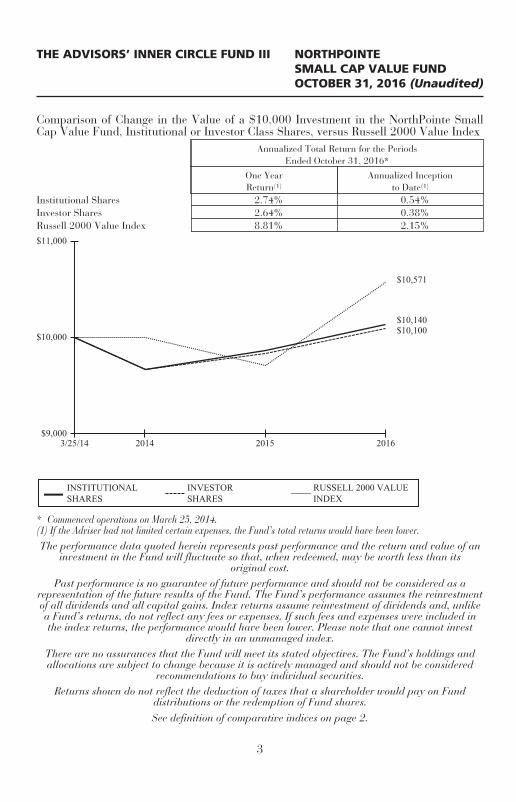
Comparison of Change in the Value of a $10,000 Investment in the NorthPointe SmallCap Value Fund, Institutional or Investor Class Shares, versus Russell 2000 Value Index
Annualized Total Return for the PeriodsEnded October 31, 2016*
One YearReturn(1)
Annualized Inceptionto Date(1)
Institutional Shares 2.74% 0.54%Investor Shares 2.64% 0.38%Russell 2000 Value Index 8.81% 2.15%
$9,000
$10,571
2016201520143/25/14
$10,140$10,100
$10,000
$11,000
INSTITUTIONALSHARES
INVESTORSHARES
RUSSELL 2000 VALUEINDEX
* Commenced operations on March 25, 2014.(1) If the Adviser had not limited certain expenses, the Fund’s total returns would have been lower.The performance data quoted herein represents past performance and the return and value of an
investment in the Fund will fluctuate so that, when redeemed, may be worth less than itsoriginal cost.
Past performance is no guarantee of future performance and should not be considered as arepresentation of the future results of the Fund. The Fund’s performance assumes the reinvestmentof all dividends and all capital gains. Index returns assume reinvestment of dividends and, unlikea Fund’s returns, do not reflect any fees or expenses. If such fees and expenses were included inthe index returns, the performance would have been lower. Please note that one cannot invest
directly in an unmanaged index.There are no assurances that the Fund will meet its stated objectives. The Fund’s holdings andallocations are subject to change because it is actively managed and should not be considered
recommendations to buy individual securities.Returns shown do not reflect the deduction of taxes that a shareholder would pay on Fund
distributions or the redemption of Fund shares.See definition of comparative indices on page 2.
3
THE ADVISORS’ INNER CIRCLE FUND III NORTHPOINTELARGE CAP VALUE FUNDOCTOBER 31, 2016 (Unaudited)
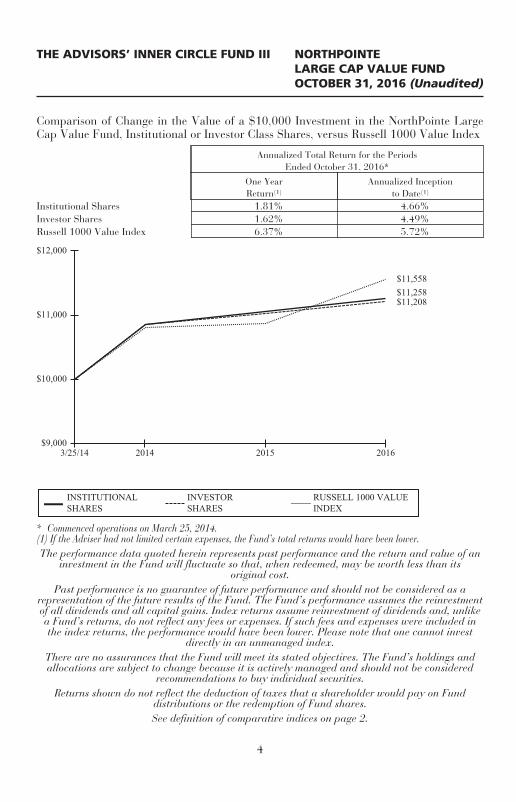
Comparison of Change in the Value of a $10,000 Investment in the NorthPointe LargeCap Value Fund, Institutional or Investor Class Shares, versus Russell 1000 Value Index
Annualized Total Return for the PeriodsEnded October 31, 2016*
One YearReturn(1)
Annualized Inceptionto Date(1)
Institutional Shares 1.81% 4.66%Investor Shares 1.62% 4.49%Russell 1000 Value Index 6.37% 5.72%
$9,000
$11,558
2016201520143/25/14
$11,258$11,208
$10,000
$12,000
$11,000
INSTITUTIONALSHARES
INVESTORSHARES
RUSSELL 1000 VALUEINDEX
* Commenced operations on March 25, 2014.(1) If the Adviser had not limited certain expenses, the Fund’s total returns would have been lower.The performance data quoted herein represents past performance and the return and value of an
investment in the Fund will fluctuate so that, when redeemed, may be worth less than itsoriginal cost.
Past performance is no guarantee of future performance and should not be considered as arepresentation of the future results of the Fund. The Fund’s performance assumes the reinvestmentof all dividends and all capital gains. Index returns assume reinvestment of dividends and, unlikea Fund’s returns, do not reflect any fees or expenses. If such fees and expenses were included inthe index returns, the performance would have been lower. Please note that one cannot invest
directly in an unmanaged index.There are no assurances that the Fund will meet its stated objectives. The Fund’s holdings andallocations are subject to change because it is actively managed and should not be considered
recommendations to buy individual securities.Returns shown do not reflect the deduction of taxes that a shareholder would pay on Fund
distributions or the redemption of Fund shares.See definition of comparative indices on page 2.
4
THE ADVISORS’ INNER CIRCLE FUND III NORTHPOINTESMALL CAP VALUE FUNDOCTOBER 31, 2016
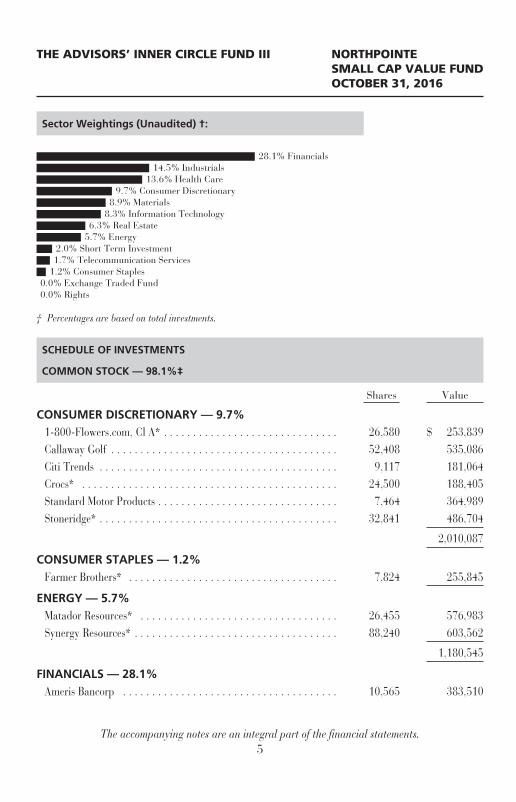
Sector Weightings (Unaudited) †:
1.2% Consumer Staples
0.0% Rights
1.7% Telecommunication Services
0.0% Exchange Traded Fund
2.0% Short Term Investment5.7% Energy6.3% Real Estate
8.3% Information Technology8.9% Materials
9.7% Consumer Discretionary13.6% Health Care
14.5% Industrials28.1% Financials
† Percentages are based on total investments.
SCHEDULE OF INVESTMENTS
COMMON STOCK — 98.1%‡
Shares Value
CONSUMER DISCRETIONARY — 9.7%1-800-Flowers.com, Cl A* . . . . . . . . . . . . . . . . . . . . . . . . . . . . . . 26,580 $ 253,839Callaway Golf . . . . . . . . . . . . . . . . . . . . . . . . . . . . . . . . . . . . . . . 52,408 535,086Citi Trends . . . . . . . . . . . . . . . . . . . . . . . . . . . . . . . . . . . . . . . . . 9,117 181,064Crocs* . . . . . . . . . . . . . . . . . . . . . . . . . . . . . . . . . . . . . . . . . . . . 24,500 188,405Standard Motor Products . . . . . . . . . . . . . . . . . . . . . . . . . . . . . . . 7,464 364,989Stoneridge* . . . . . . . . . . . . . . . . . . . . . . . . . . . . . . . . . . . . . . . . . 32,841 486,704
2,010,087
CONSUMER STAPLES — 1.2%Farmer Brothers* . . . . . . . . . . . . . . . . . . . . . . . . . . . . . . . . . . . . 7,824 255,845
ENERGY — 5.7%Matador Resources* . . . . . . . . . . . . . . . . . . . . . . . . . . . . . . . . . . 26,455 576,983Synergy Resources* . . . . . . . . . . . . . . . . . . . . . . . . . . . . . . . . . . . 88,240 603,562
1,180,545
FINANCIALS — 28.1%Ameris Bancorp . . . . . . . . . . . . . . . . . . . . . . . . . . . . . . . . . . . . . 10,565 383,510
The accompanying notes are an integral part of the financial statements.5
THE ADVISORS’ INNER CIRCLE FUND III NORTHPOINTESMALL CAP VALUE FUNDOCTOBER 31, 2016
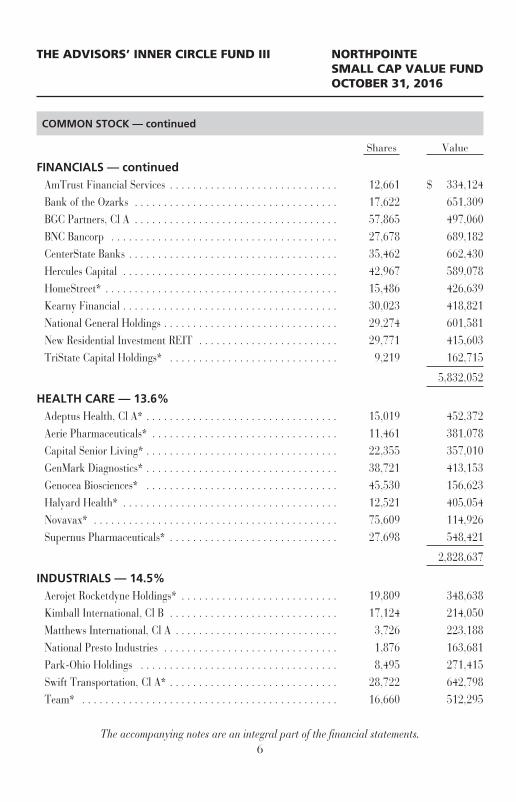
COMMON STOCK — continued
Shares Value
FINANCIALS — continuedAmTrust Financial Services . . . . . . . . . . . . . . . . . . . . . . . . . . . . . 12,661 $ 334,124Bank of the Ozarks . . . . . . . . . . . . . . . . . . . . . . . . . . . . . . . . . . . 17,622 651,309BGC Partners, Cl A . . . . . . . . . . . . . . . . . . . . . . . . . . . . . . . . . . . 57,865 497,060BNC Bancorp . . . . . . . . . . . . . . . . . . . . . . . . . . . . . . . . . . . . . . . 27,678 689,182CenterState Banks . . . . . . . . . . . . . . . . . . . . . . . . . . . . . . . . . . . . 35,462 662,430Hercules Capital . . . . . . . . . . . . . . . . . . . . . . . . . . . . . . . . . . . . . 42,967 589,078HomeStreet* . . . . . . . . . . . . . . . . . . . . . . . . . . . . . . . . . . . . . . . . 15,486 426,639Kearny Financial . . . . . . . . . . . . . . . . . . . . . . . . . . . . . . . . . . . . . 30,023 418,821National General Holdings . . . . . . . . . . . . . . . . . . . . . . . . . . . . . . 29,274 601,581New Residential Investment REIT . . . . . . . . . . . . . . . . . . . . . . . . 29,771 415,603TriState Capital Holdings* . . . . . . . . . . . . . . . . . . . . . . . . . . . . . 9,219 162,715
5,832,052
HEALTH CARE — 13.6%Adeptus Health, Cl A* . . . . . . . . . . . . . . . . . . . . . . . . . . . . . . . . . 15,019 452,372Aerie Pharmaceuticals* . . . . . . . . . . . . . . . . . . . . . . . . . . . . . . . . 11,461 381,078Capital Senior Living* . . . . . . . . . . . . . . . . . . . . . . . . . . . . . . . . . 22,355 357,010GenMark Diagnostics* . . . . . . . . . . . . . . . . . . . . . . . . . . . . . . . . . 38,721 413,153Genocea Biosciences* . . . . . . . . . . . . . . . . . . . . . . . . . . . . . . . . . 45,530 156,623Halyard Health* . . . . . . . . . . . . . . . . . . . . . . . . . . . . . . . . . . . . . 12,521 405,054Novavax* . . . . . . . . . . . . . . . . . . . . . . . . . . . . . . . . . . . . . . . . . . 75,609 114,926Supernus Pharmaceuticals* . . . . . . . . . . . . . . . . . . . . . . . . . . . . . 27,698 548,421
2,828,637
INDUSTRIALS — 14.5%Aerojet Rocketdyne Holdings* . . . . . . . . . . . . . . . . . . . . . . . . . . . 19,809 348,638Kimball International, Cl B . . . . . . . . . . . . . . . . . . . . . . . . . . . . . 17,124 214,050Matthews International, Cl A . . . . . . . . . . . . . . . . . . . . . . . . . . . . 3,726 223,188National Presto Industries . . . . . . . . . . . . . . . . . . . . . . . . . . . . . . 1,876 163,681Park-Ohio Holdings . . . . . . . . . . . . . . . . . . . . . . . . . . . . . . . . . . 8,495 271,415Swift Transportation, Cl A* . . . . . . . . . . . . . . . . . . . . . . . . . . . . . 28,722 642,798Team* . . . . . . . . . . . . . . . . . . . . . . . . . . . . . . . . . . . . . . . . . . . . 16,660 512,295
The accompanying notes are an integral part of the financial statements.6
THE ADVISORS’ INNER CIRCLE FUND III NORTHPOINTESMALL CAP VALUE FUNDOCTOBER 31, 2016
COMMON STOCK — continued
Shares/Number of
Rights Value
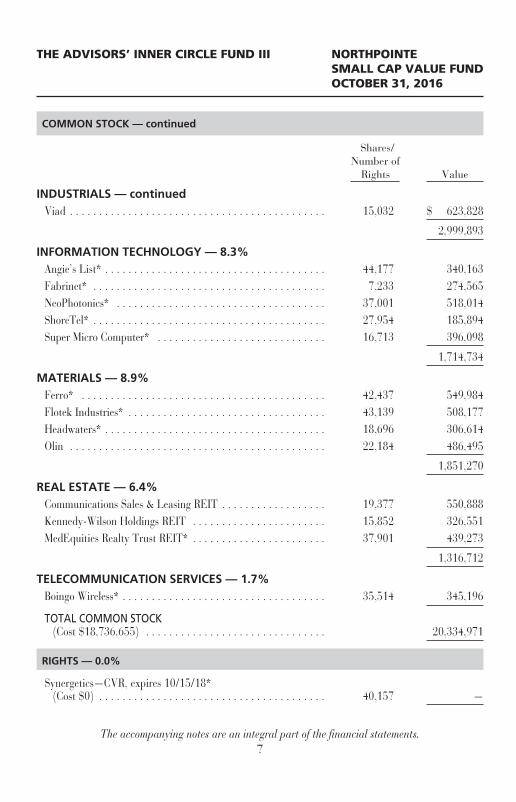
INDUSTRIALS — continuedViad . . . . . . . . . . . . . . . . . . . . . . . . . . . . . . . . . . . . . . . . . . . . 15,032 $ 623,828
2,999,893
INFORMATION TECHNOLOGY — 8.3%Angie’s List* . . . . . . . . . . . . . . . . . . . . . . . . . . . . . . . . . . . . . . 44,177 340,163Fabrinet* . . . . . . . . . . . . . . . . . . . . . . . . . . . . . . . . . . . . . . . . 7,233 274,565NeoPhotonics* . . . . . . . . . . . . . . . . . . . . . . . . . . . . . . . . . . . . 37,001 518,014ShoreTel* . . . . . . . . . . . . . . . . . . . . . . . . . . . . . . . . . . . . . . . . 27,954 185,894Super Micro Computer* . . . . . . . . . . . . . . . . . . . . . . . . . . . . . 16,713 396,098
1,714,734
MATERIALS — 8.9%Ferro* . . . . . . . . . . . . . . . . . . . . . . . . . . . . . . . . . . . . . . . . . . 42,437 549,984Flotek Industries* . . . . . . . . . . . . . . . . . . . . . . . . . . . . . . . . . . 43,139 508,177Headwaters* . . . . . . . . . . . . . . . . . . . . . . . . . . . . . . . . . . . . . . 18,696 306,614Olin . . . . . . . . . . . . . . . . . . . . . . . . . . . . . . . . . . . . . . . . . . . . 22,184 486,495
1,851,270
REAL ESTATE — 6.4%Communications Sales & Leasing REIT . . . . . . . . . . . . . . . . . . 19,377 550,888Kennedy-Wilson Holdings REIT . . . . . . . . . . . . . . . . . . . . . . . 15,852 326,551MedEquities Realty Trust REIT* . . . . . . . . . . . . . . . . . . . . . . . 37,901 439,273
1,316,712
TELECOMMUNICATION SERVICES — 1.7%Boingo Wireless* . . . . . . . . . . . . . . . . . . . . . . . . . . . . . . . . . . . 35,514 345,196
TOTAL COMMON STOCK(Cost $18,736,655) . . . . . . . . . . . . . . . . . . . . . . . . . . . . . . . 20,334,971
RIGHTS — 0.0%
Synergetics—CVR, expires 10/15/18*(Cost $0) . . . . . . . . . . . . . . . . . . . . . . . . . . . . . . . . . . . . . . . 40,157 —
The accompanying notes are an integral part of the financial statements.7
THE ADVISORS’ INNER CIRCLE FUND III NORTHPOINTESMALL CAP VALUE FUNDOCTOBER 31, 2016
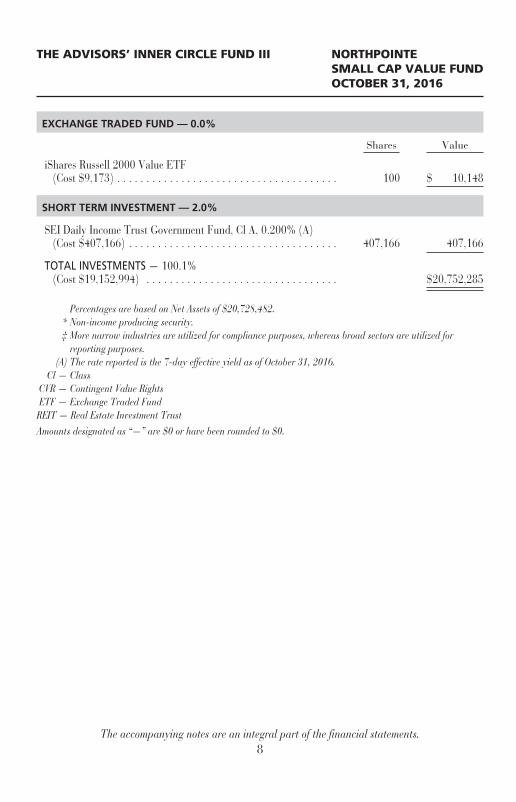
EXCHANGE TRADED FUND — 0.0%
Shares Value
iShares Russell 2000 Value ETF(Cost $9,173) . . . . . . . . . . . . . . . . . . . . . . . . . . . . . . . . . . . . . . 100 $ 10,148
SHORT TERM INVESTMENT — 2.0%
SEI Daily Income Trust Government Fund, Cl A, 0.200% (A)(Cost $407,166) . . . . . . . . . . . . . . . . . . . . . . . . . . . . . . . . . . . . 407,166 407,166
TOTAL INVESTMENTS — 100.1%(Cost $19,152,994) . . . . . . . . . . . . . . . . . . . . . . . . . . . . . . . . . $20,752,285
Percentages are based on Net Assets of $20,728,482.* Non-income producing security.‡ More narrow industries are utilized for compliance purposes, whereas broad sectors are utilized for
reporting purposes.(A) The rate reported is the 7-day effective yield as of October 31, 2016.
Cl — ClassCVR — Contingent Value RightsETF — Exchange Traded Fund
REIT — Real Estate Investment TrustAmounts designated as “—” are $0 or have been rounded to $0.
The accompanying notes are an integral part of the financial statements.8
THE ADVISORS’ INNER CIRCLE FUND III NORTHPOINTELARGE CAP VALUE FUNDOCTOBER 31, 2016
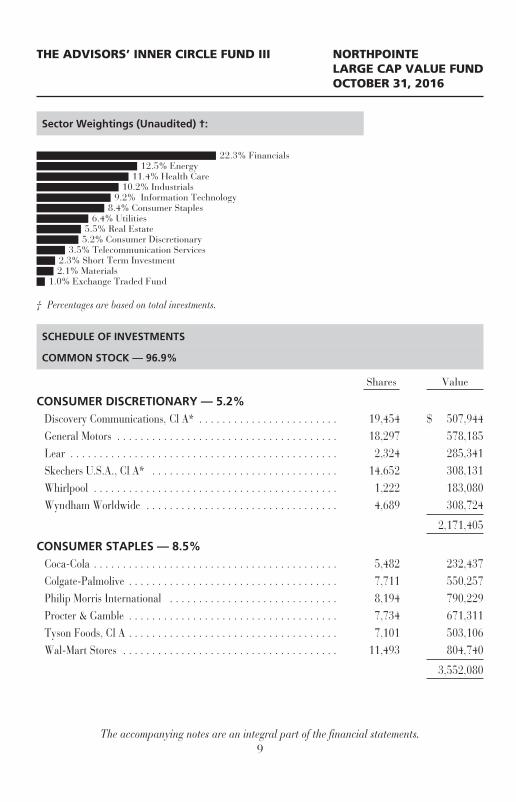
Sector Weightings (Unaudited) †:
1.0% Exchange Traded Fund2.1% Materials2.3% Short Term Investment
3.5% Telecommunication Services5.2% Consumer Discretionary5.5% Real Estate
6.4% Utilities8.4% Consumer Staples
9.2% Information Technology10.2% Industrials
11.4% Health Care12.5% Energy
22.3% Financials
† Percentages are based on total investments.
SCHEDULE OF INVESTMENTS
COMMON STOCK — 96.9%
Shares Value
CONSUMER DISCRETIONARY — 5.2%Discovery Communications, Cl A* . . . . . . . . . . . . . . . . . . . . . . . . 19,454 $ 507,944General Motors . . . . . . . . . . . . . . . . . . . . . . . . . . . . . . . . . . . . . . 18,297 578,185Lear . . . . . . . . . . . . . . . . . . . . . . . . . . . . . . . . . . . . . . . . . . . . . . 2,324 285,341Skechers U.S.A., Cl A* . . . . . . . . . . . . . . . . . . . . . . . . . . . . . . . . 14,652 308,131Whirlpool . . . . . . . . . . . . . . . . . . . . . . . . . . . . . . . . . . . . . . . . . . 1,222 183,080Wyndham Worldwide . . . . . . . . . . . . . . . . . . . . . . . . . . . . . . . . . 4,689 308,724
2,171,405
CONSUMER STAPLES — 8.5%Coca-Cola . . . . . . . . . . . . . . . . . . . . . . . . . . . . . . . . . . . . . . . . . . 5,482 232,437Colgate-Palmolive . . . . . . . . . . . . . . . . . . . . . . . . . . . . . . . . . . . . 7,711 550,257Philip Morris International . . . . . . . . . . . . . . . . . . . . . . . . . . . . . 8,194 790,229Procter & Gamble . . . . . . . . . . . . . . . . . . . . . . . . . . . . . . . . . . . . 7,734 671,311Tyson Foods, Cl A . . . . . . . . . . . . . . . . . . . . . . . . . . . . . . . . . . . . 7,101 503,106Wal-Mart Stores . . . . . . . . . . . . . . . . . . . . . . . . . . . . . . . . . . . . . 11,493 804,740
3,552,080
The accompanying notes are an integral part of the financial statements.9
THE ADVISORS’ INNER CIRCLE FUND III NORTHPOINTELARGE CAP VALUE FUNDOCTOBER 31, 2016
COMMON STOCK — continued
Shares Value
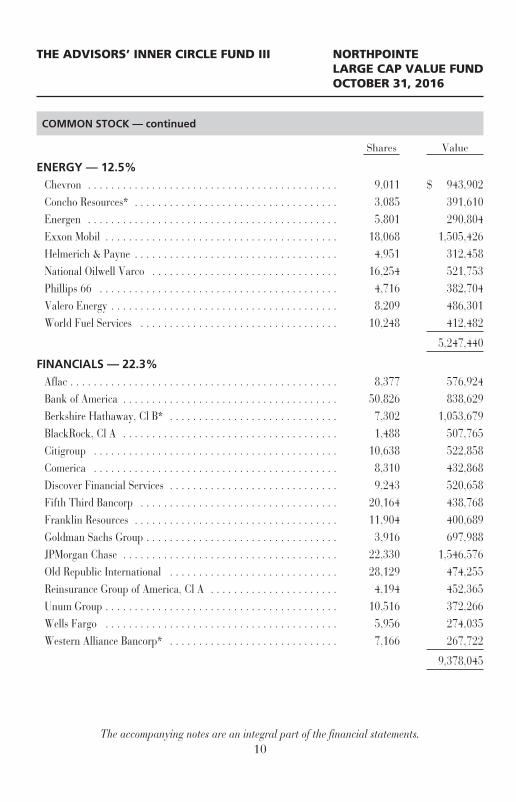
ENERGY — 12.5%Chevron . . . . . . . . . . . . . . . . . . . . . . . . . . . . . . . . . . . . . . . . . . . 9,011 $ 943,902Concho Resources* . . . . . . . . . . . . . . . . . . . . . . . . . . . . . . . . . . . 3,085 391,610Energen . . . . . . . . . . . . . . . . . . . . . . . . . . . . . . . . . . . . . . . . . . . 5,801 290,804Exxon Mobil . . . . . . . . . . . . . . . . . . . . . . . . . . . . . . . . . . . . . . . . 18,068 1,505,426Helmerich & Payne . . . . . . . . . . . . . . . . . . . . . . . . . . . . . . . . . . . 4,951 312,458National Oilwell Varco . . . . . . . . . . . . . . . . . . . . . . . . . . . . . . . . 16,254 521,753Phillips 66 . . . . . . . . . . . . . . . . . . . . . . . . . . . . . . . . . . . . . . . . . 4,716 382,704Valero Energy . . . . . . . . . . . . . . . . . . . . . . . . . . . . . . . . . . . . . . . 8,209 486,301World Fuel Services . . . . . . . . . . . . . . . . . . . . . . . . . . . . . . . . . . 10,248 412,482
5,247,440
FINANCIALS — 22.3%Aflac . . . . . . . . . . . . . . . . . . . . . . . . . . . . . . . . . . . . . . . . . . . . . . 8,377 576,924Bank of America . . . . . . . . . . . . . . . . . . . . . . . . . . . . . . . . . . . . . 50,826 838,629Berkshire Hathaway, Cl B* . . . . . . . . . . . . . . . . . . . . . . . . . . . . . 7,302 1,053,679BlackRock, Cl A . . . . . . . . . . . . . . . . . . . . . . . . . . . . . . . . . . . . . 1,488 507,765Citigroup . . . . . . . . . . . . . . . . . . . . . . . . . . . . . . . . . . . . . . . . . . 10,638 522,858Comerica . . . . . . . . . . . . . . . . . . . . . . . . . . . . . . . . . . . . . . . . . . 8,310 432,868Discover Financial Services . . . . . . . . . . . . . . . . . . . . . . . . . . . . . 9,243 520,658Fifth Third Bancorp . . . . . . . . . . . . . . . . . . . . . . . . . . . . . . . . . . 20,164 438,768Franklin Resources . . . . . . . . . . . . . . . . . . . . . . . . . . . . . . . . . . . 11,904 400,689Goldman Sachs Group . . . . . . . . . . . . . . . . . . . . . . . . . . . . . . . . . 3,916 697,988JPMorgan Chase . . . . . . . . . . . . . . . . . . . . . . . . . . . . . . . . . . . . . 22,330 1,546,576Old Republic International . . . . . . . . . . . . . . . . . . . . . . . . . . . . . 28,129 474,255Reinsurance Group of America, Cl A . . . . . . . . . . . . . . . . . . . . . . 4,194 452,365Unum Group . . . . . . . . . . . . . . . . . . . . . . . . . . . . . . . . . . . . . . . . 10,516 372,266Wells Fargo . . . . . . . . . . . . . . . . . . . . . . . . . . . . . . . . . . . . . . . . 5,956 274,035Western Alliance Bancorp* . . . . . . . . . . . . . . . . . . . . . . . . . . . . . 7,166 267,722
9,378,045
The accompanying notes are an integral part of the financial statements.10
THE ADVISORS’ INNER CIRCLE FUND III NORTHPOINTELARGE CAP VALUE FUNDOCTOBER 31, 2016
COMMON STOCK — continued
Shares Value
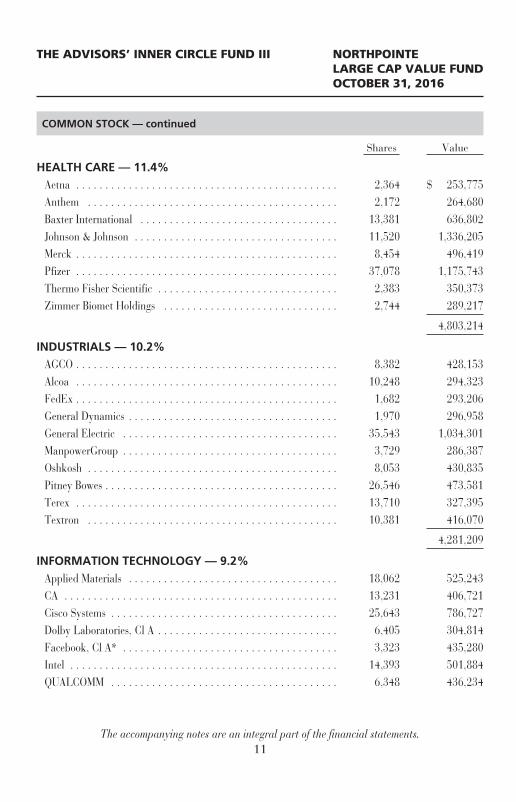
HEALTH CARE — 11.4%Aetna . . . . . . . . . . . . . . . . . . . . . . . . . . . . . . . . . . . . . . . . . . . . . 2,364 $ 253,775Anthem . . . . . . . . . . . . . . . . . . . . . . . . . . . . . . . . . . . . . . . . . . . 2,172 264,680Baxter International . . . . . . . . . . . . . . . . . . . . . . . . . . . . . . . . . . 13,381 636,802Johnson & Johnson . . . . . . . . . . . . . . . . . . . . . . . . . . . . . . . . . . . 11,520 1,336,205Merck . . . . . . . . . . . . . . . . . . . . . . . . . . . . . . . . . . . . . . . . . . . . . 8,454 496,419Pfizer . . . . . . . . . . . . . . . . . . . . . . . . . . . . . . . . . . . . . . . . . . . . . 37,078 1,175,743Thermo Fisher Scientific . . . . . . . . . . . . . . . . . . . . . . . . . . . . . . . 2,383 350,373Zimmer Biomet Holdings . . . . . . . . . . . . . . . . . . . . . . . . . . . . . . 2,744 289,217
4,803,214
INDUSTRIALS — 10.2%AGCO . . . . . . . . . . . . . . . . . . . . . . . . . . . . . . . . . . . . . . . . . . . . . 8,382 428,153Alcoa . . . . . . . . . . . . . . . . . . . . . . . . . . . . . . . . . . . . . . . . . . . . . 10,248 294,323FedEx . . . . . . . . . . . . . . . . . . . . . . . . . . . . . . . . . . . . . . . . . . . . . 1,682 293,206General Dynamics . . . . . . . . . . . . . . . . . . . . . . . . . . . . . . . . . . . . 1,970 296,958General Electric . . . . . . . . . . . . . . . . . . . . . . . . . . . . . . . . . . . . . 35,543 1,034,301ManpowerGroup . . . . . . . . . . . . . . . . . . . . . . . . . . . . . . . . . . . . . 3,729 286,387Oshkosh . . . . . . . . . . . . . . . . . . . . . . . . . . . . . . . . . . . . . . . . . . . 8,053 430,835Pitney Bowes . . . . . . . . . . . . . . . . . . . . . . . . . . . . . . . . . . . . . . . . 26,546 473,581Terex . . . . . . . . . . . . . . . . . . . . . . . . . . . . . . . . . . . . . . . . . . . . . 13,710 327,395Textron . . . . . . . . . . . . . . . . . . . . . . . . . . . . . . . . . . . . . . . . . . . 10,381 416,070
4,281,209
INFORMATION TECHNOLOGY — 9.2%Applied Materials . . . . . . . . . . . . . . . . . . . . . . . . . . . . . . . . . . . . 18,062 525,243CA . . . . . . . . . . . . . . . . . . . . . . . . . . . . . . . . . . . . . . . . . . . . . . . 13,231 406,721Cisco Systems . . . . . . . . . . . . . . . . . . . . . . . . . . . . . . . . . . . . . . . 25,643 786,727Dolby Laboratories, Cl A . . . . . . . . . . . . . . . . . . . . . . . . . . . . . . . 6,405 304,814Facebook, Cl A* . . . . . . . . . . . . . . . . . . . . . . . . . . . . . . . . . . . . . 3,323 435,280Intel . . . . . . . . . . . . . . . . . . . . . . . . . . . . . . . . . . . . . . . . . . . . . . 14,393 501,884QUALCOMM . . . . . . . . . . . . . . . . . . . . . . . . . . . . . . . . . . . . . . . 6,348 436,234
The accompanying notes are an integral part of the financial statements.11
THE ADVISORS’ INNER CIRCLE FUND III NORTHPOINTELARGE CAP VALUE FUNDOCTOBER 31, 2016
COMMON STOCK — continued
Shares Value
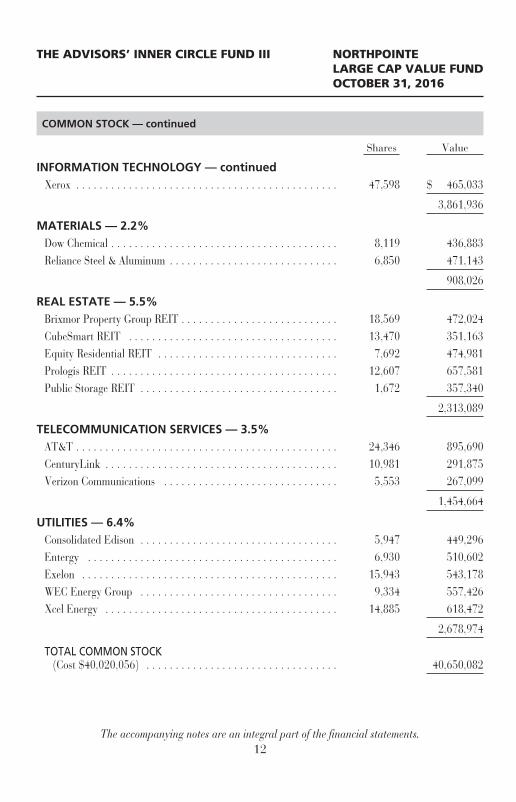
INFORMATION TECHNOLOGY — continuedXerox . . . . . . . . . . . . . . . . . . . . . . . . . . . . . . . . . . . . . . . . . . . . . 47,598 $ 465,033
3,861,936
MATERIALS — 2.2%Dow Chemical . . . . . . . . . . . . . . . . . . . . . . . . . . . . . . . . . . . . . . . 8,119 436,883Reliance Steel & Aluminum . . . . . . . . . . . . . . . . . . . . . . . . . . . . . 6,850 471,143
908,026
REAL ESTATE — 5.5%Brixmor Property Group REIT . . . . . . . . . . . . . . . . . . . . . . . . . . . 18,569 472,024CubeSmart REIT . . . . . . . . . . . . . . . . . . . . . . . . . . . . . . . . . . . . 13,470 351,163Equity Residential REIT . . . . . . . . . . . . . . . . . . . . . . . . . . . . . . . 7,692 474,981Prologis REIT . . . . . . . . . . . . . . . . . . . . . . . . . . . . . . . . . . . . . . . 12,607 657,581Public Storage REIT . . . . . . . . . . . . . . . . . . . . . . . . . . . . . . . . . . 1,672 357,340
2,313,089
TELECOMMUNICATION SERVICES — 3.5%AT&T . . . . . . . . . . . . . . . . . . . . . . . . . . . . . . . . . . . . . . . . . . . . . 24,346 895,690CenturyLink . . . . . . . . . . . . . . . . . . . . . . . . . . . . . . . . . . . . . . . . 10,981 291,875Verizon Communications . . . . . . . . . . . . . . . . . . . . . . . . . . . . . . 5,553 267,099
1,454,664
UTILITIES — 6.4%Consolidated Edison . . . . . . . . . . . . . . . . . . . . . . . . . . . . . . . . . . 5,947 449,296Entergy . . . . . . . . . . . . . . . . . . . . . . . . . . . . . . . . . . . . . . . . . . . 6,930 510,602Exelon . . . . . . . . . . . . . . . . . . . . . . . . . . . . . . . . . . . . . . . . . . . . 15,943 543,178WEC Energy Group . . . . . . . . . . . . . . . . . . . . . . . . . . . . . . . . . . 9,334 557,426Xcel Energy . . . . . . . . . . . . . . . . . . . . . . . . . . . . . . . . . . . . . . . . 14,885 618,472
2,678,974
TOTAL COMMON STOCK(Cost $40,020,056) . . . . . . . . . . . . . . . . . . . . . . . . . . . . . . . . . 40,650,082
The accompanying notes are an integral part of the financial statements.12
THE ADVISORS’ INNER CIRCLE FUND III NORTHPOINTELARGE CAP VALUE FUNDOCTOBER 31, 2016
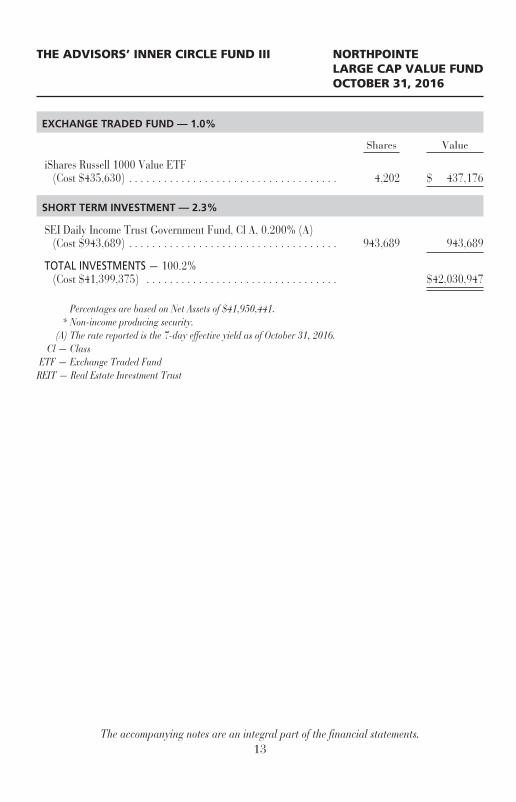
EXCHANGE TRADED FUND — 1.0%
Shares Value
iShares Russell 1000 Value ETF(Cost $435,630) . . . . . . . . . . . . . . . . . . . . . . . . . . . . . . . . . . . . 4,202 $ 437,176
SHORT TERM INVESTMENT — 2.3%
SEI Daily Income Trust Government Fund, Cl A, 0.200% (A)(Cost $943,689) . . . . . . . . . . . . . . . . . . . . . . . . . . . . . . . . . . . . 943,689 943,689
TOTAL INVESTMENTS — 100.2%(Cost $41,399,375) . . . . . . . . . . . . . . . . . . . . . . . . . . . . . . . . . $42,030,947
Percentages are based on Net Assets of $41,950,441.* Non-income producing security.
(A) The rate reported is the 7-day effective yield as of October 31, 2016.Cl — Class
ETF — Exchange Traded FundREIT — Real Estate Investment Trust
The accompanying notes are an integral part of the financial statements.13
THE ADVISORS’ INNER CIRCLE FUND III NORTHPOINTE FUNDSOCTOBER 31, 2016
STATEMENTS OF ASSETS AND LIABILITIES
NorthPointeSmall Cap
Value Fund
NorthPointeLarge Cap
Value Fund
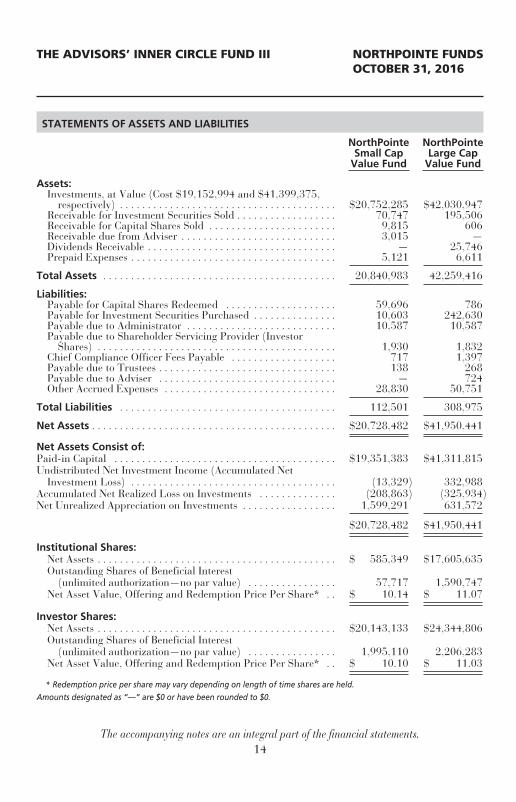
Assets:Investments, at Value (Cost $19,152,994 and $41,399,375,
respectively) . . . . . . . . . . . . . . . . . . . . . . . . . . . . . . . . . . . . . . . $20,752,285 $42,030,947Receivable for Investment Securities Sold . . . . . . . . . . . . . . . . . . 70,747 195,506Receivable for Capital Shares Sold . . . . . . . . . . . . . . . . . . . . . . . 9,815 606Receivable due from Adviser . . . . . . . . . . . . . . . . . . . . . . . . . . . . 3,015 —Dividends Receivable . . . . . . . . . . . . . . . . . . . . . . . . . . . . . . . . . . — 25,746Prepaid Expenses . . . . . . . . . . . . . . . . . . . . . . . . . . . . . . . . . . . . . 5,121 6,611
Total Assets . . . . . . . . . . . . . . . . . . . . . . . . . . . . . . . . . . . . . . . . . . 20,840,983 42,259,416
Liabilities:Payable for Capital Shares Redeemed . . . . . . . . . . . . . . . . . . . . 59,696 786Payable for Investment Securities Purchased . . . . . . . . . . . . . . . 10,603 242,630Payable due to Administrator . . . . . . . . . . . . . . . . . . . . . . . . . . . 10,587 10,587Payable due to Shareholder Servicing Provider (Investor
Shares) . . . . . . . . . . . . . . . . . . . . . . . . . . . . . . . . . . . . . . . . . . . 1,930 1,832Chief Compliance Officer Fees Payable . . . . . . . . . . . . . . . . . . . 717 1,397Payable due to Trustees . . . . . . . . . . . . . . . . . . . . . . . . . . . . . . . . 138 268Payable due to Adviser . . . . . . . . . . . . . . . . . . . . . . . . . . . . . . . . — 724Other Accrued Expenses . . . . . . . . . . . . . . . . . . . . . . . . . . . . . . . 28,830 50,751
Total Liabilities . . . . . . . . . . . . . . . . . . . . . . . . . . . . . . . . . . . . . . . 112,501 308,975
Net Assets . . . . . . . . . . . . . . . . . . . . . . . . . . . . . . . . . . . . . . . . . . . . $20,728,482 $41,950,441
Net Assets Consist of:Paid-in Capital . . . . . . . . . . . . . . . . . . . . . . . . . . . . . . . . . . . . . . . . $19,351,383 $41,311,815Undistributed Net Investment Income (Accumulated Net
Investment Loss) . . . . . . . . . . . . . . . . . . . . . . . . . . . . . . . . . . . . . (13,329) 332,988Accumulated Net Realized Loss on Investments . . . . . . . . . . . . . . (208,863) (325,934)Net Unrealized Appreciation on Investments . . . . . . . . . . . . . . . . . 1,599,291 631,572
$20,728,482 $41,950,441
Institutional Shares:Net Assets . . . . . . . . . . . . . . . . . . . . . . . . . . . . . . . . . . . . . . . . . . . $ 585,349 $17,605,635Outstanding Shares of Beneficial Interest
(unlimited authorization—no par value) . . . . . . . . . . . . . . . . 57,717 1,590,747Net Asset Value, Offering and Redemption Price Per Share* . . $ 10.14 $ 11.07
Investor Shares:Net Assets . . . . . . . . . . . . . . . . . . . . . . . . . . . . . . . . . . . . . . . . . . . $20,143,133 $24,344,806Outstanding Shares of Beneficial Interest
(unlimited authorization—no par value) . . . . . . . . . . . . . . . . 1,995,110 2,206,283Net Asset Value, Offering and Redemption Price Per Share* . . $ 10.10 $ 11.03
* Redemption price per share may vary depending on length of time shares are held.Amounts designated as “—” are $0 or have been rounded to $0.
The accompanying notes are an integral part of the financial statements.14
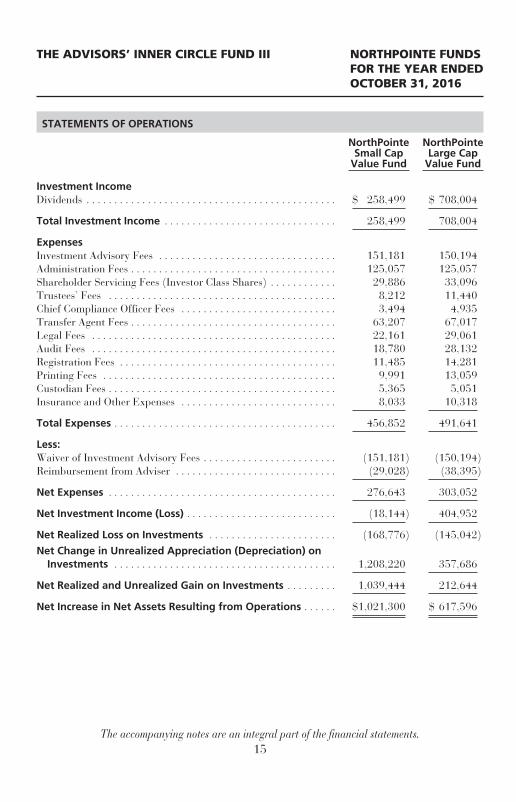
THE ADVISORS’ INNER CIRCLE FUND III NORTHPOINTE FUNDSFOR THE YEAR ENDEDOCTOBER 31, 2016
STATEMENTS OF OPERATIONS
NorthPointeSmall Cap
Value Fund
NorthPointeLarge Cap
Value Fund
Investment IncomeDividends . . . . . . . . . . . . . . . . . . . . . . . . . . . . . . . . . . . . . . . . . . . . . $ 258,499 $ 708,004
Total Investment Income . . . . . . . . . . . . . . . . . . . . . . . . . . . . . . . 258,499 708,004
ExpensesInvestment Advisory Fees . . . . . . . . . . . . . . . . . . . . . . . . . . . . . . . . 151,181 150,194Administration Fees . . . . . . . . . . . . . . . . . . . . . . . . . . . . . . . . . . . . . 125,057 125,057Shareholder Servicing Fees (Investor Class Shares) . . . . . . . . . . . . 29,886 33,096Trustees’ Fees . . . . . . . . . . . . . . . . . . . . . . . . . . . . . . . . . . . . . . . . . 8,212 11,440Chief Compliance Officer Fees . . . . . . . . . . . . . . . . . . . . . . . . . . . . 3,494 4,935Transfer Agent Fees . . . . . . . . . . . . . . . . . . . . . . . . . . . . . . . . . . . . . 63,207 67,017Legal Fees . . . . . . . . . . . . . . . . . . . . . . . . . . . . . . . . . . . . . . . . . . . . 22,161 29,061Audit Fees . . . . . . . . . . . . . . . . . . . . . . . . . . . . . . . . . . . . . . . . . . . . 18,780 28,132Registration Fees . . . . . . . . . . . . . . . . . . . . . . . . . . . . . . . . . . . . . . . 11,485 14,281Printing Fees . . . . . . . . . . . . . . . . . . . . . . . . . . . . . . . . . . . . . . . . . . 9,991 13,059Custodian Fees . . . . . . . . . . . . . . . . . . . . . . . . . . . . . . . . . . . . . . . . . 5,365 5,051Insurance and Other Expenses . . . . . . . . . . . . . . . . . . . . . . . . . . . . 8,033 10,318
Total Expenses . . . . . . . . . . . . . . . . . . . . . . . . . . . . . . . . . . . . . . . . 456,852 491,641
Less:Waiver of Investment Advisory Fees . . . . . . . . . . . . . . . . . . . . . . . . (151,181) (150,194)Reimbursement from Adviser . . . . . . . . . . . . . . . . . . . . . . . . . . . . . (29,028) (38,395)
Net Expenses . . . . . . . . . . . . . . . . . . . . . . . . . . . . . . . . . . . . . . . . . 276,643 303,052
Net Investment Income (Loss) . . . . . . . . . . . . . . . . . . . . . . . . . . . (18,144) 404,952
Net Realized Loss on Investments . . . . . . . . . . . . . . . . . . . . . . . (168,776) (145,042)Net Change in Unrealized Appreciation (Depreciation) on
Investments . . . . . . . . . . . . . . . . . . . . . . . . . . . . . . . . . . . . . . . . 1,208,220 357,686
Net Realized and Unrealized Gain on Investments . . . . . . . . . 1,039,444 212,644
Net Increase in Net Assets Resulting from Operations . . . . . . $1,021,300 $ 617,596
The accompanying notes are an integral part of the financial statements.15
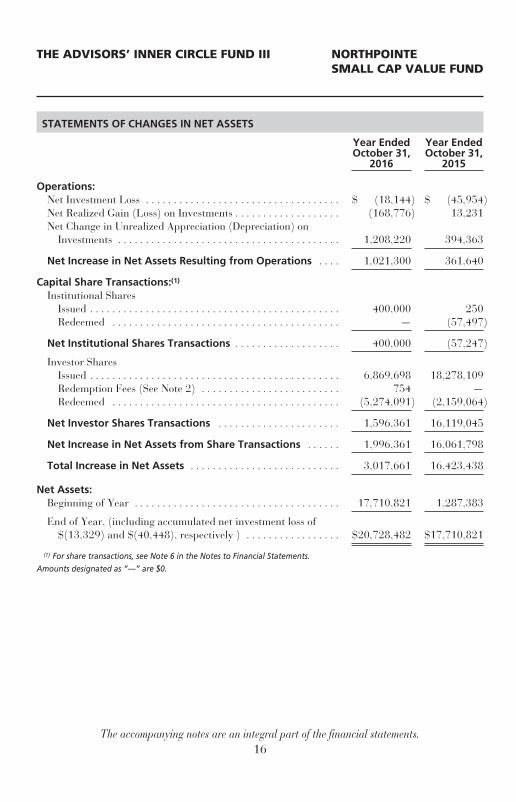
THE ADVISORS’ INNER CIRCLE FUND III NORTHPOINTESMALL CAP VALUE FUND
STATEMENTS OF CHANGES IN NET ASSETS
Year EndedOctober 31,
2016
Year EndedOctober 31,
2015
Operations:Net Investment Loss . . . . . . . . . . . . . . . . . . . . . . . . . . . . . . . . . . . $ (18,144) $ (45,954)Net Realized Gain (Loss) on Investments . . . . . . . . . . . . . . . . . . . (168,776) 13,231Net Change in Unrealized Appreciation (Depreciation) on
Investments . . . . . . . . . . . . . . . . . . . . . . . . . . . . . . . . . . . . . . . . 1,208,220 394,363
Net Increase in Net Assets Resulting from Operations . . . . 1,021,300 361,640
Capital Share Transactions:(1)
Institutional SharesIssued . . . . . . . . . . . . . . . . . . . . . . . . . . . . . . . . . . . . . . . . . . . . . 400,000 250Redeemed . . . . . . . . . . . . . . . . . . . . . . . . . . . . . . . . . . . . . . . . . — (57,497)
Net Institutional Shares Transactions . . . . . . . . . . . . . . . . . . . 400,000 (57,247)
Investor SharesIssued . . . . . . . . . . . . . . . . . . . . . . . . . . . . . . . . . . . . . . . . . . . . . 6,869,698 18,278,109Redemption Fees (See Note 2) . . . . . . . . . . . . . . . . . . . . . . . . . 754 —Redeemed . . . . . . . . . . . . . . . . . . . . . . . . . . . . . . . . . . . . . . . . . (5,274,091) (2,159,064)
Net Investor Shares Transactions . . . . . . . . . . . . . . . . . . . . . . 1,596,361 16,119,045
Net Increase in Net Assets from Share Transactions . . . . . . 1,996,361 16,061,798
Total Increase in Net Assets . . . . . . . . . . . . . . . . . . . . . . . . . . . 3,017,661 16,423,438
Net Assets:Beginning of Year . . . . . . . . . . . . . . . . . . . . . . . . . . . . . . . . . . . . . 17,710,821 1,287,383
End of Year, (including accumulated net investment loss of$(13,329) and $(40,448), respectively ) . . . . . . . . . . . . . . . . . $20,728,482 $17,710,821
(1) For share transactions, see Note 6 in the Notes to Financial Statements.Amounts designated as “—” are $0.
The accompanying notes are an integral part of the financial statements.16
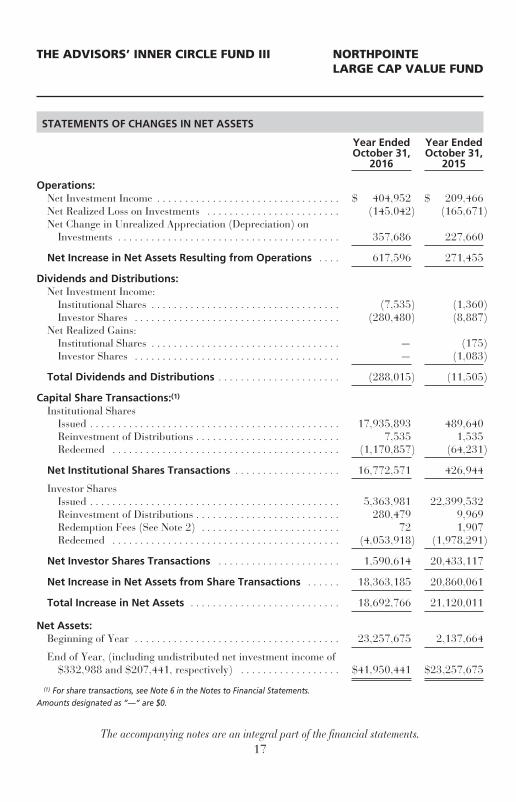
THE ADVISORS’ INNER CIRCLE FUND III NORTHPOINTELARGE CAP VALUE FUND
STATEMENTS OF CHANGES IN NET ASSETS
Year EndedOctober 31,
2016
Year EndedOctober 31,
2015
Operations:Net Investment Income . . . . . . . . . . . . . . . . . . . . . . . . . . . . . . . . . $ 404,952 $ 209,466Net Realized Loss on Investments . . . . . . . . . . . . . . . . . . . . . . . . (145,042) (165,671)Net Change in Unrealized Appreciation (Depreciation) on
Investments . . . . . . . . . . . . . . . . . . . . . . . . . . . . . . . . . . . . . . . . 357,686 227,660
Net Increase in Net Assets Resulting from Operations . . . . 617,596 271,455
Dividends and Distributions:Net Investment Income:
Institutional Shares . . . . . . . . . . . . . . . . . . . . . . . . . . . . . . . . . . (7,535) (1,360)Investor Shares . . . . . . . . . . . . . . . . . . . . . . . . . . . . . . . . . . . . . (280,480) (8,887)
Net Realized Gains:Institutional Shares . . . . . . . . . . . . . . . . . . . . . . . . . . . . . . . . . . — (175)Investor Shares . . . . . . . . . . . . . . . . . . . . . . . . . . . . . . . . . . . . . — (1,083)
Total Dividends and Distributions . . . . . . . . . . . . . . . . . . . . . . (288,015) (11,505)
Capital Share Transactions:(1)
Institutional SharesIssued . . . . . . . . . . . . . . . . . . . . . . . . . . . . . . . . . . . . . . . . . . . . . 17,935,893 489,640Reinvestment of Distributions . . . . . . . . . . . . . . . . . . . . . . . . . . 7,535 1,535Redeemed . . . . . . . . . . . . . . . . . . . . . . . . . . . . . . . . . . . . . . . . . (1,170,857) (64,231)
Net Institutional Shares Transactions . . . . . . . . . . . . . . . . . . . 16,772,571 426,944
Investor SharesIssued . . . . . . . . . . . . . . . . . . . . . . . . . . . . . . . . . . . . . . . . . . . . . 5,363,981 22,399,532Reinvestment of Distributions . . . . . . . . . . . . . . . . . . . . . . . . . . 280,479 9,969Redemption Fees (See Note 2) . . . . . . . . . . . . . . . . . . . . . . . . . 72 1,907Redeemed . . . . . . . . . . . . . . . . . . . . . . . . . . . . . . . . . . . . . . . . . (4,053,918) (1,978,291)
Net Investor Shares Transactions . . . . . . . . . . . . . . . . . . . . . . 1,590,614 20,433,117
Net Increase in Net Assets from Share Transactions . . . . . . 18,363,185 20,860,061
Total Increase in Net Assets . . . . . . . . . . . . . . . . . . . . . . . . . . . 18,692,766 21,120,011
Net Assets:Beginning of Year . . . . . . . . . . . . . . . . . . . . . . . . . . . . . . . . . . . . . 23,257,675 2,137,664
End of Year, (including undistributed net investment income of$332,988 and $207,441, respectively) . . . . . . . . . . . . . . . . . . $41,950,441 $23,257,675
(1) For share transactions, see Note 6 in the Notes to Financial Statements.Amounts designated as “—” are $0.
The accompanying notes are an integral part of the financial statements.17
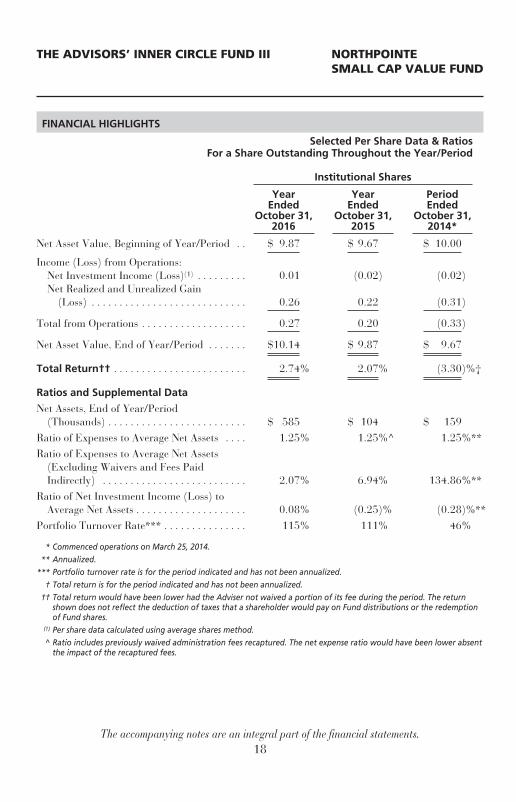
THE ADVISORS’ INNER CIRCLE FUND III NORTHPOINTESMALL CAP VALUE FUND
FINANCIAL HIGHLIGHTS
Selected Per Share Data & RatiosFor a Share Outstanding Throughout the Year/Period
Institutional Shares
YearEnded
October 31,2016
YearEnded
October 31,2015
PeriodEnded
October 31,2014*
Net Asset Value, Beginning of Year/Period . . $ 9.87 $ 9.67 $ 10.00
Income (Loss) from Operations:Net Investment Income (Loss)(1) . . . . . . . . . 0.01 (0.02) (0.02)Net Realized and Unrealized Gain
(Loss) . . . . . . . . . . . . . . . . . . . . . . . . . . . . 0.26 0.22 (0.31)
Total from Operations . . . . . . . . . . . . . . . . . . . 0.27 0.20 (0.33)
Net Asset Value, End of Year/Period . . . . . . . $10.14 $ 9.87 $ 9.67
Total Return†† . . . . . . . . . . . . . . . . . . . . . . . . 2.74% 2.07% (3.30)%†
Ratios and Supplemental Data
Net Assets, End of Year/Period(Thousands) . . . . . . . . . . . . . . . . . . . . . . . . . $ 585 $ 104 $ 159
Ratio of Expenses to Average Net Assets . . . . 1.25% 1.25%^ 1.25%**Ratio of Expenses to Average Net Assets
(Excluding Waivers and Fees PaidIndirectly) . . . . . . . . . . . . . . . . . . . . . . . . . . 2.07% 6.94% 134.86%**
Ratio of Net Investment Income (Loss) toAverage Net Assets . . . . . . . . . . . . . . . . . . . . 0.08% (0.25)% (0.28)%**
Portfolio Turnover Rate*** . . . . . . . . . . . . . . . 115% 111% 46%
* Commenced operations on March 25, 2014.** Annualized.
*** Portfolio turnover rate is for the period indicated and has not been annualized.† Total return is for the period indicated and has not been annualized.
†† Total return would have been lower had the Adviser not waived a portion of its fee during the period. The returnshown does not reflect the deduction of taxes that a shareholder would pay on Fund distributions or the redemptionof Fund shares.
(1) Per share data calculated using average shares method.^ Ratio includes previously waived administration fees recaptured. The net expense ratio would have been lower absent
the impact of the recaptured fees.
The accompanying notes are an integral part of the financial statements.18
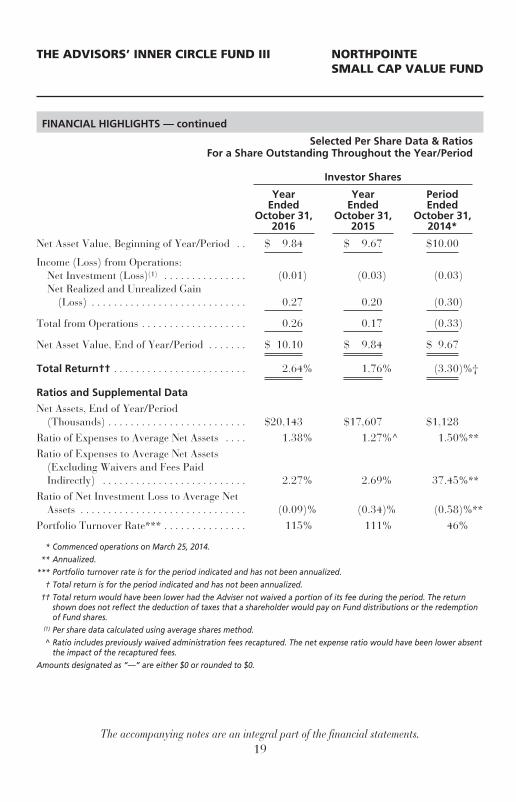
THE ADVISORS’ INNER CIRCLE FUND III NORTHPOINTESMALL CAP VALUE FUND
FINANCIAL HIGHLIGHTS — continued
Selected Per Share Data & RatiosFor a Share Outstanding Throughout the Year/Period
Investor Shares
YearEnded
October 31,2016
YearEnded
October 31,2015
PeriodEnded
October 31,2014*
Net Asset Value, Beginning of Year/Period . . $ 9.84 $ 9.67 $10.00
Income (Loss) from Operations:Net Investment (Loss)(1) . . . . . . . . . . . . . . . (0.01) (0.03) (0.03)Net Realized and Unrealized Gain
(Loss) . . . . . . . . . . . . . . . . . . . . . . . . . . . . 0.27 0.20 (0.30)
Total from Operations . . . . . . . . . . . . . . . . . . . 0.26 0.17 (0.33)
Net Asset Value, End of Year/Period . . . . . . . $ 10.10 $ 9.84 $ 9.67
Total Return†† . . . . . . . . . . . . . . . . . . . . . . . . 2.64% 1.76% (3.30)%†
Ratios and Supplemental Data
Net Assets, End of Year/Period(Thousands) . . . . . . . . . . . . . . . . . . . . . . . . . $20,143 $17,607 $1,128
Ratio of Expenses to Average Net Assets . . . . 1.38% 1.27%^ 1.50%**Ratio of Expenses to Average Net Assets
(Excluding Waivers and Fees PaidIndirectly) . . . . . . . . . . . . . . . . . . . . . . . . . . 2.27% 2.69% 37.45%**
Ratio of Net Investment Loss to Average NetAssets . . . . . . . . . . . . . . . . . . . . . . . . . . . . . . (0.09)% (0.34)% (0.58)%**
Portfolio Turnover Rate*** . . . . . . . . . . . . . . . 115% 111% 46%
* Commenced operations on March 25, 2014.** Annualized.
*** Portfolio turnover rate is for the period indicated and has not been annualized.† Total return is for the period indicated and has not been annualized.
†† Total return would have been lower had the Adviser not waived a portion of its fee during the period. The returnshown does not reflect the deduction of taxes that a shareholder would pay on Fund distributions or the redemptionof Fund shares.
(1) Per share data calculated using average shares method.^ Ratio includes previously waived administration fees recaptured. The net expense ratio would have been lower absent
the impact of the recaptured fees.Amounts designated as “—” are either $0 or rounded to $0.
The accompanying notes are an integral part of the financial statements.19
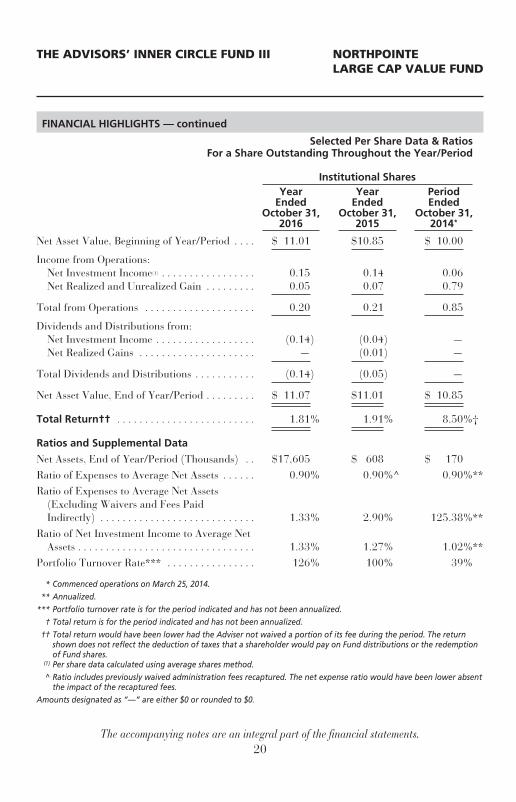
THE ADVISORS’ INNER CIRCLE FUND III NORTHPOINTELARGE CAP VALUE FUND
FINANCIAL HIGHLIGHTS — continued
Selected Per Share Data & RatiosFor a Share Outstanding Throughout the Year/Period
Institutional SharesYear
EndedOctober 31,
2016
YearEnded
October 31,2015
PeriodEnded
October 31,2014*
Net Asset Value, Beginning of Year/Period . . . . $ 11.01 $10.85 $ 10.00
Income from Operations:Net Investment Income(1) . . . . . . . . . . . . . . . . . 0.15 0.14 0.06Net Realized and Unrealized Gain . . . . . . . . . 0.05 0.07 0.79
Total from Operations . . . . . . . . . . . . . . . . . . . . 0.20 0.21 0.85
Dividends and Distributions from:Net Investment Income . . . . . . . . . . . . . . . . . . (0.14) (0.04) —Net Realized Gains . . . . . . . . . . . . . . . . . . . . . — (0.01) —
Total Dividends and Distributions . . . . . . . . . . . (0.14) (0.05) —
Net Asset Value, End of Year/Period . . . . . . . . . $ 11.07 $11.01 $ 10.85
Total Return†† . . . . . . . . . . . . . . . . . . . . . . . . . 1.81% 1.91% 8.50%†
Ratios and Supplemental Data
Net Assets, End of Year/Period (Thousands) . . $17,605 $ 608 $ 170Ratio of Expenses to Average Net Assets . . . . . . 0.90% 0.90%^ 0.90%**Ratio of Expenses to Average Net Assets
(Excluding Waivers and Fees PaidIndirectly) . . . . . . . . . . . . . . . . . . . . . . . . . . . . 1.33% 2.90% 125.38%**
Ratio of Net Investment Income to Average NetAssets . . . . . . . . . . . . . . . . . . . . . . . . . . . . . . . . 1.33% 1.27% 1.02%**
Portfolio Turnover Rate*** . . . . . . . . . . . . . . . . 126% 100% 39%
* Commenced operations on March 25, 2014.** Annualized.
*** Portfolio turnover rate is for the period indicated and has not been annualized.† Total return is for the period indicated and has not been annualized.
†† Total return would have been lower had the Adviser not waived a portion of its fee during the period. The returnshown does not reflect the deduction of taxes that a shareholder would pay on Fund distributions or the redemptionof Fund shares.
(1) Per share data calculated using average shares method.^ Ratio includes previously waived administration fees recaptured. The net expense ratio would have been lower absent
the impact of the recaptured fees.Amounts designated as “—” are either $0 or rounded to $0.
The accompanying notes are an integral part of the financial statements.20
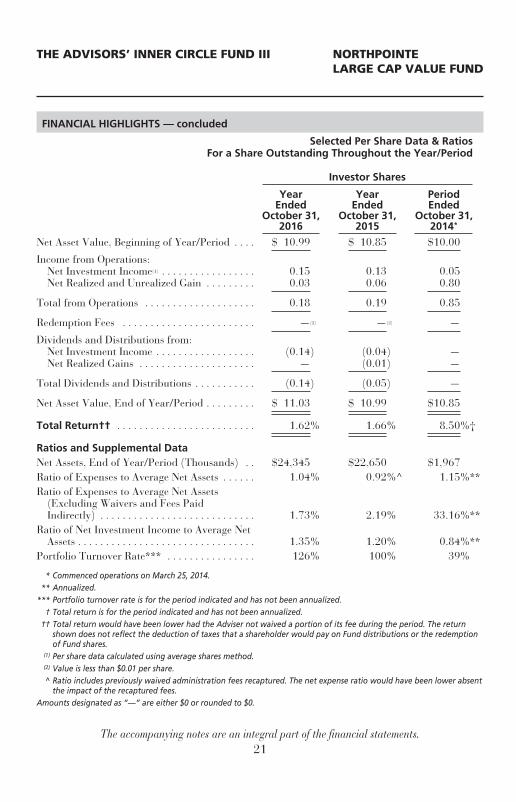
THE ADVISORS’ INNER CIRCLE FUND III NORTHPOINTELARGE CAP VALUE FUND
FINANCIAL HIGHLIGHTS — concluded
Selected Per Share Data & RatiosFor a Share Outstanding Throughout the Year/Period
Investor Shares
YearEnded
October 31,2016
YearEnded
October 31,2015
PeriodEnded
October 31,2014*
Net Asset Value, Beginning of Year/Period . . . . $ 10.99 $ 10.85 $10.00
Income from Operations:Net Investment Income(1) . . . . . . . . . . . . . . . . . 0.15 0.13 0.05Net Realized and Unrealized Gain . . . . . . . . . 0.03 0.06 0.80
Total from Operations . . . . . . . . . . . . . . . . . . . . 0.18 0.19 0.85
Redemption Fees . . . . . . . . . . . . . . . . . . . . . . . . —(2) —(2) —
Dividends and Distributions from:Net Investment Income . . . . . . . . . . . . . . . . . . (0.14) (0.04) —Net Realized Gains . . . . . . . . . . . . . . . . . . . . . — (0.01) —
Total Dividends and Distributions . . . . . . . . . . . (0.14) (0.05) —
Net Asset Value, End of Year/Period . . . . . . . . . $ 11.03 $ 10.99 $10.85
Total Return†† . . . . . . . . . . . . . . . . . . . . . . . . . 1.62% 1.66% 8.50%†
Ratios and Supplemental DataNet Assets, End of Year/Period (Thousands) . . $24,345 $22,650 $1,967Ratio of Expenses to Average Net Assets . . . . . . 1.04% 0.92%^ 1.15%**Ratio of Expenses to Average Net Assets
(Excluding Waivers and Fees PaidIndirectly) . . . . . . . . . . . . . . . . . . . . . . . . . . . . 1.73% 2.19% 33.16%**
Ratio of Net Investment Income to Average NetAssets . . . . . . . . . . . . . . . . . . . . . . . . . . . . . . . . 1.35% 1.20% 0.84%**
Portfolio Turnover Rate*** . . . . . . . . . . . . . . . . 126% 100% 39%
* Commenced operations on March 25, 2014.** Annualized.
*** Portfolio turnover rate is for the period indicated and has not been annualized.† Total return is for the period indicated and has not been annualized.
†† Total return would have been lower had the Adviser not waived a portion of its fee during the period. The returnshown does not reflect the deduction of taxes that a shareholder would pay on Fund distributions or the redemptionof Fund shares.
(1) Per share data calculated using average shares method.(2) Value is less than $0.01 per share.^ Ratio includes previously waived administration fees recaptured. The net expense ratio would have been lower absent
the impact of the recaptured fees.Amounts designated as “—” are either $0 or rounded to $0.
The accompanying notes are an integral part of the financial statements.21
THE ADVISORS’ INNER CIRCLE FUND III NORTHPOINTE FUNDSOCTOBER 31, 2016
NOTES TO FINANCIAL STATEMENTS
1. Organization:
The Advisors’ Inner Circle Fund III (the “Trust”) is organized as a Delaware statutorytrust under an Agreement and Declaration of Trust dated December 4, 2013. The Trustis registered under the Investment Company Act of 1940, as amended, as an open-endmanagement investment company with 14 funds. The financial statements herein arethose of the NorthPointe Small Cap Value Fund and the NorthPointe Large Cap ValueFund (each a “Fund” and collectively the “Funds”). The investment objective of theNorthPointe Small Cap Value Fund is to seek long-term capital appreciation. TheNorthPointe Small Cap Value Fund is a diversified fund and focuses on U.S. and foreignlisted common stocks with small market capitalizations that NorthPointe Capital, LLC(the “Adviser”) believes have good earnings growth potential and are undervalued in themarket. The investment objective of the NorthPointe Large Cap Value Fund is long-termgrowth of capital by investing in equity securities from large-cap companies. TheNorthPointe Large Cap Value Fund is a diversified fund. The assets of each fund aresegregated, and a shareholder’s interest is limited to the fund in which shares are held.The Funds are each registered to offer Institutional Shares and Investor Shares.
2. Significant Accounting Policies:
The following is a summary of the significant accounting policies followed by the Fund inthe preparation of its financial statements. The Fund is an investment company inconformity with U.S. generally accepted accounting principles (“U.S. GAAP”). Therefore,the Fund follows the accounting and reporting guidance for investment companies.
Use of Estimates — The preparation of financial statements in conformity withU.S. GAAP requires management to make estimates and assumptions that affect thefair value of assets, the reported amount of assets and liabilities and disclosures ofcontingent assets and liabilities at the date of the financial statements and thereported amounts of revenues and expenses during the reporting period. Actualresults could differ from those estimates and such differences could be material.
Security Valuation — Securities listed on a securities exchange, market orautomated quotation system for which quotations are readily available (except forsecurities traded on NASDAQ), including securities traded over the counter, arevalued at the last quoted sale price on an exchange or market (foreign or domestic)on which they are traded on valuation date (or at approximately 4:00 pm ET if asecurity’s primary exchange is normally open at that time), or, if there is no such
22
THE ADVISORS’ INNER CIRCLE FUND III NORTHPOINTE FUNDSOCTOBER 31, 2016
reported sale on the valuation date, at the most recent quoted bid price. Forsecurities traded on NASDAQ, the NASDAQ Official Closing Price will be used.
Securities for which market prices are not “readily available” are valued inaccordance with Fair Value Procedures established by the Fund’s Board of Trustees(the “Board”). The Fund’s Fair Value Procedures are implemented through a FairValue Committee (the “Committee”) designated by the Board. Some of the morecommon reasons that may necessitate that a security be valued using Fair ValueProcedures include: the security’s trading has been halted or suspended; the securityhas been de-listed from a national exchange; the security’s primary trading marketis temporarily closed at a time when under normal conditions it would be open; thesecurity has not been traded for an extended period of time; the security’s primarypricing source is not able or willing to provide a price; or trading of the security issubject to local government-imposed restrictions. When a security is valued inaccordance with the Fair Value Procedures, the Committee will determine the valueafter taking into consideration relevant information reasonably available to theCommittee. As of October 31, 2016, there were no fair valued securities.
In accordance with the authoritative guidance on fair value measurements anddisclosure under U.S. GAAP, the Funds disclose fair value of their investments in ahierarchy that prioritizes the inputs to valuation techniques used to measure the fairvalue. The objective of a fair value measurement is to determine the price thatwould be received to sell an asset or paid to transfer a liability in an orderlytransaction between market participants at the measurement date (an exit price).Accordingly, the fair value hierarchy gives the highest priority to quoted prices(unadjusted) in active markets for identical assets or liabilities (Level 1) and thelowest priority to unobservable inputs (Level 3). The three levels of the fair valuehierarchy are described below:
• Level 1 — Unadjusted quoted prices in active markets for identical, unrestrictedassets or liabilities that the Funds have the ability to access at the measurementdate;
• Level 2 — Other significant observable inputs (includes quoted prices for similarsecurities, interest rates, prepayment speeds, credit risk, referenced indices,quoted prices in inactive markets, adjusted quoted prices in inactive markets,etc.); and
• Level 3 — Prices, inputs or exotic modeling techniques which are bothsignificant to the fair value measurement and unobservable (supported by littleor no market activity).
23
THE ADVISORS’ INNER CIRCLE FUND III NORTHPOINTE FUNDSOCTOBER 31, 2016
Investments are classified within the level of the lowest significant input consideredin determining fair value. Investments classified within Level 3 whose fair valuemeasurement considers several inputs may include Level 1 or Level 2 inputs ascomponents of the overall fair value measurement.
As of October 31, 2016, all of the Funds’ investments in securities were consideredLevel 1, in accordance with the authoritative guidance on fair value measurementsand disclosure under U.S. GAAP. For details of investment classifications, referencethe Schedules of Investments.
For the year ended October 31, 2016, there have been no transfers between Level 1and Level 2 and Level 3 assets and liabilities. During the year ended October 31,2016, there were no Level 3 securities.
During the year ended October 31, 2016, there have been no significant changes tothe Funds’ fair value methodologies.
Federal Income Taxes — It is the Funds’ intention to qualify as regulatedinvestment companies for Federal income tax purposes by complying with theappropriate provisions of Subchapter M of the Internal Revenue Code of 1986, asamended, and to distribute substantially all of their income to their shareholders.Accordingly, no provisions for Federal income taxes have been made in the financialstatements.
The Funds evaluate tax positions taken or expected to be taken in the course ofpreparing the Funds’ tax returns to determine whether it is “more-likely-than not”(i.e., greater than 50-percent) that each tax position will be sustained uponexamination by a taxing authority based on the technical merits of the position. Taxpositions not deemed to meet the more-likely-than-not threshold are recorded as atax benefit or expense in the current year. The Funds did not record any taxprovision in the current period. However, management’s conclusions regarding taxpositions taken may be subject to review and adjustment at a later date based onfactors including, but not limited to, examination by tax authorities (i.e., the opentax year ends since inception, as applicable), on-going analysis of and changes totax laws, regulations and interpretations thereof.
As of and during the year ended October 31, 2016, the Funds did not have aliability for any unrecognized tax benefits. The Funds recognize interest andpenalties, if any, related to unrecognized tax benefits as income tax expense in theStatement of Operations. During the year ended October 31, 2016, the Funds didnot incur any interest or penalties.
24
THE ADVISORS’ INNER CIRCLE FUND III NORTHPOINTE FUNDSOCTOBER 31, 2016
Security Transactions and Investment Income — Security transactions areaccounted for on trade date. Costs used in determining realized gains and losses onthe sale of investment securities are based on the specific identification method.Dividend income is recorded on the ex-dividend date. Interest income is recognizedon the accrual basis from settlement date.
Expenses — Most expenses of the Trust can be directly attributed to a particularfund. Certain expenses are apportioned among the Trust based on the number offunds and/or relative net assets.
Classes — Class specific expenses are borne by that class of shares. Income, realizedand unrealized gains (losses), and non-class specific expenses are allocated to therespective class on the basis of relative daily net assets.
Dividends and Distributions to Shareholders — The Funds will distributesubstantially all of their net investment income and make distributions of their netrealized capital gains, if any, at least annually. All distributions are recorded on ex-dividend date.
Deferred Offering Costs — Offering costs, including costs of printing initialprospectus, legal and registration fees, are amortized over twelve-months frominception of the Funds. As of October 31, 2016, these costs were fully amortized forboth funds.
Investments in REITs — Dividend income from REITs is recorded based on theincome included in distributions received from the REIT investments usingpublished REIT reclassifications, including some management estimates whenactual amounts are not available. Distributions received in excess of this estimatedamount are recorded as a reduction of the cost of investments or reclassified tocapital gains. The actual amounts of income, return of capital, and capital gains areonly determined by each REIT after its fiscal year-end, and may differ from theestimated amounts.
Redemption Fees — The Funds retain a redemption fee of 2.00% on redemptionsof capital shares held for less than ninety days. Such fees are retained by the Fundfor the benefit of the remaining shareholders. For the year ended October 31, 2016,the NorthPointe Small Cap Fund retained $754 in redemption fees for the InvestorShares. For the year ended October 31, 2016, the NorthPointe Large Cap Fundretained $72 in redemption fees for the Investor Shares.
25
THE ADVISORS’ INNER CIRCLE FUND III NORTHPOINTE FUNDSOCTOBER 31, 2016
3. Transactions with Affiliates:
Certain officers of the Trust are also employees of SEI Investments Global FundsServices (the “Administrator”), a wholly owned subsidiary of SEI Investments Company,and/or SEI Investments Distribution Co. (the “Distributor”). Such officers are paid nofees by the Trust, other than the Chief Compliance Officer (“CCO”) as described below,for serving as officers of the Trust.
A portion of the services provided by the CCO and his staff, whom are employees of theAdministrator, are paid for by the Trust as incurred. The services include regulatoryoversight of the Trust’s Advisors and service providers as required by SEC regulations.The CCO’s services and fees have been approved by and are reviewed by the Board.
4. Administration, Distribution, Shareholder Servicing, Transfer Agent andCustodian Agreements:
The Funds and the Administrator are parties to an Administration Agreement underwhich the Administrator provides management and administrative services to the Funds.For these services, the Administrator is paid an asset-based fee, which will varydepending on the number of share classes and the average daily net assets of the Funds.For the year ended October 31, 2016, the NorthPointe Small Cap Value Fund andNorthPointe Large Cap Value Fund paid $125,057 and $125,057, respectively, for theseservices. For the year ended October 31, 2016, the Administrator did not recapture anypreviously waived fees from the NorthPointe Small Cap Value Fund and NorthPointeLarge Cap Value Fund.
The Trust and the Distributor are parties to a Distribution Agreement. The Distributorreceives no fees under the Agreement.
The Funds have entered into shareholder servicing agreements with third-party serviceproviders pursuant to which the service providers provide certain shareholder services toFund shareholders (the “Service Plan”). Under the Service Plan, the Funds may payservice providers a fee at a rate of up to 0.25% annually of the average daily net assetsattributable to Investor Shares, subject to the arrangement for provision of shareholderand administrative services. For the year ended October 31, 2016, the NorthPointeSmall Cap Value Fund and NorthPointe Large Cap Value Fund incurred shareholderservicing fees of $29,886 and $33,096, respectively.
DST Systems, Inc. serves as the transfer agent and dividend disbursing agent for theFunds under a transfer agency agreement with the Trust.
26
THE ADVISORS’ INNER CIRCLE FUND III NORTHPOINTE FUNDSOCTOBER 31, 2016
MUFG Union Bank, N.A. acts as the custodian (the “Custodian”) for the Funds. TheCustodian plays no role in determining the investment policies of the Funds or whichsecurities are to be purchased or sold by the Funds.
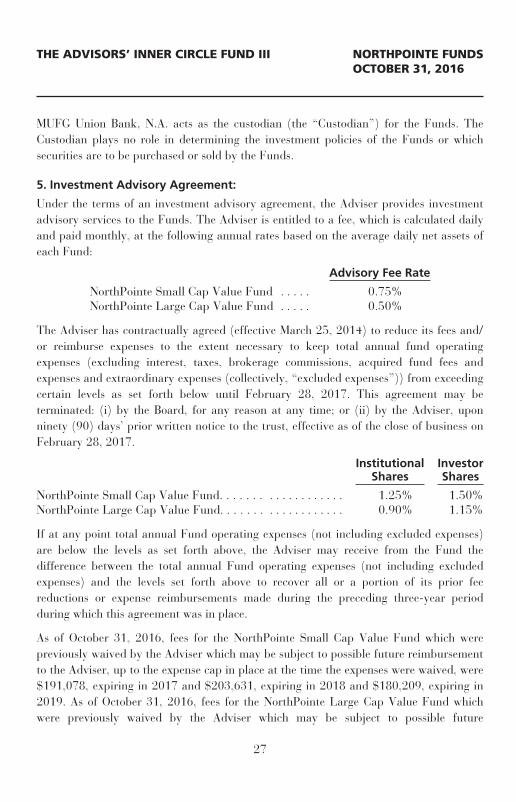
5. Investment Advisory Agreement:
Under the terms of an investment advisory agreement, the Adviser provides investmentadvisory services to the Funds. The Adviser is entitled to a fee, which is calculated dailyand paid monthly, at the following annual rates based on the average daily net assets ofeach Fund:
Advisory Fee Rate
NorthPointe Small Cap Value Fund . . . . . 0.75%NorthPointe Large Cap Value Fund . . . . . 0.50%
The Adviser has contractually agreed (effective March 25, 2014) to reduce its fees and/or reimburse expenses to the extent necessary to keep total annual fund operatingexpenses (excluding interest, taxes, brokerage commissions, acquired fund fees andexpenses and extraordinary expenses (collectively, “excluded expenses”)) from exceedingcertain levels as set forth below until February 28, 2017. This agreement may beterminated: (i) by the Board, for any reason at any time; or (ii) by the Adviser, uponninety (90) days’ prior written notice to the trust, effective as of the close of business onFebruary 28, 2017.
InstitutionalShares
InvestorShares
NorthPointe Small Cap Value Fund. . . . . . . . . . . . . . . . . . . 1.25% 1.50%NorthPointe Large Cap Value Fund. . . . . . . . . . . . . . . . . . . 0.90% 1.15%
If at any point total annual Fund operating expenses (not including excluded expenses)are below the levels as set forth above, the Adviser may receive from the Fund thedifference between the total annual Fund operating expenses (not including excludedexpenses) and the levels set forth above to recover all or a portion of its prior feereductions or expense reimbursements made during the preceding three-year periodduring which this agreement was in place.
As of October 31, 2016, fees for the NorthPointe Small Cap Value Fund which werepreviously waived by the Adviser which may be subject to possible future reimbursementto the Adviser, up to the expense cap in place at the time the expenses were waived, were$191,078, expiring in 2017 and $203,631, expiring in 2018 and $180,209, expiring in2019. As of October 31, 2016, fees for the NorthPointe Large Cap Value Fund whichwere previously waived by the Adviser which may be subject to possible future
27
THE ADVISORS’ INNER CIRCLE FUND III NORTHPOINTE FUNDSOCTOBER 31, 2016
reimbursement to the Adviser, up to the expense cap in place at the time the expenseswere waived, were $214,554, expiring in 2017 and $228,917, expiring in 2018 and$188,589, expiring in 2019.
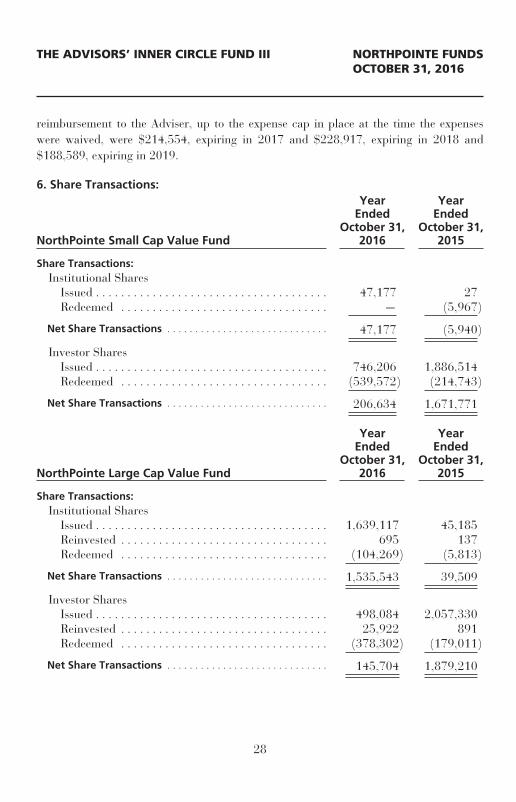
6. Share Transactions:
NorthPointe Small Cap Value Fund
YearEnded
October 31,2016
YearEnded
October 31,2015
Share Transactions:Institutional Shares
Issued . . . . . . . . . . . . . . . . . . . . . . . . . . . . . . . . . . . . . 47,177 27Redeemed . . . . . . . . . . . . . . . . . . . . . . . . . . . . . . . . . — (5,967)
Net Share Transactions . . . . . . . . . . . . . . . . . . . . . . . . . . . . . 47,177 (5,940)
Investor SharesIssued . . . . . . . . . . . . . . . . . . . . . . . . . . . . . . . . . . . . . 746,206 1,886,514Redeemed . . . . . . . . . . . . . . . . . . . . . . . . . . . . . . . . . (539,572) (214,743)
Net Share Transactions . . . . . . . . . . . . . . . . . . . . . . . . . . . . . 206,634 1,671,771
NorthPointe Large Cap Value Fund
YearEnded
October 31,2016
YearEnded
October 31,2015
Share Transactions:Institutional Shares
Issued . . . . . . . . . . . . . . . . . . . . . . . . . . . . . . . . . . . . . 1,639,117 45,185Reinvested . . . . . . . . . . . . . . . . . . . . . . . . . . . . . . . . . 695 137Redeemed . . . . . . . . . . . . . . . . . . . . . . . . . . . . . . . . . (104,269) (5,813)
Net Share Transactions . . . . . . . . . . . . . . . . . . . . . . . . . . . . . 1,535,543 39,509
Investor SharesIssued . . . . . . . . . . . . . . . . . . . . . . . . . . . . . . . . . . . . . 498,084 2,057,330Reinvested . . . . . . . . . . . . . . . . . . . . . . . . . . . . . . . . . 25,922 891Redeemed . . . . . . . . . . . . . . . . . . . . . . . . . . . . . . . . . (378,302) (179,011)
Net Share Transactions . . . . . . . . . . . . . . . . . . . . . . . . . . . . . 145,704 1,879,210
28
THE ADVISORS’ INNER CIRCLE FUND III NORTHPOINTE FUNDSOCTOBER 31, 2016
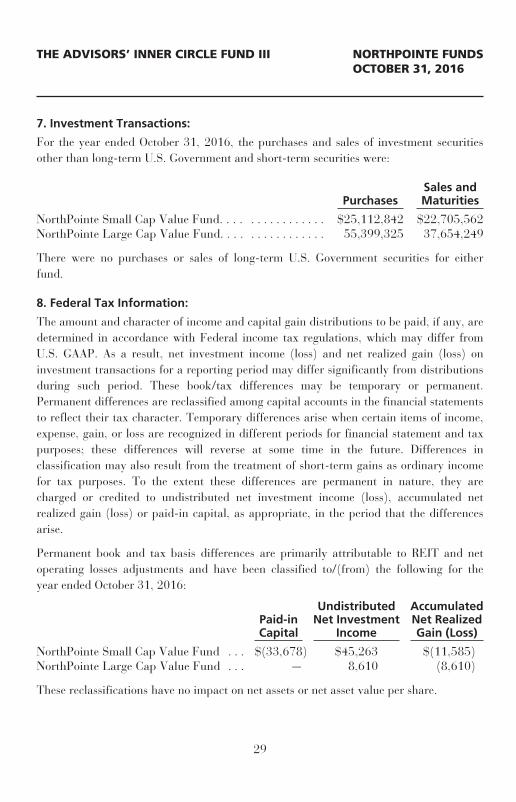
7. Investment Transactions:
For the year ended October 31, 2016, the purchases and sales of investment securitiesother than long-term U.S. Government and short-term securities were:
PurchasesSales andMaturities
NorthPointe Small Cap Value Fund. . . . . . . . . . . . . . . . $25,112,842 $22,705,562NorthPointe Large Cap Value Fund. . . . . . . . . . . . . . . . 55,399,325 37,654,249
There were no purchases or sales of long-term U.S. Government securities for eitherfund.
8. Federal Tax Information:
The amount and character of income and capital gain distributions to be paid, if any, aredetermined in accordance with Federal income tax regulations, which may differ fromU.S. GAAP. As a result, net investment income (loss) and net realized gain (loss) oninvestment transactions for a reporting period may differ significantly from distributionsduring such period. These book/tax differences may be temporary or permanent.Permanent differences are reclassified among capital accounts in the financial statementsto reflect their tax character. Temporary differences arise when certain items of income,expense, gain, or loss are recognized in different periods for financial statement and taxpurposes; these differences will reverse at some time in the future. Differences inclassification may also result from the treatment of short-term gains as ordinary incomefor tax purposes. To the extent these differences are permanent in nature, they arecharged or credited to undistributed net investment income (loss), accumulated netrealized gain (loss) or paid-in capital, as appropriate, in the period that the differencesarise.
Permanent book and tax basis differences are primarily attributable to REIT and netoperating losses adjustments and have been classified to/(from) the following for theyear ended October 31, 2016:
Paid-inCapital
UndistributedNet Investment
Income
AccumulatedNet RealizedGain (Loss)
NorthPointe Small Cap Value Fund . . . $(33,678) $45,263 $(11,585)NorthPointe Large Cap Value Fund . . . — 8,610 (8,610)
These reclassifications have no impact on net assets or net asset value per share.
29
THE ADVISORS’ INNER CIRCLE FUND III NORTHPOINTE FUNDSOCTOBER 31, 2016
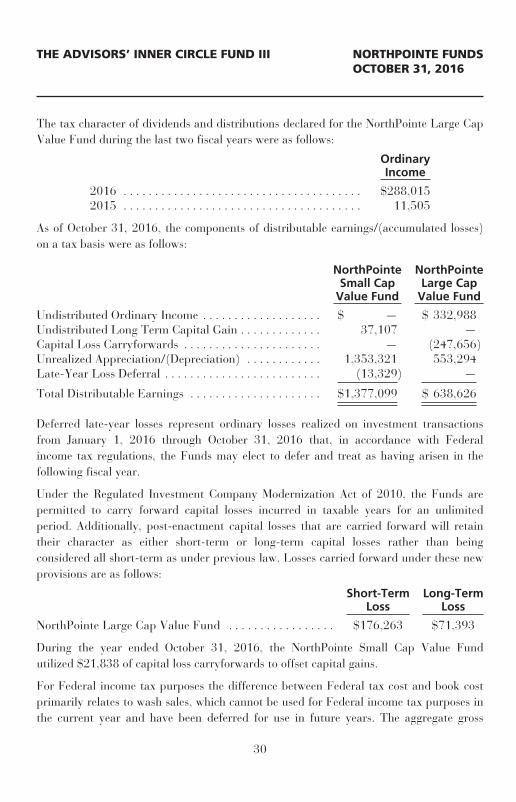
The tax character of dividends and distributions declared for the NorthPointe Large CapValue Fund during the last two fiscal years were as follows:
OrdinaryIncome
2016 . . . . . . . . . . . . . . . . . . . . . . . . . . . . . . . . . . . . . . $288,0152015 . . . . . . . . . . . . . . . . . . . . . . . . . . . . . . . . . . . . . . 11,505
As of October 31, 2016, the components of distributable earnings/(accumulated losses)on a tax basis were as follows:
NorthPointeSmall Cap
Value Fund
NorthPointeLarge Cap
Value Fund
Undistributed Ordinary Income . . . . . . . . . . . . . . . . . . . $ — $ 332,988Undistributed Long Term Capital Gain . . . . . . . . . . . . . 37,107 —Capital Loss Carryforwards . . . . . . . . . . . . . . . . . . . . . . — (247,656)Unrealized Appreciation/(Depreciation) . . . . . . . . . . . . 1,353,321 553,294Late-Year Loss Deferral . . . . . . . . . . . . . . . . . . . . . . . . . (13,329) —
Total Distributable Earnings . . . . . . . . . . . . . . . . . . . . . $1,377,099 $ 638,626
Deferred late-year losses represent ordinary losses realized on investment transactionsfrom January 1, 2016 through October 31, 2016 that, in accordance with Federalincome tax regulations, the Funds may elect to defer and treat as having arisen in thefollowing fiscal year.
Under the Regulated Investment Company Modernization Act of 2010, the Funds arepermitted to carry forward capital losses incurred in taxable years for an unlimitedperiod. Additionally, post-enactment capital losses that are carried forward will retaintheir character as either short-term or long-term capital losses rather than beingconsidered all short-term as under previous law. Losses carried forward under these newprovisions are as follows:
Short-TermLoss
Long-TermLoss
NorthPointe Large Cap Value Fund . . . . . . . . . . . . . . . . . $176,263 $71,393
During the year ended October 31, 2016, the NorthPointe Small Cap Value Fundutilized $21,838 of capital loss carryforwards to offset capital gains.
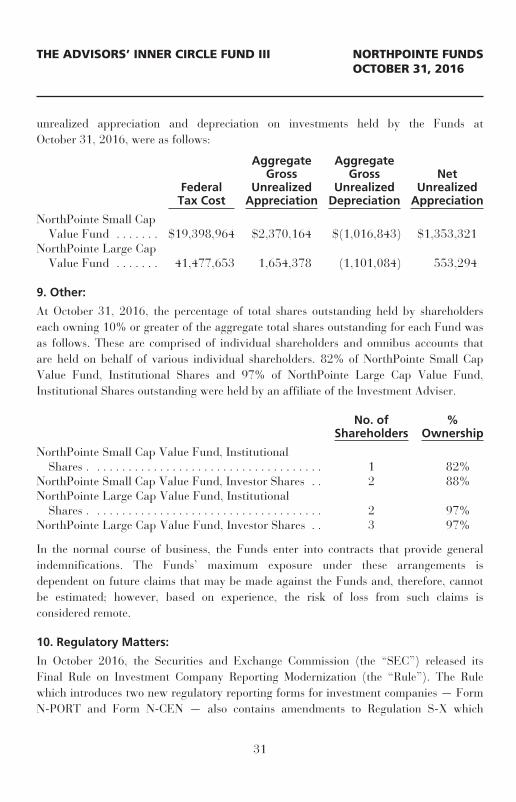
For Federal income tax purposes the difference between Federal tax cost and book costprimarily relates to wash sales, which cannot be used for Federal income tax purposes inthe current year and have been deferred for use in future years. The aggregate gross
30
THE ADVISORS’ INNER CIRCLE FUND III NORTHPOINTE FUNDSOCTOBER 31, 2016
unrealized appreciation and depreciation on investments held by the Funds atOctober 31, 2016, were as follows:
FederalTax Cost
AggregateGross
UnrealizedAppreciation
AggregateGross
UnrealizedDepreciation
NetUnrealized
Appreciation
NorthPointe Small CapValue Fund . . . . . . . $19,398,964 $2,370,164 $(1,016,843) $1,353,321
NorthPointe Large CapValue Fund . . . . . . . 41,477,653 1,654,378 (1,101,084) 553,294
9. Other:
At October 31, 2016, the percentage of total shares outstanding held by shareholderseach owning 10% or greater of the aggregate total shares outstanding for each Fund wasas follows. These are comprised of individual shareholders and omnibus accounts thatare held on behalf of various individual shareholders. 82% of NorthPointe Small CapValue Fund, Institutional Shares and 97% of NorthPointe Large Cap Value Fund,Institutional Shares outstanding were held by an affiliate of the Investment Adviser.
No. ofShareholders
%Ownership
NorthPointe Small Cap Value Fund, InstitutionalShares . . . . . . . . . . . . . . . . . . . . . . . . . . . . . . . . . . . . . 1 82%
NorthPointe Small Cap Value Fund, Investor Shares . . 2 88%NorthPointe Large Cap Value Fund, Institutional
Shares . . . . . . . . . . . . . . . . . . . . . . . . . . . . . . . . . . . . . 2 97%NorthPointe Large Cap Value Fund, Investor Shares . . 3 97%
In the normal course of business, the Funds enter into contracts that provide generalindemnifications. The Funds’ maximum exposure under these arrangements isdependent on future claims that may be made against the Funds and, therefore, cannotbe estimated; however, based on experience, the risk of loss from such claims isconsidered remote.
10. Regulatory Matters:
In October 2016, the Securities and Exchange Commission (the “SEC”) released itsFinal Rule on Investment Company Reporting Modernization (the “Rule”). The Rulewhich introduces two new regulatory reporting forms for investment companies — FormN-PORT and Form N-CEN — also contains amendments to Regulation S-X which
31

THE ADVISORS’ INNER CIRCLE FUND III NORTHPOINTE FUNDSOCTOBER 31, 2016
impact financial statement presentation, particularly the presentation of derivativeinvestments. Although still evaluating the impact of the Rule, management believes thatmany of the Regulation S-X amendments are consistent with the Funds’ currentfinancial statement presentation and expects that the Funds will be able to comply withthe Rule’s Regulation S-X amendments by the August 1, 2017 compliance date.
11. Subsequent Events:
The Funds have evaluated the need for additional disclosures and/or adjustmentsresulting from subsequent events through the date the financial statements were issued.Based on this evaluation, no additional disclosures and/or adjustments were required tothe financial statements.
32
THE ADVISORS’ INNER CIRCLE FUND III NORTHPOINTE FUNDSOCTOBER 31, 2016
REPORT OF INDEPENDENT REGISTERED PUBLIC ACCOUNTING FIRM
To the Board of Trustees ofThe Advisors’ Inner Circle Fund III and the Shareholders ofNorthPointe Small Cap Value Fund andNorthPointe Large Cap Value Fund:
In our opinion, the accompanying statements of assets and liabilities, including theschedules of investments, and the related statements of operations and of changes in netassets and the financial highlights present fairly, in all material respects, the financialposition of NorthPointe Small Cap Value Fund and NorthPointe Large Cap Value Fund(two of the funds constituting The Advisors’ Inner Circle Fund III, hereafter referred toas the “Funds”) at October 31, 2016, the results of each of their operations for the yearthen ended, the changes in each of their net assets for each of the two years in the periodthen ended and the financial highlights for each of the periods indicated, in conformitywith accounting principles generally accepted in the United States of America. Thesefinancial statements and financial highlights (hereafter referred to as “financialstatements”) are the responsibility of the Funds’ management. Our responsibility is toexpress an opinion on these financial statements based on our audits. We conducted ouraudits of these financial statements in accordance with the standards of the PublicCompany Accounting Oversight Board (United States). Those standards require that weplan and perform the audit to obtain reasonable assurance about whether the financialstatements are free of material misstatement. An audit includes examining, on a testbasis, evidence supporting the amounts and disclosures in the financial statements,assessing the accounting principles used and significant estimates made by management,and evaluating the overall financial statement presentation. We believe that our audits,which included confirmation of securities as of October 31, 2016 by correspondence withthe custodian and brokers, provide a reasonable basis for our opinion.
PricewaterhouseCoopers LLP
Philadelphia, PennsylvaniaDecember 22, 2016
33
THE ADVISORS’ INNER CIRCLE FUND III NORTHPOINTE FUNDSOCTOBER 31, 2016
DISCLOSURE OF FUND EXPENSES (Unaudited)
All mutual funds have operating expenses. As a shareholder of a mutual fund, yourinvestment is affected by these ongoing costs, which include (among others) costs forportfolio management, administrative services, and shareholder reports like this one. It isimportant for you to understand the impact of these costs on your investment returns.
Operating expenses such as these are deducted from a mutual fund’s gross income anddirectly reduce your investment return. These expenses are expressed as a percentage ofa mutual fund’s average net assets; this percentage is known as a mutual fund’s expenseratio.
The following examples use the expense ratio and are intended to help you understandthe ongoing costs (in dollars) of investing in your Fund and to compare these costs withthose of other mutual funds. The examples are based on an investment of $1,000 madeat the beginning of the period shown and held for the entire period (May 1, 2016 toOctober 31, 2016).
The table on the next page illustrates your Fund’s costs in two ways:
• Actual Fund Return. This section helps you to estimate the actual expenses after feewaivers that your Fund incurred over the six month period. The “Expenses Paid DuringPeriod” column shows the actual dollar expense cost incurred by a $1,000 investment inthe Fund, and the “Ending Account Value” number is derived from deducting thatexpense cost from the Fund’s gross investment return.
You can use this information, together with the actual amount you invested in the Fund,to estimate the expenses you paid over that six month period. Simply divide your endingstarting account value by $1,000 to arrive at a ratio (for example, an $8,600 accountvalue divided by $1,000 = 8.6), then multiply that ratio by the number shown for yourFund under “Expenses Paid During Period.”
• Hypothetical 5% Return. This section helps you compare your Fund’s costs withthose of other mutual funds. It assumes that the Fund had an annual 5% return beforeexpenses during the period, but that the expense ratio (Column 3) for the period isunchanged. This example is useful in making comparisons because the Securities andExchange Commission requires all mutual funds to make this 5% calculation. You canassess your Fund’s comparative cost by comparing the hypothetical result for your Fundin the “Expenses Paid During Period” column with those that appear in the same chartsin the shareholder reports for other mutual funds.
34
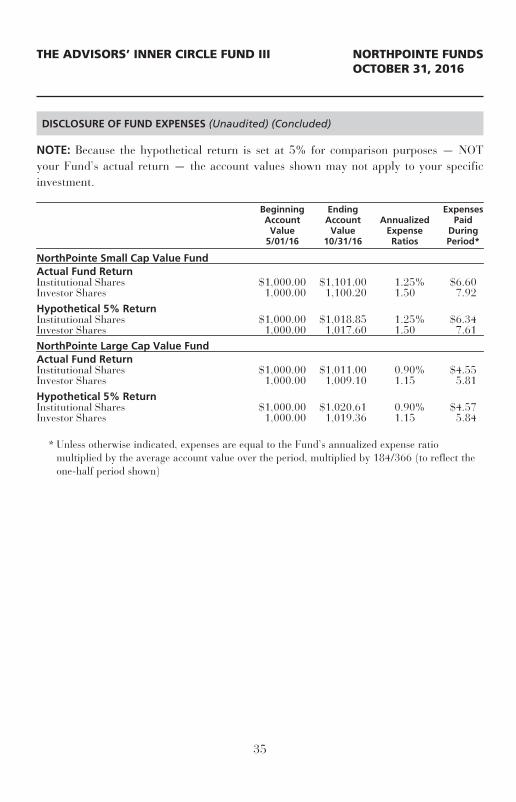
THE ADVISORS’ INNER CIRCLE FUND III NORTHPOINTE FUNDSOCTOBER 31, 2016
DISCLOSURE OF FUND EXPENSES (Unaudited) (Concluded)
NOTE: Because the hypothetical return is set at 5% for comparison purposes — NOTyour Fund’s actual return — the account values shown may not apply to your specificinvestment.
BeginningAccount
Value5/01/16
EndingAccount
Value10/31/16
AnnualizedExpenseRatios
ExpensesPaid
DuringPeriod*
NorthPointe Small Cap Value FundActual Fund ReturnInstitutional Shares $1,000.00 $1,101.00 1.25% $6.60Investor Shares 1,000.00 1,100.20 1.50 7.92Hypothetical 5% ReturnInstitutional Shares $1,000.00 $1,018.85 1.25% $6.34Investor Shares 1,000.00 1,017.60 1.50 7.61NorthPointe Large Cap Value FundActual Fund ReturnInstitutional Shares $1,000.00 $1,011.00 0.90% $4.55Investor Shares 1,000.00 1,009.10 1.15 5.81Hypothetical 5% ReturnInstitutional Shares $1,000.00 $1,020.61 0.90% $4.57Investor Shares 1,000.00 1,019.36 1.15 5.84
* Unless otherwise indicated, expenses are equal to the Fund’s annualized expense ratiomultiplied by the average account value over the period, multiplied by 184/366 (to reflect theone-half period shown)
35
THE ADVISORS’ INNER CIRCLE FUND III NORTHPOINTE FUNDSOCTOBER 31, 2016
TRUSTEES AND OFFICERS OF THE ADVISORS’ INNER CIRCLE FUND III (Unaudited)
Set forth below are the names, years of birth, positions with the Trust, length of term ofoffice, and the principal occupations for the last five years of each of the personscurrently serving as Trustees and Officers of the Trust. Unless otherwise noted, thebusiness address of each Trustee is SEI Investments Company, 1 Freedom Valley Drive,Oaks Pennsylvania 19456. Trustees who are deemed not to be “interested persons” ofthe Trust are referred to as “Independent Trustees.” Messrs. Nesher and Doran are
Name andYear of Birth
Position withTrust andLength of
Time Served1Principal Occupationsin the Past Five Years
INTERESTED TRUSTEES2 3
WILLIAM M. DORAN(Born: 1940)
Chairman of theBoard of Trustees
(since 2014)
Self-Employed Consultant since 2003. Partner atMorgan, Lewis & Bockius LLP (law firm) from1976 to 2003, counsel to the Trust, SEIInvestments, SIMC, the Administrator and theDistributor.
INDEPENDENT TRUSTEES3
JON C. HUNT(Born: 1951)
Trustee(Since 2014)
Retired since 2013. Consultant to Management,Convergent Capital Management, LLC (“CCM”)from 2012 to 2013. Managing Director and ChiefOperating Officer, CCM from 1998 to 2012.
THOMAS P. LEMKE(Born: 1954)
Trustee(Since 2014)
Retired since 2013. Executive Vice President andGeneral Counsel, Legg Mason, Inc. from 2005 to2013.
JAY C. NADEL(Born: 1958)
Trustee(since 2016)
Self-Employed Consultant since 2004.
RANDALL S. YANKER(Born: 1960)
Trustee(since 2014)
Co-Founder and Senior Partner, AlternativeAsset Managers, L.P. since 2004.
1 Each Trustee shall hold office during the lifetime of this Trust until the election and qualification of his or hersuccessor, or until he or she sooner dies, resigns, or is removed in accordance with the Trust’s Declaration ofTrust.
2 Denotes Trustees who may be deemed to be “interested” persons of the Fund as that term is defined in the 1940Act by virtue of their affiliation with the Distributor and/or its affiliates.
3 Trustees oversee 14 funds in The Advisors’ Inner Circle Fund III.
36
THE ADVISORS’ INNER CIRCLE FUND III NORTHPOINTE FUNDSOCTOBER 31, 2016
Trustees who may be deemed to be “interested” persons of the Trust as that term isdefined in the 1940 Act by virtue of their affiliation with the Trust’s Distributor. TheTrust’s Statement of Additional Information (“SAI”) includes additional informationabout the Trustees and Officers. The SAI may be obtained without charge by calling1-844-457-NPF3 (6733). The following chart lists Trustees and Officers as ofOctober 31, 2016.
Other DirectorshipsHeld in the Past Five Years4
Current Directorships: Trustee of The Advisors’ Inner Circle Fund, The Advisors’ Inner Circle FundII, Bishop Street Funds, The KP Funds, Winton Series Trust, Winton Diversified OpportunitiesFund (closed-end investment company), Gallery Trust, SEI Daily Income Trust, SEI InstitutionalInternational Trust, SEI Institutional Investments Trust, SEI Institutional Managed Trust, SEI AssetAllocation Trust, SEI Tax Exempt Trust, Adviser Managed Trust, New Covenant Funds, SEIInsurance Products Trust and SEI Catholic Values Trust. Director of SEI Investments (Europe),Limited, SEI Investments — Global Funds Services, Limited, SEI Investments Global, Limited, SEIInvestments (Asia), Limited, SEI Global Nominee Ltd., SEI Investments — Unit Trust Management(UK) Limited and SEI Investments Co. Director of the Distributor since 2003.Former Directorships: Director of SEI Alpha Strategy Portfolios, LP to 2013. Trustee of O’ConnorEQUUS (closed-end investment company) to 2016. Trustee of SEI Liquid Asset Trust to 2016.
Current Directorships: Trustee of City National Rochdale Funds, Winton Series Trust, WintonDiversified Opportunities Fund (closed-end investment company) and Gallery Trust. Member ofIndependent Committee of Nuveen Commodities Asset Management.Former Directorship: Trustee of O’Connor EQUUS (closed-end investment company) to 2016.
Current Directorships: Trustee of AXA Premier VIP Trust, Winton Series Trust, Winton DiversifiedOpportunities Fund (closed-end investment company), Gallery Trust and JP Morgan Active ETFs.Former Directorships: Trustee of Munder Funds to 2014. Trustee of Victory Funds to 2015.Trustee of O’Connor EQUUS (closed-end investment company) to 2016.Current Directorships: Trustee of City National Rochdale Funds, Winton Series Trust, WintonDiversified Opportunities Trust (closed-end investment company) and Gallery Trust. Director ofLapolla Industries, Inc.Former Directorships: Trustee of Rochdale Investment Trust to 2013.Current Directorships: Trustee of Winton Series Trust, Winton Diversified Opportunities Fund(closed-end investment company) and Gallery Trust. Independent Non-Executive Director of HFAHoldings Limited.Former Directorship: Trustee of O’Connor EQUUS (closed-end investment company) to 2016.4 Directorships of Companies required to report to the Securities and Exchange Commission under the Securities
Exchange Act of 1934 (i.e., “public companies”) or other investment companies under the 1940 Act.
37
THE ADVISORS’ INNER CIRCLE FUND III NORTHPOINTE FUNDSOCTOBER 31, 2016
TRUSTEES AND OFFICERS OF THE ADVISORS’ INNER CIRCLE FUND III (Unaudited)
Name andYear of Birth
Position withTrust andLength of
Time ServedPrincipal Occupationsin the Past Five Years
OFFICERS
MICHAEL BEATTIE(Born: 1965)
President(Since 2014)
Director of Client Service, SEI InvestmentsCompany, since 2004.
ROBERT A. NESHER(Born: 1946)
Vice Chairman(Since 2014)
SEI employee 1974 to present; currently performsvarious services on behalf of SEI Investments forwhich Mr. Nesher is compensated.
STEPHEN CONNORS(Born: 1984)
Treasurer,Controller and Chief
Financial Officer(since 2015)
Director, SEI Investments, Fund Accounting sinceDecember 2014. Audit Manager, Deloitte &Touche LLP, from 2011 to 2014. AuditSupervisor, BBD, LLP (formerly Briggs, Bunting &Dougherty, LLP), from 2007 to 2011.
DIANNE M.DESCOTEAUX(Born: 1977)
Vice President andSecretary
(since 2014)
Counsel at SEI Investments since 2010. Associateat Morgan, Lewis, & Bockius LLP from 2006 to2010.
38
THE ADVISORS’ INNER CIRCLE FUND III NORTHPOINTE FUNDSOCTOBER 31, 2016
Other DirectorshipsHeld in the Past Five Years
None.
None.
None.
None.
39
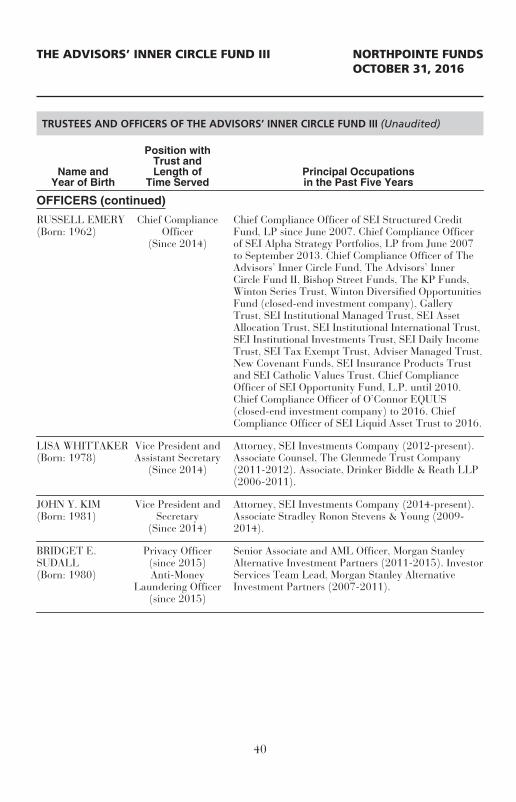
THE ADVISORS’ INNER CIRCLE FUND III NORTHPOINTE FUNDSOCTOBER 31, 2016
TRUSTEES AND OFFICERS OF THE ADVISORS’ INNER CIRCLE FUND III (Unaudited)
Name andYear of Birth
Position withTrust andLength of
Time ServedPrincipal Occupationsin the Past Five Years
OFFICERS (continued)
RUSSELL EMERY(Born: 1962)
Chief ComplianceOfficer
(Since 2014)
Chief Compliance Officer of SEI Structured CreditFund, LP since June 2007. Chief Compliance Officerof SEI Alpha Strategy Portfolios, LP from June 2007to September 2013. Chief Compliance Officer of TheAdvisors’ Inner Circle Fund, The Advisors’ InnerCircle Fund II, Bishop Street Funds, The KP Funds,Winton Series Trust, Winton Diversified OpportunitiesFund (closed-end investment company), GalleryTrust, SEI Institutional Managed Trust, SEI AssetAllocation Trust, SEI Institutional International Trust,SEI Institutional Investments Trust, SEI Daily IncomeTrust, SEI Tax Exempt Trust, Adviser Managed Trust,New Covenant Funds, SEI Insurance Products Trustand SEI Catholic Values Trust. Chief ComplianceOfficer of SEI Opportunity Fund, L.P. until 2010.Chief Compliance Officer of O’Connor EQUUS(closed-end investment company) to 2016. ChiefCompliance Officer of SEI Liquid Asset Trust to 2016.
LISA WHITTAKER(Born: 1978)
Vice President andAssistant Secretary
(Since 2014)
Attorney, SEI Investments Company (2012-present).Associate Counsel, The Glenmede Trust Company(2011-2012). Associate, Drinker Biddle & Reath LLP(2006-2011).
JOHN Y. KIM(Born: 1981)
Vice President andSecretary
(Since 2014)
Attorney, SEI Investments Company (2014-present).Associate Stradley Ronon Stevens & Young (2009-2014).
BRIDGET E.SUDALL(Born: 1980)
Privacy Officer(since 2015)Anti-Money
Laundering Officer(since 2015)
Senior Associate and AML Officer, Morgan StanleyAlternative Investment Partners (2011-2015). InvestorServices Team Lead, Morgan Stanley AlternativeInvestment Partners (2007-2011).
40
THE ADVISORS’ INNER CIRCLE FUND III NORTHPOINTE FUNDSOCTOBER 31, 2016
Other DirectorshipsHeld in the Past Five Years
None.
None.
None.
None.
41
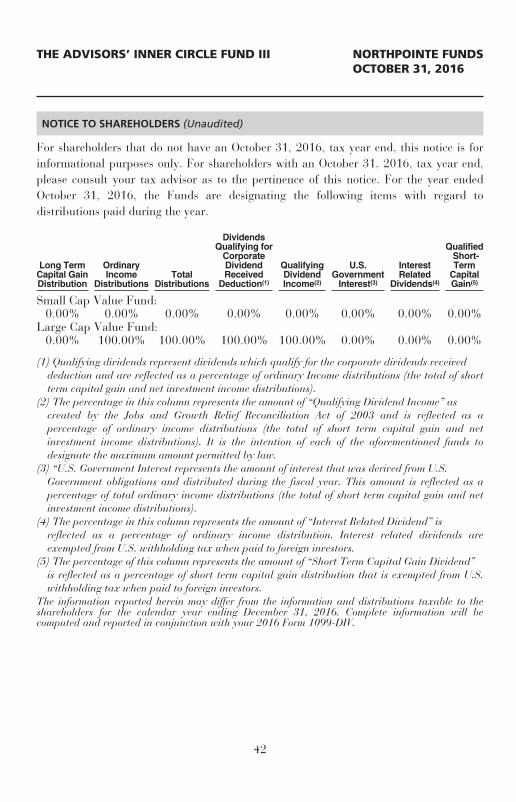
THE ADVISORS’ INNER CIRCLE FUND III NORTHPOINTE FUNDSOCTOBER 31, 2016
NOTICE TO SHAREHOLDERS (Unaudited)
For shareholders that do not have an October 31, 2016, tax year end, this notice is forinformational purposes only. For shareholders with an October 31, 2016, tax year end,please consult your tax advisor as to the pertinence of this notice. For the year endedOctober 31, 2016, the Funds are designating the following items with regard todistributions paid during the year.
Long TermCapital GainDistribution
OrdinaryIncome
DistributionsTotal
Distributions
DividendsQualifying for
CorporateDividendReceived
Deduction(1)
QualifyingDividendIncome(2)
U.S.Government
Interest(3)
InterestRelated
Dividends(4)
QualifiedShort-Term
CapitalGain(5)
Small Cap Value Fund:0.00% 0.00% 0.00% 0.00% 0.00% 0.00% 0.00% 0.00%
Large Cap Value Fund:0.00% 100.00% 100.00% 100.00% 100.00% 0.00% 0.00% 0.00%
(1) Qualifying dividends represent dividends which qualify for the corporate dividends receiveddeduction and are reflected as a percentage of ordinary Income distributions (the total of shortterm capital gain and net investment income distributions).
(2) The percentage in this column represents the amount of “Qualifying Dividend Income” ascreated by the Jobs and Growth Relief Reconciliation Act of 2003 and is reflected as apercentage of ordinary income distributions (the total of short term capital gain and netinvestment income distributions). It is the intention of each of the aforementioned funds todesignate the maximum amount permitted by law.
(3) “U.S. Government Interest represents the amount of interest that was derived from U.S.Government obligations and distributed during the fiscal year. This amount is reflected as apercentage of total ordinary income distributions (the total of short term capital gain and netinvestment income distributions).
(4) The percentage in this column represents the amount of “Interest Related Dividend” isreflected as a percentage of ordinary income distribution. Interest related dividends areexempted from U.S. withholding tax when paid to foreign investors.
(5) The percentage of this column represents the amount of “Short Term Capital Gain Dividend”is reflected as a percentage of short term capital gain distribution that is exempted from U.S.withholding tax when paid to foreign investors.
The information reported herein may differ from the information and distributions taxable to theshareholders for the calendar year ending December 31, 2016. Complete information will becomputed and reported in conjunction with your 2016 Form 1099-DIV.
42

NOTES

NOTES

NOTES
NorthPointe FundsP.O. Box 219009
Kansas City, MO 64121-90091-877-457-NPF3 (6733)
Adviser:NorthPointe Capital, LLC
39400 Woodward Ave, Suite 190,Bloomfield Hills, MI 48304
Distributor:SEI Investments Distribution Co.
One Freedom Valley DriveOaks, PA 19456
Administrator:SEI Investments Global Funds Services
One Freedom Valley DriveOaks, PA 19456
Legal Counsel:Morgan, Lewis & Bockius LLP
1701 Market StreetPhiladelphia, PA 19103
This information must be preceded or accompanied by a currentprospectus for the Funds described.
NPC-AR-001-0300