The Activated Carbon from Walnut Shell Using CO2 and ...
13
Dicle University Journal of Engineering Dicle University Journal of Engineering Volume 12 Issue 2 Article 12 2021 The Activated Carbon from Walnut Shell Using CO2 and The Activated Carbon from Walnut Shell Using CO2 and Methylene Blue Removal Methylene Blue Removal İlhan Kucuk Inonu University, [email protected] Yunus Onal Inonu University, [email protected] Canan AKMİL BASAR Inonu University, [email protected] Follow this and additional works at: https://duje.dicle.edu.tr/journal Part of the Engineering Commons Recommended Citation Recommended Citation Kucuk, İlhan; Onal, Yunus; and AKMİL BASAR, Canan (2021) "The Activated Carbon from Walnut Shell Using CO2 and Methylene Blue Removal," Dicle University Journal of Engineering: Vol. 12 : Iss. 2 , Article 12. Available at: https://duje.dicle.edu.tr/journal/vol12/iss2/12 This Research Article is brought to you for free and open access by Dicle University Journal of Engineering. It has been accepted for inclusion in Dicle University Journal of Engineering by an authorized editor of Dicle University Journal of Engineering.
Transcript of The Activated Carbon from Walnut Shell Using CO2 and ...

Dicle University Journal of Engineering Dicle University Journal of Engineering
Volume 12 Issue 2 Article 12
2021
The Activated Carbon from Walnut Shell Using CO2 and The Activated Carbon from Walnut Shell Using CO2 and
Methylene Blue Removal Methylene Blue Removal
İlhan Kucuk Inonu University, [email protected]
Yunus Onal Inonu University, [email protected]
Canan AKMİL BASAR Inonu University, [email protected]
Follow this and additional works at: https://duje.dicle.edu.tr/journal
Part of the Engineering Commons
Recommended Citation Recommended Citation Kucuk, İlhan; Onal, Yunus; and AKMİL BASAR, Canan (2021) "The Activated Carbon from Walnut Shell Using CO2 and Methylene Blue Removal," Dicle University Journal of Engineering: Vol. 12 : Iss. 2 , Article 12. Available at: https://duje.dicle.edu.tr/journal/vol12/iss2/12
This Research Article is brought to you for free and open access by Dicle University Journal of Engineering. It has been accepted for inclusion in Dicle University Journal of Engineering by an authorized editor of Dicle University Journal of Engineering.

DUJE (Dicle University Journal of Engineering) 12:2 (2021) Page 297-308
1
The Activated Carbon from Walnut Shell Using CO2 and Methylene Blue Removal
İlhan KÜÇÜK1,Yunus ÖNAL2, Canan AKMİL BAŞAR2
1 Department of Chemistry, Faculty of Art and Science, Inonu University, 44280 Malatya, Turkey, [email protected] orcid.org/0000-0003-
2876-3942 2Department of Chemical Engineering, Faculty of Engineering, Inonu University, 44280 Malatya, Turkey, [email protected],
orcid.org/0000-0001-6342-6818
3 Department of Chemical Engineering, Faculty of Engineering, Inonu University, 44280 Malatya, Turkey,
[email protected],orcid.org/0000-0003-3574-0773
Research Article
ARTICLE INFO
Article history:
Received 27 October 2020
Received in revised form 28
December 2020
Accepted 28 December 2020
Available online 30 March 2021
Keywords:
Biomass, Carbonization, Physical
activation, Activated carbon.
ABSTRACT
In this study, activated carbon with strong adsorption property was synthesized from lignocellulosic structured walnut shell. Active carbon synthesis was realized in two stages: carbonization and physical
activation. Carbonization was carried out at eight different temperatures (300-1000°C), 500 mL/min N2
gas flow and 10°C/min heating rate for 1 hour. Activation was done at two different temperatures (800- 900 °C) at 100 ml/min CO2 gas flow for 1 hour. Characterization of activated carbons was carried out and
their adsorption capacities were examined with methylene blue. The surface areas of the activated carbons
were investigated by BET analysis and the surface areas ranged from 56,79 to 652,22 m2/g. Amounts of micro and mesoporous in these surface areas were calculated. Besides, SEM analysis indicates the porous
structure and XRD analysis confirms that the structure is amorphous. Methylene blue adsorption was
performed in the aqueous phase and the capacities of the activated carbons were calculated. The methylene blue adsorption capacity of activated carbons varies between 15,96 -174,81 mg/g.
Doi: 10.24012/dumf.816317
* Corresponding author
Yunus ÖNAL
e-mail: [email protected]
Please cite this article in press as İ. Küçük, Y. Önal, C. Akmil Başar, “The Activated Carbon from Walnut Shell Using CO2 and Methylene Blue Removal”, DUJE, vol.
12, Iss.2, 297-308, March 2021.
DUJE (Dicle University Journal of Engineering) 12:2 (2021) Page 297-308
298
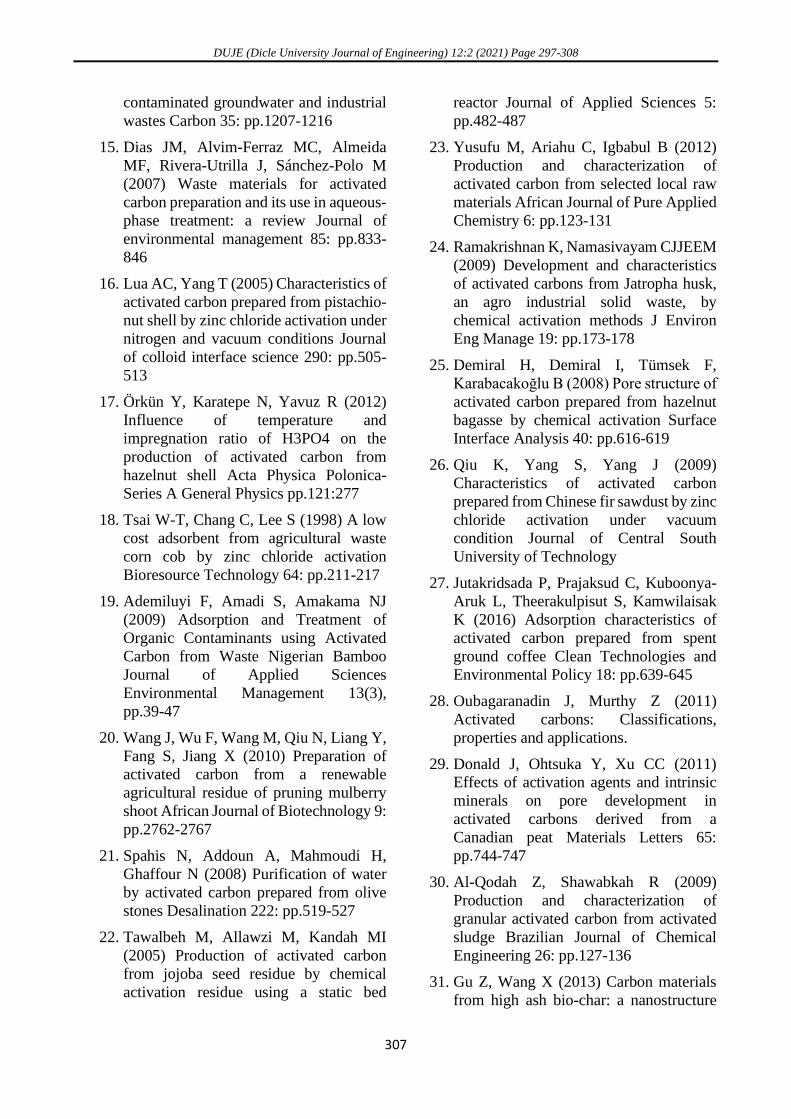
Introduction
Activated carbons are one of the most widely
used adsorbents due to their high surface areas
and pores [1]. Even if it has many applications
such as energy storage [2], purification [3], water
treatment [4], pharmaceutical [5], chemical and
petroleum industries [6], separation, catalysis [7],
nuclear power stations [8], electrodes for electric
double-layer capacitors [9], batteries, fuel cells
[10], hydrometallurgy [11], it is preferable in
adsorption because it is cheaper than other
adsorbents and thanks to the diversity in raw
material usage, the importance of activated
carbon are increasing every year [12].
One of the most important applications of active
carbons is the adsorption of liquid-phase organic
and inorganic compounds [13]. In addition, the
use of activated carbon in the purification of
polluted waters and groundwater is increasing
[14]. Activated carbons are used in pre-treatments
of purification processes or advanced
purification. Adsorption in liquid phase
applications results from the interaction of
adsorbed material and activated carbon. An
electrostatic interaction with activated carbon
occurs when the adsorbed substance is an
electrolyte. The push and pull forces in these
electrostatic interactions vary with the electron
charge on the surface of the activated carbon, the
chemical structure of the substance to be
adsorbed, and the ion charge in the solution. In
non-electrolyte fluids, these interactions occur via
Van der Waals interactions, hydrophobic,
hydrophilic interactions and hydrogen bonds
[15].
Activated carbon synthesis was generally
synthesized from coal, lignite, wood and animal
bones in ancient times. Nowadays, these products
are not preferable because they are expensive and
not renewable. These products have been
replaced by agricultural products and their
wastes. Some of these wastes are pistachio-nut
[16], hazelnut shell [17], corn cob [18], bamboo
[19], pruning mulberry shoot [20], olive stone
[21], Jojoba seed [22], coconut shell [23],
Jatropha husk [24], hazelnut bagasse [25],
Chinese fir sawdust [26] and many others. When
activated carbon synthesis is made from these
products, the yield is lower than that produced
from coal and lignite. This is because the amount
of carbon in these products is less than others.
The synthesis of activated carbon is generally
carried out in two ways: carbonization and
activation. Activation is usually realized in two
different ways: physical and chemical activation
[27]. However, physicochemical activation has
also emerged in recent years [28]. Chemical
activation can be done by mixing the sample with
the chemical substance after carbonization or by
placing the chemical substance on the raw
sample. In case chemical substance is placed on
raw sample, activated carbon synthesis is
performed in one step by passing carbonization
step. In both cases, the atmosphere is made inertly
with N2 gas. Chemicals commonly used in
chemical activation are ZnCl2, H3PO4 [29],
H2SO4, K2S, KCNS [25], HNO3, H2O2, KMnO4,
(NH4)2S2O8 [30], NaOH, KOH [31], and K2CO3
[32]. In physical activation, the sample is
carbonized in an inert atmosphere (with N2 gas).
After carbonization, the sample which is
subjected to physical activation is usually
exposed to CO2, water vapor, CO2-water vapor
mixture or CO2-air mixture and the activation
process is completed.
In physicochemical activation, activated carbon
synthesis is made by placing a chemical agent
either on the raw sample or on the carbonized
material and placed in the gas atmosphere used in
physical activation. It is a kind of mixture of
chemical and physical activation [28]. Activated
carbons expand the surface areas thanks to the
pores on their surfaces. These pores are generally
defined in three different ways: Micropores
(<2nm), mesopores (2< >50 nm) and macropores
(>50 nm) [12].
Biomasses with lignocellulosic structure are
suitable materials for active carbon synthesis.
Since these biomasses are both renewable and
cheap, they can be used continuously in the
synthesis of activated carbon [15]. Additionally,
since these materials are inexpensive to store,
biomasses are suitable for activated carbon
synthesis. Lignocellulosic structures consist of
three basic units: cellulose, hemicellulose, and
lignin. These units decompose with temperature
and form a porous structure [12].

DUJE (Dicle University Journal of Engineering) 12:2 (2021) Page 297-308
299
In this study, activated carbon synthesis was
performed in different conditions from walnut
shell and properties of these activated carbons
were investigated. The decrease in the amount of
methylene blue in the aqueous phase was
investigated by making use of adsorption which
is one of the most used fields.
Materials and Methods
Preparation of the Samples
The supplied walnut shell (Malatya, Hekimhan
region) was weighed approximately 325 g
without any pre-treatment and placed in a three-
zone oven.
Carbonization
Walnut shells were placed at Protherm PZF
12/50/700 model 3-zone furnace at eight different
temperatures (300, 400, 500, 600, 700, 800, 900,
1000 ° C) with 10 °C/min heating under 500
mL/min N2 gas flow for 60 min. The liquid yield
was calculated by means of the back cooler and
the collecting vessel attached to the furnace outlet
and the gas yield was calculated from the
difference.
Physical Activation
The carbonized materials were activated through
a 3-zone furnace model Protherm PZF 12/60/600.
CO2 was used during the activation process and
the gas flow was set to 100 mL/min. The process
was operated at two different temperatures (800,
900 ° C) and activated for 1 hour with a heating
rate of 10 ° C.
Preparation of Methylene Blue
The methylene blue was placed in a petri dish and
placed in a furnace at 105 °C for 1 day. 1 grams
of methylene blue was weighed with precision
scales, and 1000 ppm stock solution was
prepared.
Adsorption
100 mL methylene blue solution which is diluted
from 1000 ppm stock solution to 200 ppm, was
placed in 200 mL conical flasks and 0,1 grams of
activated carbon added to the flask under
magnetic stirring. The flasks were sealed and
mixed for 24 hours. After 24 hours, the samples
were filtered through syringe tip filters and
analyzed using UV-VIS analyzer at 660 nm.
Analysis
The surface area of activated carbon samples
determined on Micromeritics TriStar 3000, XRD
measurements were realized using Japanese
Rigaku Rad B-DMAX II (Cu K-alpha)
instrument, SEM measurements were carried out
using Leo EV040 scanning electron microscope
and element analyze were done with CHNS- 932
(LECO) Elemental Analyzer.
Results and Discussion
Biomasses transform into 3 different forms as
solid, liquid and gas when exposed to heat under
an inert atmosphere. Solid, liquid and gas
transformations of walnut shells with temperature
are shown in Figure 1. The percentages of solid,
liquid and gas form were calculated and plotted
from Figure 1. According to the graphic, the
amount of the solid product decreases with
increasing temperature while the amount of the
liquid and gas product generally increased. The
decrease in the solid product occurred rapidly up
to 600°C and after 600°C, this reduction almost
stopped. The highest solid yield was seen at
300°C as expected. Although there is no regular
increase in liquid and gas yields, there is generally
an increment. The highest liquid yield was
achieved at 900°C. Liquid yield decreases again
after 900°C. The gas yield is highest at 600°C
where the increment is not common overall.
There is a decrease after 600 °C.
Figure 1: Solid (char), liquid and gas yields of carbonized
samples.
0
10
20
30
40
50
60
300 500 700 900
Yie
lds
%
Temperature
Solid Liquid Gas

DUJE (Dicle University Journal of Engineering) 12:2 (2021) Page 297-308
300
Table 1: BET analysis of activated carbon
BET analysis of the synthesized activated carbons
is shown in Table 1. The highest surface area seen
in Table 1 is 652,22 m2/g. According to Table 1,
changes in carbonization temperature caused
changes in the surface area. Although the
elevation of the carbonization temperature causes
a partial increase in the surface area, there is a
decrease in the surface area after a certain
temperature [33]. The effect belongs mostly to the
activation conditions. It is seen that the surface
area increases with the increase of activation
temperature in samples obtained at the same
carbonization temperature. The increased
activation temperature increases the kinetic
energy of the gas used during activation, further
impacting the carbonized product, causing the
surface area of the activated carbon to widen [34].
These phenomena partly explains the increase in
the surface area. In addition, two types of pores
which are micro and mesopores were found in
activated carbon with the increased surface area.
Increased activation temperature leads to an
increase in the amount of micropore and
mesopore which is common in all samples.
Besides, it is seen that the percentage of
micropore decreases in all samples and the
percentage of mesopore increases with increasing
activation temperature. Increased temperature
positively affected mesopore formation of all
samples. Looking at the total volumes of the
Carbonization
Physical
Activation
Code
Temperature
(°C/ 500 mL/dk N2)
Temperature
(°C/100 mL
CO2)
SBET
m2/g
Smicro
%
Smeso
%
VT
cm3/g
Vmicro
cm3/g
Vmezo
cm3/g
dp
nm
AC1 300 800 369,24 97,12 2,88 - 0,188 - -
AC2 300 900 629,13 81,52 18,48 0,343 0,273 0,070 2,182
AC3 400 800 425,16 86,21 13,79 0,239 0,192 0,047 2,256
AC4 400 900 516,86 86,41 13,59 0,286 0,235 0,051 2,218
AC5 500 800 382,93 88,01 11,99 0,215 0,177 0,038 2,252
AC6 500 900 652,22 82,42 17,58 0,365 0,284 0,081 2,238
AC7 600 800 387,04 88,78 11,22 0,215 0,180 0,035 2,225
AC8 600 900 584,94 78,6 21,4 0,324 0,243 0,081 2,221
AC9 700 800 380,97 95,43 4,57 0,200 0,191 0,008 2,103
AC10 700 900 557,20 85,21 14,79 0,305 0,250 0,055 2,196
AC11 800 800 411,74 92,5 7,5 0,213 0,200 0,013 2,077
AC12 800 900 644,31 83,77 16,23 0,350 0,285 0,065 2,177
AC13 900 800 320,01 100 - - 0,173 - -
AC14 900 900 564,52 84,18 15,82 0,306 0,251 0,055 2,173
AC15 1000 800 56,79 100 - - 0,07 - -
AC16 1000 900 400,42 94,54 5,46 0,19 0,19 - 1,97

DUJE (Dicle University Journal of Engineering) 12:2 (2021) Page 297-308
301
synthesized activated carbons, it is possible to
observe the effect of the activation temperature.
There is an increase in the total volumes as a
result of the activation temperature increase. This
increment can be observed both in micro and
meso volumes. The average pore diameter is
about 2 nm in all samples.
N2 adsorption isotherm of different activated
carbons is given in Figure 2. According to the
classification of the IUPAC (International Union
of Pure and Applied Chemistry), all activated
carbons have type I hybrid shape isotherms. In
such isotherms, N2 adsorption rapidly increases at
low P/P0 pressures, then this rapidly increases
slow and remains constant. Such activated
carbons are generally activated carbons with the
low surface area, narrow pore diameters, and high
micropore content. Table 1 show that the amount
of micropore is high. The graph shows an
increase in the last sections, in the regions where
P/P0 is approaching 1, and it can be shown as a
proof that there is a small amount of mesopore in
this structure.
The pore distribution graphs of different activated
carbons were calculated by the BJH method and
given in Figure 3. As shown in this graph, pore
diameters are usually around 2 nm and the
amount of micropore is greater than the amount
of mesopore. These results confirm the BET
results in Table 1 and the N2 adsorption results in
Figure 2.
Another important method of analysis for
activated carbons is SEM images. SEM images of
some activated carbons are shown in Figure 4.
Porous structure formation can be seen in the
synthesized activated carbons as SEM images
shows.
Figure 2. Adsorption isotherms of N2. A. AC14.
B. AC12. C. AC8. D. AC6. E. AC2.
Figure3. Pore size distribution of activated carbon
sample. A. AC14. B. AC12. C. AC8. D. AC6. E.
AC2.
120
140
160
180
200
220
240
0 0.2 0.4 0.6 0.8 1
Vo
lum
e A
dso
rbed
(cm
3 /g)
Relative Pressure (P/P0)
A B C D E
0
50
100
150
200
1 2 3
Are
a (m
2 /g)
Pore Width (nm)
A B C D E

DUJE (Dicle University Journal of Engineering) 12:2 (2021) Page 297-308
302
Figure 4. A. SEM image of raw walnut shell. B. AC6. C. AC2. D. AC14. E. AC12. F. AC8.
F
B
C D
E
A

DUJE (Dicle University Journal of Engineering) 12:2 (2021) Page 297-308
303
Figure 5 shows the results of the XRD analysis of
activated carbons. The raw material used has a
less organized structure that does not show any
specific crystalline structure indication, probably
due to the various organic impurities and volatile
substances present in the structure. When XRD
results are considered, there is no crystal region
in the structure of activated carbon and the
structure is amorphous. In particular, the peak
observed at about 23° in raw material analysis
generally belongs to the cellulose peak seen in
cellulose-based materials. The FTIR spectrum
was used to determine the surface chemical
groups of the raw material and some activated
carbons and the results are given in Figure 6.
Characteristic lignocellulosic structure peaks can
be seen at the raw material spectrum. These
peaks, approximately 3500 cm-1 the peak OH is
caused by stress vibration and occurs in phenolic
or alcohol groups. These groups are generally
present in the structure of glycosidic chains Also,
the peak in the spectrum of approximately 2900
cm-1 C-H asymmetric and symmetrical vibration
peaks are caused by the methylene groups, such
as -CH2. The peak seen at about 1700 cm-1
originates from carbonyl groups (C = O) and
comes from ester, ketones and carboxylic acids.
The peak at about 1600 cm-1 belong to the C = C
bond vibration of alkenes. The peak at
approximately 1450 cm-1 is due to the stretching
vibrations of the ether groups in the stevioside
structure. The peak around 1260 cm-1 belongs to
the stretching vibration of ester groups. Finally,
the peak at about 1000 cm-1 is the vibrations
caused by C-OH and C-O-C bonds. When the
FTIR spectra of the activated carbons were
compared with the raw material, these peaks
either disappeared or decreased in intensity.
Table 2 shows the element analysis of all
activated carbons and element analysis of the raw
material. According to the analysis results, the
amount of carbon increases in all activated
carbons compared to raw materials. Besides,
there is a decrease in the amount of hydrogen and
an increase in the amount of nitrogen. No sulphur
was detected in activated carbons except for only
one sample.
Figure 5. XRD chart of samples A. AC14. B.
AC12. C. AC8. D. AC6. E. AC2. F. XRD chart of
walnut Shell
Figure 6. FTIR spectrum of raw material and
activated carbon samples A. AC14. B. AC12. C.
AC8. D. AC6. E. AC2. F. FTIR spectrum of raw
material
0 20 40 60 80
Inte
nsi
ty
2θ (theta)
ABCD
E
F
500150025003500
Tran
smit
tan
ce (
%T)
Wavenumber (cm-1)
AB
CD
F
E

DUJE (Dicle University Journal of Engineering) 12:2 (2021) Page 297-308
304
Table 2: Elemental analysis of activated carbon.
One of the important points during the adsorption
process is the length, width and thickness of the
molecule to be adsorbed. If the molecule to be
adsorbed is too large to pass through the pores of
the synthesized activated carbons, adsorption
does not occur or takes place very little.
Therefore, the adsorbent used in adsorption
studies is important.
The methylene blue molecule used in this study is
length, width and width of 1.43, 0.61 and 0.4 nm,
respectively. It is shown in Table 1 that the
average pore diameters of the synthesized active
carbons are greater than the methylene blue
molecule. Therefore, adsorption was realized.
In this study, the removal of impurities in aqueous
solutions, which is one of the application fields of
activated carbons, was carried out with methylene
blue, and the adsorption capacity of methylene
blue was determined. The methylene blue
adsorption capacities of the activated carbons are
shown in Table 3. Adsorption capacity increased
in increasing surface areas generally. The highest
surface area is 652 m2/g. However, the highest
adsorption capacity is seen for activated carbon
with a surface area of 644 m2 / g. The reason for
this is that this activated carbon has a higher
micropore pore area (83.77%) compared to the
other.
Carbonization Physical
Activation
Temperature
(°C/500 mL/dk N2)
Temperature
(°C/100 mL CO2) C H N S
Raw Material 48,74 5,664 0,149 -
300 800 64,80 1,170 0,237 -
300 900 43,12 0,611 - 0,094
400 800 88,21 1,232 0,220 -
400 900 70,03 0,874 0,204 -
500 800 86,48 1,324 0,245 -
500 900 84,19 1,120 - -
600 800 71,18 1,210 0,228 -
600 900 76,71 0,605 - -
700 800 53,84 1,031 0,156 -
700 900 67,89 0,935 0,213 -
800 800 73,77 0,983 0,287 -
800 900 72,13 1,261 0,182 -
900 800 65,91 0,884 0,345 -
900 900 54,00 0,988 0,164 -
1000 800 62,22 0,660 0,655 -
1000 900 72,35 0,779 0,339 -

DUJE (Dicle University Journal of Engineering) 12:2 (2021) Page 297-308
305
Table 3: Methylene blue adsorption capacity of
activated carbon.
Adsorption capacity was calculated according to
equation 1.
𝑞𝑒 =𝐶0 − C
wxV (Eq.1)
where C0 and C (mg L−1) are the initial and
equilibrium liquid phase concentrations of MB,
respectively, V (L) is the volume of the solution,
and W (g) is the mass of dry adsorbent used.
Conclusions
In this study, the changed parameters in the
experiments caused changes in the surface areas
of the activated carbons. The changing
carbonization and activation temperatures caused
a change in the type and amount of pores formed
in the activated carbon. Activated carbon has the
highest surface area was collected at 500 ° C
carbonization and 900°C activation temperature.
Additionally, the increased activation
temperature had a positive effect on the surface
area but caused a decrease in the percentage of
micropore. If it is desired to keep the amount of
micropores in the structure excess, a low
activation temperature should be used. Since
chemical activation is generally used in previous
Carbonization Physical
Activation
Temperature (°C/500
mL/dk N2)
Temperature
(°C/100 mL CO2)
SBET
m2/g
Adsorption Capacity qe
(mg/g)
300 800 369,24 23,99
300 900 629,13 154,46
400 800 425,16 45,55
400 900 516,86 65,68
500 800 382,93 26,19
500 900 652,22 155,45
600 800 387,04 40,93
600 900 584,94 149,62
700 800 380,97 16,29
700 900 557,20 96,51
800 800 411,74 39,5
800 900 644,31 174,81
900 800 320,01 24,1
900 900 564,52 132,02
1000 800 56,79 15,96
1000 900 400,42 55,45

DUJE (Dicle University Journal of Engineering) 12:2 (2021) Page 297-308
306
studies, the surface areas of those activated
carbons are higher than this study. Active carbon
synthesized by chemical activation has less
micropore, while the amount of mesopore is high.
At this point, it is clear that the activation used in
the synthesis of activated carbon is important. As
a result, physical activation with the CO2 can be
used in a study aimed to increase the amount of
micropore. In addition, that, the pore distributions
of the formed activated carbons will vary on a
smaller scale.
Acknowledgments: This study was supported by
the unit of Scientific Researches of Inonu
University in Malatya, Turkey; Project No: FDI-
2017-680
REFERANSLAR
1. Fulazzaky MA, Omar R (2012) Removal
of oil and grease contamination from
stream water using the granular activated
carbon block filter Clean Technologies
and Environmental Policy 14: pp.965-971
2. Shi K, Ren M, Zhitomirsky I (2014)
Activated carbon-coated carbon
nanotubes for energy storage in
supercapacitors and capacitive water
purification ACS Sustainable Chemistry
Engineering 2: pp.1289-1298
3. Ao C, Lee S (2005) Indoor air purification
by photocatalyst TiO2 immobilized on an
activated carbon filter installed in an air
cleaner Chemical engineering science 60:
pp.103-109
4. Bhatnagar A, Hogland W, Marques M,
Sillanpää M (2013) An overview of the
modification methods of activated carbon
for its water treatment applications
Chemical Engineering Journal 219:
pp.499-511
5. Baccar R, Sarrà M, Bouzid J, Feki M,
Blánquez P (2012) Removal of
pharmaceutical compounds by activated
carbon prepared from agricultural by-
product Chemical engineering journal
211: pp.310-317
6. Anirudhan T, Sreekumari S, Bringle C
(2009) Removal of phenols from water
and petroleum industry refinery effluents
by activated carbon obtained from
coconut coir pith Adsorption 15:439
7. Heidenreich RG, Krauter JG, Pietsch J,
Köhler K (2002) Control of Pd leaching in
Heck reactions of bromoarenes catalyzed
by Pd supported on activated carbon
Journal of Molecular Catalysis A:
Chemical 182: pp.499-509
8. Matsuo T, Nishi T (2000) Activated
carbon filter treatment of laundry waste
water in nuclear power plants and filter
recovery by heating in vacuum Carbon
38: pp.709-714
9. Hasegawa G (2013) Monolithic electrode
for electric double-layer capacitors based
on macro/meso/microporous S-
containing activated carbon with high
surface area. In: Studies on Porous
Monolithic Materials Prepared via Sol–
Gel Processes. Springer, pp 79-89.
10. Bai Y, Liu Y, Tang Y, Xie Y, Liu J (2011)
Direct carbon solid oxide fuel cell—a
potential high performance battery
international journal of hydrogen energy
36: pp.9189-9194
11. Abbruzzese C, Fornari P, Massidda R,
Vegliò F, Ubaldini S (1995) Thiosulphate
leaching for gold hydrometallurgy
Hydrometallurgy 39: pp.265-276
12. Yahya MA, Al-Qodah Z, Ngah CZ (2015)
Agricultural bio-waste materials as
potential sustainable precursors used for
activated carbon production: A review
Renewable Sustainable Energy Reviews
46: pp.218-235
13. Radovic LR, Moreno-Castilla C, Rivera-
Utrilla J (2001) Carbon materials as
adsorbents in aqueous solutions.
Chemistry physics of carbon.
14. Meidl J (1997) Responding to changing
conditions: how powdered activated
carbon systems can provide the
operational flexibility necessary to treat
DUJE (Dicle University Journal of Engineering) 12:2 (2021) Page 297-308
307
contaminated groundwater and industrial
wastes Carbon 35: pp.1207-1216
15. Dias JM, Alvim-Ferraz MC, Almeida
MF, Rivera-Utrilla J, Sánchez-Polo M
(2007) Waste materials for activated
carbon preparation and its use in aqueous-
phase treatment: a review Journal of
environmental management 85: pp.833-
846
16. Lua AC, Yang T (2005) Characteristics of
activated carbon prepared from pistachio-
nut shell by zinc chloride activation under
nitrogen and vacuum conditions Journal
of colloid interface science 290: pp.505-
513
17. Örkün Y, Karatepe N, Yavuz R (2012)
Influence of temperature and
impregnation ratio of H3PO4 on the
production of activated carbon from
hazelnut shell Acta Physica Polonica-
Series A General Physics pp.121:277
18. Tsai W-T, Chang C, Lee S (1998) A low
cost adsorbent from agricultural waste
corn cob by zinc chloride activation
Bioresource Technology 64: pp.211-217
19. Ademiluyi F, Amadi S, Amakama NJ
(2009) Adsorption and Treatment of
Organic Contaminants using Activated
Carbon from Waste Nigerian Bamboo
Journal of Applied Sciences
Environmental Management 13(3),
pp.39-47
20. Wang J, Wu F, Wang M, Qiu N, Liang Y,
Fang S, Jiang X (2010) Preparation of
activated carbon from a renewable
agricultural residue of pruning mulberry
shoot African Journal of Biotechnology 9:
pp.2762-2767
21. Spahis N, Addoun A, Mahmoudi H,
Ghaffour N (2008) Purification of water
by activated carbon prepared from olive
stones Desalination 222: pp.519-527
22. Tawalbeh M, Allawzi M, Kandah MI
(2005) Production of activated carbon
from jojoba seed residue by chemical
activation residue using a static bed
reactor Journal of Applied Sciences 5:
pp.482-487
23. Yusufu M, Ariahu C, Igbabul B (2012)
Production and characterization of
activated carbon from selected local raw
materials African Journal of Pure Applied
Chemistry 6: pp.123-131
24. Ramakrishnan K, Namasivayam CJJEEM
(2009) Development and characteristics
of activated carbons from Jatropha husk,
an agro industrial solid waste, by
chemical activation methods J Environ
Eng Manage 19: pp.173-178
25. Demiral H, Demiral I, Tümsek F,
Karabacakoğlu B (2008) Pore structure of
activated carbon prepared from hazelnut
bagasse by chemical activation Surface
Interface Analysis 40: pp.616-619
26. Qiu K, Yang S, Yang J (2009)
Characteristics of activated carbon
prepared from Chinese fir sawdust by zinc
chloride activation under vacuum
condition Journal of Central South
University of Technology
27. Jutakridsada P, Prajaksud C, Kuboonya-
Aruk L, Theerakulpisut S, Kamwilaisak
K (2016) Adsorption characteristics of
activated carbon prepared from spent
ground coffee Clean Technologies and
Environmental Policy 18: pp.639-645
28. Oubagaranadin J, Murthy Z (2011)
Activated carbons: Classifications,
properties and applications.
29. Donald J, Ohtsuka Y, Xu CC (2011)
Effects of activation agents and intrinsic
minerals on pore development in
activated carbons derived from a
Canadian peat Materials Letters 65:
pp.744-747
30. Al-Qodah Z, Shawabkah R (2009)
Production and characterization of
granular activated carbon from activated
sludge Brazilian Journal of Chemical
Engineering 26: pp.127-136
31. Gu Z, Wang X (2013) Carbon materials
from high ash bio-char: a nanostructure

DUJE (Dicle University Journal of Engineering) 12:2 (2021) Page 297-308
308
similar to activated graphene Am Trans
Eng Appl Sci 2: pp.15-34
32. Adinata D, Daud WMAW, Aroua MK
(2007) Preparation and characterization
of activated carbon from palm shell by
chemical activation with K2CO3
Bioresource technology 98: pp.145-149
33. Daud WMAW, Ali S.W, Sulaiman MZ
(2000) The effects of carbonization
temperature on pore development in palm
shell based activated carbon Carbon 38 :
pp.1925-1932
34. Chang CF, Chang CY, Tsait WT, (2000)
Effects of burn off and activation
temperature on preparation of activated
carbon from corn cob agrowaste by CO2
and steam Journal of Colloid and
Interface Science 232: pp.45-49