The 75% Solution: An Analysis of the Structure of ...
38
The 75% Solution: An Analysis of the Structure of Attitudes on Gun Control, 1959-1977 Tom W. Smith Associate Study Director, National Opinion Research Center Not for quotation or citation without permission This research was part of work done by the "Social Change Project," NSF Grant No. SOC73-09231 AO1. An earlier version of this paper was presented to the American Statistical Association, August, 1978, San Diego. REVISED, MARCH 1980
Transcript of The 75% Solution: An Analysis of the Structure of ...
The 75% Solution: An Analysis of the Structure of Attitudes on Gun Control, 1959-1977
Tom W. Smith
Associate Study Director, National Opinion Research Center
Not for quotation or citation without permission
This research was part of work done by the "Social Change Project," NSF Grant No. SOC73-09231 AO1.
An earlier version of this paper was presented to the American Statistical Association, August, 1978, San Diego.
REVISED, MARCH 1980

- 1— One of the few constants in American public opinion over the last two decades has been that three-fourths of the population supports gun control. From 1959 to 1977 sixteen surveys have asked, "Would you favor or oppose a law which would require a person to obtain a police permit before he or she could buy a gun?" In response the public has consistently split about three to one in favor of gun control (see Table 1). The low point of opposition occurred in December, 1963 during the traumatic aftermath of President Kennedy's assassination and the high point appeared in August, 1966 On the remaining 14 points opposition moved within a narrow ban of from 22 to 28 percent.
In some respects this consistence over time is amazing. Since the 1959 starting point, the nation experienced the assassination of several of its high officials, dozens of major riots, and an explosive upsurge in violent crime. Yet the net impact of these and other events over this period was zero. Events either had no influence on the gun control attitudes of people or pushed in opposite directions for a resulting standoff.
The stability over time is also notable in face of the changing importance of the gun control issue itself. After a flury of activity to regulate firearms in the mid-to-late thirties, gun control ceased being a
Applying a constant model to this series reveals more variation than could be expected by sampling error (see Statistical Analysis in Table 1). Likewise, a linear model fails to fit the data very well although the linear model does improve upon the constant model by a significant degree. In sum, the series tests out as showing non-linear change with a small and weak, but significant, linear component indicating an increase in opposition of .0025 per annum. Almost all of the non-linear trend and the linear component re-sults from one point, however. With the elimination of the 19632survey from the series, the remaining fifteen points fit a constant model (x = 20.5, d.f.=14, prop.=.114) with a pooled estimate of the proportion opposing gun control of .257.

—2— topic of public interest until 1957 when the Commissioner of Internal Revenue proposed certain changes in the administration of Federal Firearms Act of 1938. This and subsequent discussions on the protection of domestic manufacturers from imports, and about the availability of firearms to juveniles (the Dodd Investigations), made gun control a minor topic of con cern. It was not until the assassination of President Kennedy in 1963 that gun control really became topical. A count of magazine articles dealing with gun control from 1935 to 1977 indicates that coverage was nil from 1941/43 through 1953/55. The proposed tightening of the administration of the Federal Firearms Act of 1938 created a small swell of attention which crested at five articles in 1957/1959. The rate then fell to an average of one article per year from 1959/1961 through 1962/1963, before surging to 12 articles per year over the next four years (1963/64^1966/67). Interest then climbed sharply over the next two years and peaked at 47 articles in 1968/69 at the time of the passage of the Gun Control Act of 1968. Coverage then remained stable at about 10 articles per year until 1975-77 when legislative activity on handgun control pushed coverage to about 30 articles per year.2
In order to explore this pattern of stability amid the currents of
history and to gain insight into the factors that help to form opinions on
A count of articles under the Heading "Firearms -- Laws and Regulations" was made for each issue of the Reader's Guide to Periodical Literature from 1937 to 1977. Until 1965 the volumes covered two-years since then they were annual. The per volume count was as follows:
1935/37 - 0 1945/47 - 0 1955/57 - 2 1965/66 -13 1970/71 - 7 1937/39 - 1 1947/49 - 0 1957/59 - 5 1966/67 -14 1971/72 -10 1939/41 - 3 1949/51 - 0 1959/61 - 3 1967/68 -20 1972/73 -14 1941/43 - 0 1951/53 - 0 1961/63 - 1 1968/69 -47 1973/74 - 9 1943/45 - 0 1953/55 - 0 1963/65 -21 1969/70 -11 1974/75 -10 1975/76 -30 1976-77 -2&
For a good account of the history of gun control legislation see Zimring, 1975 pp. 135-148. See also American Enterprise Institute, 1976, pp. 3-6.

this issue, this paper conducts analyses of 1) the socio-demographic associates of gun control, 2) the relationship between attitudes toward crime and punishment and gun control, and 3) the inter-relationship between various gun control attitudes.
Data were available in the Social Change files at the National Opinion Research Center (NORC) for cross tabular analysis of 12 of the 16 surveys with the police permit question (AIPO 616, 681, 704, 733, 749, 838, GSS 72, 73, 74, 75, 76, and 77). Variables available for over time analysis included sex, age, race, community type, region, religion, education, income, party identification, and gun ownership.
To examine the relationships between time, the background variables, and gun control, d-systems were employed (Davis, 1975). The variables are crosstabulated and differences in percentages between categories are calculated. Table 2, for example, shows the percent opposing gun control on each available survey broken down by sex of respondent. D-system inspects the difference between men and women and tests for its statistical significance. It also tests to determine if the sex difference is constant over all data points or whether the sex difference interacts with time.
There are three possible outcomes for the differences. If the observed differences are not statistically significant then the model that there are no differences between the categories (d = 0) is accepted. If the observed differences are statistically significant then the pooled difference is calculated. If the observed differences do not vary significantly from the pooled estimate then the model that the differences are constant (d = c) is accepted. If the differences do vary significantly from the pooled estimate, then differences exist between the groups but their magnitude varys with time. This outcome is described as nonconstant. For example, Table 2 shows that the differences between men and women are statistically significant (X2 = 711.6 and probability is less than .001). The variation of

—4— the observed differences in each survey are not significantly different from the pooled or average difference (x = 13.7 and probability equals .252). As a result the constant hypothesis (d = c) is accepted in this case.1
Turning to the trend analysis of these socio-demographic variables, Table 2 examines the sex differences on gun control. The data show that women have been consistently less opposed to the requiring of a police permit than men. The pooled difference over 12 surveys from 1959 to 1975 indicates that women are 16.8 percentage points less opposed than men. The stronger desire of women to control firearms reflects differences in the socialization process of boys and girls. Traditional female upbringing includes, in general, such values as pacificism, sympathy, and passivity (which leads to a greater opposition to war and capital punishment (see Mueller, 1973:1946-1947 and Smith, 1976:266) and in particular, a disinterest in firearms.
Turning to cohort differences, we find that there has been no rela-tion between age and gun control over the period. This indicates that the stable level of opposition observed may extend back into time since birth cohorts do not vary on this issue.2
The relationship between race and gun control bounces considerably over time. Table 3 reveals a significant association at five points in time and no significant correlation at the remaining seven times. Over
1For the details of the statistical tests applied here, see Taylor (1976). In brief, the first hypothesis tested is that the sample proportions are from a constant universe value, which is estimated to be the pooled average of the proportions. The criterion for the goodness-of-fit is the chi-square statistic that divides the squared deviation of the observed value from the predicted value by the variance of the observed value. This is referred to as the "test for homogeneity." The next hypothesis tested is that the sample proportions are from a linear universe trend. The chisquare goodness-of-fit test is used to compare the actual proportions with their linear estimates. This is referred to as the "test for linearity."
2 Tabular data available from author.

all there is no discernible trend. On all but the first survey, however, the direction is towards less opposition and the pooled difference is -7.2 percentage points. It therefore appears that blacks tend to be less opposed than whites to gun control.
Moving on from immutable personal characteristics to ecological features, Table 4 demonstrates a strong relationship between community type and the regulation of firearms. As one moves from the countryside, through the small towns and down the elm-shaded main streets, and on to the metropolitan centers opposition steadily falls. In rural America opposition has averaged about onethird, in towns, it is 7.4 per cent points lower, in medium metropolitan areas 12.6 per cent points lower, and in large centers 18.3 per cent points below. To examine this association more closely a refined measurement of community type was employed in Table 5. This classification distinguishes suburban from central city and exurbia from rural. There appears to be some differences between the cities and the suburbs on this issue. In large metropolitan areas opposition grows as one moves from the center to the inter and outer periphery. In medium sized areas exurbia clearly differentiates itself from the central city, but the inner suburbs show the most opposition. This results not from the suburban character of exurbia but from the fact that much of this area is rural rather than suburban in character. In brief, community type differentiates on this issue with the main split being rural/metropolitan and with smaller suburban/core differences.
The next ecological variable, region, also has a strong relationship to gun control. Table 6 indicates that the South and the West are about 17 per cent points more opposed than the Northeast is and that the Midwest is 13 per cent more opposed. The split is therefore not the classic South/non-South division but rather along a Northeast~non-Northeast axis.
Given the strong association between community type and region, it was decided to control for this interaction. Both the community and regional
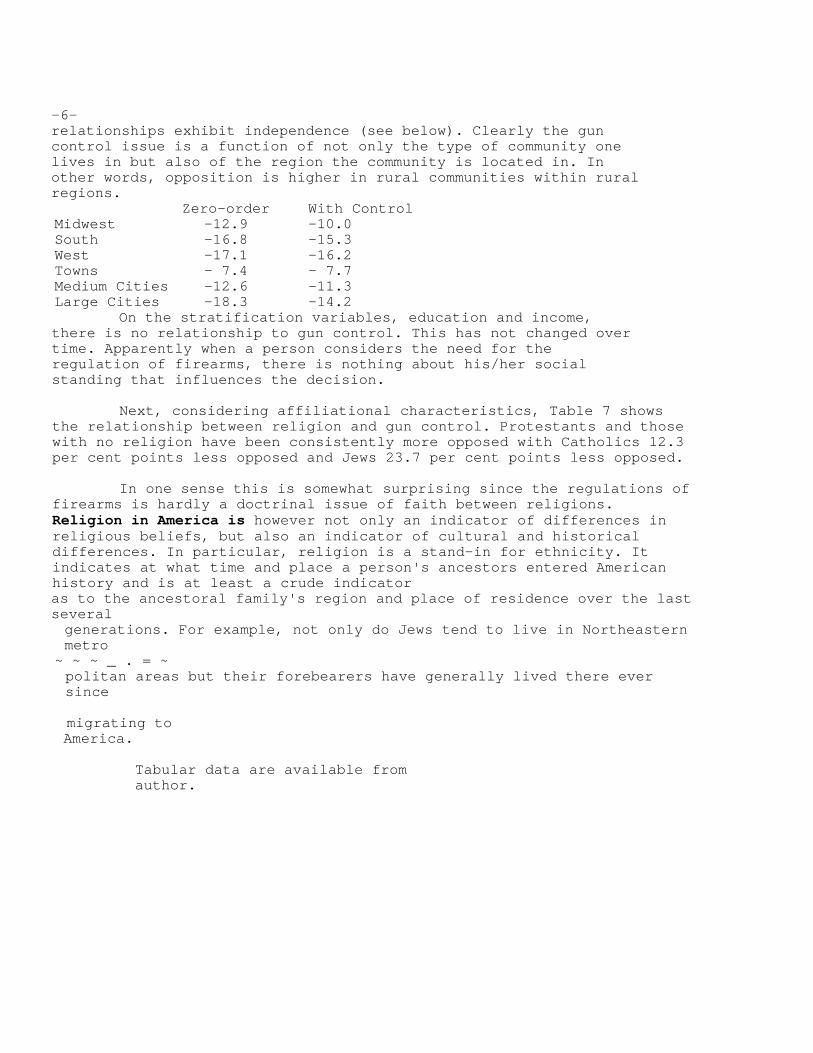
—6— relationships exhibit independence (see below). Clearly the gun control issue is a function of not only the type of community one lives in but also of the region the community is located in. In other words, opposition is higher in rural communities within rural regions. Zero-order With Control Midwest -12.9 -10.0 South -16.8 -15.3 West -17.1 -16.2 Towns - 7.4 - 7.7 Medium Cities -12.6 -11.3 Large Cities -18.3 -14.2
On the stratification variables, education and income, there is no relationship to gun control. This has not changed over time. Apparently when a person considers the need for the regulation of firearms, there is nothing about his/her social standing that influences the decision.
Next, considering affiliational characteristics, Table 7 shows the relationship between religion and gun control. Protestants and those with no religion have been consistently more opposed with Catholics 12.3 per cent points less opposed and Jews 23.7 per cent points less opposed.
In one sense this is somewhat surprising since the regulations of firearms is hardly a doctrinal issue of faith between religions. Religion in America is however not only an indicator of differences in religious beliefs, but also an indicator of cultural and historical differences. In particular, religion is a stand-in for ethnicity. It indicates at what time and place a person's ancestors entered American history and is at least a crude indicator as to the ancestoral family's region and place of residence over the last several generations. For example, not only do Jews tend to live in Northeastern metro
~ ~ ~ _ . = ~ politan areas but their forebearers have generally lived there ever since
migrating to America.
Tabular data are available from author.

—7— Table 8 demonstrates the relationship between ethnicity and attitudes
toward gun control. National origins were grouped according to when, where, and how these nationalities entered American society. The old stock repre-sents the main pre-nineteenth century host culture, mainly British. The mid-dle stock consists of groups that either arrived by the mid-nineteenth century and/or settled in rural areas. The new group is generally late nineteenth/ early twentieth century arrivals. The white, mixed group consists of people with multiple national backgrounds unable to specify one dominant origin. Finally, Blacks are separated because although they were early and rural immigrants they were not part of the host culture and were restricted in their use of firearms. We find that the old white and mixed groups are most opposed to gun control, followed by the middle stock (-4.4?,Blacks (-9.4) and the new stock (-16.2).
Finally, one behavioral characteristic, gun ownership is strongly related to gun control. As might be expected gun owners are less enthused about the requiring of police permits than are non-owners. The difference has been consistent over time and averages 22.4 per cent points more opposed (see Table 9). When it is remembered that gun ownership is associated with being male, white, Protestant, old stock, rural, and non-Northeastern, an explanation for most of the prior relationships becomes apparent. Pro-control people tend not to own guns and moreover tend to come from demographic and ecological groups which tend not to own guns and not to value highly the possession of firearms. Anti-control individuals on the other hand tend to own guns and/or come from a culture where gun ownership is a common and respected practice.
Having outlined the cultural associates, gun control was then related to a second dimension--crime and punishment. Violent crime has increased dramatically over the last two decades, causing a rise in the salience of
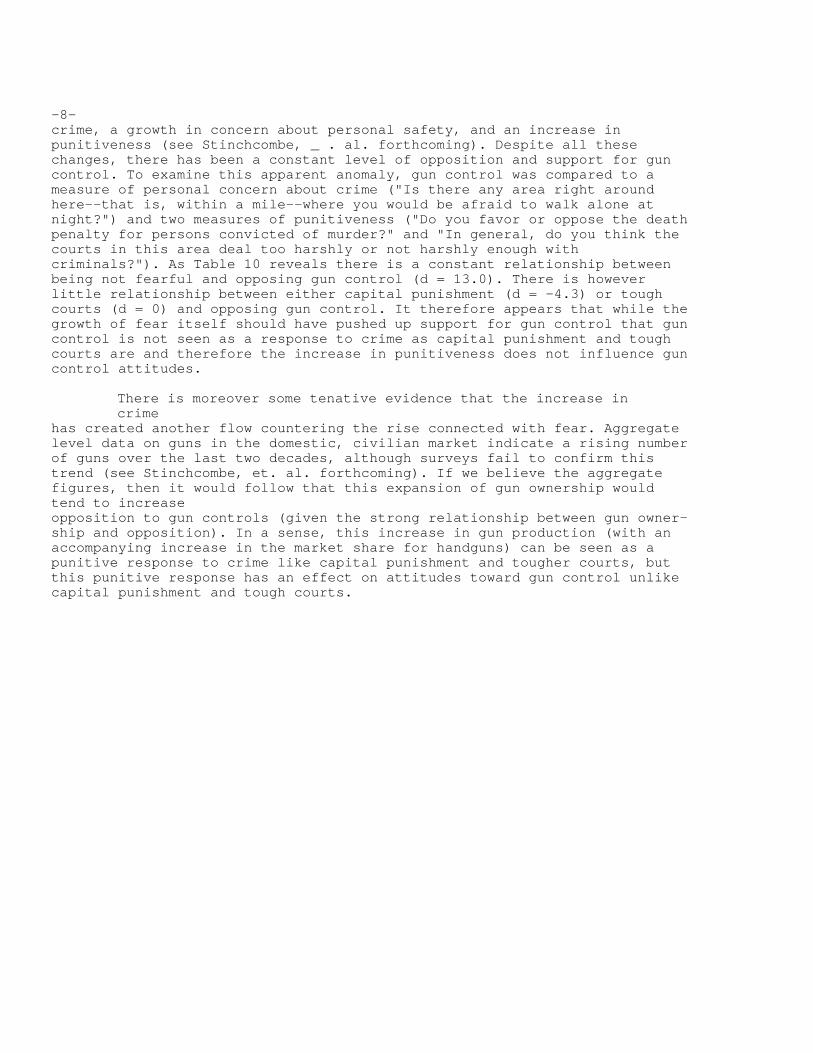
—8— crime, a growth in concern about personal safety, and an increase in punitiveness (see Stinchcombe, _ . al. forthcoming). Despite all these changes, there has been a constant level of opposition and support for gun control. To examine this apparent anomaly, gun control was compared to a measure of personal concern about crime ("Is there any area right around here--that is, within a mile--where you would be afraid to walk alone at night?") and two measures of punitiveness ("Do you favor or oppose the death penalty for persons convicted of murder?" and "In general, do you think the courts in this area deal too harshly or not harshly enough with criminals?"). As Table 10 reveals there is a constant relationship between being not fearful and opposing gun control (d = 13.0). There is however little relationship between either capital punishment (d = -4.3) or tough courts (d = 0) and opposing gun control. It therefore appears that while the growth of fear itself should have pushed up support for gun control that gun control is not seen as a response to crime as capital punishment and tough courts are and therefore the increase in punitiveness does not influence gun control attitudes.
There is moreover some tenative evidence that the increase in crime
has created another flow countering the rise connected with fear. Aggregate level data on guns in the domestic, civilian market indicate a rising number of guns over the last two decades, although surveys fail to confirm this trend (see Stinchcombe, et. al. forthcoming). If we believe the aggregate figures, then it would follow that this expansion of gun ownership would tend to increase opposition to gun controls (given the strong relationship between gun owner-ship and opposition). In a sense, this increase in gun production (with an accompanying increase in the market share for handguns) can be seen as a punitive response to crime like capital punishment and tougher courts, but this punitive response has an effect on attitudes toward gun control unlike capital punishment and tough courts.

- 9 - Putting together the major elements that we have observed in the preceding
ana lyses of the socio-demographic and crime/punishment structure of attitudes . . _ , , , _ , , _ , _ , , , . _
toward gun control suggest that attitudes towards gun control are influenced by 1) exposure to a gun culture and gender (since it is a sex-specific culture), 2) current residence, and 3) gun ownership and fear of crime. In rural and frontier areas there has traditions lly been heavy use of guns for recreational and protective purposes. The ownership and use of guns was a typical part of the socialization and behavioral patern of males. Current residence in rural localities and rural regions provides continuing exposure to the traditional gun culture and opportunities for hunting. Because of these reasons, gun ownership is high among groups that have been part of the gun culture and live in areas where that culture still flourishes. Fear is also related to localities and regions of residence, since crime is highest in urban centers, and to gender. In turn each of these influences gun control attitudes.
Figure 1 graphs the relationships between these variables and gun control. (Allis
extension of d-systems is known as categorical linear flow graph analysis. It is a non-parametric version of path analysis and transmittances can be calculated in the same fashion. Davis, 1975.)
Members of the non-gun control (everyone except old stock, Protestants are less opposed
than members of the gun culture net of current location, fear, ownership and sex (-6.1). This group is also less opposed because of its lower ownership of guns (-13.7*14.5=-2.0) and its residence in non-rural localities and non-Northeast states (-17.5*i.4=-0.2 and -20.8*9.2=-1.9). Finally? they are less opposed because the localities they live in are more fearful and have fewer guns (-17.5*16.5*4.6 = -0.1,-20.8*5.0*4.6=-.05 and -17.5*19.2*14.5=0.5. -20.8*20.5*14.5=0.6). Women are less opposed net of the other variables (-7.7), because of their greater fear (38.6*4.6=-1.8), and because of their lack of guns
(-13.7*14.5=-1.0). Continuing through the model we find the expected positive
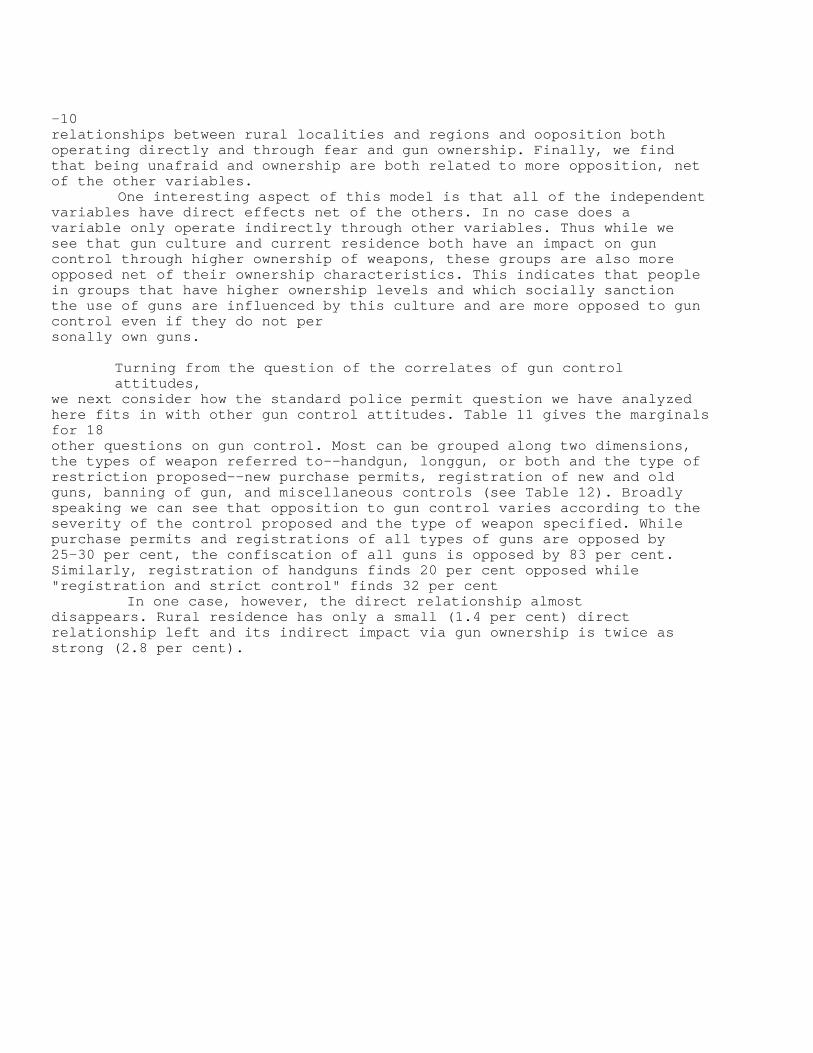
-10 relationships between rural localities and regions and ooposition both operating directly and through fear and gun ownership. Finally, we find that being unafraid and ownership are both related to more opposition, net of the other variables.
One interesting aspect of this model is that all of the independent variables have direct effects net of the others. In no case does a variable only operate indirectly through other variables. Thus while we see that gun culture and current residence both have an impact on gun control through higher ownership of weapons, these groups are also more opposed net of their ownership characteristics. This indicates that people in groups that have higher ownership levels and which socially sanction the use of guns are influenced by this culture and are more opposed to gun control even if they do not per sonally own guns.
Turning from the question of the correlates of gun control attitudes,
we next consider how the standard police permit question we have analyzed here fits in with other gun control attitudes. Table 11 gives the marginals for 18 other questions on gun control. Most can be grouped along two dimensions, the types of weapon referred to--handgun, longgun, or both and the type of restriction proposed--new purchase permits, registration of new and old guns, banning of gun, and miscellaneous controls (see Table 12). Broadly speaking we can see that opposition to gun control varies according to the severity of the control proposed and the type of weapon specified. While purchase permits and registrations of all types of guns are opposed by 25-30 per cent, the confiscation of all guns is opposed by 83 per cent. Similarly, registration of handguns finds 20 per cent opposed while "registration and strict control" finds 32 per cent
In one case, however, the direct relationship almost disappears. Rural residence has only a small (1.4 per cent) direct relationship left and its indirect impact via gun ownership is twice as strong (2.8 per cent).

—11— opposed and the banning of handguns in "high crime areas" is opposed by 53 per cent while a nationwide ban finds 61 per cent opposed. Opposition is also greater when longguns or all guns are specified as opposed to handguns. While 28 per cent believe handgun laws are currently too strict or about right 48 per cent believe longgun laws are too strict or about right. Likewise while the banning of all handguns is opposed by about 60 per cent, the confiscation of all guns is opposed by 83 per cent and while the registration of handguns is opposed by 20 per cent, the registration of all guns is opposed by about 30 per cent. Of course these observations are very tenuous being based in part on comparisons between different surveys at different times and between wordings that are not always parallel across types of weapons.
Fortunately it was possible to examine how four gun control items scaled together on a 1976 NORC survey. These items includedthe standard police permit question, a gun registration question (Table 11-B), a handgun ban question (Table ll-C), and a gun confiscation question (Table ll-Q). Table 12 shows the result of applying Guttman scaling to these items. The four items scale moderately well, but there are some obvious exceptions. The largest is between people opposing police permits but favoring gun registration (6.7 per cent). This group is almost as large as those supporting permits and opposing registration (7.9 per cent) and if this item is scored as the easiest gun control item the four items scale almost as well (see Table 13). It thus appears that police permit and registration have about the same degree of difficulty (79.6 per cent either approve or disapprove of both items). If the scale is reduced to three items with either police permits or gun registration as the easiest gun control item then their scability goes up appreciably (.149 and .142 respectively). The other three large off-scale groups have in common being for the banning of pistols, against confiscation, and either against a police permit, registration, or both. This clustering indicates that gun con

-12 trol is not strictly unidimensional, but that reference to handguns rather than all guns makes a difference. In sum, from the scaling of these four items support is found for the notion that there are severity and type of weapons dimensions in attitudes toward gun control.
Next, the time trends were inspected for the gun control items in Table 11. The five time trends (excluding the pre-1959 points and series of one year or less) are shown in Figure2 . The ammunition permit, registration of purchases, and gun control for youth series all show a constant trend like the standard police permit question. Two series, however, show linear increases in opposition. One, dealing with the legality of keeping loaded weapons, deals with what is clearly a side issue and with only two points in 1959 and 1965 it is impossible to tell how this item changed over the longer period under investigation here. The handgun ban item however deals with a central gun control issue and with three points spanning the years from 1959 to 1976 meets minimal criteria as a parallel series to the police permit question.
The obvious question is how does this growth in opposition to banning pistols of 1.21 per cent per annum (the slope of the best linear approximation of the trend) fit in with the constant level of opposition to a police permit? To examine this the association between these two items were examined across time. This revealed a strong and constant relationship between the two gun control attitudes (d = .354). As opposition to a hangun ban grew, this opposition came equally from those for police permits and from those against police permits. The reason for this change seems to be that the handgun ban was influenced by the crime and punishment trends while the police permit question was not. With the growth of violent crime people apparently became convinced that forbiding the private use of pistols was not an appropriate response. This interpretation is backed by data on the increasing share of gunowners having a pistol
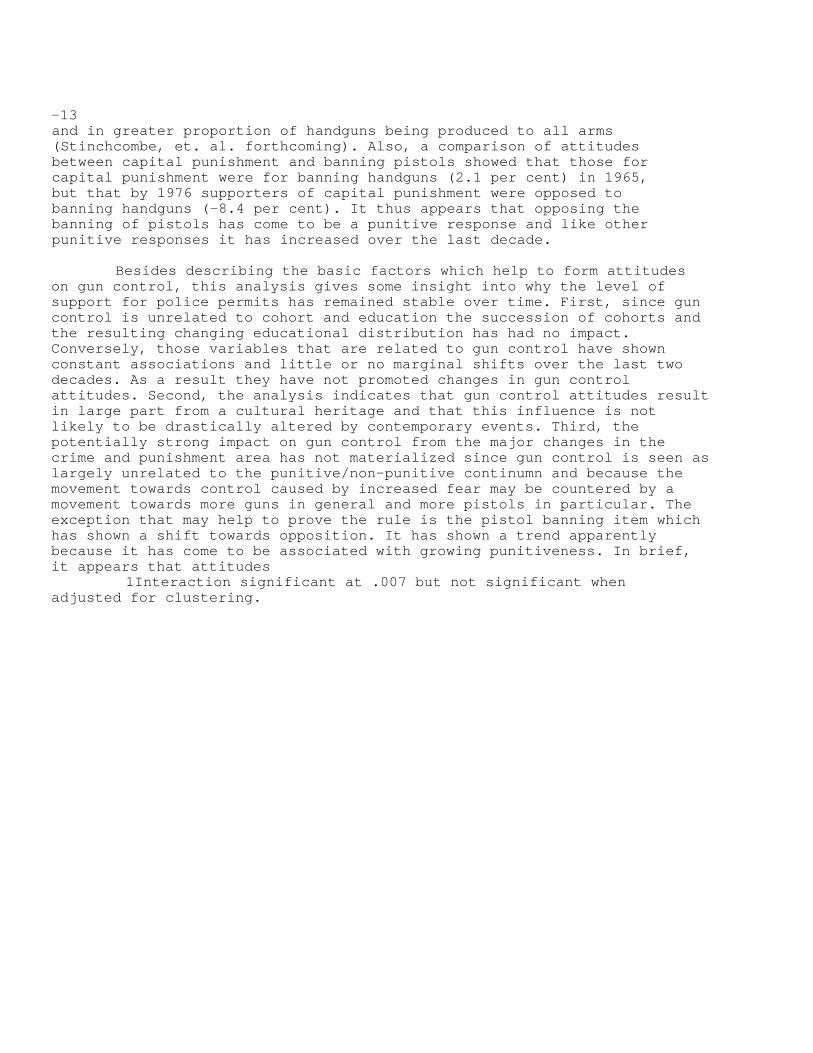
-13 and in greater proportion of handguns being produced to all arms (Stinchcombe, et. al. forthcoming). Also, a comparison of attitudes between capital punishment and banning pistols showed that those for capital punishment were for banning handguns (2.1 per cent) in 1965, but that by 1976 supporters of capital punishment were opposed to banning handguns (-8.4 per cent). It thus appears that opposing the banning of pistols has come to be a punitive response and like other punitive responses it has increased over the last decade.
Besides describing the basic factors which help to form attitudes on gun control, this analysis gives some insight into why the level of support for police permits has remained stable over time. First, since gun control is unrelated to cohort and education the succession of cohorts and the resulting changing educational distribution has had no impact. Conversely, those variables that are related to gun control have shown constant associations and little or no marginal shifts over the last two decades. As a result they have not promoted changes in gun control attitudes. Second, the analysis indicates that gun control attitudes result in large part from a cultural heritage and that this influence is not likely to be drastically altered by contemporary events. Third, the potentially strong impact on gun control from the major changes in the crime and punishment area has not materialized since gun control is seen as largely unrelated to the punitive/non-punitive continumn and because the movement towards control caused by increased fear may be countered by a movement towards more guns in general and more pistols in particular. The exception that may help to prove the rule is the pistol banning item which has shown a shift towards opposition. It has shown a trend apparently because it has come to be associated with growing punitiveness. In brief, it appears that attitudes
1Interaction significant at .007 but not significant when adjusted for clustering.

-14 toward police permits will continue to remain stable as long as they remain unassociated with other major trends such as the crime and punishment area. If, however, they became associated with this or some emerging trend (possibly a growing concern about government regulation), then the long term stability of this item would be broken. Until evidence of such a change is found, however, we must expect to find attitudes stable at the 75 per cent level.

TABLE 1 GUN PERMIT MARGINALS
Survey AIP0616 AIP0681 AIP0704 AIP0717 AIP0733 AIP0749 AIP0838GSS72 Date 7/59 12/63 1/65 9/65 8/66 8/67 10/71 3/72 Percent opposed
No 22.1 18.2 24.6 26.1 30.5 25.2 25.3 27.6 (1,473) (1,551) (1,628) (3,393)b (1,464) (1,569) (
Survey AIP0852 GSS73 GSS74 SRC GSS75 SRCC GSS76 GSS77 Date 5/72 3/73 3/74 3/75 3/75 2/76 3/76 3/77 Percent opposed
No 25.4 25.2 23.8 28.3 24.4 24.7 27.4 27.0 (1,478) (1,470) (1,459) (445) (1,450) (615) (1,472) (1,499)
Statistical Analysis
Hypothesis Model x2 e df p D
1) No change - p-pooled 47.0 15 <.001 2) Linear change p=a + bx 37.7 14 <.001
Linear improvement 9.4 1 <.0013 Significant Final Model
Linear component = .08 + .0025(x)
a s Don't knows and missing values excluded from analysis. b = Weighted number of cases exaggerates the number. N = 1500 used in calculations. c = Telephone interviews. The rest are personal interviews. d = For details of the tests used here, see Taylor,1976. e = To adjust for multi-stage sampling, standard deviations multiplied by 1. 414. This is a conservative adjustment for clustering. GSS = General Social Survey, National Opinion Rsearch Center. AIPO = American Institute of Public Opinion (Gallup) SRC = Survey Research Center, University of Michigan.

TABLE 2
SEX DIFFERENCES
- Survey AIP0616 AIP0681 AIP0704 AIP0733 AIP0749 AIP0838 Date 7/59 12/63 1/65 8/66 8/67 10/71 Percent opposed Male 30.2 25.6 35.3 40.1 34.6 34.1 (713) (753) (793) (714) (775) (709) Female 14.6 11.3 14.5 21.5 16.1 16.8 (760) (798) (835) (750) (794) (794) Survey -GSS72 GSS73 GSS74 GSS75 GSS76 GSS77 Date 3/72 3/73 3/74 3/75 3/76 3/77 Percent opposed Male 37.4 32.0 33.4 32.7 35.7 35.6 (789) (684) (686) (654) (661) (682) Female 16.8 17.6 19.3 15.3 20.7 19.8 (737) (773) (786) (773) (811) (817)
Statistical Analysis
Categorical 2 Difference Hypothesis Model x df p Decision (Base = Male) Female 1) No difference d=0 711.6 12 <.001
2) Constant differences d=c 13.7 11 .
Final Model
Female: d = -16.8
aFor details of the procedure employed here see Davis, 1976.
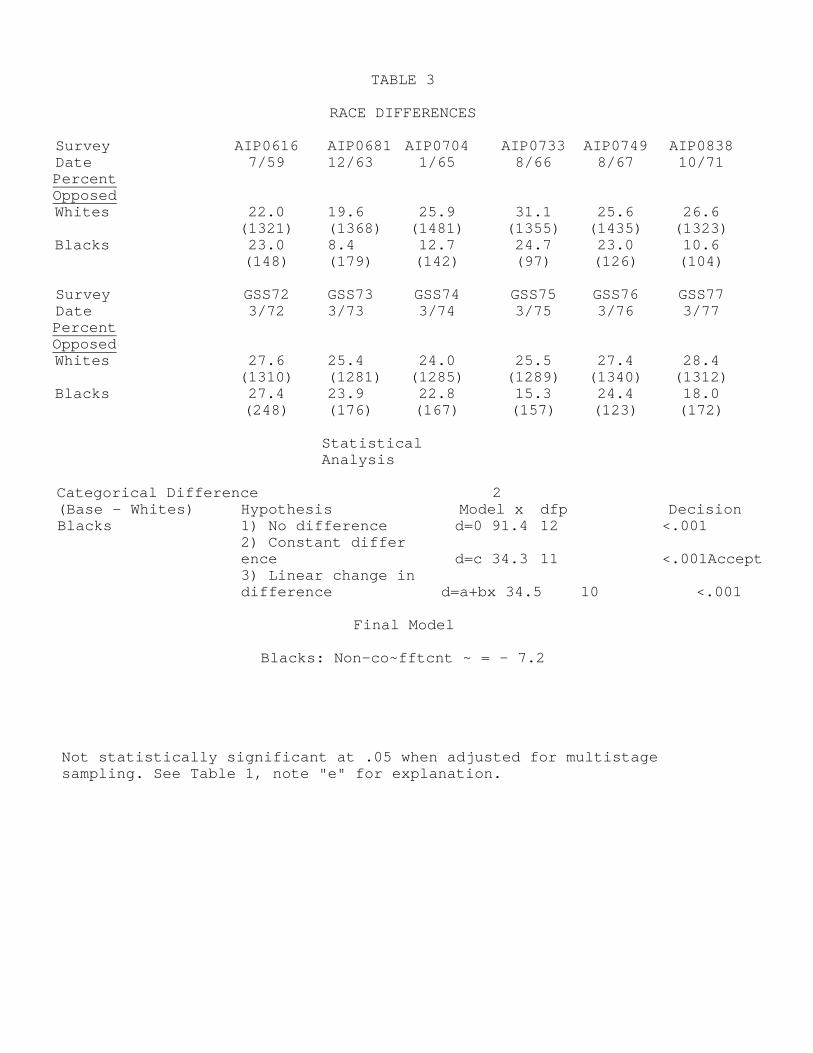
TABLE 3
RACE DIFFERENCES Survey AIP0616 AIP0681 AIP0704 AIP0733 AIP0749 AIP0838 Date 7/59 12/63 1/65 8/66 8/67 10/71 Percent Opposed Whites 22.0 19.6 25.9 31.1 25.6 26.6 (1321) (1368) (1481) (1355) (1435) (1323) Blacks 23.0 8.4 12.7 24.7 23.0 10.6 (148) (179) (142) (97) (126) (104) Survey GSS72 GSS73 GSS74 GSS75 GSS76 GSS77 Date 3/72 3/73 3/74 3/75 3/76 3/77 Percent Opposed Whites 27.6 25.4 24.0 25.5 27.4 28.4 (1310) (1281) (1285) (1289) (1340) (1312) Blacks 27.4 23.9 22.8 15.3 24.4 18.0 (248) (176) (167) (157) (123) (172)
Statistical Analysis
Categorical Difference 2 (Base - Whites) Hypothesis Model x dfp Decision Blacks 1) No difference d=0 91.4 12 <.001 2) Constant differ ence d=c 34.3 11 <.001Accept 3) Linear change in difference d=a+bx 34.5 10 <.001
Final Model
Blacks: Non-co~fftcnt ~ = - 7.2 Not statistically significant at .05 when adjusted for multistage sampling. See Table 1, note "e" for explanation.

TABLE 4 COMMUNITY TYPE DIFFERENCES
Survey AIP0616 AIP0681 AIP0704 AIP0733 AIP0745 AIP0838 Date 7/59 12/63 1/65 8/66 8/67 10/71 percent Opposed Less than 2500 33.0 25.2 37.6 44.4 34.9 40.0 (530) (445) (468) (423) (478) (415) Towns 22.1 22.4 29.7 37.7 22.6 25.9 (262) (250) (269) (212) (239) (205) Medium Cities 13.6 16.5 19.7 25.2 23.9 27.5 (177) (230) (254) (220) (218) (244) Large Cities 13.7 12.3 14.9 20.2 19.4 13.7 (504) (626) (637) (609) (634) (582)
_ .
Survey GSS72 GSS73 GSS74 GSS75 GSS76 GSS77 Date 3/72 3/73 3/74 3/75 3/76 3/77 Percent Opposed Less than 2500 35.9 31.7 30.9 33.0 35.4 33.4 (454) (457) (457) (497) (536) (533) Towns 34.0 24.4 23.5 24.4 28.2 34.0 (194) (217) (217) (172) (177) (194) Medium Cities 21.9 24.5 22.8 23.1 23.7 21.5 (247) (216) (219) (216) (253) (289) Large Cities 22.2 20.7 18.6 17.3 20.6 20.5 (667) (580) (566) (565) (506) (483) a = On AIPO LT2500 includes rural areas and places under 2500 outside the urbanized area of standard metropolitan statistical areas. Towns are over 2500 and under 50,000 and outside of urbanized areas. Medium cities are central cities from 50,000 to 249~999 plus suburbs within the urbanized area. Large cities are 250~000 and over plus suburbs. On GSS incorporated suburbs are coded with their central cities and unincorporated suburbs are coded into the LT2500 code. This gives rough, but imperfect comparison between the coding schemes.

TABLE 4--Continued Statistical Analysis
Categorical Difference 2 (Base = LT 2500) Hypothesis Model x df p Decision Towns 1) No difference d=0 61.6 12 <.001 2) Constant differ ence d=c 14.1 11 .225 Accept Medium Cities 1) No difference d=0 175.9 12 <.001 2) Constant differ ence d=c 16.1 11 .136 Accept Large Cities 1) No difference d=0 497.5 12 <.001 2) Constant differ- * ence d=c 37.8 11 <.001 3) Linear change in * difference d=a+bx 30.7 10 .001 Linear reduction 7.0 1 .008 Not sig nificant
Final Model
Towns: d=-7.4 Medium Cities: -12.6 Large Cities: d=-18.3 (non-const~nl)
* Not statistically significant at .05 when adjusted for multistage sampling.

TABLE 5
COMMUNITY DIFFERENCES Survey GSS72 GSS73 GSS74 GSS75 GSS76 GSS77 Date 3/72 3/73 3/74 3/75 3/76 3/77 Percent opposed Large central city 21.4 20.3 20.8 15.2 18.6 18.3 (415) (325) (318) (309) (253) (263) Large city suburb 23.4 21.2 15.7 19.9 22.5 23.2 (252) (255) (248) (256) (253) (220) Large city exurbia 19.3 17.7 20.0 23.5 31.1 28.6 (88) (96) (95) (68) (135) (140) Medium Central city 24.1 23.4 24.6 23.1 26.1 20.6 (187) (137) (138) (143) (180) (155) Medium city suburb 15.0 26.6 19.8 23.3 17.8 22.4 (60) (79) (81) (73) (73) (134) Medium city exurbia 48.7 24.2 26.0 31.0 26.8 40.0 (76) (128) (123) (126) (97) (85) Small city 35.8 28.2 19.0 25.8 20.5 34.0 (95) (103) (105) (93) (78) (97) Town 32.3 21.1 27.7 22.8 34.3 34.0 (34) (114) (112) (79) (99) (97) Village 28.0 33.3 35.2 29.2 35.6 28.6 (50) (54) (54) (48) (59) (70) Open country 39.6 44.1 38.4 37.3 41.2 35.3 (240) (179) (185) (255) (245) (238)
Statistical Analysis
_ . Categorical. difference 2 (Base=open country .Hypothesis Model x df p Decision cities) Large central city 1) No difference d=0 158.8 6 <.001 2) Constant Difference d=c 2.7 5 ~755accept Large city suburb 1) No difference d=0 118.2 6 <.001 2) Constant difference d=c 4.6 5 .533accept Large city exurbia 1) No difference d=0 61.5 6 <.001 2) Constant difference d=c 9.6 5 .086accept Medium central city 1) No difference d=0 66.5 6 <.001 2).Constant difference d=c 1.3 5 .936accept Medium city suburb 1) No difference d=0 69.6 6 <.001 2) Constant difference d=c 4.0 5 .551accept Medium city exurbia 1) No difference d=0 30.4 6 <.001 2) Constant difference d=c 18.3 5 .003*accept Small city 1) No difference d=0 40.1 6 <.001 2) Constant difference d=c 10.4 5 .065accept Town 1) No difference d=0 32.3 6 <.001 2) Constant difference d=c 9.4 5 .094accept Village 1) No difference d=0 8.0 6 .234 accept
= Not statistically significant at .05 when adjusted for multistage sampling.
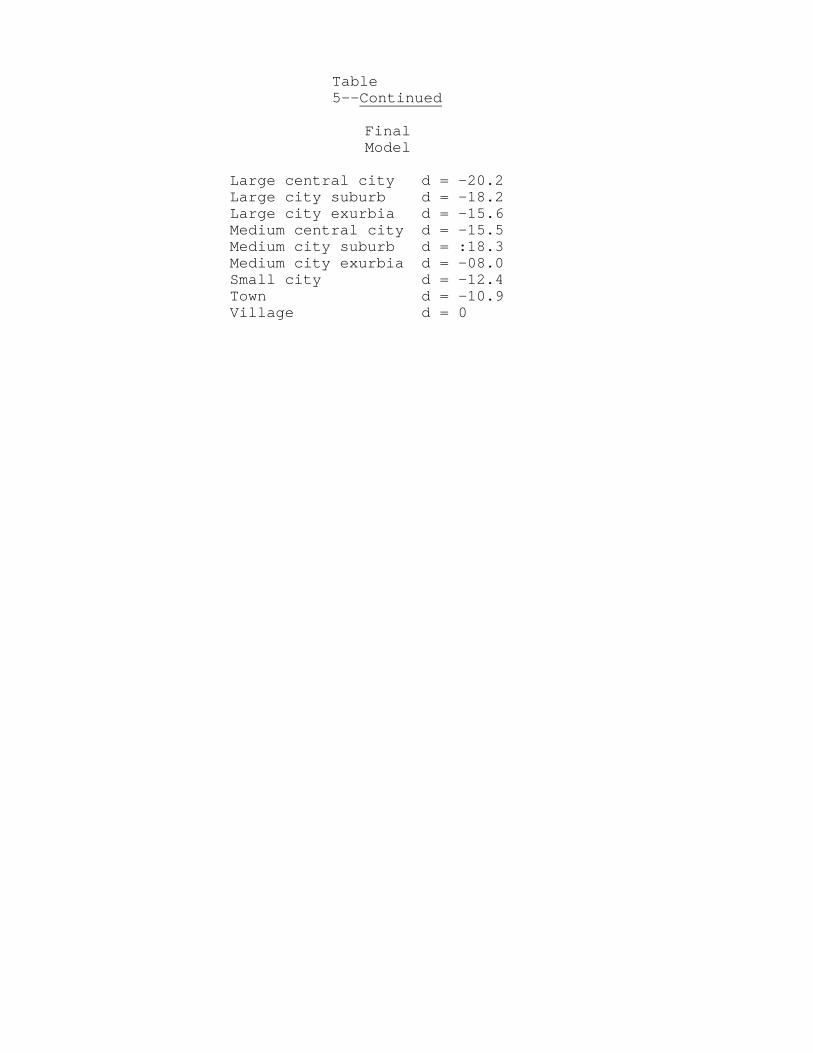
Table 5--Continued
Final Model
Large central city d = -20.2 Large city suburb d = -18.2 Large city exurbia d = -15.6 Medium central city d = -15.5 Medium city suburb d = :18.3 Medium city exurbia d = -08.0 Small city d = -12.4 Town d = -10.9 Village d = 0

TABLE 6
REGION DIFFERENCES Survey AIPO616 AIPO681 AIPO704 AIPO733 AIPO749 AIPO838 Date 7/59 12/63 1/65 8/668/67 10/71 Percent Opposed Northeast 12.7 8.7 10.8 17.415.7 15.9 (387) (392) (407) (373)(413) South 29.8 21.8 33.7 37.028.2 31.7 (409) (427) (502) (419)(468) Midwest 21.3 19.1 25.1 29.426.1 26.4 (451) (472) (471) (432)(441) West 26.1 25.4 28.2 41.733.7 25.4 (2263 (260) (248) (240) (246) (244) _ . _ _ _ Survey GSS72 GSS73 GSS74 GSS75 GSS76 GSS77 Date 3/7: 3/73 3/74 3/753/76 3/77 Percent Opposed Northeast 15.7 10.4 12.2 12.713.4 13.9 (382) (336) (327) (316)(335) South 34.2 31.5 28.6 31.235.7 28.9 (477) (466) (469) (481)(470) Midwest 27.7 27.7 22.0 22.827.3 31.3 (426) (422) (419) (421)(417) West 32.5 29.3 33.2 29.330.8 31.0 (277) (246) (244) (232)(250)
Statistical Analysis
Categorical Differences 2 Hypothesis Model x df p Dec (Base = Northeast) _ _ . _ . . . _ _ _ South 1) No difference d=0 453.7 12 <.001 2) Constant difference d=c 14.0 11 Midwest 1) No difference d=0 293.6 12 <.001 2) Constant difference d=c 27.7 11 West 1) No difference d=0 314.3 12 <.001 2) Constant difference d=c 11.4 11
_ . . a = The regions used here correspond to the following census regions:
Northeast = New England+Middle Atlantic, South=South Atlantic+East South Central+West South Central, Midwest=East North Central+West North Central' West=Mountain+Pacific.
Not statistically significant at .05 when adjusted for multistage sampling.

TABLE 6--Continued
Final Model South: d= 16.8 Midwest: d= 12.9 West: d= 17.1

TABLE 7
RELIGIOUS DIFFERENCES Survey AIPO616 AIPO681 AIPO704 AIPO733 AIPO749 AIPO838 Date 7/59 12/63 1/65 8/66 8/6710/71
Percent OpDosed Protestants 25.7 20.8 28.5 35.6 28.7 29.8 (983) (1092) (1136) (983) (1076) (913) Catholics 14.7 12.7 16.4 18.5 17.2 15.8 (382) (346) (373) (356) (384) (361) Jews 5.8 2.1 6.2 10.3 7.0 6.1 (52) (47) (64) (58) (43) (49) Nones 30.4 27.8 18.5 34.4 40.6 29.5 (23) (36) (27) (32) (32) (61)
Survey GSS72 GSS73 GSS74 GSS75 GSS76 GSS77 Date 3/72 3/73 3/74 3/75 3/76 3/77
Percent Opposed protestants 31.7 31.1 28.2 27.8 31.6 31.0 (996) (920) (932) (947) (930) (981) Catholics 20.0 15.6 14.4 15.3 18.3 19.7 (400) (379) (375) (354) (388) (370) Jews 3.7 2.4 2.3 4.3 11.1 8.8 (54) (42) (44) (23) (27) (34) Nones 29.6 18.1 29.3 28.6 29.1 26.1 (81) (94) (99) (112) (110) (92)
Statistical Analysis
. Categorical Differences . 2 (Base = Protestants) Hypotheses Model x df pDecision Catholics 1) No difference d=0 339.5 12 <.001 2) Constant difference d=c 10.6 11 .340Accept Jews 1) No difference d=0 583.1 12 <.001 2) Constant difference d=c 12.3 11 .340Accept None 1) No difference d=0 15.6 12 .209Accept
Final Model
Catholics: d = -12.5 Jews: d = -23.7 None: d = 0
a = Persons of other religions excluded from analysis.

TABLE 8 ETHNIC DIFFERENCES
Survey GSS72 GSS73 GSS74 GSS75 GSS76 GSS77 Date 3/72 3/73 3/74 3/75 3/76 3/77 Percent Opposed Old Stock 32.9 31.4 29.0 30.5 32.8 29.9 (477) (477) (490) (515) (533) (511) Middle Stock 27.7 25.2 23.9 24.6 25.7 33.6 (423) (397) (401) (431) (378) (411) New Stock 17.1 12.9 13.7 15.3 18.0 12.8 (240) (264) (248) (215) (278) (242) White, Mixed 27.7 28.9 23.8 26.0 32.1 31.2 (166) (152) (151) (131) (156) (157) Black 27.4 23.4 22.8 15.3 24.4 18.0 (248) (175) (167) (157) (123) (172)
Statistical Analysis
- Categorical Differences . 2 (Base = 01d Stock) Hypothesls Model x df p Declslon Middle No difference d=0 21.2 6 .002 Constant difference d=c 8.4 5 .136 Accept Constant improvement 12.8 1 <.001 New No difference d=0 168.7 6 <.001 Constant difference d=c 1.2 5 .948 Accept White, Mixed No difference d=0 4.8 6 .570 Accept Black No difference d=0 43.0 6 <.001 Constant difference d=c 5.3 5 .382 Accept
Final Model Middle = -4.4 White, Mixed = 0 New = -16.2 Black = -9.4
a = Based on a separate analysis of ethnic origins and generations of residence in the United States, the following division of national origins was made according to the time, place and circumstances of immigration. Old stock are English, Scottish, Scotch-Irish, Canadian, French, "American", Amerindian, and people unable to give a country of origin. Middle stock are Scandanavian' German' Dutch, Swiss, Austrian, and Irish. New Stock are all other non-blacks who gave a national origin, mainly Southern and Eastern Europeans, Hispanics, and Orientals. White, mixed are those unable to chose a primary national origin from several named origins. Not statistically significant when adjusted for multistage sampling.

TABLE 9
GUN OWNERSHIP DIFFERENCES
Survey AIPO612 AIPO704 AIP0733 GSS73 GSS74 GSS76 GSS77 Date 7/59 1/65 8/65 3/73 3/74 3/76 3/77 Percent opposed
No Guns 13.4 12.0 18.9 14.1 13.9 15.7 15.8 (752) (836) (763) (754) (772) (764) (733) Owns Gun 31.2 38.0 43.2 36.3 34.5 39.8 37.5 (721) (792) (701) (692) (675) (686) (757)
Statistical Analysis
Categorical Difference . 2 (Base = No Guns) Hypothesls Model X df p Decision - Owns Gun 1) No difference d=0 731.5 7 <.001 2) Constant difference d=c 9.8 6 .131Accept
._
Final Model Owns Gun: d=22.4
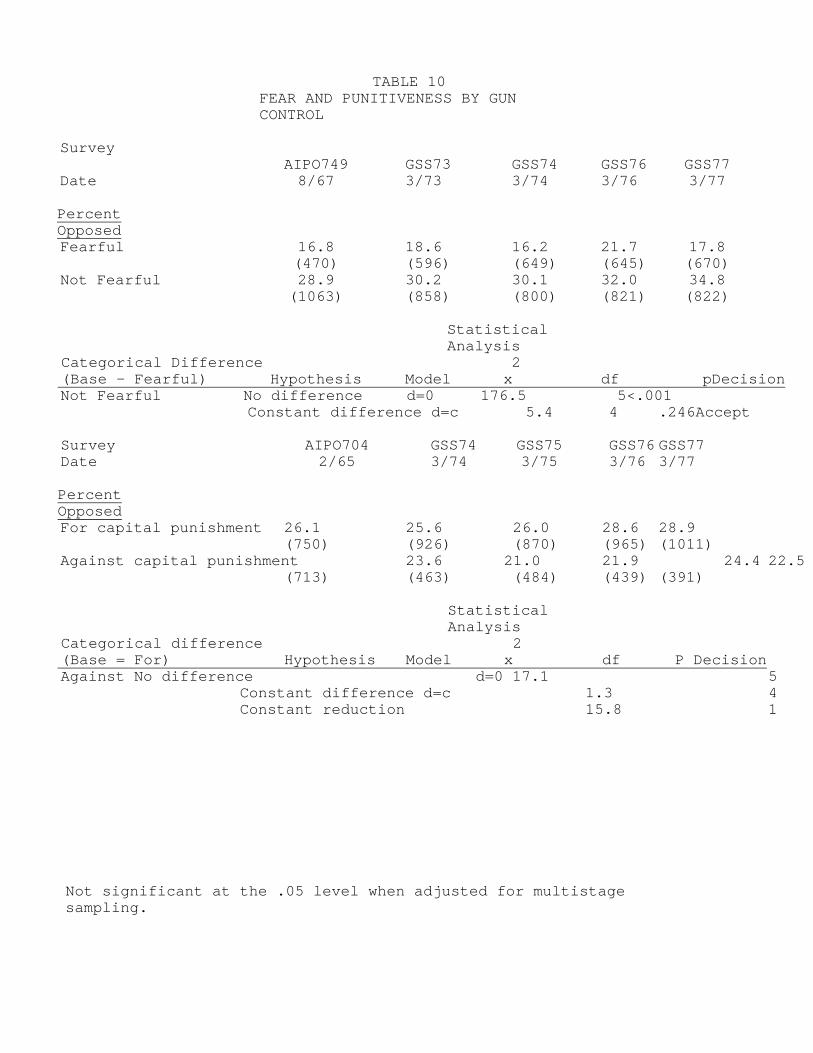
TABLE 10 FEAR AND PUNITIVENESS BY GUN CONTROL
Survey AIPO749 GSS73 GSS74 GSS76 GSS77 Date 8/67 3/73 3/74 3/76 3/77 Percent Opposed Fearful 16.8 18.6 16.2 21.7 17.8 (470) (596) (649) (645) (670) Not Fearful 28.9 30.2 30.1 32.0 34.8 (1063) (858) (800) (821) (822)
Statistical Analysis
Categorical Difference 2 (Base - Fearful) Hypothesis Model x df pDecision Not Fearful No difference d=0 176.5 5<.001
Constant difference d=c 5.4 4 .246 Accept Survey AIPO704 GSS74 GSS75 GSS76 GSS77 Date 2/65 3/74 3/75 3/76 3/77 Percent Opposed For capital punishment 26.1 25.6 26.0 28.6 28.9 (750) (926) (870) (965) (1011) Against capital punishment 23.6 21.0 21.9 24.4 22.5 (713) (463) (484) (439) (391)
Statistical Analysis
Categorical difference 2 (Base = For) Hypothesis Model x df P Decision Against No difference d=0 17.1 5
Constant difference d=c 1.3 4 Constant reduction 15.8 1
Not significant at the .05 level when adjusted for multistage sampling.
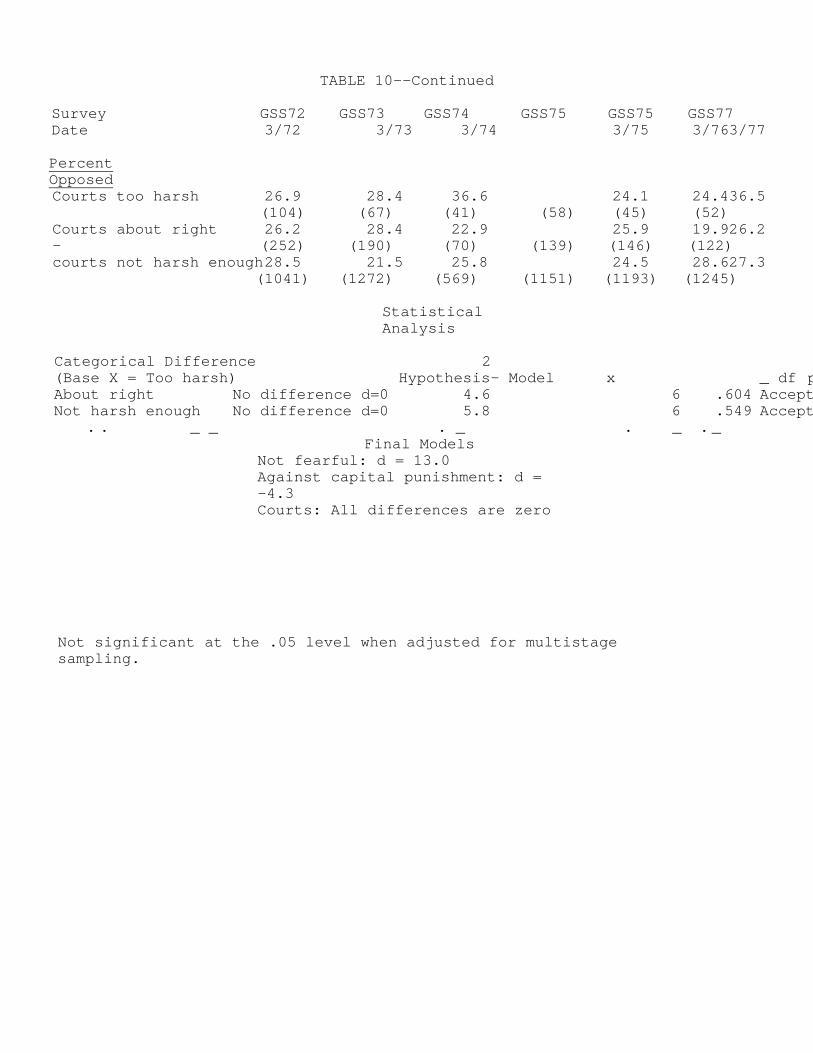
TABLE 10--Continued Survey GSS72 GSS73 GSS74 GSS75 GSS75 GSS77 Date 3/72 3/73 3/74 3/75 3/763/77 Percent Opposed Courts too harsh 26.9 28.4 36.6 24.1 24.436.5 (104) (67) (41) (58) (45) (52) Courts about right 26.2 28.4 22.9 25.9 19.926.2 - (252) (190) (70) (139) (146) (122) courts not harsh enough 28.5 21.5 25.8 24.5 28.627.3 (1041) (1272) (569) (1151) (1193) (1245)
Statistical Analysis
Categorical Difference 2 (Base X = Too harsh) Hypothesis- Model x _ df p About right No difference d=0 4.6 6 .604 Accept Not harsh enough No difference d=0 5.8 6 .549 Accept
. . _ _ . _ . _ . _ Final Models
Not fearful: d = 13.0 Against capital punishment: d = -4.3 Courts: All differences are zero
Not significant at the .05 level when adjusted for multistage sampling.

TABLE 11 OTHER GUN CONTROL MARGINALS
st~rvt~y AIP0117 AIP0182 AIP0616 AIP0704 AIP0733 AIP0749 AIPG AIP0937 HarriB Harriu Harrisg Harriu Gss76 SRC SRCj
[~.,~e 3/38 1/40 7/59 1/65 8/66 8/67 10/74 10/75 4/68 5/71 10/75 12/75 3/76 2/75 2/76 A R`~!er lia'~dgilris .16 Oppo6ed (n.d. ) 13. R :g ster Guns
()pposed . (2n. d . ) (31,°472) (J. Rescrict Handgr~ns .374 .471 .587 Opposed (1,451) (1,582) (1,447) I). A`~'nit ion Permit .426 .438 Opposeti (1,454) (1,602) 1:. I,un Control of Yot~ths
Contin~e as at present .123 .141 .161 .146 Fo'b i d use . 349 .289 .268 .317 (1,506) (1,642) (1,465) (1,600) 1:. KeeQ~ded C.lin
Legal .432 .533 (1,430) (1,564) 1: ~;istratlon of all Firearma Opposetf (n.8d. ) U. M`,bsach~lsetts CarryinR Perlai t
Opposed . 20 1. Sale t~f lland~uns (el511)
I.ess strict .03 More S tr i c t ( 17496) .1 Sale of l.ong Cunu
l.es8 strict .02 More strict .52 K. Federal Registratlon All (E1449) Cl~n P!lrcliases .24 .25 Opposed
1.................................................................................. C ontrol and ReRlstration of (n.d.) ................................................................................................................ll~nd Clins
Ol~posed
M. Federal Registration of lland Glins
N Rifle Permit (E1458) (E1416) Opposed . 31 O. No llarldRlins Tn If Igh C rime (E1458) Areas 53 Opposed
1' No lland Guns (E1372) Opposed . 61 (~. _rrender All Cuns (E1387) Opposed . 834 R. Per~Mt vs. Rlg.ht to Own (1,467) .327 .311 Opposed (431) (585)

Table 11--Continued
Erskine, Hazel, "The Polls - Gun Control," Public Opinion
QuarterlY, XXXVI (Fall, 1976), 455-469.
The Gallup Poll, May 1, 1938.
The Gallup Opinion Index, Report No 113 (Nov., 1974).
The Gallup Poll; October 30, 1975 and The Gallup Opinion
Index, Report No. 129 (April 1976), 22-28.
eSee note a.
The Harris Survev, June 3, 1971.
e Harris SurveY, Oct. 27, 1975.
The Harris Survey, Dec. 29, 1975.
Schuman, Howard and Presser, Stankey, "Attitude Measurement and
the -Gun Control Paradox," Public Opinion Quarterly, XLI (Winter, 1977-78), 42'-438.
hIbid.
E ~ Estimated number of cases. n.d = no data.
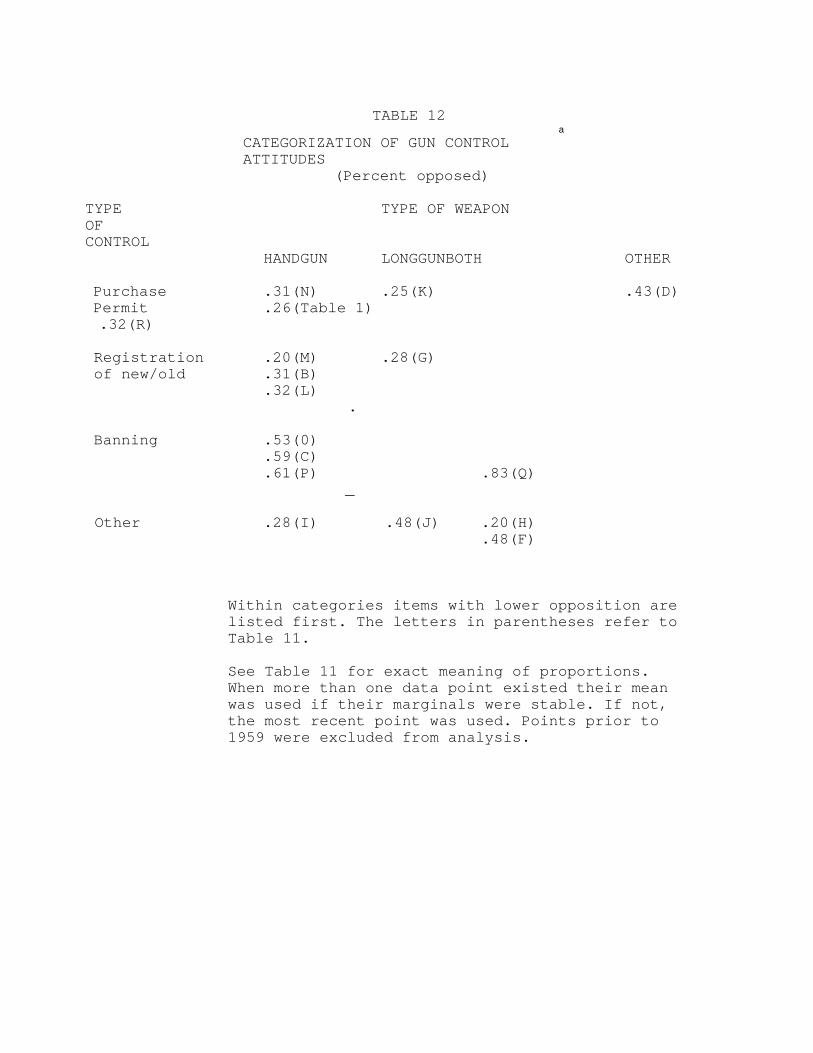
TABLE 12 a
CATEGORIZATION OF GUN CONTROL ATTITUDES
(Percent opposed) TYPE TYPE OF WEAPON OF CONTROL HANDGUN LONGGUNBOTH OTHER Purchase .31(N) .25(K) .43(D) Permit .26(Table 1) .32(R)
Registration .20(M) .28(G) of new/old .31(B) .32(L)
. Banning .53(0) .59(C) .61(P) .83(Q)
_ Other .28(I) .48(J) .20(H) .48(F)
Within categories items with lower opposition are listed first. The letters in parentheses refer to Table 11.
See Table 11 for exact meaning of proportions. When more than one data point existed their mean was used if their marginals were stable. If not, the most recent point was used. Points prior to 1959 were excluded from analysis.

Table 13 GUTTMAN SCALING OF FOUR GUN CONTROL ITEMS
=
Police Gun Handgun Gun N Permit _ Registration _ Ban Confiscation YES YES YES YES 209 YES YES YES NO 255 YES YES NO NO 366 YES NO NO NO 110 NO NO NO NO 246
1,186 on scale=85.1' NO YES YES YES 9 NO NO YES YES 2 YES NO YES YES 6 YES YES NO YES 9 NO NO NO YES 1 NO YES NO NO 93 YES NO YES NO 43 NO YES YES NO 22 NO NO YES NO 21
208 off-scale~14.' Coefficient of Reproducibility = .925 Coefficient of Scalability = .742
Scaling of Gun Registration Police Permit Police Permit Handgun Ban Handgun Ban Gun Confiscation Gun Confiscation Coefficient of Reproducibility .919 .969 Coefficient of Scalability .722 .891 .864

APPENDrX A: QUESTION WORDING 1. GUN PERMIT (TABLE 1)
Would you favor or oppose a law which would require a person to obtain a police permit before he or she could buy a gun? Note: The two SRC surveys omit "or she."
2. REGISTER HANDGUNS (TABLE 11-A)
Do you think all owners of pistols and revolvers should be required to register with the government?
3. REGISTER GUNS (TABLE 11-B)
Would you favor or oppose a law requiring all private citizens owning pistols or guns to register with the government? (AIPO 128)
Would you favor or oppose a law requiring all private citizens owning guns to register with the government? (GSS76)
4. RESTRICT HANDGUNS (TABLE 11-C)
What about the possession of pistols and revolvers -- Do you think there should be a law which forbid the possession of this type of gun except by the police or other authorized persons?
5. AMMUNITION PERMIT (TABLE 11-D)
Would you favor or oppose a law which would require a police permit for the purchase of gun shells or ammunition?
6. GUN CONTROL OF YOUTHS (TABLE 11-E)
Which of these three plans would you prefer for the use of guns by persons under the age of 18 -- forbid their use completely, put strict regulations on their use, or continue as at present with few regulations?
7. KEEP LOADED GUN (TABLE ll-F)
Do you think it should be legal or illegal for private citizens to have loaded weapons in their homes?
8. REGISTRATION OF ALL FIREARMS (TABLE 11-G)
Suppose that on election day, November 5, you could vote on key issues as well as candidates. Please tell me how you would vote on each of these 14 propositions.
PROPOSITION
9 ~ REGISTRATION OF ALL FIREARMS SHOULD BE REQUIRED.
GUN G REGISTRATION OF ALL FIREARMS SHOULD NOT BE REQUIRED.
REGULATION

9. MASSACHUSETTS CARRYING PERMIT (TABLE 11-H)
In Massachusetts a law requires that a person who carries a gun outside his home must have a license to do so. Would you approve or disapprove such a law in your state? ~ _ ELF APPROVER Under the Massachusetts law, anyone who is convicted of carrying a gun outside his home without having obtained a license is sentenced to a mandatory year in jail. Would you approve or disapprove of this?
10. SALE OF HANDGUNS (TABLE 11-I)
In general, do you feel that the laws covering the sale of handguns should be made more strict, less strict, or kept as they are now?
11. SALE OF LONGGUNS (TABLE 11-J)
In general, do you feel that the laws covering the sale of rifles and shotguns should be made more strict, made less strict, or kept as they are now?
12. FEDERAL REGISTRATION OF ALL FIREARMS (TABLE ll-K)
Do you favor or oppose federal laws which would control the sale of guns, such as making all persons register all gun purchases no matter where they buy them?
13. CONTROL AND REGISTRATION OF HANDGUNS (TABLE ll-L)
Do you favor or oppose Congress passing a law requiring strict control and registration of all handguns?
14. FEDERAL REGISTRATION OF HANDGUNS (TABLE 11-M)
Do you favor or oppose a federal law requiring that all handguns people own be registered with federal authorities?
15. RIFLE PERMIT (TABLE ll-N)
Do you feel a permit should be required by law in order for anyone to purchase a rifle, or do you think such a permit is not necessary?
16. NO HANDGUNS IN HIGH CRIME AREAS (TABLE 11-O)
Would you favor or oppose a federal law that banned ownership of all handguns in high crime areas?
17. NO HANDGUNS (TABLE 11-P)
Would you favor or oppose a federal law that banned the ownership of all handguns by private citizens?

18. SURRENDER ALL GUNS (TABLE 11-o~)
Would you favor or oppose a law requiring private citizens to surrender all guns to the government?
19. PERMIT VS. RIGHT TO OWN (TABLE 11-R)
Would you favor a law which would require a person to obtain a police permit before he could buy a gun, or do you think such a law would interfere too much with the rights of citizens to own guns?

References American Enterprise Institute for Public Policy
1976 Gun Control, Legislative Analysis Number 9, 94th Congress, Washington, D.C.: American Enterprise Institute.
Bakal, Carl
1966 The Right to Bear Arms (New York: McGraw-Hill). Davis, James A.
1975 "Analyzing Contingency Tables with Linear Flow Graphs: D Systems," in Sociological Methodology, edited by David Heise, (San Francisco: Jossey-Bass).
Defensor, H. Charles
1970 Gun Registration Now-Confiscation Later? (New York: Vantage Press).
Kennett, Lee and James LaVerne Anderson
1975 The Gun in America: The Origins of a National Dilemma. Contributions in American History, Number 37, (Westport, Connecticut: Greenwood Press).
Mueller, John E.
1973 War, Presidents, and Public Opinion (New York: Wiley). Murray, Douglas R.
1975 "Handguns, Gun Control Laws, and Firearm Violence," Social Problems, XXXIII (October), 81-92.
O'Connor, James F. and Alan Lizotte
1978 "The 'Southern Subculture of Violence' Thesis and Patterns of Gun Ownership," Social Problems, XXV (April), 420-429.

Schuman, Howard and Stanley Presser
1977- "Attitude Measurement and the Gun Control Paradox,": Public 1978
Opinion Quarterly, XLI (Winter), 427-438.
Sherill, Robert
1973 The Saturday Night Special. (New York: Penguin). Smith, Tom W.
1976 "A Trend Analysis of Attitudes Toward Capital Punishment,
1936-1974~" in Studies of Social Change Since 1948, edited
by James A. Davis, NORC Report Number 127B, Chicago: NORC.
Stinchcombe, Arthur L., Rebecca Adams, Carol Heimer, Kim Scheppele, Tom W. Smith, and D. Garth Taylor
Forth- Crime and Punishment in Public Opinion: 1948-1974, National
coming Opinion Research Center Monographs in Social Research,
San Francisco: Jossey-Bass.
Taylor, D. Garth
1976 "Procedures for Evaluating Trends in Qualitative Measures,"
in Studies of Social Change Since 1948, edited by James A.
Davis, NORC Report 127A, Chicago: NORC.
Wright, James D. and Linda L. Marston
1975 "The Ownership of the Means of Destruction: Weapons in the
United States," Social Problems, XXXIII (October).
Zimring, Franklin E.
1975 "Firearms and Federal Law: The Gun Control Act of 1968,"
Journal of Legal Studies, IV (January), 133-198.