The 2016 Core Facility Benchmarking Study - Agilent · The 2016 Core Facility Benchmarking Study...
24
Agilent Technologies, Inc 5301 Stevens Creek Blvd. Santa Clara, CA 95051 United States September 22, 2016 . Page 1 of 24 © Agilent Technologies, Inc. 2016 The 2016 Core Facility Benchmarking Study Conducted by iLab Solutions, part of Agilent Technologies September 22, 2016 For additional information, please contact iLab Solutions at [email protected]
Transcript of The 2016 Core Facility Benchmarking Study - Agilent · The 2016 Core Facility Benchmarking Study...
Agilent Technologies, Inc
5301 Stevens Creek Blvd.
Santa Clara, CA 95051
United States
September 22, 2016 . Page 1 of 24
© Agilent Technologies, Inc. 2016
The 2016 Core Facility Benchmarking Study Conducted by iLab Solutions, part of Agilent Technologies
September 22, 2016 For additional information, please contact iLab Solutions at [email protected]
cravens1
Stamp
Agilent Technologies, Inc
5301 Stevens Creek Blvd.
Santa Clara, CA 95051
United States
September 22, 2016 Page 2 of 24
© Agilent Technologies, Inc. 2016
Table of Contents
Introduction .......................................................................................................................... 3
Distribution ........................................................................................................................... 5
Results of Multiple Choice and Quantitative Questions .......................................................... 6
Summary of Results ............................................................................................................. 16
About iLab ........................................................................................................................... 18
Appendix A (Details of Open-Ended Survey Responses) ........................................................ 19
Agilent Technologies, Inc
5301 Stevens Creek Blvd.
Santa Clara, CA 95051
United States
September 22, 2016 Page 3 of 24
© Agilent Technologies, Inc. 2016
Introduction iLab Solutions, part of Agilent Technologies conducted its 6th annual Core Facility Benchmarking study in the first half of 2016. There were 282 responses representing over 50 different core types from 156 institutions. The surveyed individuals directly manage cores, service centers, shared facilities, and recharge centers at hospitals, universities, and research institutions. For this report, “cores” is the general term used when referring to all of these facility types. This study is conducted annually in an effort to provide a better understanding of how core facilities operate, focusing on core growth and utilization, as well as the common challenges core managers face today.
Of those surveyed, 54% of cores experienced growth in the number of customers in 2015; this is
a 3% higher growth rate than in 2014.
In 2015, 52% of core income came from customer revenue, the same as the past two years;
revenue from institutional support was 30%, 1% higher than 2014. This is the second year showing
evidence of growth in institutional support.
In 2015, core managers said they spent approximately 46 hours per month serving the customer,
a 3 hour increase from 2014, whereas they only spent about 12 hours per month on independent
research. This continues last year’s trend, though to a lesser degree; core managers reported
spending 15 hours per month on independent research in 2014, and 25 in 2013.
In 2015, managers who used electronic systems for administrative tasks spent an average of
seven hours fewer per month on these activities compared to those who use other means, such
as manual entry and spreadsheets.
84% of cores charge different pricing for varying customer types (e.g., internal, external,
corporate); this is a 5% decrease compared to last year’s survey.
As with previous years, in 2015 most services performed by cores were for internal customers
(73%); this number has increased by about 5% from the previous year. The numbers for external
academic remained nearly the same this year (12%), whereas work for those with special
academic relationships and external corporate customers fell, breaking the trend (14% to 9% and
7% to 5%, respectively).
Of cores surveyed, 66% said they adjust their rates annually, 26% adjust their rates at other time
increments, and 8% said they have never adjusted their rates.
Agilent Technologies, Inc
5301 Stevens Creek Blvd.
Santa Clara, CA 95051
United States
September 22, 2016 Page 4 of 24
© Agilent Technologies, Inc. 2016
56% of cores said there was no tenure for core personnel at their institution, 27% said core
directors have tenure, 7% said core managers have tenure, 6% of cores surveyed said technicians
have tenure, and another 3% reported having other personnel eligible for tenure.
The average number of PIs or customer labs served in 2015 is 11.67 per core FTE, up from 7.62 in
2014.
The following were cited as the top challenges for core managers:
o Acquiring funding & managing the budget
o Managing workload and having enough time to get the work done
o The administrative duties of managing the core
These top challenges are the same as last year’s. Additional challenges mentioned involve dealing with administration, sustainability, customer management, equipment management, institutional support, personnel management, customer recruitment, proper resources, increasing usage, and staying relevant.
The following pages provide an analysis of the data collected.
Agilent Technologies, Inc
5301 Stevens Creek Blvd.
Santa Clara, CA 95051
United States
September 22, 2016 Page 5 of 24
© Agilent Technologies, Inc. 2016
Distribution
iLab distributed the survey in early
February, 2015 to core managers and
directors at hospitals, universities and
research institutes. During this time,
iLab also distributed the survey through
press release listing sites, social media
sites, and its corporate website.
Furthermore, institution administrators
who became aware of the survey sent
the survey to their institution core
managers. The survey was open for 15
weeks. All data was compiled and the
averages are presented in the following
pages. The conclusions presented here
may not represent any single core.
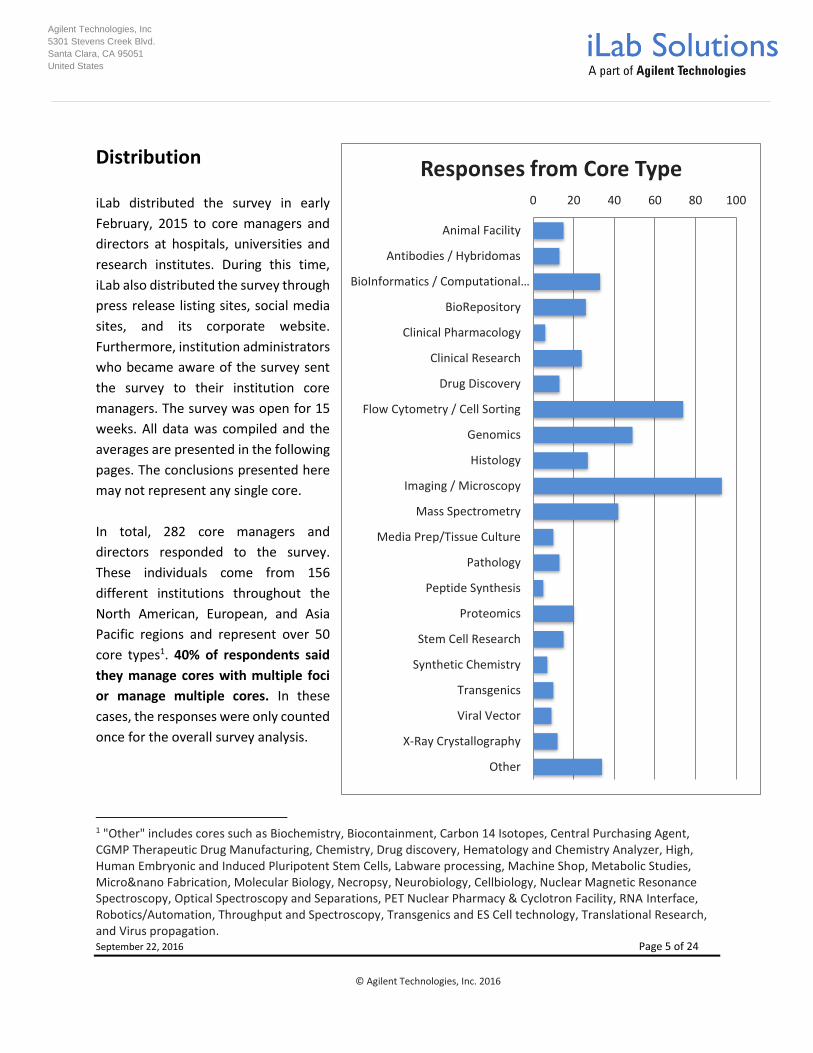
In total, 282 core managers and
directors responded to the survey.
These individuals come from 156
different institutions throughout the
North American, European, and Asia
Pacific regions and represent over 50
core types1. 40% of respondents said
they manage cores with multiple foci
or manage multiple cores. In these
cases, the responses were only counted
once for the overall survey analysis.
1 "Other" includes cores such as Biochemistry, Biocontainment, Carbon 14 Isotopes, Central Purchasing Agent, CGMP Therapeutic Drug Manufacturing, Chemistry, Drug discovery, Hematology and Chemistry Analyzer, High, Human Embryonic and Induced Pluripotent Stem Cells, Labware processing, Machine Shop, Metabolic Studies, Micro&nano Fabrication, Molecular Biology, Necropsy, Neurobiology, Cellbiology, Nuclear Magnetic Resonance Spectroscopy, Optical Spectroscopy and Separations, PET Nuclear Pharmacy & Cyclotron Facility, RNA Interface, Robotics/Automation, Throughput and Spectroscopy, Transgenics and ES Cell technology, Translational Research, and Virus propagation.
0 20 40 60 80 100
Animal Facility
Antibodies / Hybridomas
BioInformatics / Computational…
BioRepository
Clinical Pharmacology
Clinical Research
Drug Discovery
Flow Cytometry / Cell Sorting
Genomics
Histology
Imaging / Microscopy
Mass Spectrometry
Media Prep/Tissue Culture
Pathology
Peptide Synthesis
Proteomics
Stem Cell Research
Synthetic Chemistry
Transgenics
Viral Vector
X-Ray Crystallography
Other
Responses from Core Type
Agilent Technologies, Inc
5301 Stevens Creek Blvd.
Santa Clara, CA 95051
United States
September 22, 2016 Page 6 of 24
© Agilent Technologies, Inc. 2016
Results of Multiple Choice and Quantitative Questions
CUSTOMER GROWTH
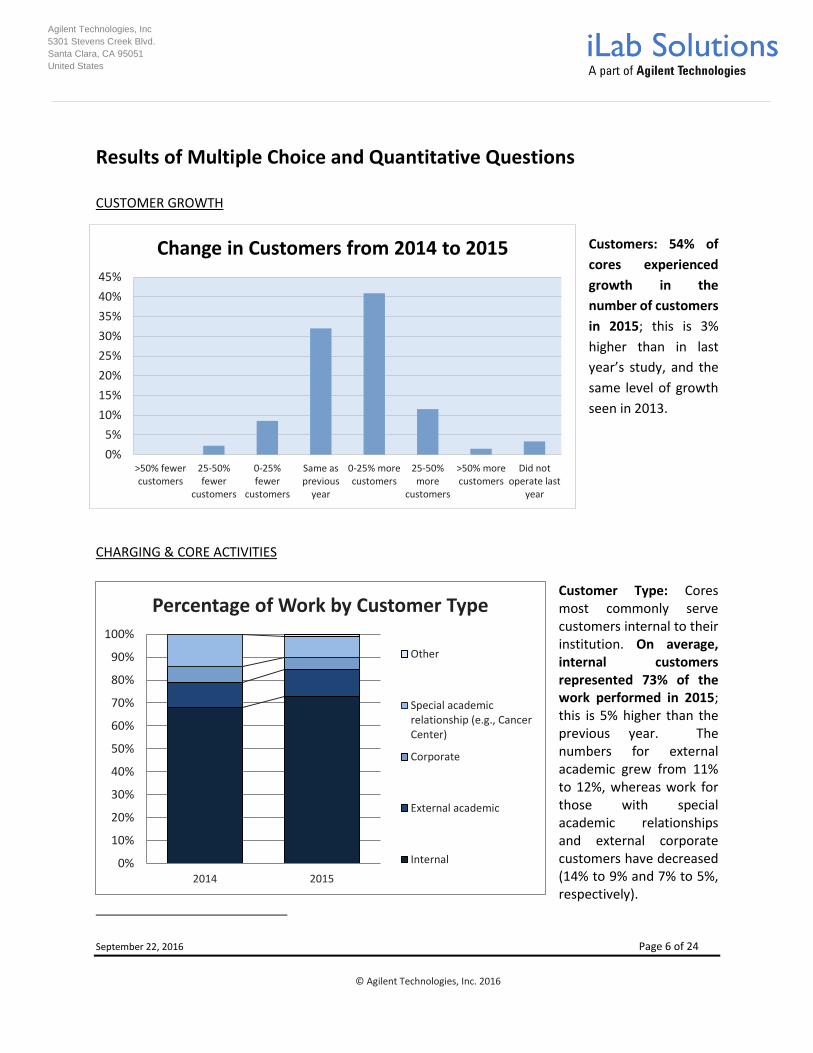
Customers: 54% of
cores experienced
growth in the
number of customers
in 2015; this is 3%
higher than in last
year’s study, and the
same level of growth
seen in 2013.
CHARGING & CORE ACTIVITIES
Customer Type: Cores most commonly serve customers internal to their institution. On average, internal customers represented 73% of the work performed in 2015; this is 5% higher than the previous year. The numbers for external academic grew from 11% to 12%, whereas work for those with special academic relationships and external corporate customers have decreased (14% to 9% and 7% to 5%, respectively).
0%
10%
20%
30%
40%
50%
60%
70%
80%
90%
100%
2014 2015
Percentage of Work by Customer Type
Other
Special academicrelationship (e.g., CancerCenter)
Corporate
External academic
Internal
0%
5%
10%
15%
20%
25%
30%
35%
40%
45%
>50% fewercustomers
25-50%fewer
customers
0-25%fewer
customers
Same asprevious
year
0-25% morecustomers
25-50%more
customers
>50% morecustomers
Did notoperate last
year
Change in Customers from 2014 to 2015
Agilent Technologies, Inc
5301 Stevens Creek Blvd.
Santa Clara, CA 95051
United States
September 22, 2016 Page 7 of 24
© Agilent Technologies, Inc. 2016
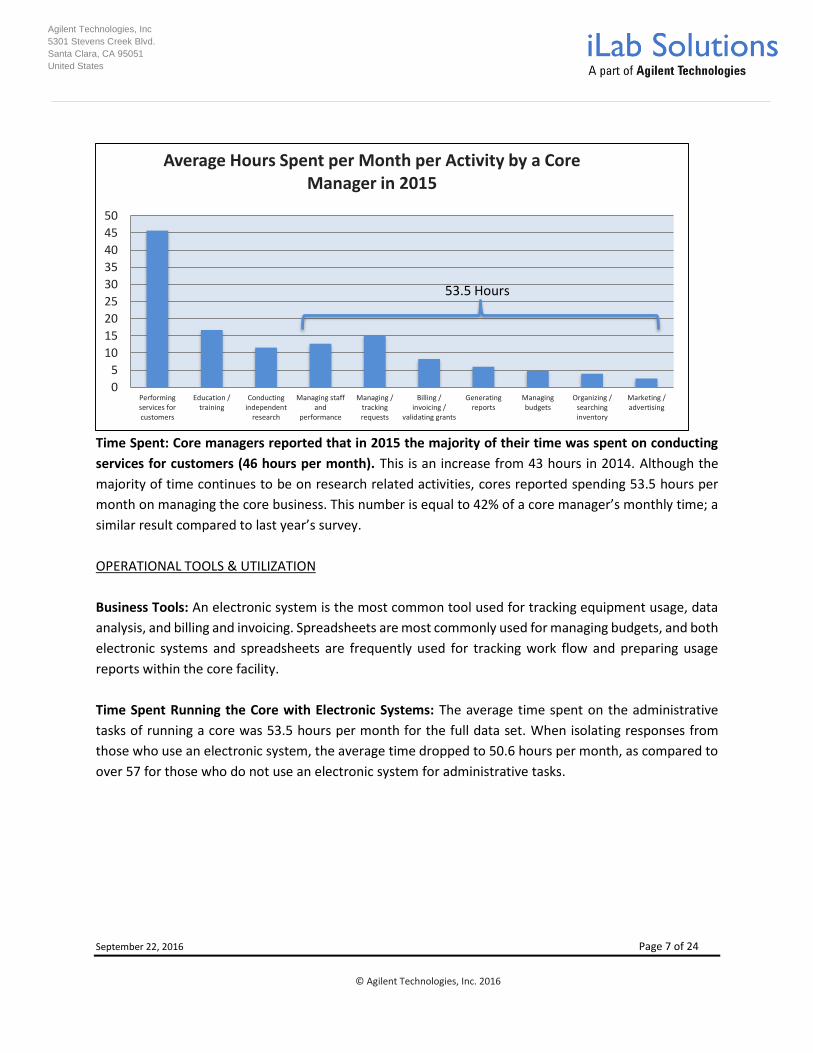
Time Spent: Core managers reported that in 2015 the majority of their time was spent on conducting
services for customers (46 hours per month). This is an increase from 43 hours in 2014. Although the
majority of time continues to be on research related activities, cores reported spending 53.5 hours per
month on managing the core business. This number is equal to 42% of a core manager’s monthly time; a
similar result compared to last year’s survey.
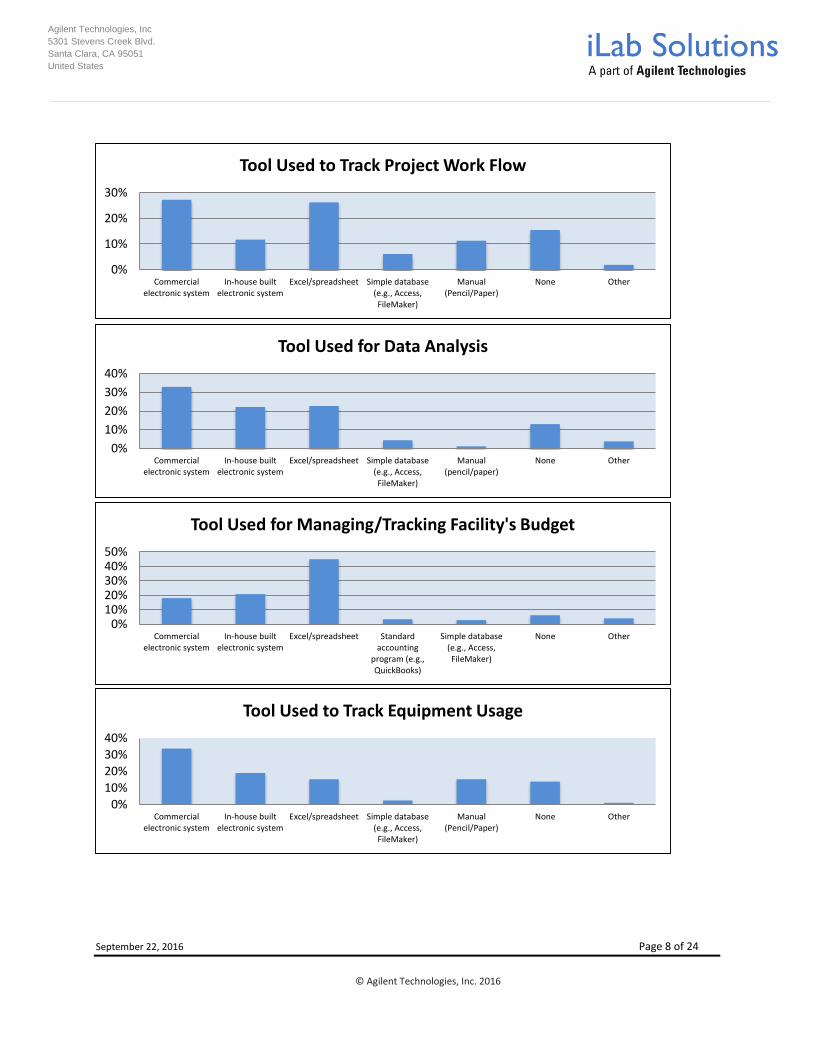
OPERATIONAL TOOLS & UTILIZATION
Business Tools: An electronic system is the most common tool used for tracking equipment usage, data
analysis, and billing and invoicing. Spreadsheets are most commonly used for managing budgets, and both
electronic systems and spreadsheets are frequently used for tracking work flow and preparing usage
reports within the core facility.
Time Spent Running the Core with Electronic Systems: The average time spent on the administrative
tasks of running a core was 53.5 hours per month for the full data set. When isolating responses from
those who use an electronic system, the average time dropped to 50.6 hours per month, as compared to
over 57 for those who do not use an electronic system for administrative tasks.
0
5
10
15
20
25
30
35
40
45
50
Performingservices forcustomers
Education /training
Conductingindependent
research
Managing staffand
performance
Managing /trackingrequests
Billing /invoicing /
validating grants
Generatingreports
Managingbudgets
Organizing /searchinginventory
Marketing /advertising
Average Hours Spent per Month per Activity by a Core Manager in 2015
53.5 Hours
Agilent Technologies, Inc
5301 Stevens Creek Blvd.
Santa Clara, CA 95051
United States
September 22, 2016 Page 8 of 24
© Agilent Technologies, Inc. 2016
0%
10%
20%
30%
Commercialelectronic system
In-house builtelectronic system
Excel/spreadsheet Simple database(e.g., Access,FileMaker)
Manual(Pencil/Paper)
None Other
Tool Used to Track Project Work Flow
0%
10%
20%
30%
40%
Commercialelectronic system
In-house builtelectronic system
Excel/spreadsheet Simple database(e.g., Access,FileMaker)
Manual(pencil/paper)
None Other
Tool Used for Data Analysis
0%10%20%30%40%50%
Commercialelectronic system
In-house builtelectronic system
Excel/spreadsheet Standardaccounting
program (e.g.,QuickBooks)
Simple database(e.g., Access,FileMaker)
None Other
Tool Used for Managing/Tracking Facility's Budget
0%
10%
20%
30%
40%
Commercialelectronic system
In-house builtelectronic system
Excel/spreadsheet Simple database(e.g., Access,FileMaker)
Manual(Pencil/Paper)
None Other
Tool Used to Track Equipment Usage
Agilent Technologies, Inc
iLab Solutions
Ten Post Office Square
Floor 8
Boson, MA 02109
September 22, 2016 . Page 9 of 24
© Agilent Technologies, Inc. 2016
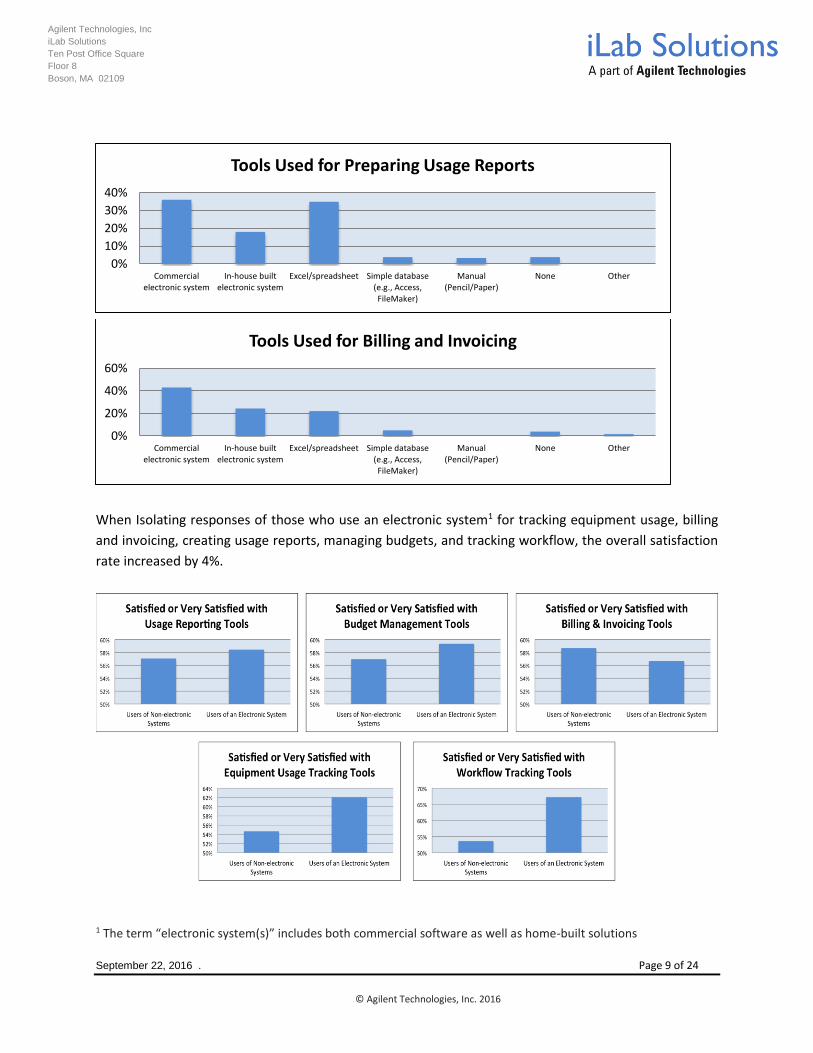
When Isolating responses of those who use an electronic system1 for tracking equipment usage, billing
and invoicing, creating usage reports, managing budgets, and tracking workflow, the overall satisfaction
rate increased by 4%.
1 The term “electronic system(s)” includes both commercial software as well as home-built solutions
0%
10%
20%
30%
40%
Commercialelectronic system
In-house builtelectronic system
Excel/spreadsheet Simple database(e.g., Access,FileMaker)
Manual(Pencil/Paper)
None Other
Tools Used for Preparing Usage Reports
0%
20%
40%
60%
Commercialelectronic system
In-house builtelectronic system
Excel/spreadsheet Simple database(e.g., Access,FileMaker)
Manual(Pencil/Paper)
None Other
Tools Used for Billing and Invoicing
Agilent Technologies, Inc
5301 Stevens Creek Blvd.
Santa Clara, CA 95051
United States
September 22, 2016 Page 10 of 24
© Agilent Technologies, Inc. 2016
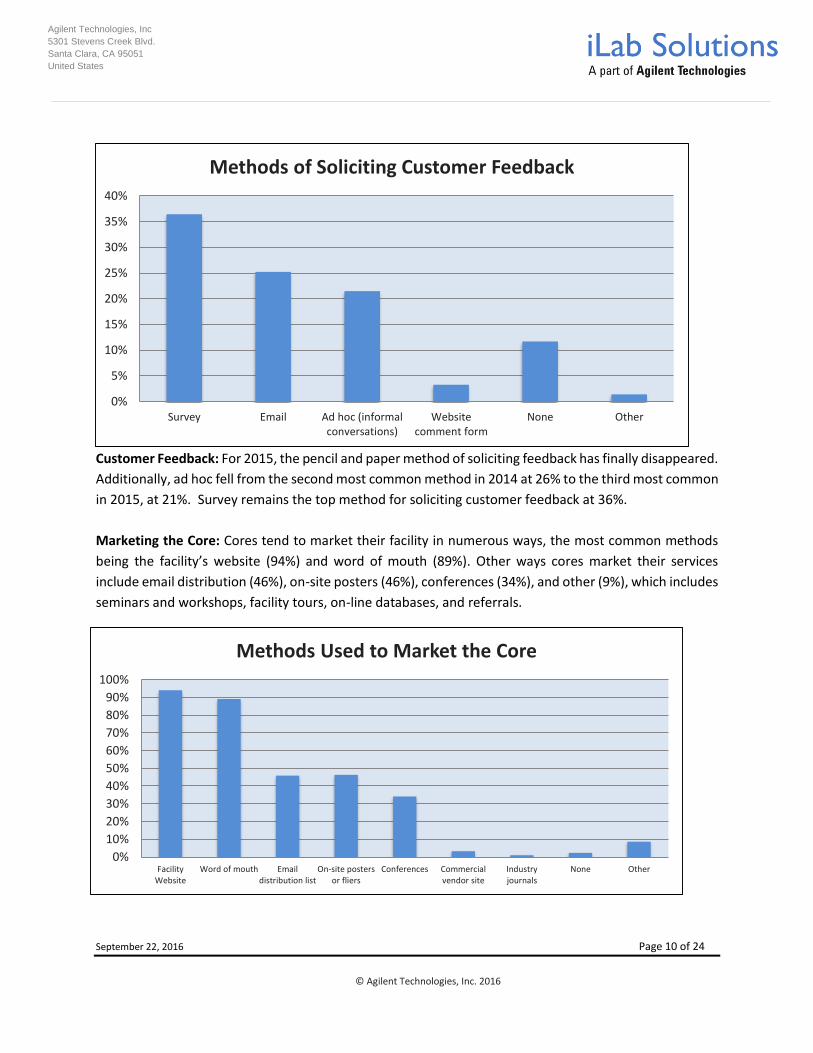
Customer Feedback: For 2015, the pencil and paper method of soliciting feedback has finally disappeared.
Additionally, ad hoc fell from the second most common method in 2014 at 26% to the third most common
in 2015, at 21%. Survey remains the top method for soliciting customer feedback at 36%.
Marketing the Core: Cores tend to market their facility in numerous ways, the most common methods
being the facility’s website (94%) and word of mouth (89%). Other ways cores market their services
include email distribution (46%), on-site posters (46%), conferences (34%), and other (9%), which includes
seminars and workshops, facility tours, on-line databases, and referrals.
0%
5%
10%
15%
20%
25%
30%
35%
40%
Survey Email Ad hoc (informalconversations)
Websitecomment form
None Other
Methods of Soliciting Customer Feedback
0%
10%
20%
30%
40%
50%
60%
70%
80%
90%
100%
FacilityWebsite
Word of mouth Emaildistribution list
On-site postersor fliers
Conferences Commercialvendor site
Industryjournals
None Other
Methods Used to Market the Core
Agilent Technologies, Inc
5301 Stevens Creek Blvd.
Santa Clara, CA 95051
United States
September 22, 2016 Page 11 of 24
© Agilent Technologies, Inc. 2016
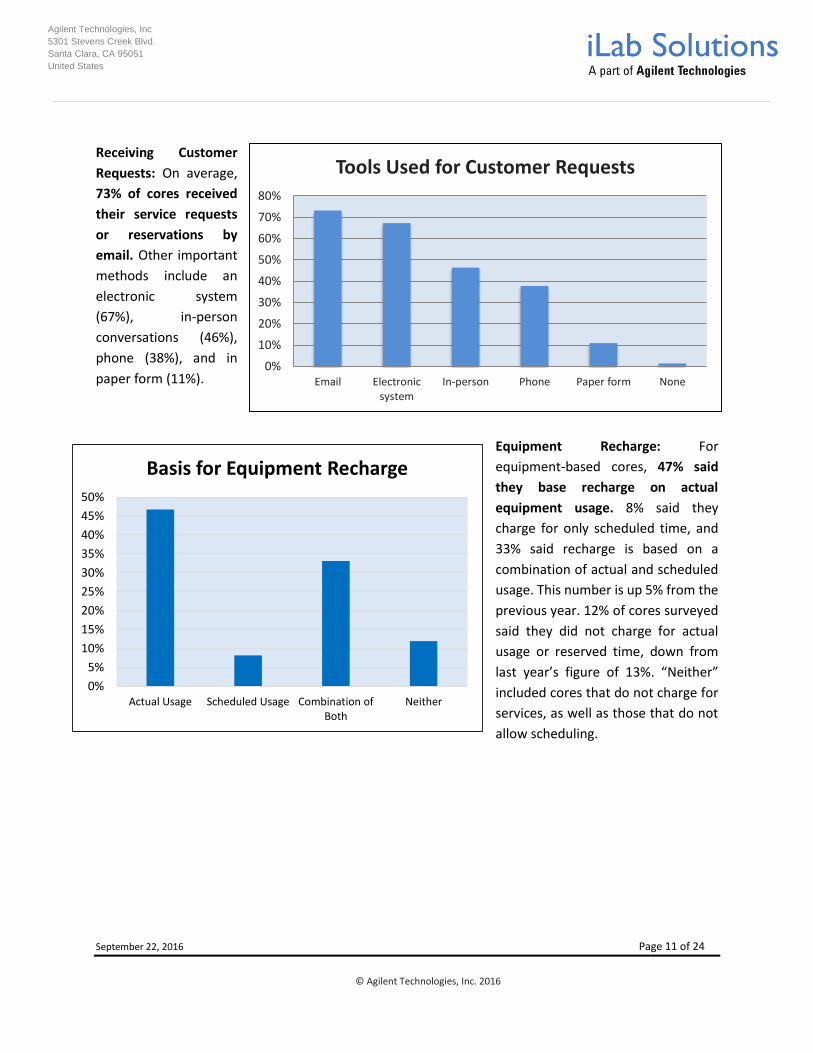
Receiving Customer
Requests: On average,
73% of cores received
their service requests
or reservations by
email. Other important
methods include an
electronic system
(67%), in-person
conversations (46%),
phone (38%), and in
paper form (11%).
Equipment Recharge: For
equipment-based cores, 47% said
they base recharge on actual
equipment usage. 8% said they
charge for only scheduled time, and
33% said recharge is based on a
combination of actual and scheduled
usage. This number is up 5% from the
previous year. 12% of cores surveyed
said they did not charge for actual
usage or reserved time, down from
last year’s figure of 13%. “Neither”
included cores that do not charge for
services, as well as those that do not
allow scheduling.
0%
10%
20%
30%
40%
50%
60%
70%
80%
Email Electronicsystem
In-person Phone Paper form None
Tools Used for Customer Requests
0%
5%
10%
15%
20%
25%
30%
35%
40%
45%
50%
Actual Usage Scheduled Usage Combination ofBoth
Neither
Basis for Equipment Recharge
Agilent Technologies, Inc
5301 Stevens Creek Blvd.
Santa Clara, CA 95051
United States
September 22, 2016 Page 12 of 24
© Agilent Technologies, Inc. 2016
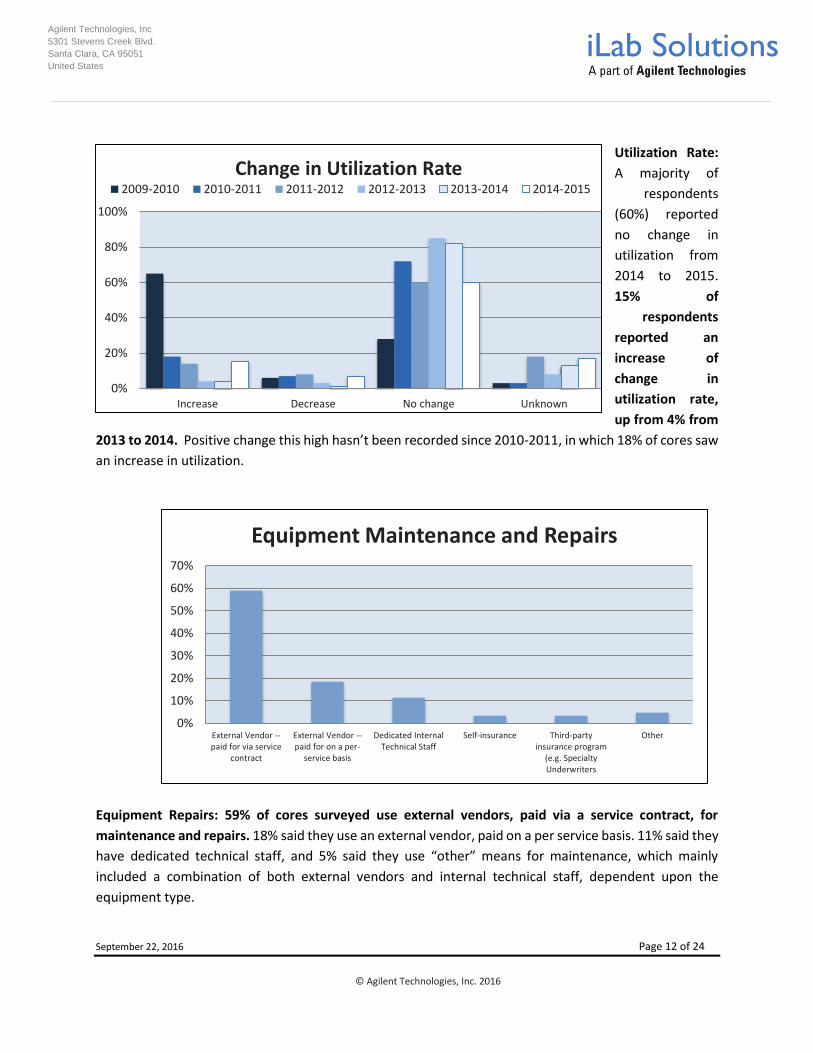
Utilization Rate:
A majority of
respondents
(60%) reported
no change in
utilization from
2014 to 2015.
15% of
respondents
reported an
increase of
change in
utilization rate,
up from 4% from
2013 to 2014. Positive change this high hasn’t been recorded since 2010-2011, in which 18% of cores saw
an increase in utilization.
Equipment Repairs: 59% of cores surveyed use external vendors, paid via a service contract, for
maintenance and repairs. 18% said they use an external vendor, paid on a per service basis. 11% said they
have dedicated technical staff, and 5% said they use “other” means for maintenance, which mainly
included a combination of both external vendors and internal technical staff, dependent upon the
equipment type.
0%
20%
40%
60%
80%
100%
Increase Decrease No change Unknown
Change in Utilization Rate2009-2010 2010-2011 2011-2012 2012-2013 2013-2014 2014-2015
0%
10%
20%
30%
40%
50%
60%
70%
External Vendor --paid for via service
contract
External Vendor --paid for on a per-
service basis
Dedicated InternalTechnical Staff
Self-insurance Third-partyinsurance program
(e.g. SpecialtyUnderwriters
Other
Equipment Maintenance and Repairs
Agilent Technologies, Inc
5301 Stevens Creek Blvd.
Santa Clara, CA 95051
United States
September 22, 2016 Page 13 of 24
© Agilent Technologies, Inc. 2016
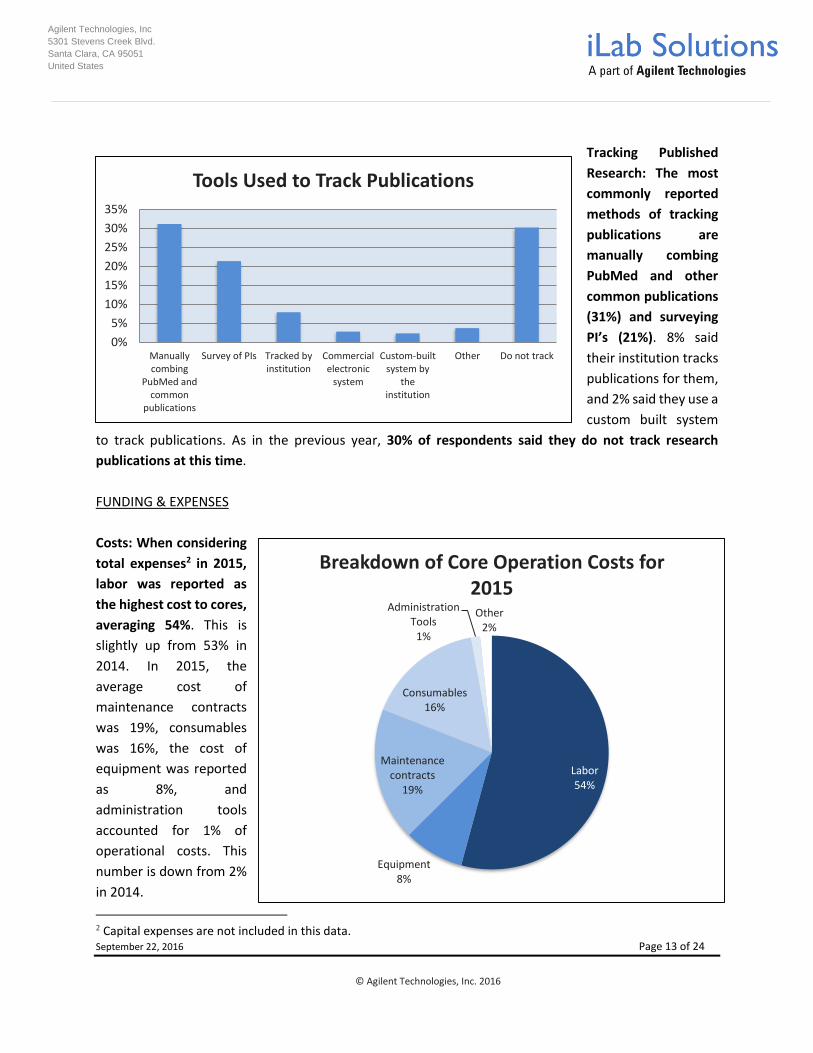
Tracking Published
Research: The most
commonly reported
methods of tracking
publications are
manually combing
PubMed and other
common publications
(31%) and surveying
PI’s (21%). 8% said
their institution tracks
publications for them,
and 2% said they use a
custom built system
to track publications. As in the previous year, 30% of respondents said they do not track research
publications at this time.
FUNDING & EXPENSES
Costs: When considering
total expenses2 in 2015,
labor was reported as
the highest cost to cores,
averaging 54%. This is
slightly up from 53% in
2014. In 2015, the
average cost of
maintenance contracts
was 19%, consumables
was 16%, the cost of
equipment was reported
as 8%, and
administration tools
accounted for 1% of
operational costs. This
number is down from 2%
in 2014.
2 Capital expenses are not included in this data.
0%
5%
10%
15%
20%
25%
30%
35%
Manuallycombing
PubMed andcommon
publications
Survey of PIs Tracked byinstitution
Commercialelectronic
system
Custom-builtsystem by
theinstitution
Other Do not track
Tools Used to Track Publications
Labor54%
Equipment8%
Maintenance contracts
19%
Consumables16%
Administration Tools
1%
Other2%
Breakdown of Core Operation Costs for 2015
Agilent Technologies, Inc
5301 Stevens Creek Blvd.
Santa Clara, CA 95051
United States
September 22, 2016 Page 14 of 24
© Agilent Technologies, Inc. 2016
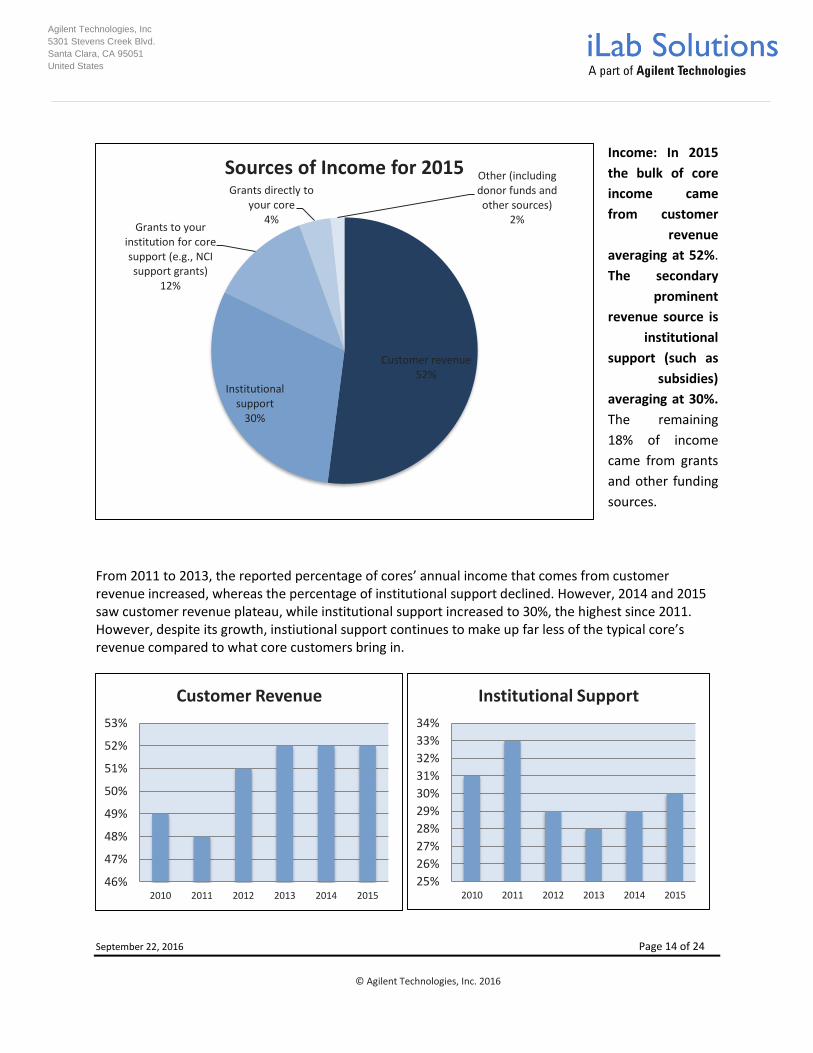
Income: In 2015
the bulk of core
income came
from customer
revenue
averaging at 52%.
The secondary
prominent
revenue source is
institutional
support (such as
subsidies)
averaging at 30%.
The remaining
18% of income
came from grants
and other funding
sources.
From 2011 to 2013, the reported percentage of cores’ annual income that comes from customer revenue increased, whereas the percentage of institutional support declined. However, 2014 and 2015 saw customer revenue plateau, while institutional support increased to 30%, the highest since 2011. However, despite its growth, instiutional support continues to make up far less of the typical core’s revenue compared to what core customers bring in.
46%
47%
48%
49%
50%
51%
52%
53%
2010 2011 2012 2013 2014 2015
Customer Revenue
25%
26%
27%
28%
29%
30%
31%
32%
33%
34%
2010 2011 2012 2013 2014 2015
Institutional Support
Customer revenue52%
Institutional support
30%
Grants to your institution for core support (e.g., NCI support grants)
12%
Grants directly to your core
4%
Other (including donor funds and other sources)
2%
Sources of Income for 2015
Agilent Technologies, Inc
5301 Stevens Creek Blvd.
Santa Clara, CA 95051
United States
September 22, 2016 Page 15 of 24
© Agilent Technologies, Inc. 2016
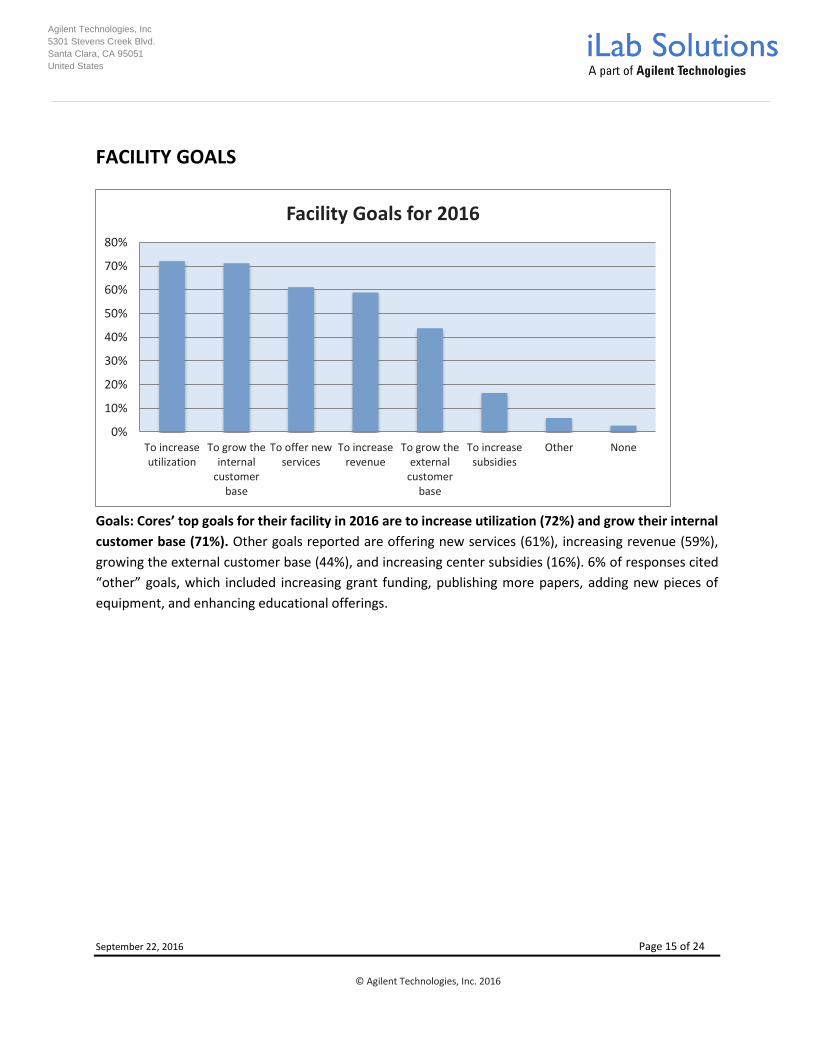
FACILITY GOALS
Goals: Cores’ top goals for their facility in 2016 are to increase utilization (72%) and grow their internal
customer base (71%). Other goals reported are offering new services (61%), increasing revenue (59%),
growing the external customer base (44%), and increasing center subsidies (16%). 6% of responses cited
“other” goals, which included increasing grant funding, publishing more papers, adding new pieces of
equipment, and enhancing educational offerings.
0%
10%
20%
30%
40%
50%
60%
70%
80%
To increaseutilization
To grow theinternal
customerbase
To offer newservices
To increaserevenue
To grow theexternal
customerbase
To increasesubsidies
Other None
Facility Goals for 2016
Agilent Technologies, Inc
5301 Stevens Creek Blvd.
Santa Clara, CA 95051
United States
September 22, 2016 Page 16 of 24
© Agilent Technologies, Inc. 2016
Summary of Results
When asked, “What are your biggest challenges as a core manager,” generating revenue was cited as the
top challenge. More specifically, core managers are concerned with “finding funds” and “keeping up with
the cost of new technology.”
“How do you get your core to be sustainable?” wrote one core manager. “How do you provide the best
service for the lowest cost and still keep the customer happy?” Many managers feel pushed by customers
and competition to provide the lowest rates, but this leaves them short on the funds necessary for the
latest technology. That very technology, of course, is the backbone of generating core utilization.
Unfortunately, the struggle to attract the very limited dollars of research funding is nothing new. Last
year’s survey recorded many of the same complaints, with acquiring funding being the most common
challenge for 2014 as well. As discussed last year, the lack of funding starts and perpetuates a downward
spiral.
However, the data also suggests some encouraging trends. For example, FTEs are serving, on average,
over 4 PIs or labs more than last year (7.62 to 11.67), indicating an overall growth in efficiency.
Furthermore, this year’s study revealed the highest percentage of core facilities reporting an increase in
usage from the previous year (2014) since 2010-2011. Since customer revenue comprises an average of
52% of a core’s revenue, these statistics are extremely important. Additionally, institutional support has
risen for the third year in a row, another promising trend. Institutional support averages 30% of a core’s
income. Combine that with the 52% from customer revenue, and that gives a total of 82%. This means
that on average, at least 82% of a core facility’s income is increasing. This is certainly a desirable result,
given the difficulties faced on a daily basis.
Two other common issues which tied for the second most popular challenge core managers face are
“managing the workload and having time to get work done,” and “administrative duties of managing the
core.” Core managers are balancing running a core, maintaining up-to-date technology, managing volume
requests, conducting research, and running individual labs to name a few. According to this year’s survey
an average of 43% of a core manager’s time is spent on administrative tasks, which diverts attention from
research. However, this year’s study indicates that an electronic system, be it commercial or homegrown,
may very well have a positive influence on a core’s performance. In all tasks observed (data analysis,
tracking equipment usage, billing & invoicing, creating usage reports, managing budgets, and tracking
workflow) there were around 10% more users of electronic systems than non-electronic, meaning
electronic systems are gaining popularity for tackling a range of tasks. Furthermore, overall satisfaction
was higher for those with electronic systems in place. While these trends may be new, the combined rise
Agilent Technologies, Inc
5301 Stevens Creek Blvd.
Santa Clara, CA 95051
United States
September 22, 2016 Page 17 of 24
© Agilent Technologies, Inc. 2016
in popularity of electronic management systems, efficiency, and overall satisfaction bears investigation
over the coming years.
Agilent Technologies, Inc
5301 Stevens Creek Blvd.
Santa Clara, CA 95051
United States
September 22, 2016 Page 18 of 24
© Agilent Technologies, Inc. 2016
About iLab Solutions, a part of Agilent Technologies
iLab Solutions, now part of Agilent Technologies, is the leader in providing web-based management services to academic research institutions with customers that include leading NIH-funded universities, research hospitals, and independent institutes. iLab offers a suite of web-based tools for academic research management. The functionality includes core facility service request management, enhanced sample management functionality, equipment reservation and usage tracking, billing and invoicing, reporting, and lab requisitioning and spend tracking tools. The system also allows each user a consolidated view of their recent activity in the system as well as the ability to search across all equipment, services and cores in the system. iLab serves over 160 research institutions across 16 countries, including 34 of the top 50 recipients of NIH funding. iLab has extensive experience providing enterprise-level solutions at major research institutions. These solutions include integrations with institutional financial systems (e.g., SAP, Oracle, PeopleSoft, Lawson, Banner, IFAS, etc.) and identity management systems (e.g., Active Directory, Shibboleth, etc.). iLab’s dedicated implementation team and established implementation processes result in high adoption and fully trained personnel for effective use of the system.
In August 2016, iLab was purchased by Agilent Technologies, a leader in life sciences, diagnostics and
applied chemical markets. Agilent provides laboratories worldwide with instruments, services,
consumables, applications and expertise, enabling customers to gain the insights they seek. Now, as a part
of Agilent, iLab adds to Agilent’s robust CrossLab laboratory enterprise management capabilities.
Agilent Technologies, Inc
5301 Stevens Creek Blvd.
Santa Clara, CA 95051
United States
September 22, 2016 Page 19 of 24
© Agilent Technologies, Inc. 2016
Appendix A (Details of Open-Ended Survey Responses)3
Q1. What are your biggest challenges?
1. Funding & Budget: (33% of responses)
Annual Funding, competitive funding for staff positions Anticipating what kinds of service will be most useful for my customers and getting institutional support to get those services in place in time to be useful for most of them. Balancing budget Balancing budget while maintaining low prices. Balancing the need to increase revenues while continuing to offer good value for our users. Breakeven Bringing in business and funding Budget issues Covering costs of depreciation of high-end instruments, maintenance and service on them and personnel costs. Getting all members of the core to work equally and be efficient. Getting new high impact projects and generating revenue. Covering the operating costs, most significantly labor Decreased funding for PI's and PI loss to the institution Finances Departmental politics Finding funding to upgrade equipment; Finding funds to have maintenance contracts Finding more internal/external users Funding staff and equipment Funding, keeping samples coming in Get the budget to hire the staff needed to run the core facility; training and development of staff Getting institutional support to hire more staff Hourly rate How do you get your core to be sustainable. How do you provide the best service for the lowest cost and still keeping the customer happy. Income vs expenses balancing managing personnel Increasing revenue in climate of decreased institutional support. Keeping revenue up Keeping service costs down; Training new users Keeping the core financially viable Keeping up with the cost of new technology Knowing the financial situation; growing the number of users increasing revenue Lack of budget support.
3 A majority of open-ended responses are included in Appendix A. Some responses were combined to eliminate repetition.
Agilent Technologies, Inc
5301 Stevens Creek Blvd.
Santa Clara, CA 95051
United States
September 22, 2016 Page 20 of 24
© Agilent Technologies, Inc. 2016
Lack of support Maintaining the ratio of income to expenses Making budget Managing budgets and keeping costs low while generating enough revenue to operate the core. Managing the budget; Changing institutional demands; Core directors who don't understand the business side of the operations; Demanding PI's who don't know what it takes to run a core Limited budget to acquire personnel and other resources to achieve efficiency and embark on growth Commercial core administration tools that cannot fully be customized to meet our workflows and processes and move us away from the spreadsheet Meeting budgeted dollars for charge-backs Obtaining funding for capital equipment. Obtaining instruments through extramural funding. If I fail my job is at risk. Internal instrument grants have been discontinued. Raising funds for new equipment and to pay for the service contracts of that new equipment. Recovering costs within institutional limits; matching personnel resources to dynamically changing projects; tracking data electronically. Renew equipment, create enough revenue Revenue and business growth Salaries for employees, career track for employees The finances and the user education is all ad hock To get funding To maintain level of excellence with vanishing financial and personnel support.
Time and Workload: (14% of responses)
Balancing core management and independent research Balancing my time between service for the core and running my research lab. Ensuring, instrumentation is up-to-date and accessible to everyone.
Finding time to do independent research
Having enough time.
Having time to integrate new systems.
I am the only employee, so time is a concern.
Managing core workload and my independent research Managing massive swings in the volume of requests over time. We are either significantly over capacity for months at a time or more under capacity than I would like for weeks to months.
Meeting customer requests in their needed timeframe
Prioritizing the work requests and getting work done in a timely manner.
Time
Time for clients and wet-lab work...stretched too thin.
Time management
Time managing as a manager and grad student.
Agilent Technologies, Inc
5301 Stevens Creek Blvd.
Santa Clara, CA 95051
United States
September 22, 2016 Page 21 of 24
© Agilent Technologies, Inc. 2016
Time to deal with clients and their inability to easily use ilabs.
Too many grant requests all at the same time and not enough time.
Work load is large and institution will not hire assistant.
Workload
Administrative Duties: (14% of responses)
Advertising & billing
Balancing the use fee accounts
Customer management
Fast response to requests, streamlining data workflow, revenue, keeping instruments running
Increasing administrative duties, reports
Keeping track of usage and making sure data are as good as can be
Keeping up with billing
Keeping workflow even; keeping everyone satisfied with time to data
Manage billing errors.
Management of users and resources
Managing project timelines and expectations; Keeping abreast of best practices
Personnel management
Properly recovering money from outside customers, billing, tracking externals
Reporting
Setting pricing to cover costs exactly in a fluctuating usage model
Tracking projects, invoicing Tracking publications, equipment funding, getting investigators to use newly purchased equipment
Tracking publications, rate calculations
Training & Education
Training of users or conversely, internal customer support.
Training users and staff to follow procedures.
Maintaining/obtaining technology: (8% of responses)
Acquiring new technology or replacement technology is a difficult. There is no transparent mechanism for replacement of equipment or acquisition of new equipment.
Aligning core technologies with the needs of the researcher.
Bringing on new technology
Equipment maintenance Having a lemon of a sorter for 2 years, losing client confidence, and having sorting at another institution be subsidized by a donor from my own institution.
Having such a variety of users, aging equipment/instruments,
Keep the instrumentation in excellent working condition.
Keeping current with equipment, software and education without institute support
Agilent Technologies, Inc
5301 Stevens Creek Blvd.
Santa Clara, CA 95051
United States
September 22, 2016 Page 22 of 24
© Agilent Technologies, Inc. 2016
Keeping equipment maintained (not asked for in time % question, grouped with performing client services). Finding time on equipment from other cores to complete projects Keeping mass spectrometry instruments running while not being able to afford maintenance contracts.
Keeping on top of new technologies.
Keeping up with technology and keeping it affordable with a "lean" staff. To purchase new equipment when the existing equipment becomes too old or is no longer supported for maintenance
Increasing Utilization: (8% of responses)
- to maintain existing instrumentation - to maintain and expand user base - to meet administration requests for increasing the income
Attracting new customers
Expanding usage of the facility Finding external business to keep internal business cost low, in turn, that would increase internal business Getting enough users at reasonable cost so that we can pay for maintenance and acquiring new equipment
Getting people to use the core.
Having routine usage, not spurts
Increasing utilization of equipment Keep looking for new customers to replace those who have left or have found a different focus. Keeping some equipment busy enough to pay for the service contract and core staffing coverage.
Maintaining or increasing usage (this equates to maintaining or increasing revenues)
Outreach to potential customers
Dealing with Administration: (7% of responses)
Convincing Administration of the cores value and that it doesn't "lose money"
Convincing central University administration that dedicated technical staff are required Dealing with idiotic asshole administrators. The arrogant pis I can cope with, but the stupid budget analysts leave me speechless.
Dealing with non-science bean counters and others that are clueless as to what a core does. Developing/maintaining relationships with administrators and faculty to balance serving existing customers with future needs. Lack of administrative support. Lack of funding for new equipment. Lack of resources for educational opportunities for users. Lack of institution based planning and predictable fixed commitment. Lack of timely budgeting process Of course managing a facility on a recharge basis isn't any fun. For any given year I have no idea how much income will come in, but that's just the landscape. I have to say, the institution
Agilent Technologies, Inc
5301 Stevens Creek Blvd.
Santa Clara, CA 95051
United States
September 22, 2016 Page 23 of 24
© Agilent Technologies, Inc. 2016
seems to do everything possible to make it harder though. Almost every interaction is unproductive, rarely does the institution seem to want to help. Really, it seems like the institution would rather we just shut down. People and upper management that don't follow the rules of the core or make new ones on the fly for special interest groups or Pis
Upper management interference
Staffing: (6% of responses) Employing staff who already have good experience and will stay for a decent length of time. Enough personnel to perform all tasks requested Generally resulting in understaffing which makes it very difficult to meet the demands of the customers.
Finding and keeping good staff
Finding dedicated personel and cope with request e.g. lowering waiting times
Finding employees that care.
Having a central person to assist with core processing. This has recently changed.
Staff management; finding staff with needed skill set
Staff management/holidays, management of equipment that requires staff to be present
Staff tenure
Staffing to meet user needs. Changes in discipline areas.
Miscellaneous: (10% of responses)
Finding software that fits what we do - since we are not a biological core but a user fabrication and user facility.
Getting individual core directors to write SIG grants Getting the reporting data we need out of ilab. At minimum, need all existing fields to be exportable. More user-defined fields, e.g. Labels on rates, would be super helpful.
Having users respecting the schedule
Integrating new users into workflow
Interacting with other facilities and capturing data to share amongst the facilities
Keeping customers happy
Maintaining sample load Managing hospital users attempting to use ecores/ilabs when they don't have access and also getting prints done on time. Managing scheduling.....ilabs is complicated and slow. Many entries require 2 and 3 repeative attempts for completion
Managing the access to user tools
Sorter scheduling, user training in advanced multicolor panels, instrument repair Spending more time to generate billing in ilabs than to generate billing in previous system. Spending more time to explain to users how to use ilabs. Users are confused by ilabs and its lack of flexbility in describing the production of unique, custom, animal models that are never the same as any other model produced before.
Start up
Agilent Technologies, Inc
5301 Stevens Creek Blvd.
Santa Clara, CA 95051
United States
September 22, 2016 Page 24 of 24
© Agilent Technologies, Inc. 2016
Substantial income for self support of all expenses along with labor.