The 2015 Retirement Confidence Survey
40
A monthly research report from the EBRI Education and Research Fund © 2015 Employee Benefit Research Institute April 2015 • No. 413 The 2015 Retirement Confidence Survey: Having a Retirement Savings Plan a Key Factor in Americans’ Retirement Confidence By Ruth Helman, Greenwald & Associates; and Craig Copeland, Ph.D., and Jack VanDerhei, Ph.D., Employee Benefit Research Institute AT A GLANCE The 2015 annual Retirement Confidence Survey (RCS) marks the 25 th year of the RCS, making it the longest-running survey of its kind in the nation. Among this year’s highlights: Whether or not Americans have a retirement savings plan is a key factor in their outlook about having an affordable retirement. The 2015 RCS by EBRI/Greenwald & Associates finds that the nation’s retirement confidence continues to rebound from the record lows experienced between 2009 and 2013—but this is based on the increasing optimism of those who indicate they and/or their spouse have a retirement plan. The percentage of workers confident about having enough money for a comfortable retirement, at record lows between 2009 and 2013, increased in 2014 and again in 2015. Twenty-two percent are now very confident (up from 13 percent in 2013 and 18 percent in 2014), while 36 percent are somewhat confident. Twenty-four percent are not at all confident (statistically unchanged from 28 percent in 2013 and 24 percent in 2014). The increased confidence since 2013 is strongly related to retirement plan participation. Among those with a plan, the percentage very confident increased from 14 percent in 2013 to 28 percent in 2015. In contrast, the percentage very confident remained statistically unchanged among those without a plan (10 percent in 2013, 9 percent in 2014, and 12 percent in 2015). Retiree confidence in having a financially secure retirement, which historically tends to exceed worker confidence levels, also increased, with 37 percent very confident (up from 18 percent in 2013 and 27 percent in 2014). The percentage not at all confident was 14 percent (statistically unchanged from 14 percent in 2013 and 17 percent in 2014). Worker confidence in the affordability of various aspects of retirement has also rebounded. In particular, the percentage of workers who are very confident in their ability to pay for basic expenses has increased (37 per- cent, up from 25 percent in 2013 and 29 percent in 2014). The percentages of workers who are very confident in their ability to pay for medical expenses (18 percent, up from 12 percent in 2011) and long-term care expenses (14 percent, up from 9 percent in 2011) are slowly inching upward. Cost of living and day-to-day expenses head the list of reasons why workers do not save (or save more) for retirement, with 50 percent of workers citing these factors. Nevertheless, many workers say they could save a small amount more. Seven in 10 (69 percent) state they could save $25 a week more than they are currently saving for retirement.
-
Upload
mainstreetassetplanners -
Category
Economy & Finance
-
view
65 -
download
0
Transcript of The 2015 Retirement Confidence Survey

A monthly research report from the EBRI Education and Research Fund © 2015 Employee Benefit Research Institute
April 2015 • No. 413
The 2015 Retirement Confidence Survey: Having a Retirement Savings Plan a Key Factor in Americans’ Retirement Confidence By Ruth Helman, Greenwald & Associates; and Craig Copeland, Ph.D., and Jack VanDerhei, Ph.D., Employee Benefit Research Institute
A T A G L A N C E
The 2015 annual Retirement Confidence Survey (RCS) marks the 25th year of the RCS, making it the longest-running survey of its kind in the nation. Among this year’s highlights:
Whether or not Americans have a retirement savings plan is a key factor in their outlook about having an affordable retirement. The 2015 RCS by EBRI/Greenwald & Associates finds that the nation’s retirement confidence continues to rebound from the record lows experienced between 2009 and 2013—but this is based on the increasing optimism of those who indicate they and/or their spouse have a retirement plan.
The percentage of workers confident about having enough money for a comfortable retirement, at record lows between 2009 and 2013, increased in 2014 and again in 2015. Twenty-two percent are now very confident (up from 13 percent in 2013 and 18 percent in 2014), while 36 percent are somewhat confident. Twenty-four percent are not at all confident (statistically unchanged from 28 percent in 2013 and 24 percent in 2014).
The increased confidence since 2013 is strongly related to retirement plan participation. Among those with a plan, the percentage very confident increased from 14 percent in 2013 to 28 percent in 2015. In contrast, the percentage very confident remained statistically unchanged among those without a plan (10 percent in 2013, 9 percent in 2014, and 12 percent in 2015).
Retiree confidence in having a financially secure retirement, which historically tends to exceed worker confidence levels, also increased, with 37 percent very confident (up from 18 percent in 2013 and 27 percent in 2014). The percentage not at all confident was 14 percent (statistically unchanged from 14 percent in 2013 and 17 percent in 2014).
Worker confidence in the affordability of various aspects of retirement has also rebounded. In particular, the percentage of workers who are very confident in their ability to pay for basic expenses has increased (37 per-cent, up from 25 percent in 2013 and 29 percent in 2014). The percentages of workers who are very confident in their ability to pay for medical expenses (18 percent, up from 12 percent in 2011) and long-term care expenses (14 percent, up from 9 percent in 2011) are slowly inching upward.
Cost of living and day-to-day expenses head the list of reasons why workers do not save (or save more) for retirement, with 50 percent of workers citing these factors. Nevertheless, many workers say they could save a small amount more. Seven in 10 (69 percent) state they could save $25 a week more than they are currently saving for retirement.

ebri.org Issue Brief • April 2015 • No. 413 2
Ruth Helman is research director for Greenwald & Associates. Craig Copeland is senior research associate at the Employee Benefit Research Institute (EBRI). Jack VanDerhei is the research director at EBRI. This Issue Brief was written with assistance from the Institute’s research and editorial staffs. Any views expressed in this report are those of the authors and should not be ascribed to the officers, trustees, or other sponsors of EBRI, Employee Benefit Research Institute-Education and Research Fund (EBRI-ERF), or their staffs. Neither EBRI nor EBRI-ERF lobbies or takes positions on specific policy proposals. EBRI invites comment on this research.
Copyright Information: This report is copyrighted by the Employee Benefit Research Institute (EBRI). It may be used without permission but citation of the source is required.
Recommended Citation: Ruth Helman, Craig Copeland, and Jack VanDerhei, “The 2015 Retirement Confidence Survey: Having a Retirement Savings Plan a Key Factor in Americans’ Retirement Confidence,” EBRI Issue Brief, no. 413 (Employee Benefit Research Institute, April 2015).
Report availability: This report is available on the Internet at www.ebri.org
2015 Retirement Confidence Survey Underwriters AARP
Ameriprise Financial
Aon Hewitt
BMO Retirement Services
Financial Engines
FINRA Investor Education Foundation
Guardian Life Insurance
J.P. Morgan Asset Management
MassMutual Financial Group
Mercer
MetLife
Nationwide Financial
Principal Financial Group
Prudential Retirement Insurance and Annuity Company
The Segal Group
Vanguard
Wells Fargo & Co.
Table of Contents Introduction .......................................................................................................................................................... 5
Retirement Confidence ........................................................................................................................................... 6
Overall Retirement Confidence ............................................................................................................................ 6
Confidence in Other Financial Aspects of Retirement ............................................................................................ 7
Workers ........................................................................................................................................................ 7
Retirees ........................................................................................................................................................ 9
Preparing for Retirement ...................................................................................................................................... 11
Retirement Planning ......................................................................................................................................... 11
Savings and Investments.................................................................................................................................. 13
Debt ............................................................................................................................................................... 18
Retirement Plans ............................................................................................................................................. 20
ebri.org Issue Brief • April 2015 • No. 413 3
Target Setting ................................................................................................................................................. 22
Expectations About Retirement ............................................................................................................................. 23
Retirement Age ............................................................................................................................................... 23
Working for Pay in Retirement .......................................................................................................................... 27
Sources of Retirement Income .......................................................................................................................... 27
Confidence in Entitlement Programs .................................................................................................................. 29
Income Needs in Retirement ............................................................................................................................ 29
Longevity ........................................................................................................................................................ 32
Managing Finances in Retirement ...................................................................................................................... 33
RCS Methodology ................................................................................................................................................ 36
Endnotes ............................................................................................................................................................ 36
Figures Figure 1, Worker Confidence in Having Enough Money to Live Comfortably Throughout Their Retirement .................... 6
Figure 2, Retiree Confidence in Having Enough Money to Live Comfortably Throughout Their Retirement Years ........... 7
Figure 3, Retirement Confidence Among Workers, by Retirement Plan Ownership: 2013‒2015 .................................... 8
Figure 4, Retirement Confidence Among Workers, by Self-described Level of Debt ..................................................... 8
Figure 5, Worker Confidence in Having Enough Money to Take Care of Basic Expenses in Retirement .......................... 9
Figure 6, Worker Confidence in Having Enough Money to Take Care of Medical Expenses in Retirement ...................... 9
Figure 7, Worker Confidence in Having Enough Money to Pay for Long-Term Care ................................................... 10
Figure 8, Retiree Confidence in Having Enough Money to Take Care of Basic Expenses in Retirement ........................ 10
Figure 9, Retiree Confidence in Having Enough Money to Take Care of Medical Expenses in Retirement .................... 11
Figure 10, Retiree Confidence in Having Enough Money to Pay for Long-Term Care .................................................. 11
Figure 11, Worker Confidence in Financial Preparation for Retirement ..................................................................... 12
Figure 12, Retiree Confidence in Financial Preparation for Retirement ..................................................................... 12
Figure 13, Percentage Spending 8 or More Hours Planning for Various Events .......................................................... 13
Figure 14, Worker Assessment of Progress in Planning and Saving for Retirement .................................................... 14
Figure 15, Workers Having Saved Money for Retirement......................................................................................... 14
Figure 16, Retirees Having Saved Money for Retirement ......................................................................................... 15
Figure 17, Workers Currently Saving Money for Retirement .................................................................................... 15
Figure 18, Total Savings and Investments Reported by Workers Among Those Providing a Response ........................ 16
Figure 19, Total Savings and Investments Reported by Retirees Among Those Providing a Response ........................ 16
Figure 20, Percentage of Household Income That Workers Think They Need to Save to Live Comfortably in Retirement ............................................................................................................................................. 17
Figure 21, Average Percentage of Income Needing to be Saved for Workers to Live Comfortably in Retirement, by Retirement Confidence and Age ............................................................................................................... 17
Figure 22, Worker and Retiree Perception of Debt Load .......................................................................................... 19

ebri.org Issue Brief • April 2015 • No. 413 4
Figure 23, Types of Debt Owned by Workers and Retirees ...................................................................................... 19
Figure 24, Total Savings and Investments Reported by Workers Among Those Providing a Response, by Plan Ownership .............................................................................................................................................. 20
Figure 25, Likely Reaction of Plan Participants if Auto-enrolled at 3% and 6% .......................................................... 21
Figure 26, Likely Percentage of Salary at Which Plan Participants Would Discontinue Auto-escalation ........................ 21
Figure 27, Workers Having Tried to Calculate How Much Money They Need to Save for a Comfortable Retirement ..... 22
Figure 28, Amount of Savings Workers Think They Need for Retirement .................................................................. 23
Figure 29, Planning Steps Taken by Workers and Retirees to Prepare for Retirement ................................................ 24
Figure 30, Interest in Using an Online Investment Education and Advice Provider .................................................... 24
Figure 31, Workers Expecting to Retire Later than Planned ..................................................................................... 25
Figure 32, Trend in Workers’ Expected Retirement Age .......................................................................................... 26
Figure 33, Trend in Retirees’ Actual Retirement Age ............................................................................................... 26
Figure 34, Timing of Retirement, Among Retirees .................................................................................................. 27
Figure 35, Comparison of Expected (Workers Expecting to Retire) and Actual (Retirees) Work for Pay in Retirement .. 28
Figure 36, Expected (Workers Expecting to Retire) and Actual (Retirees) Sources of Income in Retirement ................ 28
Figure 37, Worker Confidence That Social Security Will Continue to Provide Benefits of at Least Equal Value to Benefits Received Today .......................................................................................................................... 29
Figure 38, Retiree Confidence That Social Security Will Continue to Provide Benefits of at Least Equal Value to Benefits Received Today .......................................................................................................................... 30
Figure 39, Worker Confidence That Medicare Will Continue to Provide Benefits of at Least Equal Value to Benefits Received Today ...................................................................................................................................... 30
Figure 40, Retiree Confidence That Medicare Will Continue to Provide Benefits of at Least Equal Value to Benefits Received Today ...................................................................................................................................... 31
Figure 41,Worker (Expectation of Needed) and Retiree (Actual) Income Replacement Ratio in Retirement ................. 31
Figure 42, Number of Hours a Week Spent Providing Unpaid Care, Among Workers and Retirees Providing Care ........ 32
Figure 43, Worker and Retiree Expectation of Living to Ages 85 and 95 ................................................................... 33
Figure 44, Worker and Retiree Interest in Longevity Insurance ............................................................................... 33
Figure 45, How Retiree Experience With Retirement Expenses Matches With Expectations ........................................ 34
Figure 46, How Retiree Experience With Level of Savings and Investments Matches With Expectations ...................... 35

ebri.org Issue Brief • April 2015 • No. 413 5
The 2015 Retirement Confidence Survey: Having a Retirement Savings Plan a Key Factor in Americans’ Retirement Confidence By Ruth Helman, Greenwald & Associates; and Craig Copeland, Ph.D., and Jack VanDerhei, Ph.D., Employee Benefit Research Institute
Introduction The 25th wave of the Retirement Confidence Survey (RCS) finds that Americans’ confidence in their ability to afford a comfortable retirement has continued to rebound from the record lows experienced between 2009 and 2013. This increased level of confidence does not appear to be grounded on improved retirement preparations. In the aggregate, worker1 savings remain low and only a minority appears to be taking basic steps needed to prepare for retirement. Instead, increasing confidence appears to be based on the increasing optimism of those who indicate they and/or their spouse have a retirement plan.
Findings in this year’s RCS, the longest-running survey of its kind in the nation, include:
The percentage of workers confident about having enough money for a comfortable retirement, at record lows between 2009 and 2013, increased in 2014 and again in 2015. Twenty-two percent are now very confident (up from 13 percent in 2013 and 18 percent in 2014), while 36 percent are somewhat confident. Twenty-four percent are not at all confident (statistically unchanged from 28 percent in 2013 and 24 percent in 2014).
The increased confidence since 2013 is strongly related to retirement plan participation. Among those with a plan, the percentage very confident increased from 14 percent in 2013 to 28 percent in 2015. In contrast, the percentage very confident remained statistically unchanged among those without a plan (10 percent in 2013, 9 percent in 2014, and 12 percent in 2015).
Retiree confidence in having a financially secure retirement, which historically tends to exceed worker confidence levels, has also increased, with 37 percent very confident (up from 18 percent in 2013 and 28 per-cent in 2014). The percentage not at all confident was 14 percent (statistically unchanged from 14 percent in 2013 and 17 percent in 2014).
Worker confidence in the affordability of various aspects of retirement also rebounded. In particular, the percentage of workers who are very confident in their ability to pay for basic expenses increased (37 percent, up from 25 percent in 2013 and 29 percent in 2014). The percentages of workers who are very confident in their ability to pay for medical expenses (18 percent, up from 12 percent in 2011) and long-term care expenses (14 percent, up from 9 percent in 2011) are slowly inching upward.
Sixty-seven percent of workers report they or their spouse have saved for retirement (statistically equivalent to 64 percent in 2014), although nearly 8 in 10 (78 percent) full-time workers say that they or their spouse have done so. Still, a sizable percentage of workers report they have virtually no savings and investments. Among RCS workers providing this type of information, 28 percent say they have less than $1,000, though those who indicate they and their spouse do not have a retirement plan, such as an IRA, DC or DB plan, are far more likely than those who have a plan to report this low level of savings (64 percent vs. 9 percent) and far less likely to report having saved at least $100,000 (3 percent vs. 35 percent).
Cost of living and day-to-day expenses head the list of reasons why workers do not save (or save more) for retirement, with 50 percent of workers citing these factors. Nevertheless, many workers say they could save a small amount more. Seven in 10 (69 percent) state they could save $25 a week more than they are currently saving for retirement.
ebri.org Issue Brief • April 2015 • No. 413 6
Both workers and retirees are less likely than in the 2014 RCS to describe their level of debt as a problem. Fifty-one percent of workers (down from 58 percent in 2014) and 31 percent of retirees (down from 44 percent in 2014) indicate they have a problem with their level of debt. The types of debt most frequently reported are mortgages, credit card debt, and car loans.
Almost two-thirds of workers (64 percent) say they feel they are behind schedule when it comes to planning and saving for retirement. However, this assessment may not be based on a careful analysis of their individual circumstances. Only 48 percent of workers report they and/or their spouse have tried to calculate how much money they will need to have saved by the time they retire so that they can live comfortably in retirement, a level that has held relatively consistent over the past decade.
Retirement Confidence
Overall Retirement Confidence
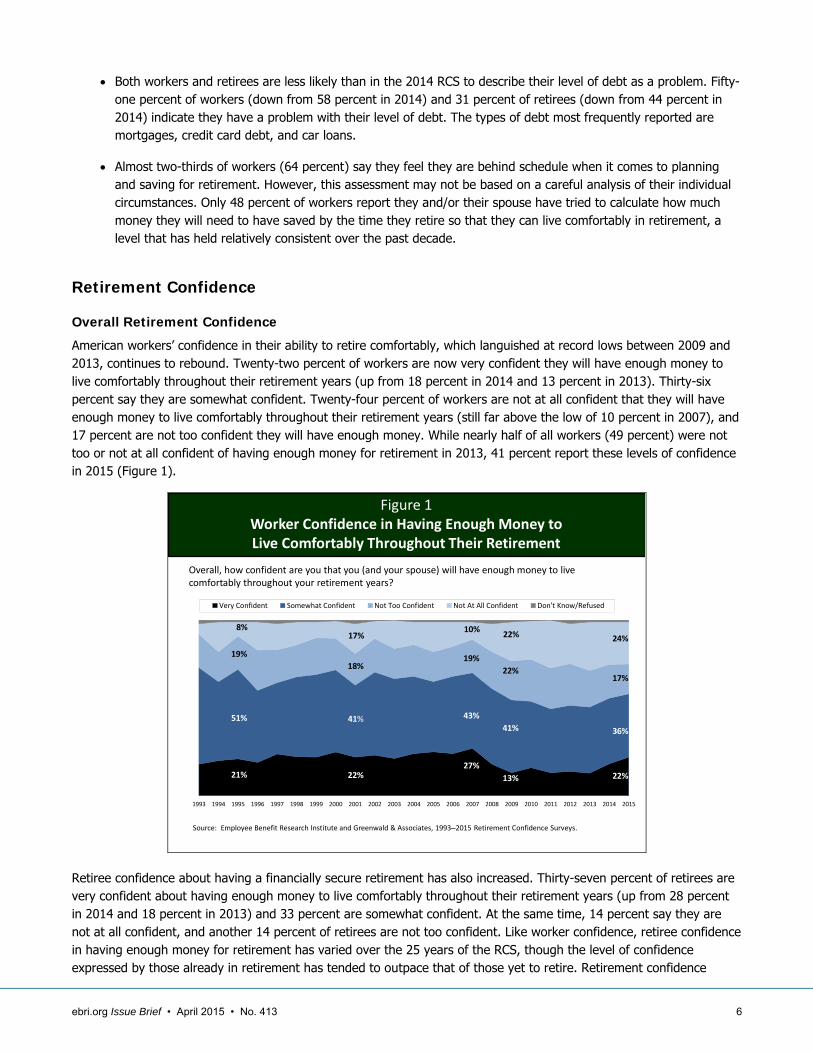
American workers’ confidence in their ability to retire comfortably, which languished at record lows between 2009 and 2013, continues to rebound. Twenty-two percent of workers are now very confident they will have enough money to live comfortably throughout their retirement years (up from 18 percent in 2014 and 13 percent in 2013). Thirty-six percent say they are somewhat confident. Twenty-four percent of workers are not at all confident that they will have enough money to live comfortably throughout their retirement years (still far above the low of 10 percent in 2007), and 17 percent are not too confident they will have enough money. While nearly half of all workers (49 percent) were not too or not at all confident of having enough money for retirement in 2013, 41 percent report these levels of confidence in 2015 (Figure 1).
0%
5%
10%
15%
20%
25%
30%
35%
40%
45%
50%
55%
60%
65%
70%
75%
80%
85%
90%
95%
100%
1993 1994 1995 1996 1997 1998 1999 2000 2001 2002 2003 2004 2005 2006 2007 2008 2009 2010 2011 2012 2013 2014 2015
Very Confident Somewhat Confident Not Too Confident Not At All Confident Don't Know/Refused
Figure 1Worker Confidence in Having Enough Money to Live Comfortably Throughout Their Retirement
Overall, how confident are you that you (and your spouse) will have enough money to live comfortably throughout your retirement years?
Source: Employee Benefit Research Institute and Greenwald & Associates, 1993‒2015 Retirement Confidence Surveys.
24%
17%
36%
22%
10%
19%
43%
27%
17%
18%
41%
22%
8%
19%
51%
21%
22%
22%
41%
13%
Retiree confidence about having a financially secure retirement has also increased. Thirty-seven percent of retirees are very confident about having enough money to live comfortably throughout their retirement years (up from 28 percent in 2014 and 18 percent in 2013) and 33 percent are somewhat confident. At the same time, 14 percent say they are not at all confident, and another 14 percent of retirees are not too confident. Like worker confidence, retiree confidence in having enough money for retirement has varied over the 25 years of the RCS, though the level of confidence expressed by those already in retirement has tended to outpace that of those yet to retire. Retirement confidence

ebri.org Issue Brief • April 2015 • No. 413 7
remained fairly steady at roughly 40 percent very confident and 10 percent not at all confident from 2002 through 2007, but the percentage stating they were very confident declined in 2008 and 2009 (Figure 2).
0%
10%
20%
30%
40%
50%
60%
70%
80%
90%
100%
1993 1994 1995 1996 1997 1998 1999 2000 2001 2002 2003 2004 2005 2006 2007 2008 2009 2010 2011 2012 2013 2014 2015
Very Confident Somewhat Confident Not Too Confident Not At All Confident Don't Know/Refused
Source: Employee Benefit Research Institute and Greenwald & Associates, 1993‒2015 Retirement Confidence Surveys.
Figure 2Retiree Confidence in Having Enough Money to
Live Comfortably Throughout Their Retirement Years
Overall, how confident are you that you (and your spouse) will have enough money to live comfortably throughout your retirement years?
14%
14%
33%
37%
11%
10%
38%
41%
24%
24%
28%
19%
16%
16%
47%
20%
Retirement confidence is strongly related to retirement plan participation, whether in a DC plan, a DB plan, or an IRA. Workers reporting they or their spouse have money in a DC plan or IRA or have a DB plan from a current or previous employer are more than twice as likely as those without any of these plans to be very confident (28 percent with a plan vs. 12 percent without a plan). Moreover, the increase in confidence between 2013 and 2015 occurred primarily among those with a plan. Among those with a plan, the percentage very confident increased from 14 percent in 2013 to 28 percent in 2015. In contrast, the percentage very confident remained statistically unchanged among those without a plan (10 percent in 2013, 9 percent in 2014, and 12 percent in 2015). Additionally, workers without a plan are three times as likely to say they are not at all confident about their financial security in retirement (14 percent with a plan vs. 44 percent without a plan) (Figure 3).
The RCS has consistently found a relationship between the level of debt and retirement confidence.2 Just 6 percent of workers who describe their debt as a major problem say they are very confident about having enough money to live comfortably throughout retirement, compared with 35 percent of workers who indicate debt is not a problem. On the other hand, 56 percent of workers with a major debt problem are not at all confident about having enough money for a financially secure retirement, compared with 14 percent of workers without a debt problem (Figure 4).
Confidence in Other Financial Aspects of Retirement
Workers
Worker confidence about their ability to pay for basic expenses in retirement continues to rebound from the lows measured in 2013. Thirty-seven percent of workers are now very confident that they will have enough money to pay for basic expenses during retirement (up from 29 percent in 2014 and 25 percent in 2013). At the same time, 15 percent are not at all confident about their ability to pay for basic expenses in retirement (statistically equivalent to 16 percent in 2013 and 2014) (Figure 5).
Although well below the confidence level observed regarding paying for basic expenses, worker confidence about having enough money to pay for medical expenses and long-term care expenses in retirement continues an incremental

ebri.org Issue Brief • April 2015 • No. 413 8
Figure 3Retirement Confidence Among Workers,
by Retirement Plan Ownership, 2013‒2015
Source: Employee Benefit Research Institute and Greenwald & Associates, 2013‒2015 Retirement Confidence Survey.
14%24% 28%
10% 9% 12%
46%
48% 43%
19% 19%21%
18%
17% 14%
26% 23%21%
21%11% 14%
44% 46% 44%
Very Confident Somewhat Confident Not Too Confident Not at All Confident Don't Know/Refused
Overall, how confident are you that you (and your spouse) will have enough money to live comfortably throughout your retirement years?
* Have Retirement Plan defined as respondent or spouse having at least one of the following: IRA, defined contribution plan, or defined benefit plan.
2013 2014 2015 2013 2014 2015
Have Retirement Plan* No Retirement Plan
6%
19% 17%
56%
12%
39%
24% 24%
35%38%
11%14%
Very Confident Somewhat Confident Not Too Confident Not at All Confident
Workers with major debt problem Workers with minor debt problem
Workers with no debt problem
Figure 4Retirement Confidence Among Workers,
by Self‐described Level of Debt
Source: Employee Benefit Research Institute and Greenwald & Associates, 2015 Retirement Confidence Survey.
Overall, how confident are you that you (and your spouse) will have enough money to live comfortably throughout your retirement years?
increase from the lows observed in 2011. Almost 2 in 10 workers are very confident about being able to pay for medical expenses (18 percent, up from 12 percent in 2011) and long-term care expenses (14 percent, up from 9 percent in 2011). At the same time, the percentages of workers who are not at all confident about paying for medical expenses (23 percent, down from 29 percent in 2013) and long-term care expenses (32 percent, down from 39 percent in 2013) in retirement remain below the highs measured in 2013 (Figures 6 and 7).

ebri.org Issue Brief • April 2015 • No. 413 9
0%
5%
10%
15%
20%
25%
30%
35%
40%
45%
50%
55%
60%
65%
70%
75%
80%
85%
90%
95%
100%
1993 1994 1995 1996 1997 1998 1999 2000 2001 2002 2003 2004 2005 2006 2007 2008 2009 2010 2011 2012 2013 2014 2015
Very Confident Somewhat Confident Not Too Confident Not At All Confident Don't Know/Refused
Figure 5Worker Confidence in Having Enough Money to
Take Care of Basic Expenses in Retirement
How confident are you that you will have enough money to take care of your basic expenses during your retirement?
Source: Employee Benefit Research Institute and Greenwald & Associates, 1993‒2015 Retirement Confidence Surveys.
15%
10%
38%
37%
7%
11%
42%
40%
11%
11%
42%
35%
3%
9%
49%
38%
11%
14%
49%
25%
0%
5%
10%
15%
20%
25%
30%
35%
40%
45%
50%
55%
60%
65%
70%
75%
80%
85%
90%
95%
100%
1993 1994 1995 1996 1997 1998 1999 2000 2001 2002 2003 2004 2005 2006 2007 2008 2009 2010 2011 2012 2013 2014 2015
Very Confident Somewhat Confident Not Too Confident Not At All Confident Don't Know/Refused
Figure 6Worker Confidence in Having Enough Money to Take Care of Medical Expenses in Retirement
How confident are you that you will have enough money to take care of your medical expenses during your retirement?
Source: Employee Benefit Research Institute and Greenwald & Associates, 1993‒2015 Retirement Confidence Surveys.
23%
19%
38%
18%
14%
18%
46%
20%
13%
19%
42%
24%
21%
22%
36%
17%
22%
22%
42%
13%
Retirees
Retirees, who are already immersed in that life stage, tend to express higher levels of confidence than workers at each of these financial aspects of retirement, and several confidence indicators show increases in 2015. The percentage of retirees who are very confident in having enough money to pay for basic expenses has increased to 44 percent, from 28 percent in 2013, approaching the 48 percent measured in the 2007 RCS. At the same time, 9 percent continue to be not at all confident about paying for basic expenses (Figure 8).
ebri.org Issue Brief • April 2015 • No. 413 10
0%
5%
10%
15%
20%
25%
30%
35%
40%
45%
50%
55%
60%
65%
70%
75%
80%
85%
90%
95%
100%
2000 2001 2002 2003 2004 2005 2006 2007 2008 2009 2010 2011 2012 2013 2014 2015
Very Confident Somewhat Confident Not Too Confident Not At All Confident Don't Know/Refused
Figure 7Worker Confidence in Having Enough Money to Pay for Long‐Term Care
How confident are you that you will have enough money to pay for long‐term care, such as nursing home or home health care, should you need it during your retirement?
Source: Employee Benefit Research Institute and Greenwald & Associates, 2000‒2015 Retirement Confidence Surveys.
32%
22%
30%
14%
21%
23%
36%
17%
33%
27%
30%
9%
28%
26%
29%
15%
0%
5%
10%
15%
20%
25%
30%
35%
40%
45%
50%
55%
60%
65%
70%
75%
80%
85%
90%
95%
100%
1993 1994 1995 1996 1997 1998 1999 2000 2001 2002 2003 2004 2005 2006 2007 2008 2009 2010 2011 2012 2013 2014 2015
Very Confident Somewhat Confident Not Too Confident Not At All Confident Don't Know/Refused
How confident are you that you will have enough money to take care of your basic expenses during your retirement?
Source: Employee Benefit Research Institute and Greenwald & Associates, 1993‒2015 Retirement Confidence Surveys.
9%
9%
38%
44%
14%
6%
45%
34%
9%
7%
36%
48%
2%
14%
41%
40%
Figure 8Retiree Confidence in Having Enough Money to
Take Care of Basic Expenses in Retirement
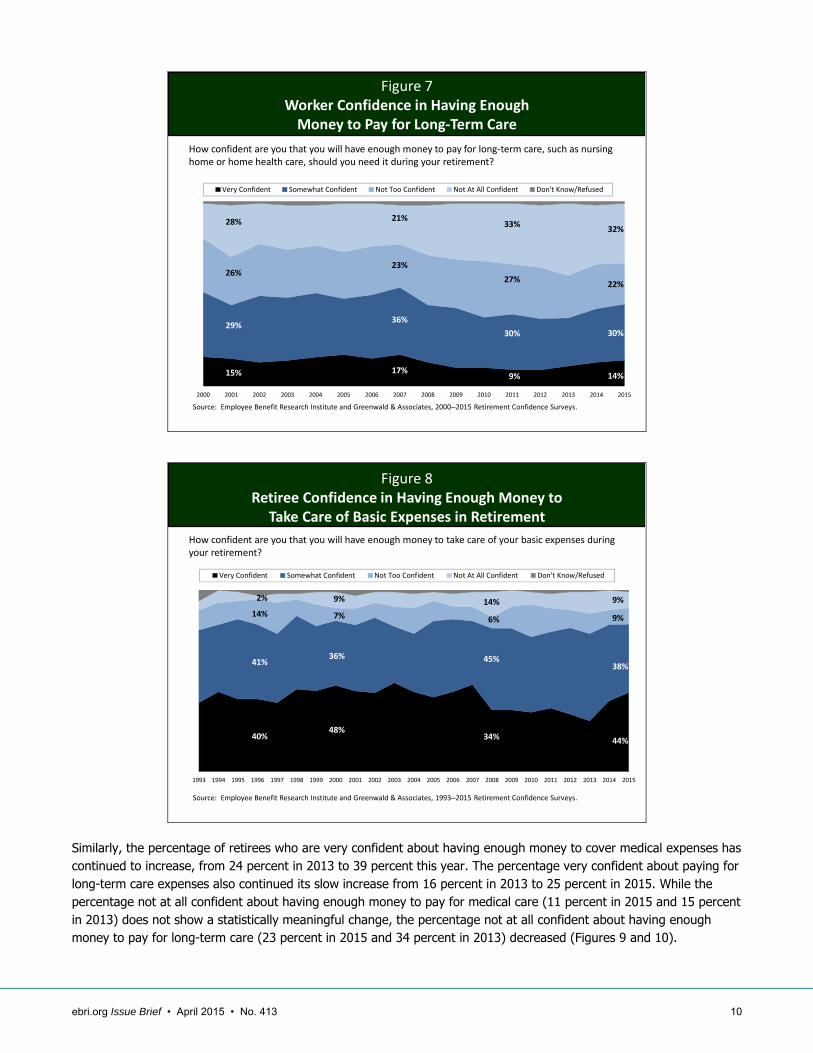
Similarly, the percentage of retirees who are very confident about having enough money to cover medical expenses has continued to increase, from 24 percent in 2013 to 39 percent this year. The percentage very confident about paying for long-term care expenses also continued its slow increase from 16 percent in 2013 to 25 percent in 2015. While the percentage not at all confident about having enough money to pay for medical care (11 percent in 2015 and 15 percent in 2013) does not show a statistically meaningful change, the percentage not at all confident about having enough money to pay for long-term care (23 percent in 2015 and 34 percent in 2013) decreased (Figures 9 and 10).

ebri.org Issue Brief • April 2015 • No. 413 11
0%
5%
10%
15%
20%
25%
30%
35%
40%
45%
50%
55%
60%
65%
70%
75%
80%
85%
90%
95%
100%
1993 1994 1995 1996 1997 1998 1999 2000 2001 2002 2003 2004 2005 2006 2007 2008 2009 2010 2011 2012 2013 2014 2015
Very Confident Somewhat Confident Not Too Confident Not At All Confident Don't Know/Refused
Figure 9Retiree Confidence in Having Enough Money to Take Care of Medical Expenses in Retirement
How confident are you that you will have enough money to take care of your medical expenses during your retirement?
Source: Employee Benefit Research Institute and Greenwald & Associates, 1993‒2015 Retirement Confidence Surveys.
11%
10%
39%
39%
9%
17%
39%
34%
10%
15%
32%
42%
14%
15%
38%
32%
0%
5%
10%
15%
20%
25%
30%
35%
40%
45%
50%
55%
60%
65%
70%
75%
80%
85%
90%
95%
100%
2000 2001 2002 2003 2004 2005 2006 2007 2008 2009 2010 2011 2012 2013 2014 2015
Very Confident Somewhat Confident Not Too Confident Not At All Confident Don't Know/Refused
Source: Employee Benefit Research Institute and Greenwald & Associates, 2000‒2015 Retirement Confidence Surveys.
Figure 10Retiree Confidence in Having Enough Money to Pay for Long‐Term Care
How confident are you that you will have enough money to pay for long‐term care, such as nursing home or home health care, should you need it during your retirement?
23%
15%
34%
25%
16%
25%
33%
22%
38%
17%
29%
15%
27%
18%
23%
30%
Preparing for Retirement
Retirement Planning
Worker confidence that they are doing a good job of preparing financially for retirement continues to rebound from the low in 2013. The percentage very confident, which declined to 17 percent in 2013, increased to 25 percent in 2015 (statistically equivalent to the levels measured between 2003 and 2007). However, the percentage not at all confident,

ebri.org Issue Brief • April 2015 • No. 413 12
which rose from 12 percent in 2008 to 21 percent in 2013, remains at 18 percent in this year’s RCS. Combining that percentage with the 14 percent of workers who say they are not too confident shows that one-third (32 percent) indicate they lack confidence in their financial preparations for retirement, compared with two-thirds who are confident (25 percent very confident and 43 percent somewhat confident) (Figure 11).
0%
5%
10%
15%
20%
25%
30%
35%
40%
45%
50%
55%
60%
65%
70%
75%
80%
85%
90%
95%
100%
1993 1994 1995 1996 1997 1998 1999 2000 2001 2002 2003 2004 2005 2006 2007 2008 2009 2010 2011 2012 2013 2014 2015
Very Confident Somewhat Confident Not Too Confident Not At All Confident Don't Know/Refused
Figure 11Worker Confidence in Financial Preparation for Retirement
How confident are you that you are doing a good job of preparing financially for your retirement?
Source: Employee Benefit Research Institute and Greenwald & Associates, 1993‒2015 Retirement Confidence Surveys.
18%
14%
43%
25%
13%
15%
45%
26%
9%
17%
50%
23%
15%
20%
42%
22%
14%
49%
20%
16%
The percentage of retirees who are very confident that they had done a good job of preparing for retirement rose in the 2015 RCS to 37 percent. This percentage fell from 42 percent in 2006 to 26 percent in 2008 and remained steady statistically through 2014. Another 37 percent are somewhat confident. That said, 14 percent of retirees continue to be not at all confident about having done a good job (statistically unchanged from the 15 percent who expressed that sentiment in 2013) (Figure 12).
0%
5%
10%
15%
20%
25%
30%
35%
40%
45%
50%
55%
60%
65%
70%
75%
80%
85%
90%
95%
100%
1993 1994 1995 1996 1997 1998 1999 2000 2001 2002 2003 2004 2005 2006 2007 2008 2009 2010 2011 2012 2013 2014 2015
Very Confident Somewhat Confident Not Too Confident Not At All Confident Don't Know/Refused
Figure 12Retiree Confidence in Financial Preparation for Retirement
How confident are you that you did a good job of preparing financially for your retirement?
Source: Employee Benefit Research Institute and Greenwald & Associates, 1993‒2015 Retirement Confidence Surveys.
14%
10%
37%
37%
18%
6%
34%
41%
7%
10%
41%
39%
9%
16%
40%
34%
ebri.org Issue Brief • April 2015 • No. 413 13
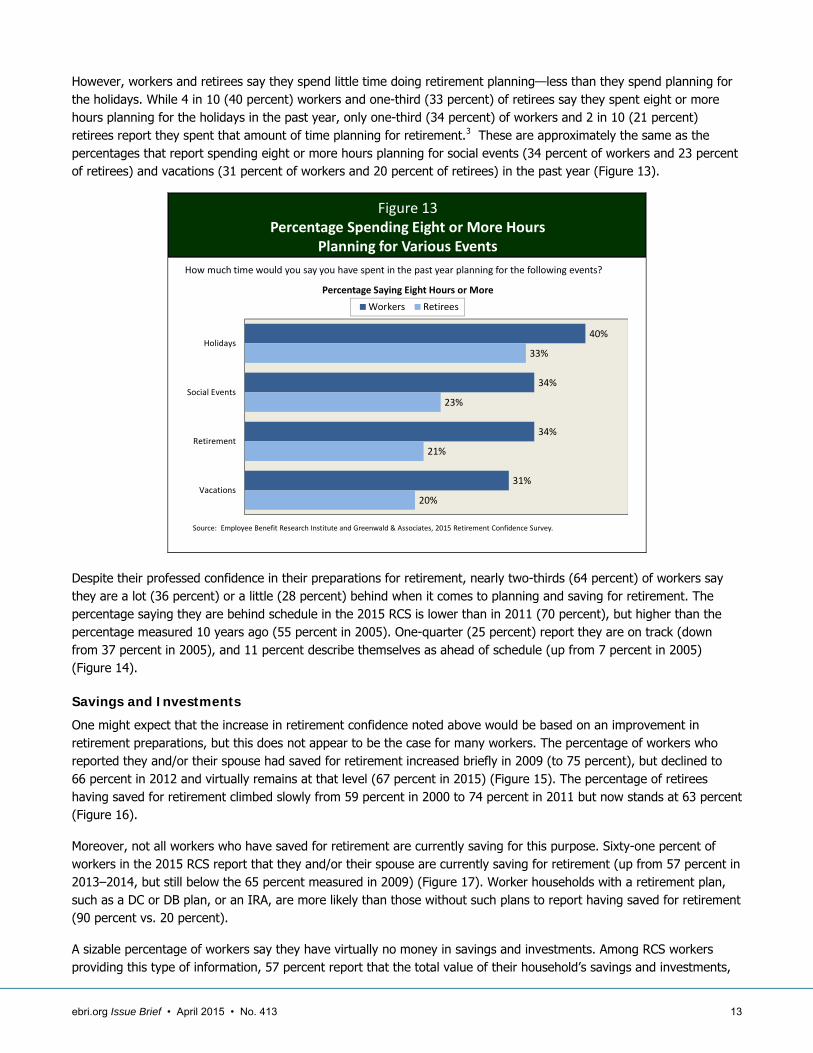
However, workers and retirees say they spend little time doing retirement planning—less than they spend planning for the holidays. While 4 in 10 (40 percent) workers and one-third (33 percent) of retirees say they spent eight or more hours planning for the holidays in the past year, only one-third (34 percent) of workers and 2 in 10 (21 percent) retirees report they spent that amount of time planning for retirement.3 These are approximately the same as the percentages that report spending eight or more hours planning for social events (34 percent of workers and 23 percent of retirees) and vacations (31 percent of workers and 20 percent of retirees) in the past year (Figure 13).
40%
34%
34%
31%
33%
23%
21%
20%
Holidays
Social Events
Retirement
Vacations
Workers Retirees
Figure 13Percentage Spending Eight or More Hours
Planning for Various Events
Source: Employee Benefit Research Institute and Greenwald & Associates, 2015 Retirement Confidence Survey.
How much time would you say you have spent in the past year planning for the following events?
Percentage Saying Eight Hours or More
Despite their professed confidence in their preparations for retirement, nearly two-thirds (64 percent) of workers say they are a lot (36 percent) or a little (28 percent) behind when it comes to planning and saving for retirement. The percentage saying they are behind schedule in the 2015 RCS is lower than in 2011 (70 percent), but higher than the percentage measured 10 years ago (55 percent in 2005). One-quarter (25 percent) report they are on track (down from 37 percent in 2005), and 11 percent describe themselves as ahead of schedule (up from 7 percent in 2005) (Figure 14).
Savings and Investments
One might expect that the increase in retirement confidence noted above would be based on an improvement in retirement preparations, but this does not appear to be the case for many workers. The percentage of workers who reported they and/or their spouse had saved for retirement increased briefly in 2009 (to 75 percent), but declined to 66 percent in 2012 and virtually remains at that level (67 percent in 2015) (Figure 15). The percentage of retirees having saved for retirement climbed slowly from 59 percent in 2000 to 74 percent in 2011 but now stands at 63 percent (Figure 16).
Moreover, not all workers who have saved for retirement are currently saving for this purpose. Sixty-one percent of workers in the 2015 RCS report that they and/or their spouse are currently saving for retirement (up from 57 percent in 2013–2014, but still below the 65 percent measured in 2009) (Figure 17). Worker households with a retirement plan, such as a DC or DB plan, or an IRA, are more likely than those without such plans to report having saved for retirement (90 percent vs. 20 percent).
A sizable percentage of workers say they have virtually no money in savings and investments. Among RCS workers providing this type of information, 57 percent report that the total value of their household’s savings and investments,

ebri.org Issue Brief • April 2015 • No. 413 14
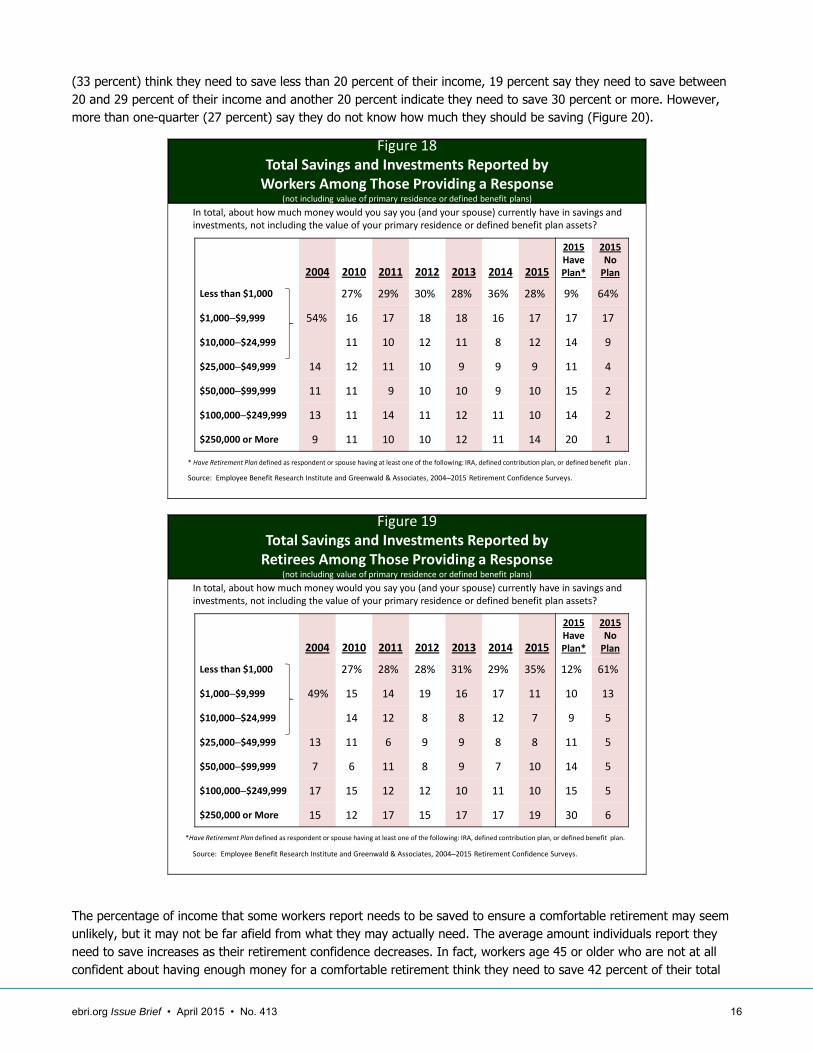
excluding the value of their primary home and any defined benefit plans, is less than $25,000. This includes 28 percent who say they have less than $1,000 in savings. Approximately 1 in 10 each report totals of $25,000–$49,999 (9 per-cent), $50,000–$99,999 (10 percent), $100,000–$249,999 (10 percent), and $250,000 or more (14 percent, up from 11 percent in 2014) (Figure 18). Retirees provide similar estimates of total household savings (Figure 19).4
Figure 14Worker Assessment of Progress in Planning and Saving for Retirement
When it comes to planning and saving for retirement, would you say that you are ahead of schedule, on track, or behind schedule?
Source: Employee Benefit Research Institute and Mathew Greenwald & Associates, 2002‒2015 Retirement Confidence Surveys
2%
3%
34%
25%
33%
3%
3%
4%
37%
23%
32%
1%
2%
6%
21%
30%
40%
1%
3%
6%
22%
30%
37%
1%
4%
7%
25%
28%
36%
0%
A lot ahead of schedule
A little ahead of schedule
On track
A little behind schedule
A lot behind schedule
Don't know/refused
2002 2005 2011
2012 2015
Figure 15Workers Having Saved Money for Retirement
Not including Social Security or employer‐provided money, have you (and/or your spouse) personally saved any money for retirement? These savings could include money you personally put into a retirement plan at work.
Source: Employee Benefit Research Institute and Greenwald & Associates, 1994‒2015 Retirement Confidence Surveys.
57% 58% 60%
66%
59%
68%
74%
65% 67% 68%
73%78%
69%72% 71%
68% 69% 70%66%
72%75%
69% 68% 66% 66% 64%67%
1994 1995 1996 1997 1998 1999 2000 2001 2002 2003 2004 2005 2006 2007 2008 2009 2010 2011 2012 2013 2014 2015
Respondent Respondent and/or Spouse
The majority of those who indicate they and their spouse do not have a retirement plan (DC, DB, or IRA) say their assets total less than $1,000, compared with approximately 1 in 10 of those who have a plan (among workers, 64 per-cent vs. 9 percent; among retirees, 61 percent vs. 12 percent). At the same time, those without a retirement plan are far less likely than those with a plan to report assets of $100,000 or more (among workers, 3 percent vs. 34 percent; among retirees, 11 percent vs. 45 percent).

ebri.org Issue Brief • April 2015 • No. 413 15
Figure 16Retirees Having Saved Money for Retirement
Not including Social Security or employer‐provided money, did you (and/or your spouse) personally save any money for retirement before you retired? These savings could include money you personally put into a retirement plan at work.
Source: Employee Benefit Research Institute and Greenwald & Associates, 1994‒2015 Retirement Confidence Surveys.
52%48%
52% 50%
59%
66%
54%59% 61% 63%
67%
59% 61% 62% 64% 65% 66% 68% 68%64% 62%
71%74%
68%71%
66%63%
1994 1995 1996 1997 1998 1999 2000 2001 2002 2003 2004 2005 2006 2007 2008 2009 2010 2011 2012 2013 2014 2015
Respondent Respondent and/or Spouse
Figure 17Workers Currently Saving Money for Retirement
Are you (and/or your spouse) currently saving for retirement?
Source: Employee Benefit Research Institute and Greenwald & Associates, 2001‒2015 Retirement Confidence Surveys.
61% 61% 62%58%
62% 64%60%
64% 65%60% 59% 58% 57% 57%
61%
2001 2002 2003 2004 2005 2006 2007 2008 2009 2010 2011 2012 2013 2014 2015
Older workers also tend to report higher amounts of assets. Seventy-seven percent of workers ages 25–34 have total savings and investments of less than $25,000, compared with 42 percent of workers ages 45 and older. At the same time, 23 percent of workers ages 45 and older cite assets of $250,000 or more (versus less than 4 percent of workers ages 25–34).
Many workers acknowledge their savings shortfalls for retirement, stating they need to save a sizeable, perhaps unmanageable, chunk of their total household income in order to live comfortably in retirement. While one-third
ebri.org Issue Brief • April 2015 • No. 413 16
(33 percent) think they need to save less than 20 percent of their income, 19 percent say they need to save between 20 and 29 percent of their income and another 20 percent indicate they need to save 30 percent or more. However, more than one-quarter (27 percent) say they do not know how much they should be saving (Figure 20).
Figure 18Total Savings and Investments Reported byWorkers Among Those Providing a Response
(not including value of primary residence or defined benefit plans)
In total, about how much money would you say you (and your spouse) currently have in savings and investments, not including the value of your primary residence or defined benefit plan assets?
2004 2010 2011 2012 2013 2014 2015
2015HavePlan*
2015NoPlan
Less than $1,000
54%
27% 29% 30% 28% 36% 28% 9% 64%
$1,000‒$9,999 16 17 18 18 16 17 17 17
$10,000‒$24,999 11 10 12 11 8 12 14 9
$25,000‒$49,999 14 12 11 10 9 9 9 11 4
$50,000‒$99,999 11 11 9 10 10 9 10 15 2
$100,000‒$249,999 13 11 14 11 12 11 10 14 2
$250,000 or More 9 11 10 10 12 11 14 20 1
Source: Employee Benefit Research Institute and Greenwald & Associates, 2004‒2015 Retirement Confidence Surveys.
* Have Retirement Plan defined as respondent or spouse having at least one of the following: IRA, defined contribution plan, or defined benefit plan .
Figure 19Total Savings and Investments Reported by Retirees Among Those Providing a Response
(not including value of primary residence or defined benefit plans)
In total, about how much money would you say you (and your spouse) currently have in savings and investments, not including the value of your primary residence or defined benefit plan assets?
2004 2010 2011 2012 2013 2014 2015
2015HavePlan*
2015NoPlan
Less than $1,000
49%
27% 28% 28% 31% 29% 35% 12% 61%
$1,000‒$9,999 15 14 19 16 17 11 10 13
$10,000‒$24,999 14 12 8 8 12 7 9 5
$25,000‒$49,999 13 11 6 9 9 8 8 11 5
$50,000‒$99,999 7 6 11 8 9 7 10 14 5
$100,000‒$249,999 17 15 12 12 10 11 10 15 5
$250,000 or More 15 12 17 15 17 17 19 30 6
Source: Employee Benefit Research Institute and Greenwald & Associates, 2004‒2015 Retirement Confidence Surveys.
*Have Retirement Plan defined as respondent or spouse having at least one of the following: IRA, defined contribution plan, or defined benefit plan.
The percentage of income that some workers report needs to be saved to ensure a comfortable retirement may seem unlikely, but it may not be far afield from what they may actually need. The average amount individuals report they need to save increases as their retirement confidence decreases. In fact, workers age 45 or older who are not at all confident about having enough money for a comfortable retirement think they need to save 42 percent of their total

ebri.org Issue Brief • April 2015 • No. 413 17
household income, on average, from now until they retire (Figure 21). Not surprisingly, those who are not confident about their retirement prospects are also more likely to say they do not know how much they need to save. As one might expect, the percentage of workers who report they need to save each year is inversely related to current levels of saving and investments. Further, those without a household retirement plan (DC, DB, or IRA) are more likely than those with a plan to think they need to save at least 50 percent of their income (18 percent vs. 8 percent) and to say they do not know how much they need to save (39 percent vs. 22 percent).
Figure 20Percentage of Household Income That Workers Think They Need to Save to Live Comfortably in Retirement
About what percentage of your total household income do you think you (and your spouse) need to save each year from now until you expect to retire so you can live comfortably throughout your retirement?
Source: Employee Benefit Research Institute and Greenwald & Associates, 2015 Retirement Confidence Survey.
8%
16%
9%
19%
7%
2%
11%
27%
Under 10%
10%‒14%
15%‒19%
20%‒29%
30%‒39%
40%‒49%
50% or More
Don't know
18% 17%
31%
39%
20%
24%
28%
42%
Very confident Somewhat confident Not too confident Not at all confident
Under 45 45 or Older
Figure 21Average Percentage of Income Needing to be Saved for Workers to Live Comfortably in Retirement, by Retirement Confidence and Age
Source: Employee Benefit Research Institute and Greenwald & Associates, 2015 Retirement Confidence Survey.
About what percentage of your total household income do you think you (and your spouse) need to save each year from now until you expect to retire so you can live comfortably throughout your retirement?

ebri.org Issue Brief • April 2015 • No. 413 18
In fact, many workers acknowledge they can save more than they are currently saving. Seven in 10 (69 percent, up from 62 percent in 2011) say it is possible for them to save $25 a week more than they are currently saving. This includes 55 percent of workers who have not saved any money for retirement. What would they have to give up to save this money for retirement? Almost half (46 percent) report they would give up eating out or take-out food. Others would give up:
Soft drinks or snacks from vending machines (13 percent).
Movies, videos, DVDs or streaming (12 percent).
Coffee from specialty shops (11 percent).
Lottery tickets (8 percent).
However, one-quarter (24 percent) state they would not need to give up anything to save the extra $25 a week.
But if workers recognize they need to save more to ensure a comfortable retirement and also acknowledge they can save at least $25 a week more, why aren’t they doing so? Half—50 percent—say they simply can’t afford it due to the cost of living and the press of day-to-day expenses. Other reasons for not saving, or not saving more, for retirement include:
Currently unemployed or underemployed (11 percent).
Education expenses (8 percent).
Paying off non-mortgage debt (7 percent).
Paying off a mortgage or housing expenses (5 percent).
However, 1 in 10 (10 percent) report they don’t need to save or save more and 6 percent say they haven’t thought about it.
Debt
Americans are less likely now than in the early years of this decade to describe their debt as a problem. Thirteen percent of workers (down from 20 percent in 2014) and 9 percent of retirees (down from 16 percent) report their level of debt is a major problem. An additional 38 percent of workers and 22 percent of retirees describe it as a minor problem. Forty-nine percent of workers say debt is not a problem for them, an increase of 7 percentage points from the 42 percent measured last year and 12 percentage points from the 37 percent in 2011. Two-thirds (67 percent) of retirees surveyed report they do not have a problem with debt, up sharply from the 55 percent who said the same in 2014, but that percentage was still below the 69 percent in 2005 (Figure 22). Among workers, the most frequently reported types of debt are mortgages (46 percent), car loans (38 percent), and credit card debt (37 percent). Retirees most often report having a mortgage (23 percent), credit card debt (27 percent), home equity line of credit (17 per-cent), or car loan (17 percent) (Figure 23).
Only one-quarter (26 percent) of employed workers say they think that it is even somewhat likely that they would be unable to work for six months or longer due to an illness or disability. Most say they think it is not too (34 percent) or not at all (36 percent) likely they would be unable to work for six months or more for such a reason. In fact, only half (50 percent) of employed workers report having long-term disability insurance, either through their employer or on their own.
Even with long-term disability insurance, a six-month disability can have major consequences for retirement and retirement preparations. Yet many workers fail to recognize this. When asked about the likely consequences of a six-month disability on their retirement and preparations for retirement, one-third (33 percent) say it would have no effect

ebri.org Issue Brief • April 2015 • No. 413 19
and another 7 percent state it would have little impact. Others recognize the potential consequences of such an event, most often saying it would have a major impact/effect (14 percent); they would have to make up lost savings when they returned to work (9 percent); they would have to stop or reduce their retirement contribution (7 percent); they would be unable to retire (7 percent); or they would have to dip into savings (5 percent). One in 10 (10 percent) are unable to say what the effect might be.
Figure 22Worker and Retiree Perception of Debt Load
Thinking about your current financial situation, how would you describe your level of debt?
Source: Employee Benefit Research Institute and Greenwald & Associates, 2005‒2015 Retirement Confidence Surveys.
20%
39% 40%
6%
24%
69%
22%
41%37%
15%
27%
57%
20%
38%42%
16%
28%
55%
13%
38%
49%
9%
22%
67%
A MajorProblem
A MinorProblem
Not aProblem
A MajorProblem
A MinorProblem
Not aProblem
2005 2011 2014 2015
Workers Retirees
9%
4%
1%
17%
14%
3%
27%
17%
23%
17%
4%
5%
15%
21%
23%
37%
38%
46%
Some other type of debt
Home improvement loans
A loan from a workplace retirement plan
A home equity line of credit
Debt from health expenses
College or student loans
Credit card debt
Car loans
A mortgage
Workers
Retirees
Figure 23Types of Debt Owned by Workers and Retirees
Source: Employee Benefit Research Institute and Greenwald & Associates, 2015 Retirement Confidence Survey.
Do you (and your spouse) currently have any of the following types of debt?
ebri.org Issue Brief • April 2015 • No. 413 20
Retirement Plans
One of the primary vehicles that workers use to save for retirement is an employer-sponsored retirement savings plan, such as a 401(k). Indeed, 71 percent of employed workers (48 percent of all workers in the RCS) report they are offered such a plan with their current employer, and more than three-quarters (83 percent) of eligible employees (40 percent of all workers) say they contribute money to their employer’s plan.
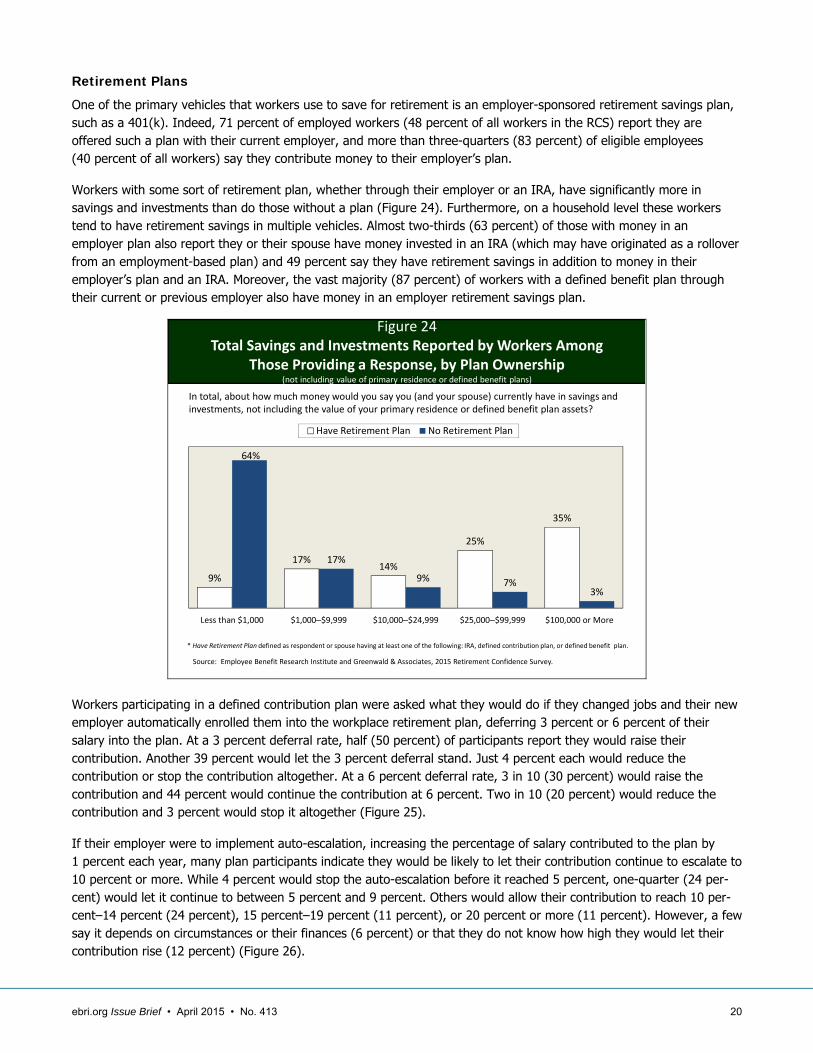
Workers with some sort of retirement plan, whether through their employer or an IRA, have significantly more in savings and investments than do those without a plan (Figure 24). Furthermore, on a household level these workers tend to have retirement savings in multiple vehicles. Almost two-thirds (63 percent) of those with money in an employer plan also report they or their spouse have money invested in an IRA (which may have originated as a rollover from an employment-based plan) and 49 percent say they have retirement savings in addition to money in their employer’s plan and an IRA. Moreover, the vast majority (87 percent) of workers with a defined benefit plan through their current or previous employer also have money in an employer retirement savings plan.
Figure 24Total Savings and Investments Reported by Workers Among
Those Providing a Response, by Plan Ownership(not including value of primary residence or defined benefit plans)
In total, about how much money would you say you (and your spouse) currently have in savings and investments, not including the value of your primary residence or defined benefit plan assets?
Source: Employee Benefit Research Institute and Greenwald & Associates, 2015 Retirement Confidence Survey.
9%
17%14%
25%
35%
64%
17%
9% 7%3%
Less than $1,000 $1,000‒$9,999 $10,000‒$24,999 $25,000‒$99,999 $100,000 or More
Have Retirement Plan No Retirement Plan
* Have Retirement Plan defined as respondent or spouse having at least one of the following: IRA, defined contribution plan, or defined benefit plan.
Workers participating in a defined contribution plan were asked what they would do if they changed jobs and their new employer automatically enrolled them into the workplace retirement plan, deferring 3 percent or 6 percent of their salary into the plan. At a 3 percent deferral rate, half (50 percent) of participants report they would raise their contribution. Another 39 percent would let the 3 percent deferral stand. Just 4 percent each would reduce the contribution or stop the contribution altogether. At a 6 percent deferral rate, 3 in 10 (30 percent) would raise the contribution and 44 percent would continue the contribution at 6 percent. Two in 10 (20 percent) would reduce the contribution and 3 percent would stop it altogether (Figure 25).
If their employer were to implement auto-escalation, increasing the percentage of salary contributed to the plan by 1 percent each year, many plan participants indicate they would be likely to let their contribution continue to escalate to 10 percent or more. While 4 percent would stop the auto-escalation before it reached 5 percent, one-quarter (24 per-cent) would let it continue to between 5 percent and 9 percent. Others would allow their contribution to reach 10 per-cent–14 percent (24 percent), 15 percent–19 percent (11 percent), or 20 percent or more (11 percent). However, a few say it depends on circumstances or their finances (6 percent) or that they do not know how high they would let their contribution rise (12 percent) (Figure 26).

ebri.org Issue Brief • April 2015 • No. 413 21
Figure 25Likely Reaction of Plan Participants if
Auto‐enrolled at 3% and 6%
Source: Employee Benefit Research Institute and Greenwald & Associates, 2015 Retirement Confidence Survey.
Suppose you changed jobs and your new employer automatically enrolled you into their workplace retirement plan, deferring 3%/6% of your salary into the plan. Which one of the following do you think you would be most likely to do?
50%
39%
4%
4%
2%
30%
44%
20%
3%
2%
Raise the contribution
Continue the contribution at auto‐enrolledlevel
Reduce the contribution
Stop the contribution all together
Don't know/Refused
Enrolled at 3%
Enrolled at 6%
Figure 26Likely Percentage of Salary at Which Plan
Participants Would Discontinue Auto‐escalation
Source: Employee Benefit Research Institute and Greenwald & Associates, 2015 Retirement Confidence Survey.
Suppose your employer automatically increased the percentage of your salary contributed to the plan by 1% each year. How high do you think you would let your contribution go before you discontinued the automatic increases?
4%
24%
24%
11%
11%
4%
2%
6%
12%
Less than 5%
5%‒9%
10%‒14%
15%‒19%
20% or more
Already at plan/legal maximum
Immediately/before first increase
Depends on circumstances/finances
Don't know
In recent years, a number of organizations have developed calculators to estimate how much a certain level of savings would be likely to provide as monthly income in retirement. Almost two-thirds (64 percent) of plan participants report they currently receive this type of information from their employer. Furthermore, a large majority of plan participants say they find, or would find, this information very (51 percent) or somewhat (37 percent) useful. Just 1 in 10 indicate it would be not too (6 percent) or not at all (5 percent) useful.

ebri.org Issue Brief • April 2015 • No. 413 22
Target Setting
A sense of savings shortfall notwithstanding, many workers continue to be unaware of how much they need to save for retirement. Less than half (48 percent) of workers report they and/or their spouse have ever tried to calculate how much money they will need to have saved so that they can live comfortably in retirement. The 48 percent that report trying to do a retirement-savings-needs calculation in the 2015 RCS is statistically comparable to many of the percentages reported from 2008–2014 (Figure 27).
Figure 27Workers Having Tried to Calculate How Much Money They Need to Save for a Comfortable Retirement
Have you (or your spouse) tried to figure out how much money you will need to have saved by the time you retire so that you can live comfortably in retirement?
Source: Employee Benefit Research Institute and Greenwald & Associates, 1993‒2015 Retirement Confidence Surveys.
32% 31% 32%29%
33%
42%45%
51%
39%
32%
37%
48%
53%
44%
38%
43% 42% 42% 42% 43%47%
44%46%
42% 42%46%
44%48%
1993 1994 1995 1996 1997 1998 1999 2000 2001 2002 2003 2004 2005 2006 2007 2008 2009 2010 2011 2012 2013 2014 2015
Respondent Respondent and/or Spouse
The likelihood of trying to do a retirement savings needs calculation increases with household income, education, and financial assets. Workers reporting they or their spouse have a DC, DB, or IRA plan are twice as likely as those who do not have such a plan to have tried a calculation (60 percent vs. 23 percent). In addition, married workers (compared with unmarried workers) and retirement savers (compared with nonsavers) more often report trying to do a calculation.
The methods of obtaining the estimate of retirement savings needs are quite varied. Workers often guess at how much they will need to accumulate (39 percent), rather than doing a systematic retirement needs calculation. Twenty-six percent indicate they did their own estimate and 22 percent say they asked a financial adviser. Other methods of obtaining this estimate include using an online calculator (10 percent), reading or hearing how much is needed (10 per-cent), asking someone other than a financial adviser (6 percent), and filling out a worksheet or form (6 percent).
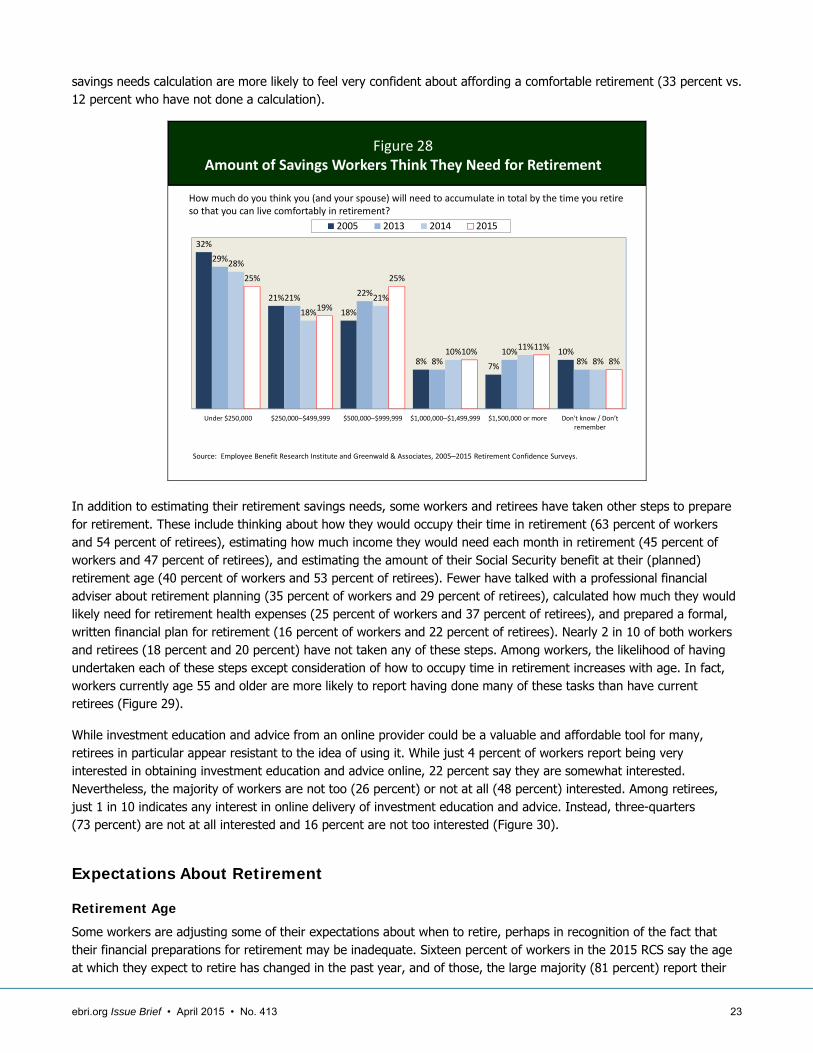
Considering the aggressive savings target percentages acknowledged earlier, it is not surprising that most workers (65 percent) say they need $250,000 or more saved to retire comfortably (Figure 28).
As found in prior iterations of the RCS, workers who have done a retirement savings needs calculation tend to report higher savings goals than do workers who have not done the calculation. In this year’s RCS, 29 percent of workers who have done a calculation, compared with 12 percent of those who have not, estimate they need to accumulate at least $1 million for retirement. At the other extreme, 20 percent of those who have done a calculation, compared with 29 percent who have not, think they need to save less than $250,000 for retirement. Savings goals tend to increase with household income. In particular, those with household incomes of at least $75,000 are almost three times as likely as those with lower incomes to report they need to accumulate at least $1 million for retirement (35 percent vs. 12 per-cent). Also consistent with prior RCS findings, despite higher savings goals, workers who have done a retirement
ebri.org Issue Brief • April 2015 • No. 413 23
savings needs calculation are more likely to feel very confident about affording a comfortable retirement (33 percent vs. 12 percent who have not done a calculation).
Figure 28Amount of Savings Workers Think They Need for Retirement
How much do you think you (and your spouse) will need to accumulate in total by the time you retire so that you can live comfortably in retirement?
Source: Employee Benefit Research Institute and Greenwald & Associates, 2005‒2015 Retirement Confidence Surveys.
32%
21%
18%
8%7%
10%
29%
21%22%
8%10%
8%
28%
18%
21%
10%11%
8%
25%
19%
25%
10%11%
8%
Under $250,000 $250,000‒$499,999 $500,000‒$999,999 $1,000,000‒$1,499,999 $1,500,000 or more Don't know / Don’t remember
2005 2013 2014 2015
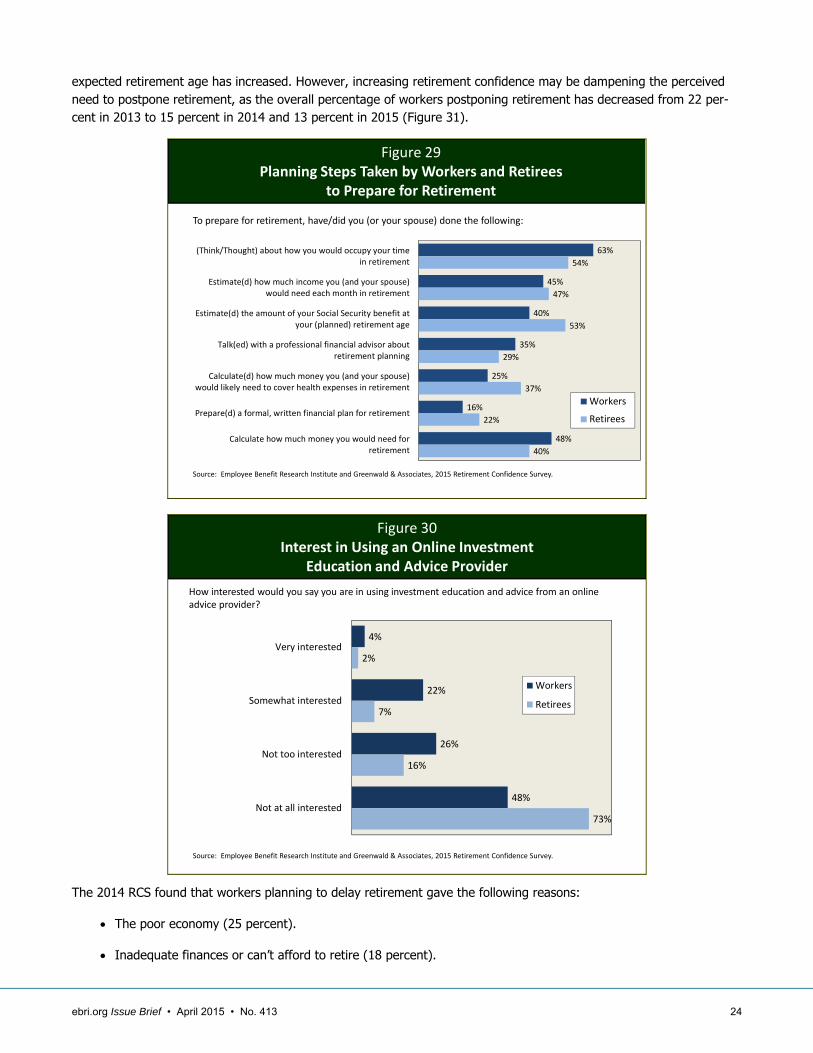
In addition to estimating their retirement savings needs, some workers and retirees have taken other steps to prepare for retirement. These include thinking about how they would occupy their time in retirement (63 percent of workers and 54 percent of retirees), estimating how much income they would need each month in retirement (45 percent of workers and 47 percent of retirees), and estimating the amount of their Social Security benefit at their (planned) retirement age (40 percent of workers and 53 percent of retirees). Fewer have talked with a professional financial adviser about retirement planning (35 percent of workers and 29 percent of retirees), calculated how much they would likely need for retirement health expenses (25 percent of workers and 37 percent of retirees), and prepared a formal, written financial plan for retirement (16 percent of workers and 22 percent of retirees). Nearly 2 in 10 of both workers and retirees (18 percent and 20 percent) have not taken any of these steps. Among workers, the likelihood of having undertaken each of these steps except consideration of how to occupy time in retirement increases with age. In fact, workers currently age 55 and older are more likely to report having done many of these tasks than have current retirees (Figure 29).
While investment education and advice from an online provider could be a valuable and affordable tool for many, retirees in particular appear resistant to the idea of using it. While just 4 percent of workers report being very interested in obtaining investment education and advice online, 22 percent say they are somewhat interested. Nevertheless, the majority of workers are not too (26 percent) or not at all (48 percent) interested. Among retirees, just 1 in 10 indicates any interest in online delivery of investment education and advice. Instead, three-quarters (73 percent) are not at all interested and 16 percent are not too interested (Figure 30).
Expectations About Retirement
Retirement Age
Some workers are adjusting some of their expectations about when to retire, perhaps in recognition of the fact that their financial preparations for retirement may be inadequate. Sixteen percent of workers in the 2015 RCS say the age at which they expect to retire has changed in the past year, and of those, the large majority (81 percent) report their
ebri.org Issue Brief • April 2015 • No. 413 24
expected retirement age has increased. However, increasing retirement confidence may be dampening the perceived need to postpone retirement, as the overall percentage of workers postponing retirement has decreased from 22 per-cent in 2013 to 15 percent in 2014 and 13 percent in 2015 (Figure 31).
Figure 29Planning Steps Taken by Workers and Retirees
to Prepare for Retirement
Source: Employee Benefit Research Institute and Greenwald & Associates, 2015 Retirement Confidence Survey.
To prepare for retirement, have/did you (or your spouse) done the following:
63%
45%
40%
35%
25%
16%
48%
54%
47%
53%
29%
37%
22%
40%
(Think/Thought) about how you would occupy your timein retirement
Estimate(d) how much income you (and your spouse)would need each month in retirement
Estimate(d) the amount of your Social Security benefit atyour (planned) retirement age
Talk(ed) with a professional financial advisor aboutretirement planning
Calculate(d) how much money you (and your spouse)would likely need to cover health expenses in retirement
Prepare(d) a formal, written financial plan for retirement
Calculate how much money you would need forretirement
Workers
Retirees
Figure 30Interest in Using an Online Investment
Education and Advice Provider
Source: Employee Benefit Research Institute and Greenwald & Associates, 2015 Retirement Confidence Survey.
How interested would you say you are in using investment education and advice from an online advice provider?
4%
22%
26%
48%
2%
7%
16%
73%
Very interested
Somewhat interested
Not too interested
Not at all interested
Workers
Retirees
The 2014 RCS found that workers planning to delay retirement gave the following reasons:
The poor economy (25 percent).
Inadequate finances or can’t afford to retire (18 percent).

ebri.org Issue Brief • April 2015 • No. 413 25
A change in employment situation (17 percent).
Needing to pay for health care costs (12 percent).
Lack of faith in Social Security or government (9 percent).
Higher-than-expected cost of living (9 percent).
Wanting to make sure they have enough money to retire comfortably (8 percent).
14%
25%24%
20%21%
22%
15%13%
2008 2009 2010 2011 2012 2013 2014 2015
Figure 31Workers Expecting to Retire Later Than Planned
Do you now expect to retire later, at an older age than before?
Source: Employee Benefit Research Institute and Greenwald & Associates, 2008‒2015 Retirement Confidence Surveys.
While responses to a question asking the age at which workers expect to retire shows little change from one year to another, the long-term trend shows that the age at which workers plan to retire has crept upward over time. In particular, the percentage of workers who expect to retire after age 65 has increased, from 11 percent in 1991, to 19 percent in 2000, 24 percent in 2005, 33 percent in 2010, and 36 percent in the 2015 RCS (Figure 32). Additionally, 1 in 10 in the 2015 RCS (10 percent) say they never plan to retire. Nevertheless, the median (midpoint) age at which workers expect to retire has remained stable at 65 for most of this time.
The actual retirement age reported by retirees has changed even more slowly. In 1991, only 8 percent of retirees said they retired after age 65. This percentage is 14 percent in 2015 (statistically equivalent with the 16 percent measured in 2014) (Figure 33). The median (midpoint) age at which retirees report they retired has remained at age 62 throughout this time.
This difference between workers’ expected retirement age and retirees’ actual age of retirement suggests that a considerable gap exists between workers’ expectations and retirees’ experience. Just 9 percent of workers say they plan to retire before age 60, compared with 36 percent of retirees who report they retired that early. Sixteen percent of workers plan to retire between the ages of 60–64, although 29 percent of retirees retired in that age range. On the other hand, 26 percent of workers plan to wait (compared with 6 percent of retirees who actually waited) at least until age 70 to retire and 10 percent of workers indicate they will never retire. As one might expect, workers who are not confident about their financial security in retirement plan to retire later, on average, than those who express confidence.

ebri.org Issue Brief • April 2015 • No. 413 26
19%
31%
34%
2%
9%
22% 22%
28%
6%
13%
4%
16%
19%
26%
7%
17%
6%
9%
19%
24%
9%
24%
9%9%
18%
23%
11%
22%
10%9%
16%
21%
10%
26%
10%
Before 60 60‐64 65 66‐69 70 or Older Never Retire
1991 2000 2005 2010 2014 2015
Figure 32Trend in Workers’ Expected Retirement Age
Source: Employee Benefit Research Institute and Greenwald & Associates, 1991‒2015 Retirement Confidence Surveys.
Realistically, at what age do you expect to retire?
Figure 33Trend in Retirees’ Actual Retirement Age
Source: Employee Benefit Research Institute and Greenwald & Associates, 1991‒2015 Retirement Confidence Surveys
38%
41%
11%
1%
7%
31%
38%
8%9%
5%
30%
35%
15%
7%5%
31%30%
12% 12%
8%
35%
32%
11%
7%9%
36%
29%
9%8%
6%
Before 60 60‒64 65 66‒69 70 or older
1991 2000 2005 2010 2014 2015
How old were you when you retired?
One reason for the gap between workers’ expectations and retirees’ experience is many Americans find themselves retiring unexpectedly. The RCS has consistently found that a large percentage of retirees leave the work force earlier than planned (50 percent in 2015) (Figure 34). Many retirees who retired earlier than planned cite hardships for leaving the work force when they did, including health problems or disability (60 percent), changes at their company, such as downsizing or closure (27 percent), and having to care for a spouse or another family member (22 percent). Others say changes in the skills required for their job (10 percent) or other work-related reasons (22 percent) played a role. Of

ebri.org Issue Brief • April 2015 • No. 413 27
course, some retirees mention positive reasons for retiring early, such as being able to afford an earlier retirement (31 percent) or wanting to do something else (17 percent).
52%
40%
48% 49%
45%
40%
36%39%
45%
39%37%
40%38% 37%
51%
47%
41%
45%
50%47%
49% 50%
43%
53%
42%39%
42%
48%
52%
48% 47% 48%
52%50%
52%55%
40%42%
49%46%
37%
43%
38%40%
3% 3%
7% 7%5% 5% 6% 5% 5% 5% 6% 5% 5% 5% 4%
7%4% 3%
9%6% 7%
5%
1991 1992 1993 1994 1995 1996 1997 1998 1999 2000 2001 2002 2003 2004 2005 2006 2007 2008 2009 2010 2011 2012 2013 2014 2015
Earlier Than Planned About When Planned Later Than Planned
Figure 34Timing of Retirement, Among Retirees
Did you retire earlier than you planned, later than you planned, or about when you planned?
Source: Employee Benefit Research Institute and Greenwald & Associates, 1991‒2015 Retirement Confidence Surveys.No data.
The financial consequences of an unplanned early retirement can be heavy. Retirees who retire earlier than planned are more likely than those who retire when expected or later to say they are not confident about having enough money for a comfortable retirement or about paying for basic expenses, medical expenses, and long-term care expenses.
Working for Pay in Retirement
In another expectations gap, the RCS has consistently found that workers are far more likely to expect to work for pay in retirement than retirees are to have actually worked. The percentage of workers planning to work for pay in retirement now stands at 67 percent, compared with just 23 percent of retirees who report they worked for pay in retirement (Figure 35).
Almost all retirees who worked for pay in retirement in the 2014 RCS gave a positive reason for doing so, saying they did so because they enjoyed working (83 percent) or wanted to stay active and involved (79 percent). However, they said that financial reasons also played a role in that decision, such as wanting money to buy extras (54 percent), needing money to make ends meet (52 percent), a decrease in the value of their savings or investments (38 percent), or keeping health insurance or other benefits (34 percent).
A financial rationale for working in retirement is even more important to workers. Among those expecting to work for pay in retirement in the 2014 RCS, 81 percent indicated they would need the money to make ends meet, and three-quarters (74 percent) wanted to keep health insurance or other benefits. Nevertheless, workers gave other reasons as well, saying they want to stay active and involved (90 percent), and enjoy working.
Sources of Retirement Income
While the majority of retirees (90 percent) report that Social Security provides a source of income for them and their spouse (63 percent say it is a major source of income), workers and their spouses continue to expect to draw their retirement income from a wide variety of sources. (Social Security is the federal program that provides income replacement for the aged and disability coverage for eligible workers and their dependents).

ebri.org Issue Brief • April 2015 • No. 413 28
Figure 35Comparison of Expected (Workers Expecting to Retire)
and Actual (Retirees) Work for Pay in Retirement
Do you think you will do any work for pay after you retire?/Have you worked for pay since you retired?
Source: Employee Benefit Research Institute and Greenwald & Associates, 1998‒2015 Retirement Confidence Surveys.
56%
66%63%
61%
66%70%
68%66% 67% 66%
63%
72%70%
74%70% 69%
65%67%
22%
27%
22%26%
24%28%
32%
26% 27%
37%
25%
34%
23% 23%27%
25%27%
23%
1998 1999 2000 2001 2002 2003 2004 2005 2006 2007 2008 2009 2010 2011 2012 2013 2014 2015
Workers Retirees
Eighty percent of current workers expect Social Security to be a major or minor source of income in retirement, but they believe that personal savings will also play a large role. At least two-thirds each say they anticipate receiving retirement income from an employer-sponsored retirement savings plan (74 percent), an IRA (69 percent), and other personal savings and investments (66 percent). Seventy-three percent expect employment to provide them with a source of income in retirement and 55 percent expect to receive income from an employer-sponsored traditional pension or cash balance plan. In contrast to workers, retirees are less likely to expect to rely on any form of personal savings or on employment for their income in retirement (Figure 36).
Figure 36 Expected (Workers Expecting to Retire) and Actual (Retirees)
Sources of Income in Retirement
31%
63%
46%
21%
16%
8%
28%
16%
23%
19%
27%
33%
49%
27%
28%
19%
57%
17%
41%
26%
43%
25%
28%
17%
80%90%
74%40%
73%25%
69%42%
66%44%
55%50%
WorkersRetirees
WorkersRetirees
WorkersRetirees
WorkersRetirees
WorkersRetirees
WorkersRetirees
Major Source Minor Source
Source: Employee Benefit Research Institute and Greenwald & Associates, 2015 Retirement Confidence Survey.
Employer‐sponsored retirement savings plan
Other personal savings and investments
Social Security
Individual retirement account or IRA
Employer‐provided traditional pension or cash balance plan
Employment
Do you expect will be/Is the following a major source of income, a minor source of income, or not a source of income in your (and your spouse’s) retirement?
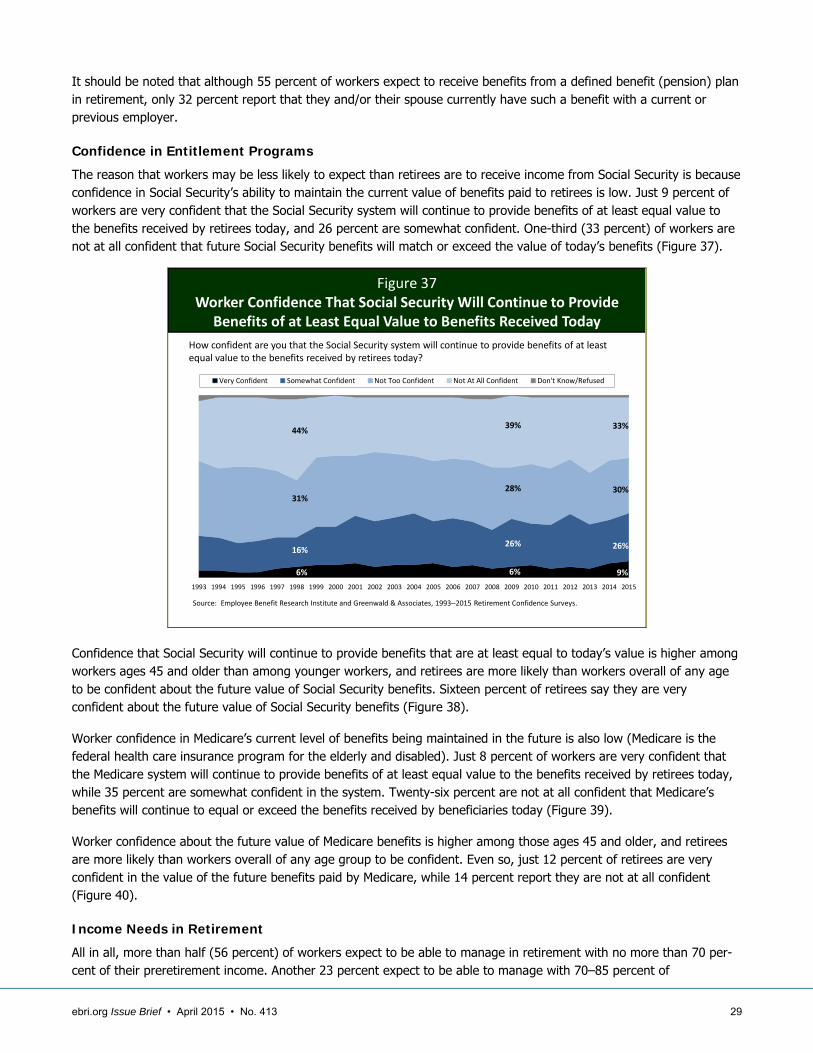
ebri.org Issue Brief • April 2015 • No. 413 29
It should be noted that although 55 percent of workers expect to receive benefits from a defined benefit (pension) plan in retirement, only 32 percent report that they and/or their spouse currently have such a benefit with a current or previous employer.
Confidence in Entitlement Programs
The reason that workers may be less likely to expect than retirees are to receive income from Social Security is because confidence in Social Security’s ability to maintain the current value of benefits paid to retirees is low. Just 9 percent of workers are very confident that the Social Security system will continue to provide benefits of at least equal value to the benefits received by retirees today, and 26 percent are somewhat confident. One-third (33 percent) of workers are not at all confident that future Social Security benefits will match or exceed the value of today’s benefits (Figure 37).
0%
10%
20%
30%
40%
50%
60%
70%
80%
90%
100%
1993 1994 1995 1996 1997 1998 1999 2000 2001 2002 2003 2004 2005 2006 2007 2008 2009 2010 2011 2012 2013 2014 2015
Very Confident Somewhat Confident Not Too Confident Not At All Confident Don't Know/Refused
Figure 37Worker Confidence That Social Security Will Continue to Provide
Benefits of at Least Equal Value to Benefits Received Today
How confident are you that the Social Security system will continue to provide benefits of at least equal value to the benefits received by retirees today?
Source: Employee Benefit Research Institute and Greenwald & Associates, 1993‒2015 Retirement Confidence Surveys.
33%
30%
26%
9%
39%
28%
26%
6%
44%
31%
16%
6%
Confidence that Social Security will continue to provide benefits that are at least equal to today’s value is higher among workers ages 45 and older than among younger workers, and retirees are more likely than workers overall of any age to be confident about the future value of Social Security benefits. Sixteen percent of retirees say they are very confident about the future value of Social Security benefits (Figure 38).
Worker confidence in Medicare’s current level of benefits being maintained in the future is also low (Medicare is the federal health care insurance program for the elderly and disabled). Just 8 percent of workers are very confident that the Medicare system will continue to provide benefits of at least equal value to the benefits received by retirees today, while 35 percent are somewhat confident in the system. Twenty-six percent are not at all confident that Medicare’s benefits will continue to equal or exceed the benefits received by beneficiaries today (Figure 39).
Worker confidence about the future value of Medicare benefits is higher among those ages 45 and older, and retirees are more likely than workers overall of any age group to be confident. Even so, just 12 percent of retirees are very confident in the value of the future benefits paid by Medicare, while 14 percent report they are not at all confident (Figure 40).
Income Needs in Retirement
All in all, more than half (56 percent) of workers expect to be able to manage in retirement with no more than 70 per-cent of their preretirement income. Another 23 percent expect to be able to manage with 70–85 percent of

ebri.org Issue Brief • April 2015 • No. 413 30
preretirement income. Just 16 percent of workers say they will need an income replacement ratio in retirement of at least 85 percent. The cited income replacement rates are in line with retirees’ reported experience. Fifty-seven percent of retirees say their income in retirement is no more than 70 percent of their preretirement income, 12 percent say it is 70–85 percent, and 12 percent say it is at least 85 percent (5 percent of workers and 19 percent of retirees are unable to estimate the replacement ratio) (Figure 41).
0%
10%
20%
30%
40%
50%
60%
70%
80%
90%
100%
1993 1994 1995 1996 1997 1998 1999 2000 2001 2002 2003 2004 2005 2006 2007 2008 2009 2010 2011 2012 2013 2014 2015
Very Confident Somewhat Confident Not Too Confident Not At All Confident Don't Know/Refused
How confident are you that the Social Security system will continue to provide benefits of at least equal value to the benefits received by retirees today?
Source: Employee Benefit Research Institute and Greenwald & Associates, 1993‒2015 Retirement Confidence Surveys.
15%
24%
41%
16%
17%
24%
43%
13%
7%
20%
38%
28%
11%
36%
36%
7%
11%
Figure 38Retiree Confidence That Social Security Will Continue to Provide
Benefits of at Least Equal Value to Benefits Received Today
0%
10%
20%
30%
40%
50%
60%
70%
80%
90%
100%
1993 1994 1995 1996 1997 1998 1999 2000 2001 2002 2003 2004 2005 2006 2007 2008 2009 2010 2011 2012 2013 2014 2015
Very Confident Somewhat Confident Not Too Confident Not At All Confident Don't Know/Refused
Figure 39Worker Confidence That Medicare Will Continue to Provide Benefits of at Least Equal Value to Benefits Received Today
How confident are you that the Medicare system will continue to provide benefits of at least equal value to the benefits received by retirees today?
Source: Employee Benefit Research Institute and Greenwald & Associates, 1993‒2015 Retirement Confidence Surveys.
26%
31%
35%
8%
26%
35%
33%
5%
26%
40%
28%
5%
38%
38%
19%
Income in retirement is often needed not only to support the immediate household, but also to provide support to relatives and friends. Three in 10 (29 percent) workers and 2 in 10 (20 percent) retirees report they are currently providing financial support to a relative or friend. Among those who provide this type of support, the most common recipients are children age 18 or older (38 percent of workers and 58 percent of retirees), children under 18 (37 per-

ebri.org Issue Brief • April 2015 • No. 413 31
cent of workers and 10 percent or retirees), parents or parents-in-law (22 percent of workers and 5 percent of retirees), and grandchildren (6 percent of workers and 24 percent of retirees).
0%
10%
20%
30%
40%
50%
60%
70%
80%
90%
100%
1993 1994 1995 1996 1997 1998 1999 2000 2001 2002 2003 2004 2005 2006 2007 2008 2009 2010 2011 2012 2013 2014 2015
Very Confident Somewhat Confident Not Too Confident Not At All Confident Don't Know/Refused
Figure 40Retiree Confidence That Medicare Will Continue to Provide Benefits of at Least Equal Value to Benefits Received Today
How confident are you that the Medicare system will continue to provide benefits of at least equal value to the benefits received by retirees today?
Source: Employee Benefit Research Institute and Greenwald & Associates, 1993‒2015 Retirement Confidence Surveys.
14%
26%
44%
12%
11%
31%
37%
16%
13%
16%
49%
14%
20%
36%
28%
6%
10%13%
26%
50%
9%
Figure 41Worker (Expectation of Needed) and Retiree (Actual)
Income Replacement Ratio in Retirement
Source: Employee Benefit Research Institute and Greenwald & Associates, 2015 Retirement Confidence Survey.
Including all the different sources that provide you with income in retirement, about what percentage of your pre‐retirement income (do you think you (and your spouse) will need to live comfortably in retirement /is your current household income)?
22%
34%
23%
6%
5%
5%
5%
29%
28%
12%
5%
4%
3%
19%
Less than 50%
50% up to 70%
70% up to 85%
85% up to 95%
95% up to 105%
105% or more
Don't know/Refused
Workers
Retirees
The provision of unpaid care can also put a strain on resources by increasing expenses and decreasing the time and energy available for other activities. Twenty-three percent of workers and 16 percent of retirees state they are currently providing unpaid care to a relative or friend. Among those providing such care, the most frequent recipient of this care is a parent or parent-in-law (53 percent of workers and 28 percent of retirees). They also provide care to:
A friend (13 percent of workers and 11 percent of retirees).

ebri.org Issue Brief • April 2015 • No. 413 32
A child age 18 or older (10 percent and 22 percent).
A sibling (10 percent and 13 percent).
A child under 18 (8 percent and 5 percent).
A grandchild (4 percent and 13 percent).
Some other relative (15 percent and 13 percent).
While retirees are often thought of providing this type of care for their spouse, just 5 percent of retirees and 4 percent of workers name their spouse as a recipient of their care. The plurality of those who provide unpaid care do so for less than nine hours a week (42 percent of workers and 37 percent of retirees), but sizable percentages provide this care for nine to 20 hours a week (31 percent and 24 percent) or 21 hours or more (22 percent and 21 percent) (5 percent of workers and 18 percent of retirees providing unpaid care are unable to estimate the number of hours) (Figure 42).
Figure 42Number of Hours a Week Spent Providing Unpaid Care,
Among Workers and Retirees Providing Care
Approximately how many hours per week do you spend providing this unpaid care?
Source: Employee Benefit Research Institute and Greenwald & Associates, 2015 Retirement Confidence Survey.
18%
21%
24%
37%
5%
22%
31%
42%
Don't know/Refused
21 hours a week or more
9 to 20 hours a week
Less than 9 hours a week
Workers
Retirees
Longevity
Most workers and retirees expect to live at least until age 85, but only a minority thinks they are at least somewhat likely to reach age 95. Among workers, 35 percent say they are very likely to live to age 85 and 40 percent say they are somewhat likely to do so. Similarly, 36 percent of retirees under the age of 85 expect to live until that age, and another 36 percent think it somewhat likely they will do so. On the other hand, just 8 percent of workers and 9 percent of retirees feel they are very likely to live until age 95 and one-quarter say it is somewhat likely (25 percent of workers and 24 percent of retirees). One-third each state it is not at all likely that they will reach age 95 (Figure 43).
Workers express a moderate level of interest in purchasing an insurance product when they retire that begins providing guaranteed monthly income at some point in the future, such as age 80 or 85. Eight percent of workers indicate they are very interested and 30 percent report they are somewhat interested. However, interest among retirees is very low, with just 1 in 10 saying they are very (2 percent) or somewhat (8 percent) interested in purchasing this type of product. Instead, 70 percent of retirees say they are not at all interested (Figure 44).
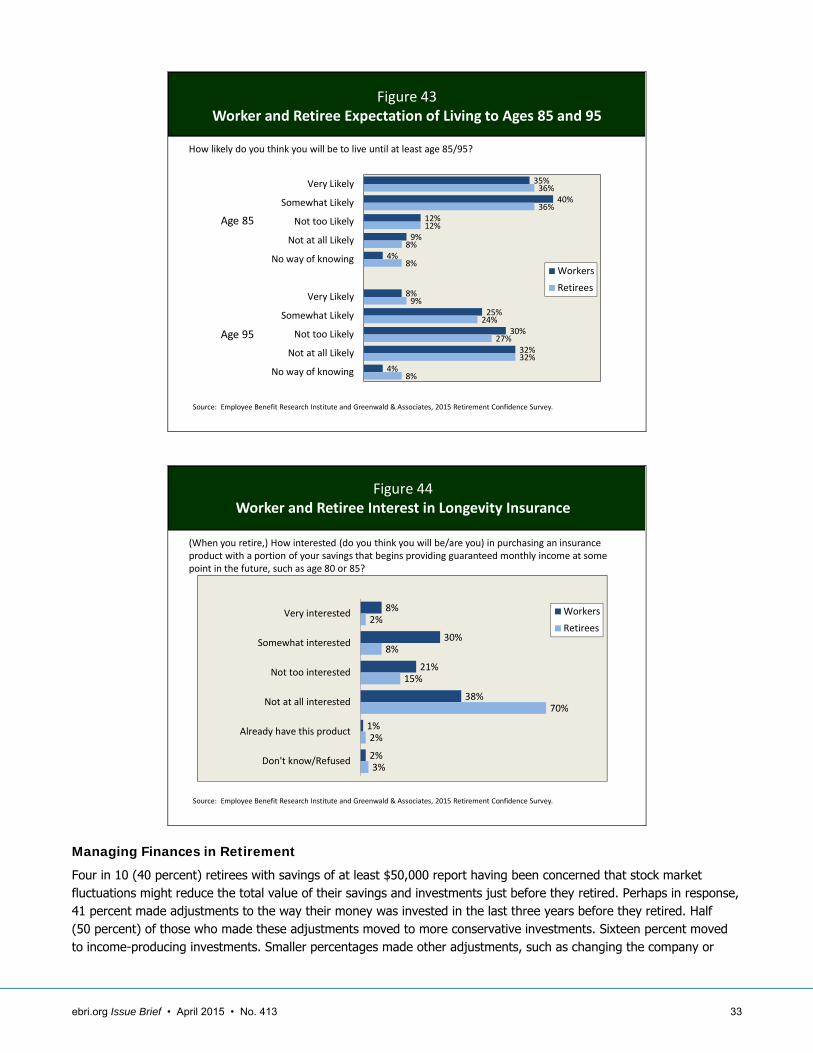
ebri.org Issue Brief • April 2015 • No. 413 33
Figure 43Worker and Retiree Expectation of Living to Ages 85 and 95
Source: Employee Benefit Research Institute and Greenwald & Associates, 2015 Retirement Confidence Survey.
How likely do you think you will be to live until at least age 85/95?
35%
40%
12%
9%
4%
8%
25%
30%
32%
4%
36%
36%
12%
8%
8%
9%
24%
27%
32%
8%
Very Likely
Somewhat Likely
Not too Likely
Not at all Likely
No way of knowing
Very Likely
Somewhat Likely
Not too Likely
Not at all Likely
No way of knowing
Workers
Retirees
Age 85
Age 95
Figure 44Worker and Retiree Interest in Longevity Insurance
Source: Employee Benefit Research Institute and Greenwald & Associates, 2015 Retirement Confidence Survey.
(When you retire,) How interested (do you think you will be/are you) in purchasing an insurance product with a portion of your savings that begins providing guaranteed monthly income at some point in the future, such as age 80 or 85?
8%
30%
21%
38%
1%
2%
2%
8%
15%
70%
2%
3%
Very interested
Somewhat interested
Not too interested
Not at all interested
Already have this product
Don't know/Refused
Workers
Retirees
Managing Finances in Retirement
Four in 10 (40 percent) retirees with savings of at least $50,000 report having been concerned that stock market fluctuations might reduce the total value of their savings and investments just before they retired. Perhaps in response, 41 percent made adjustments to the way their money was invested in the last three years before they retired. Half (50 percent) of those who made these adjustments moved to more conservative investments. Sixteen percent moved to income-producing investments. Smaller percentages made other adjustments, such as changing the company or
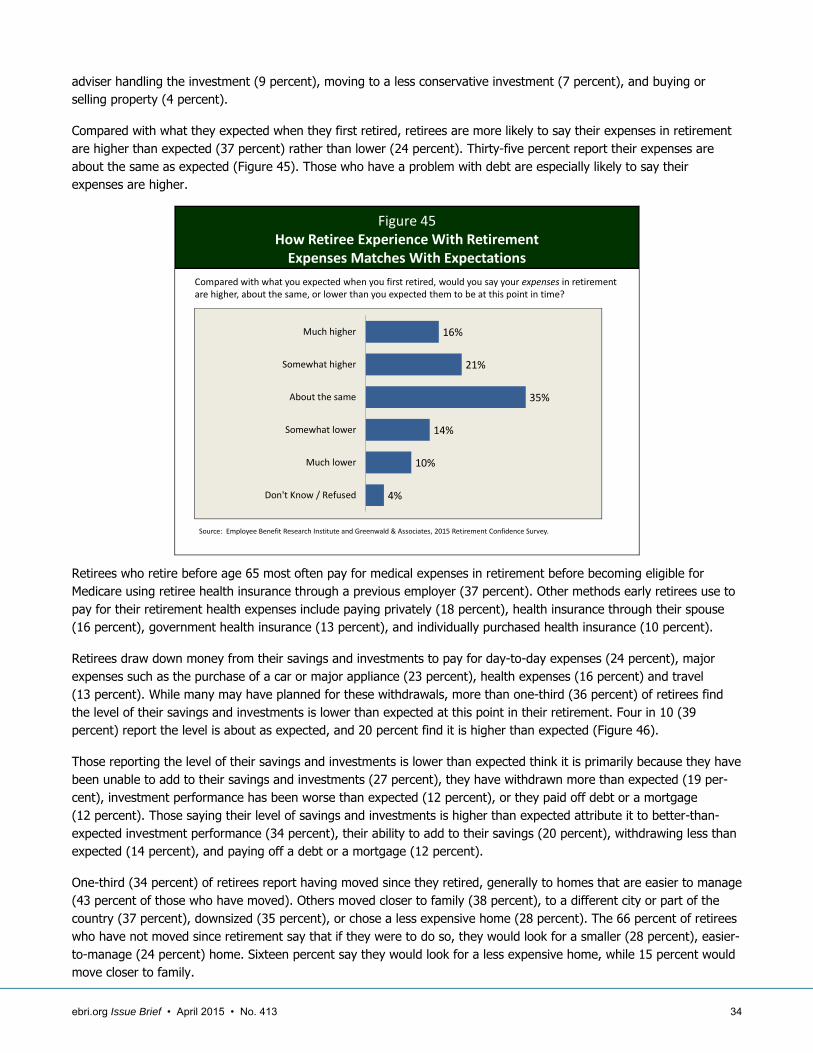
ebri.org Issue Brief • April 2015 • No. 413 34
adviser handling the investment (9 percent), moving to a less conservative investment (7 percent), and buying or selling property (4 percent).
Compared with what they expected when they first retired, retirees are more likely to say their expenses in retirement are higher than expected (37 percent) rather than lower (24 percent). Thirty-five percent report their expenses are about the same as expected (Figure 45). Those who have a problem with debt are especially likely to say their expenses are higher.
Figure 45How Retiree Experience With Retirement Expenses Matches With Expectations
Source: Employee Benefit Research Institute and Greenwald & Associates, 2015 Retirement Confidence Survey.
Compared with what you expected when you first retired, would you say your expenses in retirement are higher, about the same, or lower than you expected them to be at this point in time?
16%
21%
35%
14%
10%
4%
Much higher
Somewhat higher
About the same
Somewhat lower
Much lower
Don't Know / Refused
Retirees who retire before age 65 most often pay for medical expenses in retirement before becoming eligible for Medicare using retiree health insurance through a previous employer (37 percent). Other methods early retirees use to pay for their retirement health expenses include paying privately (18 percent), health insurance through their spouse (16 percent), government health insurance (13 percent), and individually purchased health insurance (10 percent).
Retirees draw down money from their savings and investments to pay for day-to-day expenses (24 percent), major expenses such as the purchase of a car or major appliance (23 percent), health expenses (16 percent) and travel (13 percent). While many may have planned for these withdrawals, more than one-third (36 percent) of retirees find the level of their savings and investments is lower than expected at this point in their retirement. Four in 10 (39 percent) report the level is about as expected, and 20 percent find it is higher than expected (Figure 46).
Those reporting the level of their savings and investments is lower than expected think it is primarily because they have been unable to add to their savings and investments (27 percent), they have withdrawn more than expected (19 per-cent), investment performance has been worse than expected (12 percent), or they paid off debt or a mortgage (12 percent). Those saying their level of savings and investments is higher than expected attribute it to better-than-expected investment performance (34 percent), their ability to add to their savings (20 percent), withdrawing less than expected (14 percent), and paying off a debt or a mortgage (12 percent).
One-third (34 percent) of retirees report having moved since they retired, generally to homes that are easier to manage (43 percent of those who have moved). Others moved closer to family (38 percent), to a different city or part of the country (37 percent), downsized (35 percent), or chose a less expensive home (28 percent). The 66 percent of retirees who have not moved since retirement say that if they were to do so, they would look for a smaller (28 percent), easier-to-manage (24 percent) home. Sixteen percent say they would look for a less expensive home, while 15 percent would move closer to family.

ebri.org Issue Brief • April 2015 • No. 413 35
Figure 46How Retiree Experience With Level of Savings and
Investments Matches With Expectations
Source: Employee Benefit Research Institute and Greenwald & Associates, 2015 Retirement Confidence Survey.
Compared with what you expected when you first retired, would you say your current level of savings and investments are higher, about the same, or lower than you expected them to be at this point in time?
20%
16%
39%
14%
6%
5%
Much lower
Somewhat lower
About the same
Somewhat higher
Much higher
Don't Know /Refused

ebri.org Issue Brief • April 2015 • No. 413 36
RCS Methodology These findings are part of the 25th annual Retirement Confidence Survey (RCS), a survey that gauges the views and attitudes of working-age and retired Americans regarding retirement, their preparations for retirement, their confidence with regard to various aspects of retirement, and related issues. The survey was conducted in January and February 2015 through 20-minute telephone interviews with 2,004 individuals (1,003 workers and 1,001 retirees) age 25 and older in the United States. Random digit dialing was used to obtain a representative cross section of the U.S. population. To further increase representation, a cell phone supplement was added to the sample. Starting with the 2001 wave of the RCS, all data are weighted by age, sex, and education to reflect the actual proportions in the adult population. Data for waves of the RCS conducted before 2001 have been weighted to allow for consistent comparisons; consequently, some data in the 2015 RCS may differ slightly with data published in previous waves of the RCS. Data presented in tables in this report may not total to 100 due to rounding and/or missing categories.
In theory, the weighted samples of 1,003 workers and 1,001 retirees yield a statistical precision of plus or minus 3.5 percentage points (with 95 percent certainty) of what the results would be if all Americans age 25 and older were surveyed with complete accuracy. There are other possible sources of error in all surveys, however, that may be more serious than theoretical calculations of sampling error. These include refusals to be interviewed and other forms of nonresponse, the effects of question wording and question order, and screening. While attempts are made to minimize these factors, it is impossible to quantify the errors that may result from them.
The RCS was co-sponsored by the Employee Benefit Research Institute (EBRI), a private, nonprofit, nonpartisan public policy research organization; and Greenwald & Associates, a Washington, DC-based market research firm. The 2015 RCS data collection was funded by grants from a number of public and private organizations, with staff time donated by EBRI and Greenwald & Associates. RCS materials and a list of underwriters may be accessed at the EBRI website: www.ebri.org/surveys/rcs
Endnotes 1 In the RCS, retiree refers to individuals who are retired or who are age 65 or older and not employed full time. Worker refers to all individuals who are not defined as retirees, regardless of employment status.
2 For example, in 2014 just 3 percent of workers who described their debt as a major problem said they were very confident about having enough money to live comfortably throughout retirement, compared with 29 percent of workers who indicated debt was not a problem. On the other hand, 49 percent of workers with a major debt problem were not at all confident about having enough money for a financially secure retirement, compared with 16 percent of workers without a debt problem.
3 The last time the question was asked in 2003, the percentages spending more than eight hours planning for retirement were approximately the same (36 percent for workers and 21 percent for retirees).
4 These findings are in line with other estimates of assets owned by American families. Estimates of data from the 2013 Survey of Consumer Finances (SCF) (conducted by the U.S. Federal Reserve Board) find that the median amount of financial (liquid countable assets, i.e., stocks, bonds, money, individual account retirement plans, etc.) assets for American families was $17,500 in 2013. For those families owning an individual account retirement plan, the median financial asset level was $103,010, while for the families without such plans it was $1,500. (Source: unpublished estimates from the SCF by the Employee Benefit Research Institute, 2015).

1100 13th Street NW · Suite 878 Washington, DC 20005
(202) 659-0670 www.ebri.org
www.choosetosave.org
Where the world turns for the facts on U.S. employee benefits. Retirement and health benefits are at the heart of workers’, employers’, and our nation’s economic security. Founded in 1978, EBRI is the most authoritative and objective source of information on these critical, complex issues. EBRI focuses solely on employee benefits research — no lobbying or advocacy.
EBRI stands alone in employee benefits research as an independent, nonprofit, and nonpartisan organization. It analyzes and reports research data without spin or underlying agenda. All findings, whether on financial data, options, or trends, are revealing and reliable — the reason EBRI information is the gold standard for private analysts and decision makers, government policymakers, the media, and the public.
EBRI explores the breadth of employee benefits and related issues.
EBRI studies the world of health and retirement benefits — issues such as 401(k)s, IRAs, retirement income adequacy, consumer-driven benefits, Social Security, tax treatment of both retirement and health benefits, cost management, worker and employer attitudes, policy reform proposals, and pension assets and funding. There is widespread recognition that if employee benefits data exist, EBRI knows it.
EBRI delivers a steady stream of invaluable research and analysis.
EBRI publications include in-depth coverage of key issues and trends; summaries of research findings and policy developments; timely factsheets on hot topics; regular updates on legislative and regulatory developments; comprehensive reference resources on benefit programs and workforce issues; and major surveys of public attitudes.
EBRI meetings present and explore issues with thought leaders from all sectors. EBRI regularly provides congressional testimony, and briefs policymakers, member organizations,
and the media on employer benefits. EBRI issues press releases on newsworthy developments, and is among the most widely quoted
sources on employee benefits by all media. EBRI directs members and other constituencies to the information they need and undertakes new
research on an ongoing basis. EBRI maintains and analyzes the most comprehensive database of 401(k)-type programs in the
world. Its computer simulation analyses on Social Security reform and retirement income adequacy are unique.
EBRI makes information freely available to all.
EBRI assumes a public service responsibility to make its findings completely accessible at www.ebri.org — so that all decisions that relate to employee benefits, whether made in Congress or board rooms or families’ homes, are based on the highest quality, most dependable information. EBRI’s Web site posts all research findings, publications, and news alerts. EBRI also extends its education and public service role to improving Americans’ financial knowledge through its award-winning public service campaign ChoosetoSave® and the companion site www.choosetosave.org
EBRI is supported by organizations from all industries and sectors that appreciate the value of unbiased, reliable information on employee benefits. Visit www.ebri.org/about/join/ for more.

CHECK OUT EBRI’S WEBSITE! EBRI’s website is easy to use and packed with useful information! Look for these special features:
• EBRI’s entire library of research publications starts at the main Web page. Click on EBRI Issue Briefs and EBRI Notes for our in-depth and nonpartisan periodicals.
• Visit EBRI’s blog.
• EBRI’s reliable health and retirement surveys are just a click away through the topic boxes at the top of the page.
• Need a number? Check out the EBRI Databook on Employee Benefits.
• Instantly get e-mail notifications of the latest EBRI data, surveys, publications, and meetings and seminars by clicking on the “Notify Me” or “RSS” buttons at the top of our home page.
There’s lots more!
Visit EBRI online today: www.ebri.org

Established in 1978, the Employee BenefitResearch Institute (EBRI) is the only independent nonprofit, nonpartisan organization committed exclusively to datadissemination, research, and education oneconomic security and employee benefits.
The Institute seeks to advance the public’s,the media’s and policymakers’ knowledgeand understanding of employee benefits andtheir importance to our nation’s economy.
EBRI’s mission is to contribute to, toencourage, and to enhance the developmentof sound employee benefit programs andsound public policy through objectiveresearch and education.
EBRI has earned widespread regard as an organization that “tells it like it is,”based on the facts. As the Bylaws state:“In all its activities, the Institute shallfunction strictly in an objective and unbiased manner and not as an advocateor opponent of any position.”

EBRI Employee Benefit Research Institute Issue Brief (ISSN 0887137X) is published monthly by the Employee Benefit Research Institute, 1100 13th St. NW, Suite 878, Washington, DC, 20005-4051, at $300 per year or is included as part of a membership subscription. Periodi-cals postage rate paid in Washington, DC, and additional mailing offices. POSTMASTER: Send address changes to: EBRI Issue Brief, 1100 13th St. NW, Suite 878, Washington, DC, 20005-4051. Copyright 2015 by Employee Benefit Research Institute. All rights reserved. No. 413.
The Employee Benefit Research Institute (EBRI) was founded in 1978. Its mission is to contribute to, to encourage, and to enhance the development of sound employee benefit programs and sound public policy through objective research and education. EBRI is the only private, nonprofit, nonpartisan, Washington, DC-based organization committed exclusively to public policy research and education on economic security and employee benefit issues. EBRI’s membership includes a cross-section of pension funds; businesses; trade associations; labor unions; health care providers and insurers; government organizations; and service firms.
EBRI’s work advances knowledge and understanding of employee benefits and their importance to the nation’s economy among policymakers, the news media, and the public. It does this by conducting and publishing policy research, analysis, and special reports on employee benefits issues; holding educational briefings for EBRI members, congressional and federal agency staff, and the news media; and sponsoring public opinion surveys on employee benefit issues. EBRI’s Education and Research Fund (EBRI-ERF) performs the charitable, educational, and scientific functions of the Institute. EBRI-ERF is a tax-exempt organization supported by contributions and grants.
EBRI Issue Briefs is a monthly periodical with in-depth evaluation of employee benefit issues and trends, as well as critical analyses of employee benefit policies and proposals. EBRI Notes is a monthly periodical providing current information on a variety of employee benefit topics. EBRIef is a weekly roundup of EBRI research and insights, as well as updates on surveys, studies, litigation, legislation and regulation affecting employee benefit plans, while EBRI’s Blog supplements our regular publications, offering commentary on questions received from news reporters, policymakers, and others. The EBRI Databook on Employee Benefits is a statistical reference work on employee benefit programs and work force-related issues.
Contact EBRI Publications, (202) 659-0670; fax publication orders to (202) 775-6312. Subscriptions to EBRI Issue Briefs are included as part of EBRI membership, or as part of a $199 annual subscription to EBRI Notes and EBRI Issue Briefs. Change of Address: EBRI, 1100 13th St. NW, Suite 878, Washington, DC, 20005-4051, (202) 659-0670; fax number, (202) 775-6312; e-mail: [email protected] Membership Information: Inquiries regarding EBRI membership and/or contributions to EBRI-ERF should be directed to EBRI President Dallas Salisbury at the above address, (202) 659-0670; e-mail: [email protected]
Editorial Board: Dallas L. Salisbury, publisher; Stephen Blakely, editor. Any views expressed in this publication and those of the authors should not be ascribed to the officers, trustees, members, or other sponsors of the Employee Benefit Research Institute, the EBRI Education and Research Fund, or their staffs. Nothing herein is to be construed as an attempt to aid or hinder the adoption of any pending legislation, regulation, or interpretative rule, or as legal, accounting, actuarial, or other such professional advice. www.ebri.org
EBRI Issue Brief is registered in the U.S. Patent and Trademark Office. ISSN: 0887137X/90 0887137X/90 $ .50+.50
© 2015, Employee Benefit Research InstituteEducation and Research Fund. All rights reserved.
Who we are
What we do
Our publications
Orders/ Subscriptions