The 2015 New Jersey Elder Economic Security Standard™ Index 2015 EESS Index... · THE ELDER...
59
The 2015 New Jersey Elder Economic Security Standard™ Index January 2017 State of New Jersey Department of Human Services Division of Aging Services
-
Upload
dangnguyet -
Category
Documents
-
view
215 -
download
1
Transcript of The 2015 New Jersey Elder Economic Security Standard™ Index 2015 EESS Index... · THE ELDER...
The 2015 New Jersey Elder Economic Security Standard™
IndexJanuary 2017
State of New JerseyDepartment of Human Services
Division of Aging Services
The New Jersey Department of Human Services (NJ DHS) complies with applicable Federal civil rights laws and does not discriminate on the basis of race, color, national origin, age, disability, or sex. NJ DHS does not exclude people or treat them differently because of race, color, national origin, age, disability, or sex. The NJ DHS:
• Provides free aids and services to people with disabilities to communicate effectively with us, such as: Qualified sign language interpreters
• Written information in other formats (large print, audio, accessible electronic formats, other formats)
• Provides free language services to people whose primary language is not English, such as: Qualified interpreters
• Information written in other languages
If you need these services, contact Bonny E. Fraser, Esq., or if you believe that the NJ DHS has failed to provide these services or discriminated in another way on the basis of race, color, national origin, age, disability, or sex, you can file a grievance at: 222 South Warren Street, PO. Box 700, Trenton, New Jersey 08625-0700; phone: 609-777-2026; fax: 609-633-9610; [email protected]. You can also file a civil rights complaint with the U.S. Department of Health and Human Services, Office for Civil Rights, electronically through the Office for Civil Rights Complaint Portal, available at https://ocrportal.hhs.gov/ocr/portal/lobby.jsf, or by mail or phone at: U.S. Department of Health and Human Services 200 Independence Avenue, SW Room 509F, HHH Building Washington, D.C. 20201 1-800-368-1019, 800-537-7697 (TDD) Complaint forms are available at http://www.hhs.gov/ocr/office/file/index.html.
THE ELDER ECONOMIC SECURITY STANDARD™ INDEX The Elder Economic Security Standard Index (the Elder Index), is a tool for use by policy makers, older adults, family caregivers, service providers, aging advocates and the public at large. Developed by the Gerontology Institute at the University of Massachusetts Boston and Wider Opportunities for Women (WOW), the Elder Index is a geographically specific measure of income that older adults require to maintain their independence in the community and meet their daily costs of living, including affordable and appropriate housing and health care. The information developed through the Elder Index helps us understand that many older adults who are not poor, as defined by the official poverty level, still do not have enough income to meet their basic needs. The Elder Index helps answer the following questions: How much income—or combination of personal income and public programs—is needed by older adults living on fixed incomes to cover today’s rising living costs? What is the impact of public programs, such as Medicare, Medicaid, or housing assistance, on an elder’s evolving ability to meet his or her shelter and health needs? How does the need for long-term services and supports affect economic security? Members of the Gerontology Institute primarily responsible for this report are Jan E. Mutchler, Ping Xu and Yang Li. We acknowledge the contributions of Laura Russell in developing the core methodology used in the Elder Index, Ellen Bruce for her leadership and insights on elder economic security, and Judith Conahan for her work developing the long-term care cost component of the Elder Index. We also thank WOW and Gerontology Institute staff members who participated in developing previous state-level reports on the Elder Index upon which the current report is based, including Shawn McMahon, Alison Gottlieb and Jiyoung Lyu. The authors, of course, are responsible for the contents of this report and accept responsibility for any errors or omissions.
The 2015 New Jersey Elder Economic Security Standard™ Index Page ii
Table of Contents
Executive Summary ................................................................................................................. 2
Introduction .............................................................................................................................. 5
The Statewide New Jersey Elder Economic Security Standard Index ..................................... 5
Calculating the Elder Economic Security Standard Index ...................................................... 12
The 2015 Elder Economic Security Standard Index for New Jersey ...................................... 16
Summary of Findings for Mercer County ......................................................................................18
Summary of Findings for Essex County .........................................................................................20
Summary of Findings for Ocean County .......................................................................................22
The Impact of Home and Community-Based Long-Term Services and Supports .................. 23
The Increased Cost of Getting By in New Jersey................................................................... 28
Conclusion ............................................................................................................................. 29
References............................................................................................................................. 30
Appendix A: Data Sources ..................................................................................................... 31
Appendix B: Elder Economic Security Standard Index for New Jersey Counties and Selected Other Areas, 2015 ................................................................................................... 32
The 2015 New Jersey Elder Economic Security Standard™ Index Page 1
The 2015 New Jersey Elder Economic Security Standard™ Index
Executive Summary
Many New Jersey elders age 65 and over struggle to make ends meet. Living costs are high, especially for housing and health care. In the face of rising expenses, many elders receive at most a modest cost of living adjustment each year; thus, they are spending down retirement savings, and/or face growing debt. At the same time, older people strain to be prepared for the present but face a challenging future if their life circumstances change due to illness, loss of a spouse or partner, and/or growing needs for help with daily tasks.
The 2015 Elder Index for New Jersey was tabulated using a national methodology developed by the University of Massachusetts Boston Gerontology Institute (GI) in collaboration with Wider Opportunities for Women (WOW). The Elder Index measures the living expense costs for older adults in today’s economy and helps us answer key questions: What is an adequate income for older adults in New Jersey to “age in place”? How do financial needs vary according to the life circumstances of elders—whether they are living alone or with a spouse or partner, rent or own their home? How do living expenses change as health status and life circumstances change? What happens if elders need long-term care to remain at home? The Elder Index presented in this report may be used to increase public awareness and inform public policies and programs meant to support older adults as they age in their communities. Three previous statewide reports were produced with the support of the New Jersey Foundation for Aging.
A Framework for Measuring Economic Security for Elders
The Elder Economic Security Standard Index (Elder Index) is a measure of the cost of basic expenses of elder households (those exclusively including members age 65 or older) to age in place, continuing to live in the community setting of their choice. The Elder Index defines economic security as the financial status where elders have sufficient income (from Social Security, pension, retirement savings, and other sources) to cover basic and necessary living expenses. The Elder Index is based on the idea that elders should be able to meet their expenses without public support, such as food assistance, energy assistance, subsidized housing or property tax help. It demonstrates the interplay between New Jersey elders’ living expenses and actual income. The Elder Index also illustrates how elders’ living expenses change when their life circumstances change.
This report presents the Elder Index for New Jersey to benchmark basic living expense costs for elder households. It illustrates how expenses vary both by specific New Jersey geographic areas and by the circumstances of elder households, including household size, homeowner or renter status, health status, and the need for long-term care. The expenses are based on market costs and do not assume any public or private supports.
The 2015 New Jersey Elder Economic Security Standard™ Index Page 2
Key Findings for New Jersey
1. New Jersey elders cannot meet their basic living expenses whether they live atthe Federal Poverty Level or the level of the average Social Security benefit. Thisis true of elders statewide, whether they rent or own a home.
o Eight percent of New Jersey’s older adults live at or below the federal poverty level.
o Social Security is the only source of income for 30% of older adults in New Jersey.
o Expenses vary widely across types of communities. For example, elder homeownerswith no mortgage who live alone in Ocean County need $23,160 per year to coverbasic living expenses. In contrast, elder renters living alone in Bergen County needas much as $30,480 to cover basic expenses. The statewide average for single olderadults is $27,264 for an owner with no mortgage, $28,560 for a single renter, and$40,284 for an owner with a mortgage.
o Elder couples who own a home with no mortgage and live in Ocean County need$34,392 per year to cover basic living expenses. In contrast, couples who own ahome with a mortgage living in Bergen County need as much as $57,552 to coverbasic expenses. The statewide average for an older couple is $38,376 for ownerswith no mortgage, $39,672 for couples who rent, and $51,396 for owners with amortgage.
2. Housing costs (mortgage or rent, taxes, utilities and insurance) put a heavy burdenon some elder households, representing as much as half of their total expenses.
• The Elder Index reflects wide variation in housing costs depending on whetherolder adults own, or rent and by county. Older owners without a mortgagetypically have the lowest housing costs, while owners still paying a mortgagetypically have the highest housing costs.
• The monthly housing costs for elder homeowners without a mortgage rangefrom a low of $666 per month in Cumberland County to a high of $1,234 permonth in Essex County.
• The monthly housing costs for older adults paying fair market rent for a onebedroom apartment range from a low of $800 per month in Cape May County toa high of $1,214 per month in Bergen County.
• The monthly housing costs for elder homeowners with a mortgage range from alow of $1,300 per month in Cumberland County to a high of $2,534 per month inBergen County.
The 2015 New Jersey Elder Economic Security Standard™ Index Page 3
3. The Elder Index shows the significance of health care costs for New Jersey elders whomust purchase supplemental health and prescription drug coverage in addition to Medicare.
• The Elder Index includes premium costs of supplemental health and prescriptiondrug coverage to Medicare, which provide critical protection against highmedical and prescription drug costs.
• Older adults in New Jersey who are in good health face combined health carecosts (insurance premiums plus co-pays, deductibles, fees, and other out-of-pocket expenses) of $448 per month to have protection against high medical andprescription drug costs.
• Retired couples are unable to purchase supplemental health insurance through a“family plan”; rather, they must each buy coverage as an individual. Thus,combined health care costs are doubled for elder couples, totaling $896 permonth.
4. Even elders who are currently making ends meet face an uncertain future if their lifecircumstances change, such as loss of a spouse/partner or a decline in health status.
• An elder paying market rate rent in New Jersey has expenses reduced by only28% when a spouse dies yet his or her income mix of Social Security and/orpension income may decrease substantially.
• Older adults often face a rise in health care expenses when their health declines.While adding supplemental health and prescription drug coverage to Medicareprovides protection against unanticipated health care expenses, average out ofpocket expenses rise from $448/month for an individual in good health to$605/month for an individual in poor health.
5. The need for home and community-based long-term care can more than double anelder’s expenses, significantly increasing the income needed to meet basic needs.
• The need for home and community-based long-term services and supports addssubstantially to an elder’s expenses. Adding a low level of care for one personadds $8,412 per year to living costs for an older adult in northern New Jersey.Requiring a medium level of care adds $22,448 and needing a high level of careadds $29,466-$46,550.
• As a comparison, national market surveys report an average annual rate of$116,800 for nursing facility care (semi-private room) in New Jersey.
The 2015 New Jersey Elder Economic Security Standard™ Index Page 4
Introduction
This report addresses income adequacy for New Jersey’s older adults using the national Elder Economic Security Standard™ Index (Elder Index) methodology. The Elder Index benchmarks basic costs of living for elder households and illustrates how costs of living vary geographically and are based on the characteristics of elder households, including household size, home ownership or renter status, and health status. The costs are based on market costs for basic needs of elder households and do not assume any public or private supports. Three previous statewide reports were produced with the support of the New Jersey Foundation for Aging.
The Elder Index presented in this report may be used to increase public awareness and inform public policies and programs. The Elder Index offers:
• Information to illustrate the basic expenses that older adults face and how changesin their life circumstances affect their financial security. Common changes include the need for long-term care services, which dramatically increases living expenses, or the death of a spouse, which often greatly reduces income without substantially decreasing living expense costs
• A framework for analyzing the effects of public policy and policy proposals in suchareas as retirement security, health and long-term care, taxes, and housing
• An educational tool to inform elders about actual and projected living costs toinform their financial, employment, and life decisions
According to the U.S. Census Bureau’s population estimates for 2014, 15% of New Jersey residents were 65 years or older, and 13% were between the ages of 55-64, poised to dramatically increase elders’ numbers as the “baby boomers” age.1 The individual circumstances of New Jersey elders vary from the most fortunate, who are healthy and economically secure, to the least fortunate, who are poor, ill, or living with disability. Elders’ situations vary greatly in terms of family support, neighborhood networks, and community and social connections. New Jersey elders also differ according to their housing situation, health status, and need for long-term services and supports. Many of these characteristics change over an elder’s life span. The Elder Index shows how seniors may be prepared for the present, yet face a precarious future as living expenses rise markedly because of situational changes.
The Statewide New Jersey Elder Economic Security Standard Index
1. For elders living alone and in good health, the statewide New Jersey Elder EconomicSecurity Standard Index for 2015 is $27,264 (for homeowners without a mortgage),$28,560 (for renters) and $40,284 (for homeowners with a mortgage) (see Table1). This represents the living expense costs (housing, health care, transportation,food and miscellaneous) for elders age 65+ in New Jersey. The Elder Index is muchhigher than other commonly used income benchmarks.
1 Source: Population Estimates program of the U.S. Census Bureau. See http://www.census.gov/popest/data/state/asrh/2014/index.html
The 2015 New Jersey Elder Economic Security Standard™ Index Page 5
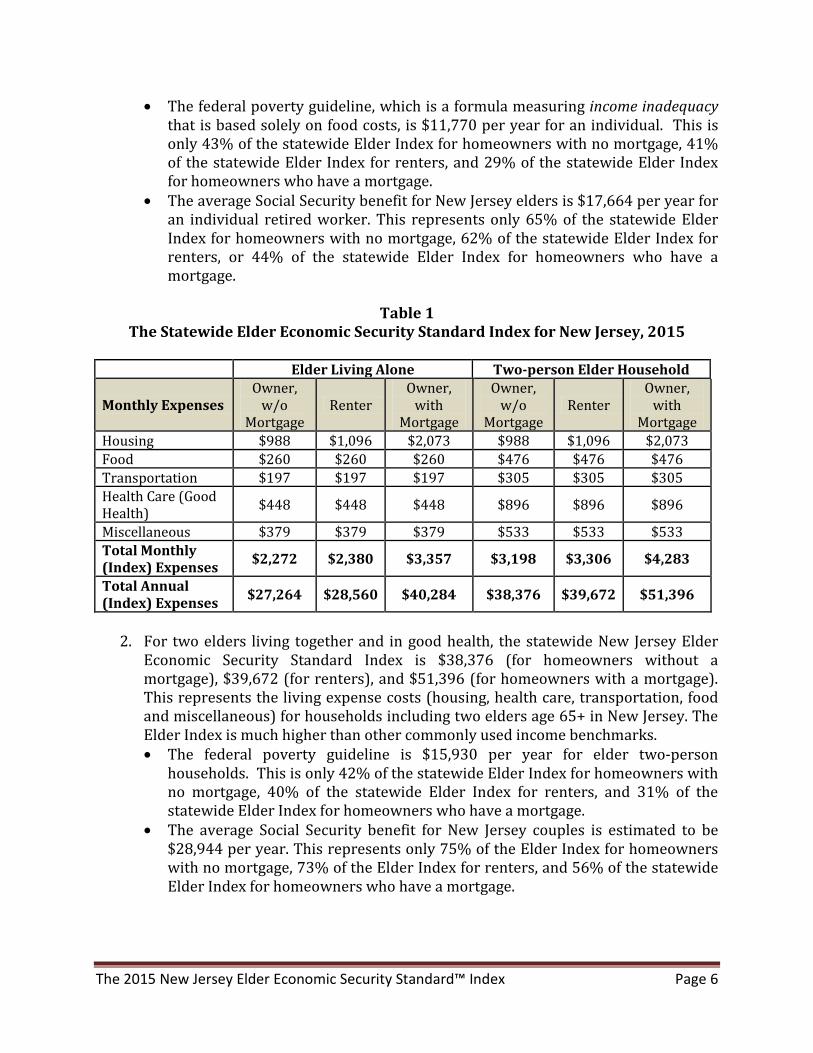
• The federal poverty guideline, which is a formula measuring income inadequacy that is based solely on food costs, is $11,770 per year for an individual. This is only 43% of the statewide Elder Index for homeowners with no mortgage, 41% of the statewide Elder Index for renters, and 29% of the statewide Elder Index for homeowners who have a mortgage.
• The average Social Security benefit for New Jersey elders is $17,664 per year for an individual retired worker. This represents only 65% of the statewide Elder Index for homeowners with no mortgage, 62% of the statewide Elder Index for renters, or 44% of the statewide Elder Index for homeowners who have a mortgage.
Table 1
The Statewide Elder Economic Security Standard Index for New Jersey, 2015
Elder Living Alone Two-person Elder Household
Monthly Expenses Owner,
w/o Mortgage
Renter Owner,
with Mortgage
Owner, w/o
Mortgage Renter
Owner, with
Mortgage Housing $988 $1,096 $2,073 $988 $1,096 $2,073 Food $260 $260 $260 $476 $476 $476 Transportation $197 $197 $197 $305 $305 $305 Health Care (Good Health) $448 $448 $448 $896 $896 $896
Miscellaneous $379 $379 $379 $533 $533 $533 Total Monthly (Index) Expenses $2,272 $2,380 $3,357 $3,198 $3,306 $4,283
Total Annual (Index) Expenses $27,264 $28,560 $40,284 $38,376 $39,672 $51,396
2. For two elders living together and in good health, the statewide New Jersey Elder
Economic Security Standard Index is $38,376 (for homeowners without a mortgage), $39,672 (for renters), and $51,396 (for homeowners with a mortgage). This represents the living expense costs (housing, health care, transportation, food and miscellaneous) for households including two elders age 65+ in New Jersey. The Elder Index is much higher than other commonly used income benchmarks. • The federal poverty guideline is $15,930 per year for elder two-person
households. This is only 42% of the statewide Elder Index for homeowners with no mortgage, 40% of the statewide Elder Index for renters, and 31% of the statewide Elder Index for homeowners who have a mortgage.
• The average Social Security benefit for New Jersey couples is estimated to be $28,944 per year. This represents only 75% of the Elder Index for homeowners with no mortgage, 73% of the Elder Index for renters, and 56% of the statewide Elder Index for homeowners who have a mortgage.
The 2015 New Jersey Elder Economic Security Standard™ Index Page 6
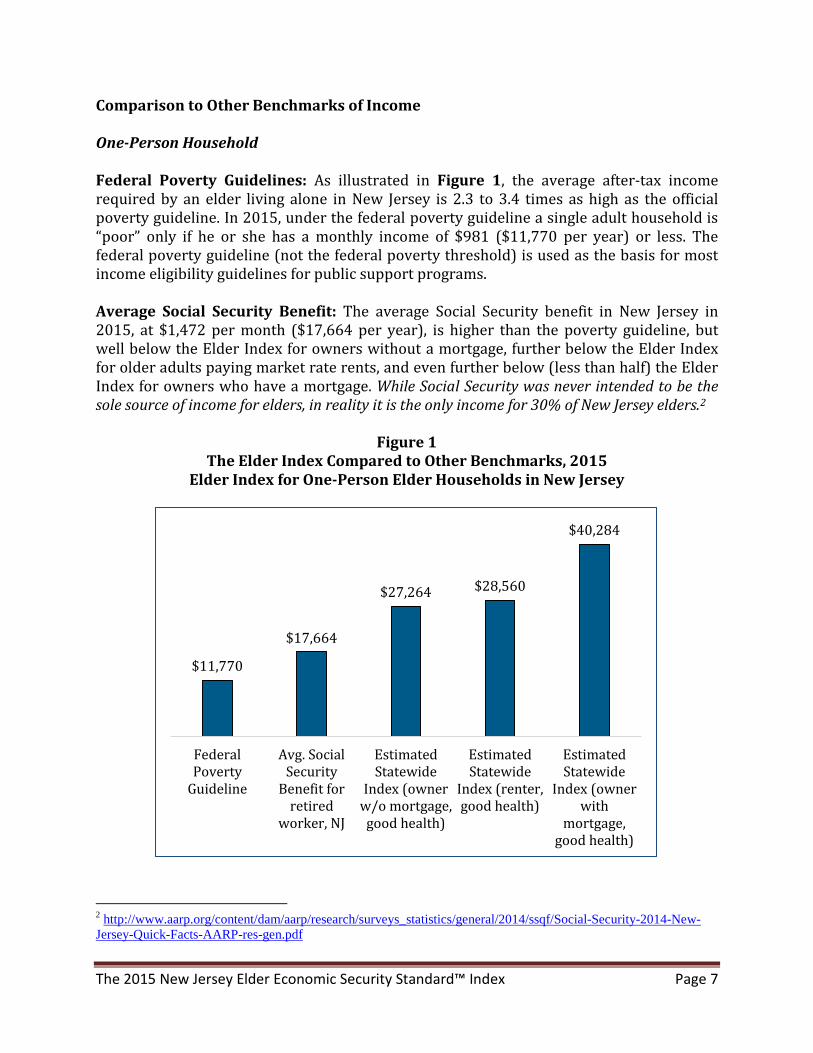
Comparison to Other Benchmarks of Income One-Person Household Federal Poverty Guidelines: As illustrated in Figure 1, the average after-tax income required by an elder living alone in New Jersey is 2.3 to 3.4 times as high as the official poverty guideline. In 2015, under the federal poverty guideline a single adult household is “poor” only if he or she has a monthly income of $981 ($11,770 per year) or less. The federal poverty guideline (not the federal poverty threshold) is used as the basis for most income eligibility guidelines for public support programs. Average Social Security Benefit: The average Social Security benefit in New Jersey in 2015, at $1,472 per month ($17,664 per year), is higher than the poverty guideline, but well below the Elder Index for owners without a mortgage, further below the Elder Index for older adults paying market rate rents, and even further below (less than half) the Elder Index for owners who have a mortgage. While Social Security was never intended to be the sole source of income for elders, in reality it is the only income for 30% of New Jersey elders.2
Figure 1
The Elder Index Compared to Other Benchmarks, 2015 Elder Index for One-Person Elder Households in New Jersey
2 http://www.aarp.org/content/dam/aarp/research/surveys_statistics/general/2014/ssqf/Social-Security-2014-New-Jersey-Quick-Facts-AARP-res-gen.pdf
$11,770
$17,664
$27,264 $28,560
$40,284
FederalPoverty
Guideline
Avg. SocialSecurity
Benefit forretired
worker, NJ
EstimatedStatewide
Index (ownerw/o mortgage,
good health)
EstimatedStatewide
Index (renter,good health)
EstimatedStatewide
Index (ownerwith
mortgage,good health)
The 2015 New Jersey Elder Economic Security Standard™ Index Page 7
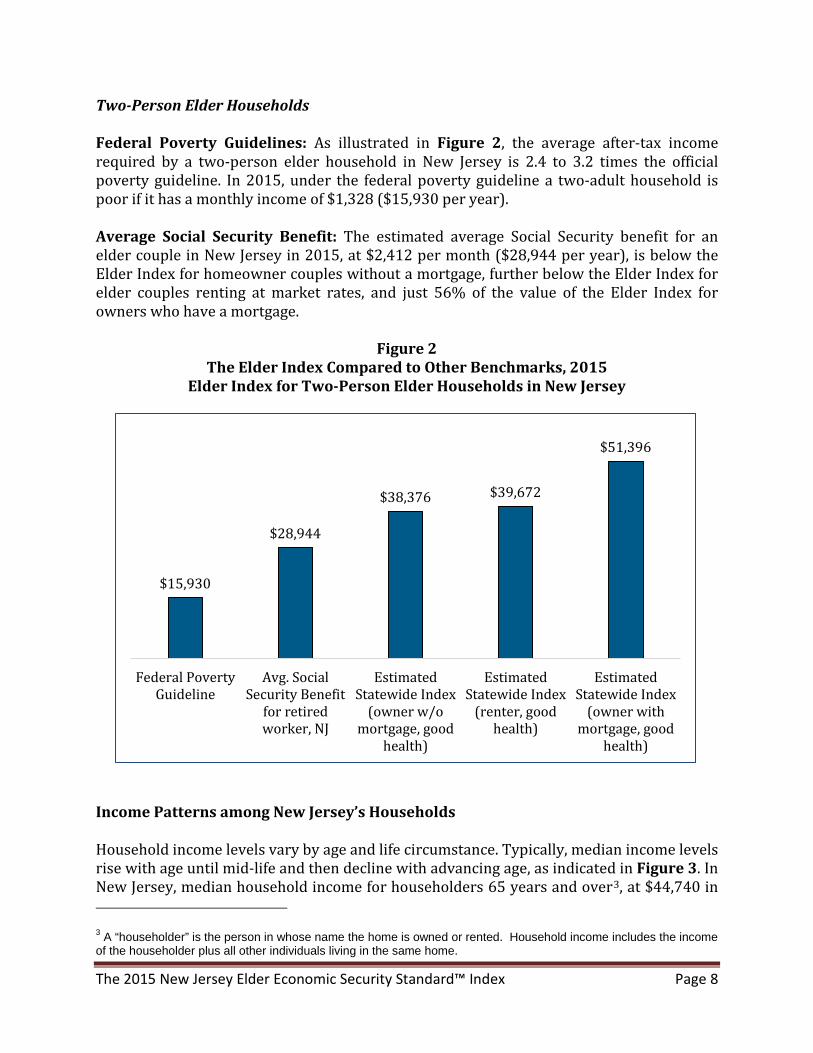
Two-Person Elder Households Federal Poverty Guidelines: As illustrated in Figure 2, the average after-tax income required by a two-person elder household in New Jersey is 2.4 to 3.2 times the official poverty guideline. In 2015, under the federal poverty guideline a two-adult household is poor if it has a monthly income of $1,328 ($15,930 per year). Average Social Security Benefit: The estimated average Social Security benefit for an elder couple in New Jersey in 2015, at $2,412 per month ($28,944 per year), is below the Elder Index for homeowner couples without a mortgage, further below the Elder Index for elder couples renting at market rates, and just 56% of the value of the Elder Index for owners who have a mortgage.
Figure 2 The Elder Index Compared to Other Benchmarks, 2015
Elder Index for Two-Person Elder Households in New Jersey
Income Patterns among New Jersey’s Households Household income levels vary by age and life circumstance. Typically, median income levels rise with age until mid-life and then decline with advancing age, as indicated in Figure 3. In New Jersey, median household income for householders 65 years and over3, at $44,740 in
3 A “householder” is the person in whose name the home is owned or rented. Household income includes the income of the householder plus all other individuals living in the same home.
$15,930
$28,944
$38,376 $39,672
$51,396
Federal PovertyGuideline
Avg. SocialSecurity Benefit
for retiredworker, NJ
EstimatedStatewide Index
(owner w/omortgage, good
health)
EstimatedStatewide Index
(renter, goodhealth)
EstimatedStatewide Index
(owner withmortgage, good
health)
The 2015 New Jersey Elder Economic Security Standard™ Index Page 8
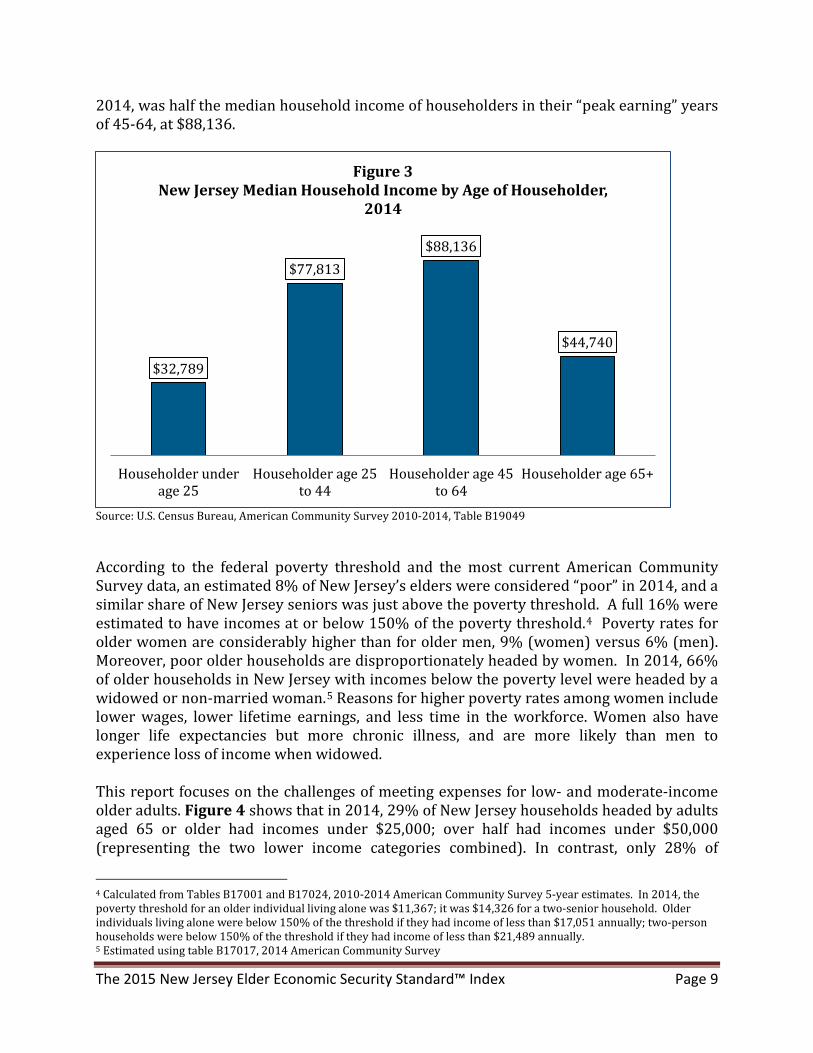
2014, was half the median household income of householders in their “peak earning” years of 45-64, at $88,136.
Source: U.S. Census Bureau, American Community Survey 2010-2014, Table B19049
According to the federal poverty threshold and the most current American Community Survey data, an estimated 8% of New Jersey’s elders were considered “poor” in 2014, and a similar share of New Jersey seniors was just above the poverty threshold. A full 16% were estimated to have incomes at or below 150% of the poverty threshold.4 Poverty rates for older women are considerably higher than for older men, 9% (women) versus 6% (men). Moreover, poor older households are disproportionately headed by women. In 2014, 66% of older households in New Jersey with incomes below the poverty level were headed by a widowed or non-married woman.5 Reasons for higher poverty rates among women include lower wages, lower lifetime earnings, and less time in the workforce. Women also have longer life expectancies but more chronic illness, and are more likely than men to experience loss of income when widowed. This report focuses on the challenges of meeting expenses for low- and moderate-income older adults. Figure 4 shows that in 2014, 29% of New Jersey households headed by adults aged 65 or older had incomes under $25,000; over half had incomes under $50,000 (representing the two lower income categories combined). In contrast, only 28% of
4 Calculated from Tables B17001 and B17024, 2010-2014 American Community Survey 5-year estimates. In 2014, the poverty threshold for an older individual living alone was $11,367; it was $14,326 for a two-senior household. Older individuals living alone were below 150% of the threshold if they had income of less than $17,051 annually; two-person households were below 150% of the threshold if they had income of less than $21,489 annually. 5 Estimated using table B17017, 2014 American Community Survey
$32,789
$77,813 $88,136
$44,740
Householder underage 25
Householder age 25to 44
Householder age 45to 64
Householder age 65+
Figure 3 New Jersey Median Household Income by Age of Householder,
2014
The 2015 New Jersey Elder Economic Security Standard™ Index Page 9
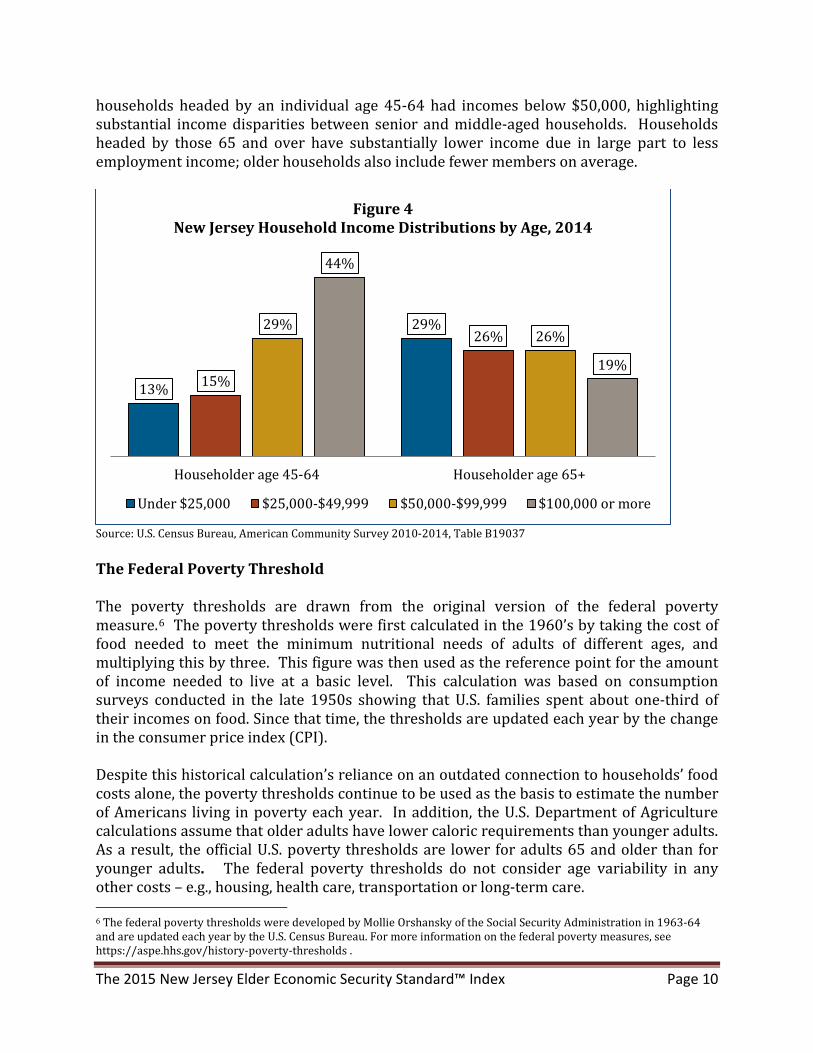
households headed by an individual age 45-64 had incomes below $50,000, highlighting substantial income disparities between senior and middle-aged households. Households headed by those 65 and over have substantially lower income due in large part to less employment income; older households also include fewer members on average.
Source: U.S. Census Bureau, American Community Survey 2010-2014, Table B19037 The Federal Poverty Threshold The poverty thresholds are drawn from the original version of the federal poverty measure.6 The poverty thresholds were first calculated in the 1960’s by taking the cost of food needed to meet the minimum nutritional needs of adults of different ages, and multiplying this by three. This figure was then used as the reference point for the amount of income needed to live at a basic level. This calculation was based on consumption surveys conducted in the late 1950s showing that U.S. families spent about one-third of their incomes on food. Since that time, the thresholds are updated each year by the change in the consumer price index (CPI). Despite this historical calculation’s reliance on an outdated connection to households’ food costs alone, the poverty thresholds continue to be used as the basis to estimate the number of Americans living in poverty each year. In addition, the U.S. Department of Agriculture calculations assume that older adults have lower caloric requirements than younger adults. As a result, the official U.S. poverty thresholds are lower for adults 65 and older than for younger adults. The federal poverty thresholds do not consider age variability in any other costs – e.g., housing, health care, transportation or long-term care.
6 The federal poverty thresholds were developed by Mollie Orshansky of the Social Security Administration in 1963-64 and are updated each year by the U.S. Census Bureau. For more information on the federal poverty measures, see https://aspe.hhs.gov/history-poverty-thresholds .
13%
29%
15%
26% 29%
26%
44%
19%
Householder age 45-64 Householder age 65+
Figure 4 New Jersey Household Income Distributions by Age, 2014
Under $25,000 $25,000-$49,999 $50,000-$99,999 $100,000 or more
The 2015 New Jersey Elder Economic Security Standard™ Index Page 10
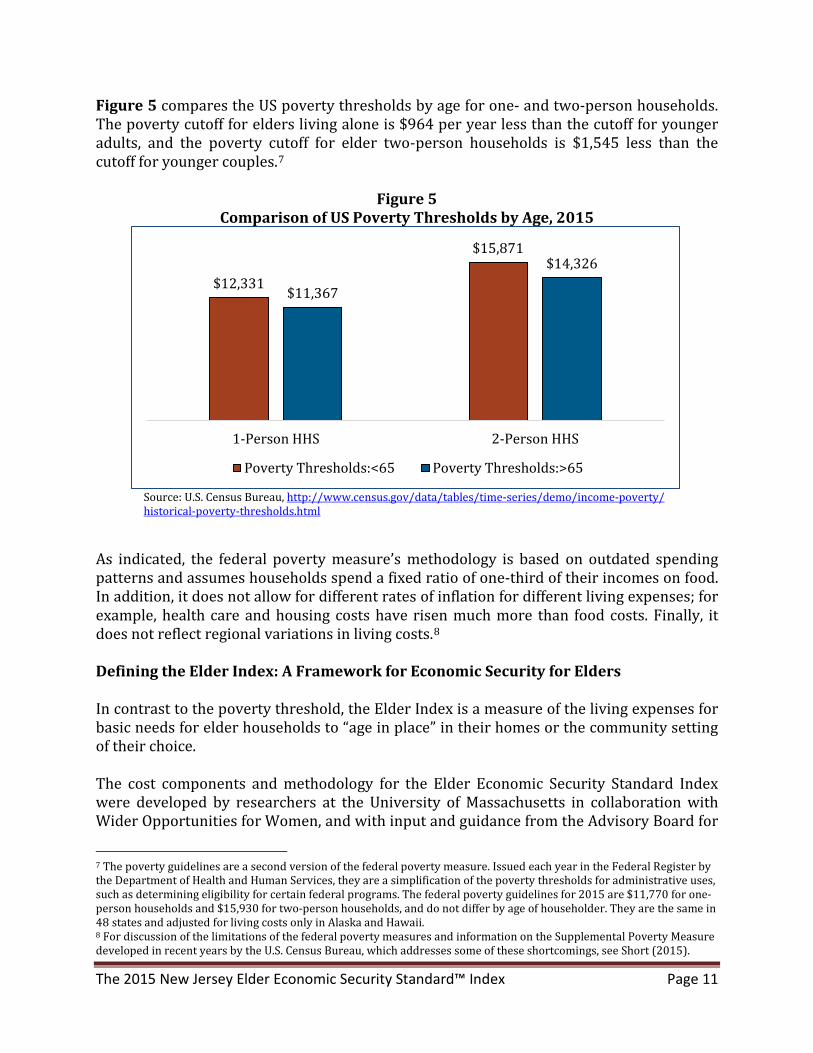
Figure 5 compares the US poverty thresholds by age for one- and two-person households. The poverty cutoff for elders living alone is $964 per year less than the cutoff for younger adults, and the poverty cutoff for elder two-person households is $1,545 less than the cutoff for younger couples.7
Figure 5 Comparison of US Poverty Thresholds by Age, 2015
Source: U.S. Census Bureau, http://www.census.gov/data/tables/time-series/demo/income-poverty/ historical-poverty-thresholds.html
As indicated, the federal poverty measure’s methodology is based on outdated spending patterns and assumes households spend a fixed ratio of one-third of their incomes on food. In addition, it does not allow for different rates of inflation for different living expenses; for example, health care and housing costs have risen much more than food costs. Finally, it does not reflect regional variations in living costs.8 Defining the Elder Index: A Framework for Economic Security for Elders In contrast to the poverty threshold, the Elder Index is a measure of the living expenses for basic needs for elder households to “age in place” in their homes or the community setting of their choice. The cost components and methodology for the Elder Economic Security Standard Index were developed by researchers at the University of Massachusetts in collaboration with Wider Opportunities for Women, and with input and guidance from the Advisory Board for
7 The poverty guidelines are a second version of the federal poverty measure. Issued each year in the Federal Register by the Department of Health and Human Services, they are a simplification of the poverty thresholds for administrative uses, such as determining eligibility for certain federal programs. The federal poverty guidelines for 2015 are $11,770 for one-person households and $15,930 for two-person households, and do not differ by age of householder. They are the same in 48 states and adjusted for living costs only in Alaska and Hawaii. 8 For discussion of the limitations of the federal poverty measures and information on the Supplemental Poverty Measure developed in recent years by the U.S. Census Bureau, which addresses some of these shortcomings, see Short (2015).
$12,331
$15,871
$11,367
$14,326
1-Person HHS 2-Person HHS
Poverty Thresholds:<65 Poverty Thresholds:>65
The 2015 New Jersey Elder Economic Security Standard™ Index Page 11
the national Elder Economic Security Initiative. The Elder Index methodology is based on the characteristics and spending patterns of elder households, reflecting a realistic measure of income adequacy as opposed to the original intent of the federal poverty measure, which was to illustrate income inadequacy. Economic security requires that elders have sufficient income (from Social Security, pensions, retirement savings, and other income) to cover living costs. Using the Elder Index we can illustrate the basic costs that elders face, and the interplay between living costs and elders’ income adequacy. For more information about the development and features of the Elder Economic Security Standard Index, see Russell, Bruce & Conahan (2006) and Mutchler, Shih, Lyu, Bruce & Gottlieb (2015). Calculating the Elder Economic Security Standard Index The Elder Index uses data from public sources that are comparable, geographically specific, easily accessible, and widely accepted. In areas where existing public data sources are not currently available, the Elder Index uses a consistent methodology to derive comparable measures for costs within and across states. The following represent some of the assumptions that are built into the Elder Index’s methodology. The Elder Index:
• measures basic living expenses for seniors living in the community (i.e., not in nursing homes or assisted living facilities);
• measures costs for elder households to live independently (vs. living in intergenerational households);
• measures living expenses for elders ages 65 and over to reflect the age at which Medicare begins;
• includes Medicare because elders qualify for and receive it based on age and without regard to income and assets, making Medicare nearly a universal program;9 and
• models costs for retired elders, who no longer have work-related expenses such as payroll taxes and commuting to work.
The Elder Index is tabulated separately for elders living alone in one-person households, and for two-person elder households, including just two members, both of whom are age 65 or older. A large majority, but not all, of two-person elder households are married couples.
9 An individual is eligible for Medicare if he or she (or his/her spouse) worked for at least 10 years in Medicare-covered employment, is 65 years or older, and is a citizen or permanent resident of the United States (see https://www.cms.gov/medicare/eligibility-and-enrollment/origmedicarepartabeligenrol/index.html). Some individuals, such as recent immigrants, may not qualify for Social Security or Medicare.
The 2015 New Jersey Elder Economic Security Standard™ Index Page 12

The Big Picture: Elders’ Spending Compared to All Households Figure 6 compares elder households’ spending to all households, based on data from the Consumer Expenditure Survey. For the Northeast region as a whole, elder households spend about the same percentage of their budgets on housing, food and transportation as do all households, but substantially more on health care. All other expenditures account for 24% of household spending by the average older household, less than the percentage for all households in the Northeast (29%).
Source: U.S. Department of Labor, Bureau of Labor Statistics, Consumer Expenditure Survey 2013-2014.
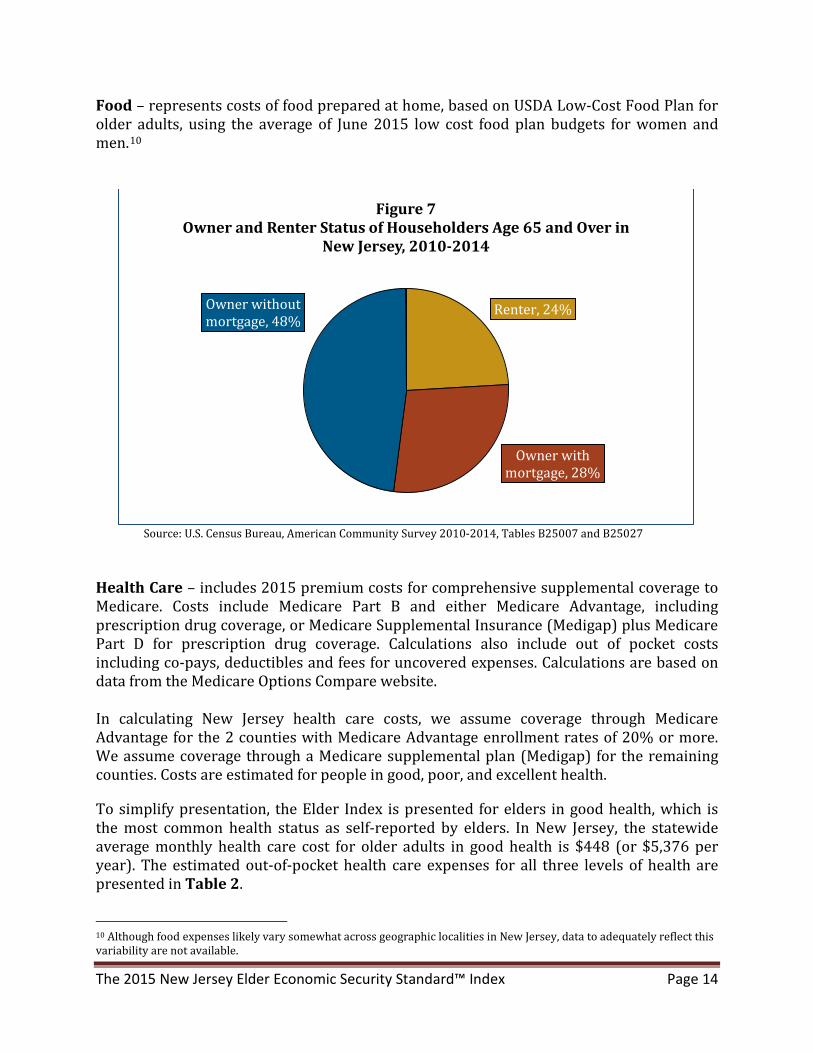
Introduction to Cost Components of the Elder Index The basic cost components developed for the Elder Economic Security Standard Index include: Housing – includes housing (rent or mortgage payment, if any), and related costs (heat, utilities, insurance, and property taxes) for elder renters and elder owners, based on latest available U.S. Census reported elder owner housing costs, and U.S. Department of Housing and Urban Development (HUD) Fair Market Rents. As illustrated in Figure 7, 48% of New Jersey seniors own their homes without a mortgage, 24% are renters, and 28% are homeowners with a mortgage.
37% 36%
12% 7%
12% 12%
15% 16%
24% 29%
0%
20%
40%
60%
80%
100%
Householder age 65+ All-age householder
Figure 6 Household Spending as a Percentage of Total Budget:
Elder vs. All Households in Northeast, 2013-2014
Housing Health care Food Transportation Other
The 2015 New Jersey Elder Economic Security Standard™ Index Page 13
Food – represents costs of food prepared at home, based on USDA Low-Cost Food Plan for older adults, using the average of June 2015 low cost food plan budgets for women and men.10
Source: U.S. Census Bureau, American Community Survey 2010-2014, Tables B25007 and B25027
Health Care – includes 2015 premium costs for comprehensive supplemental coverage to Medicare. Costs include Medicare Part B and either Medicare Advantage, including prescription drug coverage, or Medicare Supplemental Insurance (Medigap) plus Medicare Part D for prescription drug coverage. Calculations also include out of pocket costs including co-pays, deductibles and fees for uncovered expenses. Calculations are based on data from the Medicare Options Compare website. In calculating New Jersey health care costs, we assume coverage through Medicare Advantage for the 2 counties with Medicare Advantage enrollment rates of 20% or more. We assume coverage through a Medicare supplemental plan (Medigap) for the remaining counties. Costs are estimated for people in good, poor, and excellent health. To simplify presentation, the Elder Index is presented for elders in good health, which is the most common health status as self-reported by elders. In New Jersey, the statewide average monthly health care cost for older adults in good health is $448 (or $5,376 per year). The estimated out-of-pocket health care expenses for all three levels of health are presented in Table 2.
10 Although food expenses likely vary somewhat across geographic localities in New Jersey, data to adequately reflect this variability are not available.
Renter, 24%
Owner with mortgage, 28%
Owner without mortgage, 48%
Figure 7 Owner and Renter Status of Householders Age 65 and Over in
New Jersey, 2010-2014
The 2015 New Jersey Elder Economic Security Standard™ Index Page 14

Table 2
Estimated Out-of-Pocket Health Care Expenses, for Three Levels of Health (Statewide average)
Per Person: Excellent Health Good Health Poor Health Cost Per Month $414 $448 $605 Cost Per Year $4,968 $5,376 $7,260
Source: Calculated by the authors based on data from the Medicare Options Compare Website.
Transportation – uses automobile owner and operating costs from Internal Revenue Service (IRS) mileage reimbursement rates, and elder auto usage patterns estimated from the most recent National Household Travel Survey (NHTS). Miscellaneous – represents all other goods, such as clothing, personal and household needs, and any other expenses not captured elsewhere. Based on an analysis of the detailed elder spending patterns from consumer spending data, the Elder Index estimates miscellaneous expenses at 20% of all other costs (excluding long-term care) in each county for owners without a mortgage.11 This amount is calculated separately for older individuals and older couples, and applied to each of the three housing scenarios.12 Elders’ living expenses in each of the above components are summed to determine household budgets for each of the respective scenarios for elder households. This yields the Elder Economic Security Standard Index, the after-tax income required to cover elders’ living expenses based on where they live and the characteristics of their households. Costs of home and community-based long-term services and supports, for those who require them to remain in their home, are presented for three service packages along the continuum of care. Because home and community-based long-term services and supports are not needed by all elders, these costs estimates are provided as an add-on component to the basic Elder Index. Local property taxes are included in the housing cost component for homeowners, and New Jersey sales tax (7%) is included in the miscellaneous category.13 A significant portion of Social Security income is exempt from federal income tax when elders’ combined incomes are under certain limits. Income tax treatment and rates vary by source of income; elders typically rely on a combination of Social Security, pension, and savings. Because most of the Elder Index household basic budgets are near the no-tax
11 See U.S. BLS Consumer Expenditure Survey (http://www.bls.gov/cex/), and Social Security Administration, Expenditures of the Aged Chartbook, 2010, for related data. 12 Note that 20% of all other costs equal 16.67% of total expenses. Miscellaneous expenses include all expenditures other than those specified elsewhere in the Elder Index. Within household size category, miscellaneous expenses are estimated based on the value of all other expenses for homeowners without a mortgage (the largest single segment of the older householder population). This strategy is used because miscellaneous expenses are not likely to vary dramatically across housing types. 13 State of New Jersey, Department of the Treasury ( http://www.state.nj.us/treasury/taxation/su_over.shtml )
The 2015 New Jersey Elder Economic Security Standard™ Index Page 15
limits14, and because tax rates vary by income source, calculations do not include income taxes in the basic model. The 2015 Elder Economic Security Standard Index for New Jersey The four components--housing, food, health care, and transportation, plus miscellaneous expenses -- are added together to calculate the Elder Index for New Jersey counties. These costs vary according to household size (living alone or living with another adult age 65 or older) and whether the person is renting a home, owns a home and is still paying a mortgage, or owns a home outright. Information is also presented on the budget impact of health status. A Note on Geographic Areas Data are tabulated for each of the 21 counties in New Jersey. The Elder Index is also tabulated for Newark City, for the Camden metropolitan area (which includes Burlington, Camden and Gloucester counties), and for the Jersey Shore region (including Atlantic, Cape May, Middlesex, Monmouth, and Ocean counties). Tables 3, 4, and 5 on the following pages illustrate the Elder Index for selected elder household scenarios in three counties: Mercer County, Essex County, and Ocean County. The Elder Index values for all New Jersey counties plus the areas specified above are presented in Appendix B.
14 For a single elder, Social Security benefits will not be taxable unless modified adjusted gross income, plus one-half of Social Security benefits, exceeds $25,000. For a couple, the no-tax limit is $32,000 (https://www.irs.gov/uac/newsroom/are-your-social-security-benefits-taxable)
The 2015 New Jersey Elder Economic Security Standard™ Index Page 16

Table 3 The Elder Economic Security Standard Index for Mercer County, 2015
Expenses for Selected Household Types
Elder Living Alone Two-person Elder Household
Monthly Expenses Owner,
w/o Mortgage
Renter Owner,
with Mortgage
Owner, w/o
Mortgage Renter
Owner, with
Mortgage Housing $924 $1,046 $1,956 $924 $1,046 $1,956 Food $260 $260 $260 $476 $476 $476 Transportation $236 $236 $236 $366 $366 $366 Health Care (Good Health) $459 $459 $459 $918 $918 $918
Miscellaneous $376 $376 $376 $537 $537 $537 Total Monthly (Index) Expenses $2,255 $2,377 $3,287 $3,221 $3,343 $4,253
Total Annual (Index) Expenses $27,060 $28,524 $39,444 $38,652 $40,116 $51,036
Comparative Income Benchmarks Federal Poverty Guideline (2015 DHHS)
$11,770 $11,770 $11,770 $15,930 $15,930 $15,930
Average Social Security Benefit for Mercer County, 2015
$18,133 $18,133 $18,133 $29,713 $29,713 $29,713
Federal Poverty Guideline as a Percent of Index
44% 41% 30% 41% 40% 31%
Average Social Security Benefit as a Percent of Index
67% 64% 46% 77% 74% 58%
Elders in Mercer County with incomes at the federal poverty level, or even if living on the average Social Security benefit in 2015, cannot afford living expenses without public or private supports for housing and health care.
Impact of Change in Health Status on Estimated Health Care Expenses
(change from estimated expenses for good health)
Per Person: Poor Health Increase of:
Excellent Health Decrease of:
Change in Cost Per Month $150 -$26 Change in Cost Per Year $1,800 -$312
The 2015 New Jersey Elder Economic Security Standard™ Index Page 17
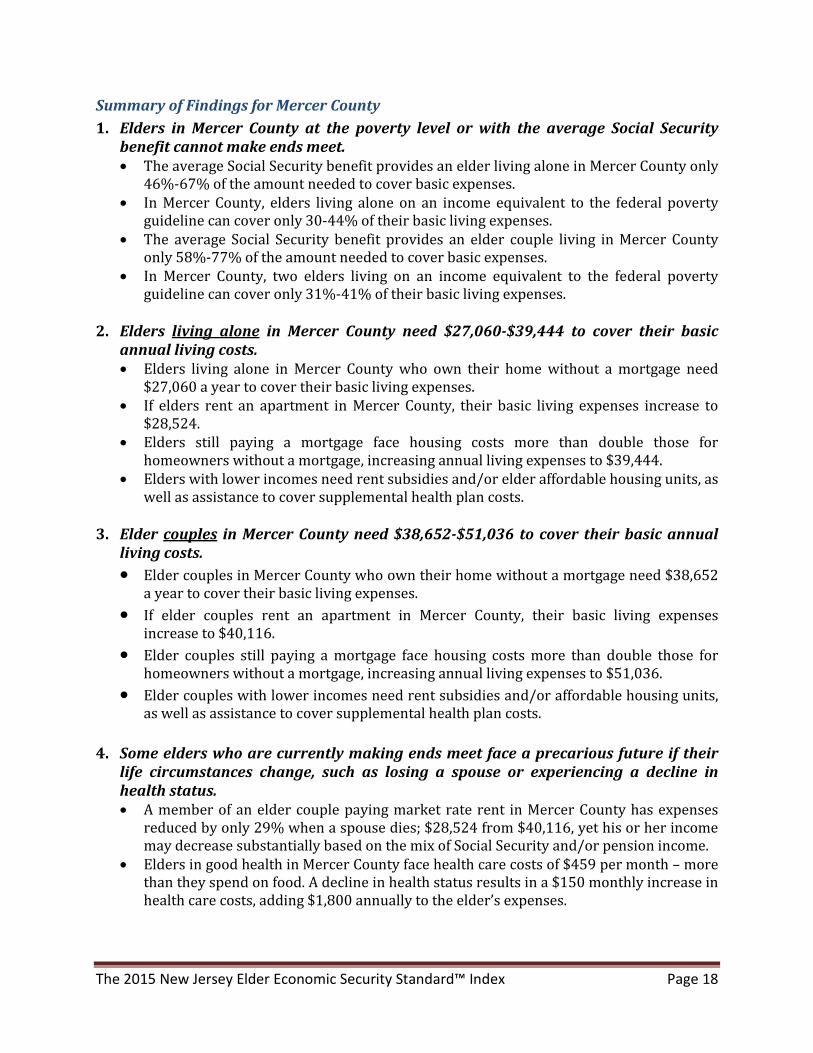
Summary of Findings for Mercer County 1. Elders in Mercer County at the poverty level or with the average Social Security
benefit cannot make ends meet. • The average Social Security benefit provides an elder living alone in Mercer County only
46%-67% of the amount needed to cover basic expenses. • In Mercer County, elders living alone on an income equivalent to the federal poverty
guideline can cover only 30-44% of their basic living expenses. • The average Social Security benefit provides an elder couple living in Mercer County
only 58%-77% of the amount needed to cover basic expenses. • In Mercer County, two elders living on an income equivalent to the federal poverty
guideline can cover only 31%-41% of their basic living expenses. 2. Elders living alone in Mercer County need $27,060-$39,444 to cover their basic
annual living costs. • Elders living alone in Mercer County who own their home without a mortgage need
$27,060 a year to cover their basic living expenses. • If elders rent an apartment in Mercer County, their basic living expenses increase to
$28,524. • Elders still paying a mortgage face housing costs more than double those for
homeowners without a mortgage, increasing annual living expenses to $39,444. • Elders with lower incomes need rent subsidies and/or elder affordable housing units, as
well as assistance to cover supplemental health plan costs. 3. Elder couples in Mercer County need $38,652-$51,036 to cover their basic annual
living costs. • Elder couples in Mercer County who own their home without a mortgage need $38,652
a year to cover their basic living expenses. • If elder couples rent an apartment in Mercer County, their basic living expenses
increase to $40,116. • Elder couples still paying a mortgage face housing costs more than double those for
homeowners without a mortgage, increasing annual living expenses to $51,036. • Elder couples with lower incomes need rent subsidies and/or affordable housing units,
as well as assistance to cover supplemental health plan costs. 4. Some elders who are currently making ends meet face a precarious future if their
life circumstances change, such as losing a spouse or experiencing a decline in health status. • A member of an elder couple paying market rate rent in Mercer County has expenses
reduced by only 29% when a spouse dies; $28,524 from $40,116, yet his or her income may decrease substantially based on the mix of Social Security and/or pension income.
• Elders in good health in Mercer County face health care costs of $459 per month – more than they spend on food. A decline in health status results in a $150 monthly increase in health care costs, adding $1,800 annually to the elder’s expenses.
The 2015 New Jersey Elder Economic Security Standard™ Index Page 18
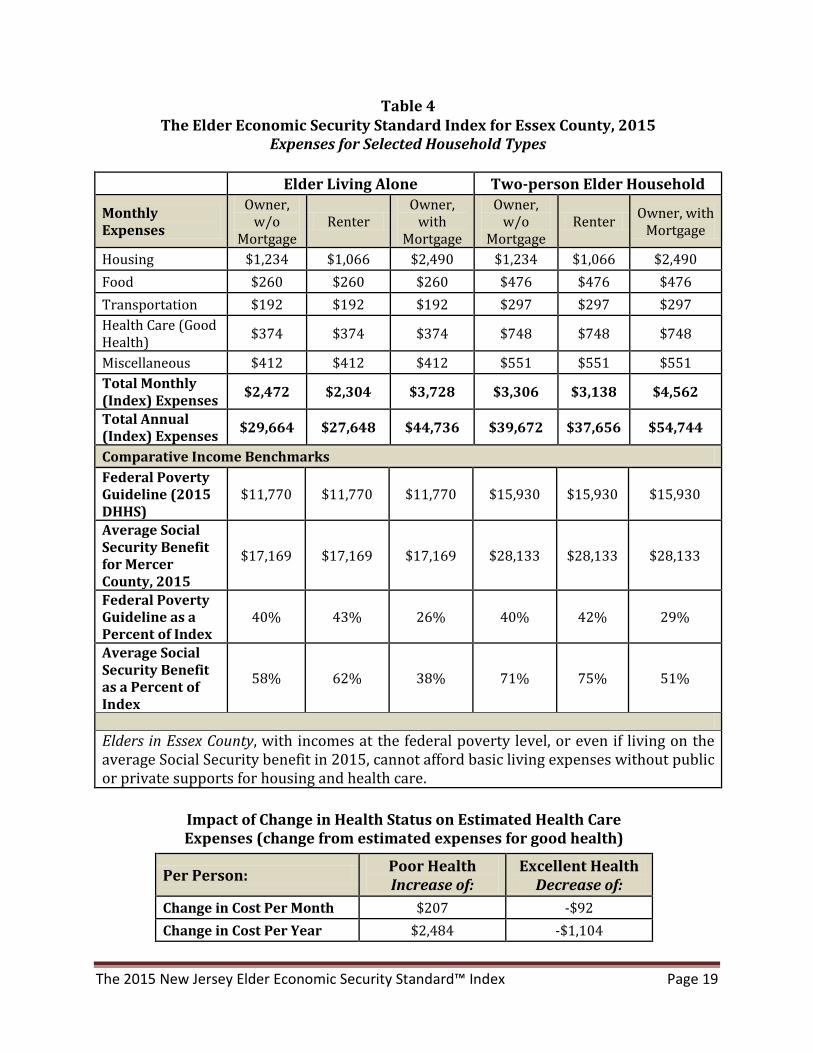
Table 4 The Elder Economic Security Standard Index for Essex County, 2015
Expenses for Selected Household Types
Elder Living Alone Two-person Elder Household
Monthly Expenses
Owner, w/o
Mortgage Renter
Owner, with
Mortgage
Owner, w/o
Mortgage Renter Owner, with
Mortgage
Housing $1,234 $1,066 $2,490 $1,234 $1,066 $2,490 Food $260 $260 $260 $476 $476 $476 Transportation $192 $192 $192 $297 $297 $297 Health Care (Good Health) $374 $374 $374 $748 $748 $748
Miscellaneous $412 $412 $412 $551 $551 $551 Total Monthly (Index) Expenses $2,472 $2,304 $3,728 $3,306 $3,138 $4,562
Total Annual (Index) Expenses $29,664 $27,648 $44,736 $39,672 $37,656 $54,744
Comparative Income Benchmarks Federal Poverty Guideline (2015 DHHS)
$11,770 $11,770 $11,770 $15,930 $15,930 $15,930
Average Social Security Benefit for Mercer County, 2015
$17,169 $17,169 $17,169 $28,133 $28,133 $28,133
Federal Poverty Guideline as a Percent of Index
40% 43% 26% 40% 42% 29%
Average Social Security Benefit as a Percent of Index
58% 62% 38% 71% 75% 51%
Elders in Essex County, with incomes at the federal poverty level, or even if living on the average Social Security benefit in 2015, cannot afford basic living expenses without public or private supports for housing and health care.
Impact of Change in Health Status on Estimated Health Care Expenses (change from estimated expenses for good health)
Per Person: Poor Health Increase of:
Excellent Health Decrease of:
Change in Cost Per Month $207 -$92 Change in Cost Per Year $2,484 -$1,104
The 2015 New Jersey Elder Economic Security Standard™ Index Page 19
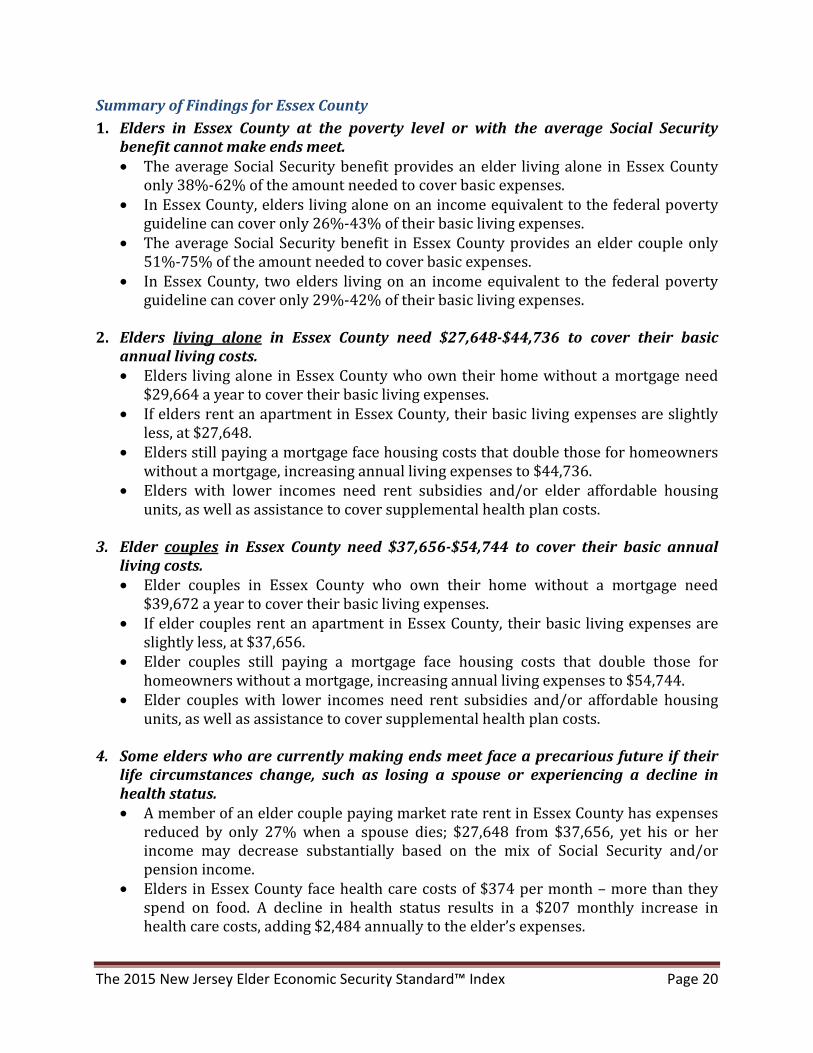
Summary of Findings for Essex County 1. Elders in Essex County at the poverty level or with the average Social Security
benefit cannot make ends meet. • The average Social Security benefit provides an elder living alone in Essex County
only 38%-62% of the amount needed to cover basic expenses. • In Essex County, elders living alone on an income equivalent to the federal poverty
guideline can cover only 26%-43% of their basic living expenses. • The average Social Security benefit in Essex County provides an elder couple only
51%-75% of the amount needed to cover basic expenses. • In Essex County, two elders living on an income equivalent to the federal poverty
guideline can cover only 29%-42% of their basic living expenses. 2. Elders living alone in Essex County need $27,648-$44,736 to cover their basic
annual living costs. • Elders living alone in Essex County who own their home without a mortgage need
$29,664 a year to cover their basic living expenses. • If elders rent an apartment in Essex County, their basic living expenses are slightly
less, at $27,648. • Elders still paying a mortgage face housing costs that double those for homeowners
without a mortgage, increasing annual living expenses to $44,736. • Elders with lower incomes need rent subsidies and/or elder affordable housing
units, as well as assistance to cover supplemental health plan costs. 3. Elder couples in Essex County need $37,656-$54,744 to cover their basic annual
living costs. • Elder couples in Essex County who own their home without a mortgage need
$39,672 a year to cover their basic living expenses. • If elder couples rent an apartment in Essex County, their basic living expenses are
slightly less, at $37,656. • Elder couples still paying a mortgage face housing costs that double those for
homeowners without a mortgage, increasing annual living expenses to $54,744. • Elder couples with lower incomes need rent subsidies and/or affordable housing
units, as well as assistance to cover supplemental health plan costs. 4. Some elders who are currently making ends meet face a precarious future if their
life circumstances change, such as losing a spouse or experiencing a decline in health status. • A member of an elder couple paying market rate rent in Essex County has expenses
reduced by only 27% when a spouse dies; $27,648 from $37,656, yet his or her income may decrease substantially based on the mix of Social Security and/or pension income.
• Elders in Essex County face health care costs of $374 per month – more than they spend on food. A decline in health status results in a $207 monthly increase in health care costs, adding $2,484 annually to the elder’s expenses.
The 2015 New Jersey Elder Economic Security Standard™ Index Page 20
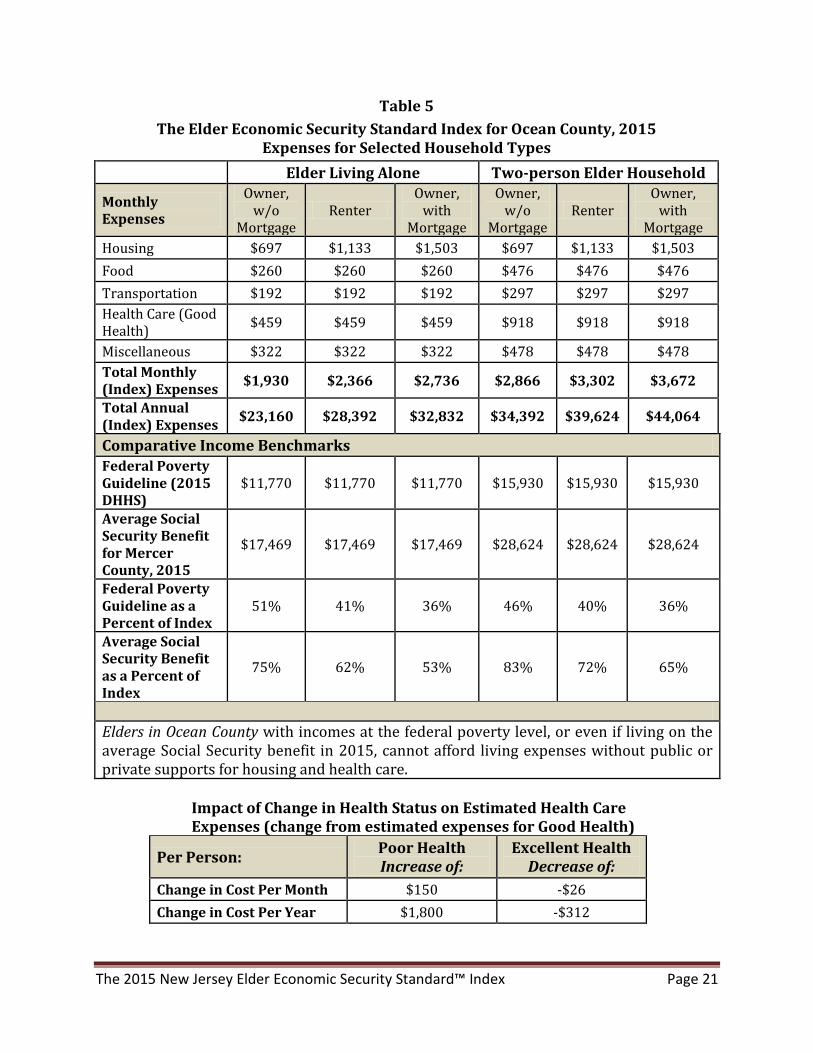
Table 5 The Elder Economic Security Standard Index for Ocean County, 2015
Expenses for Selected Household Types Elder Living Alone Two-person Elder Household
Monthly Expenses
Owner, w/o
Mortgage Renter
Owner, with
Mortgage
Owner, w/o
Mortgage Renter
Owner, with
Mortgage Housing $697 $1,133 $1,503 $697 $1,133 $1,503 Food $260 $260 $260 $476 $476 $476 Transportation $192 $192 $192 $297 $297 $297 Health Care (Good Health) $459 $459 $459 $918 $918 $918
Miscellaneous $322 $322 $322 $478 $478 $478 Total Monthly (Index) Expenses $1,930 $2,366 $2,736 $2,866 $3,302 $3,672
Total Annual (Index) Expenses $23,160 $28,392 $32,832 $34,392 $39,624 $44,064
Comparative Income Benchmarks Federal Poverty Guideline (2015 DHHS)
$11,770 $11,770 $11,770 $15,930 $15,930 $15,930
Average Social Security Benefit for Mercer County, 2015
$17,469 $17,469 $17,469 $28,624 $28,624 $28,624
Federal Poverty Guideline as a Percent of Index
51% 41% 36% 46% 40% 36%
Average Social Security Benefit as a Percent of Index
75% 62% 53% 83% 72% 65%
Elders in Ocean County with incomes at the federal poverty level, or even if living on the average Social Security benefit in 2015, cannot afford living expenses without public or private supports for housing and health care.
Impact of Change in Health Status on Estimated Health Care Expenses (change from estimated expenses for Good Health)
Per Person: Poor Health Increase of:
Excellent Health Decrease of:
Change in Cost Per Month $150 -$26 Change in Cost Per Year $1,800 -$312
The 2015 New Jersey Elder Economic Security Standard™ Index Page 21
Summary of Findings for Ocean County 1. Elders in Ocean County at the poverty level or with the average Social Security
benefit cannot make ends meet. • The average Social Security benefit provides an elder living alone in Ocean County
only 53%-75% of the amount needed to cover basic expenses. • In Ocean County, elders living alone on an income equivalent to the federal poverty
guideline can cover only 36%-51% of their basic living expenses. • The average Social Security benefit provides an elder couple living in Ocean County
only 65%-83% of the amount needed to cover basic expenses. • In Ocean County, two elders living on an income equivalent to the federal poverty
guideline can cover only 36%-46% of their basic living expenses. 2. Elders living alone in Ocean County need $23,160-$32,832 to cover their basic
annual living costs. • Elders living alone in Ocean County who own their home without a mortgage need
$23,160 a year to cover their basic living expenses. • If elders rent an apartment in Ocean County, their basic living expenses increase to
$28,392. • Elders still paying a mortgage face housing costs more than double those for
homeowners without a mortgage, increasing annual living expenses to $32,832. • Elders with lower incomes need rent subsidies and/or elder affordable housing
units, as well as assistance to cover supplemental health plan costs. 3. Elder couples in Ocean County need $34,392-$44,064 to cover their basic annual
living costs. • Elder couples in Ocean County who own their home without a mortgage need
$34,392 a year to cover their basic living expenses. • If elder couples rent an apartment in Ocean County, their basic living expenses
increase to $39,624. • Elder couples still paying a mortgage face housing costs more than double those for
homeowners without a mortgage, increasing annual living expenses to $44,064. • Elder couples with lower incomes need rent subsidies and/or affordable housing
units, as well as assistance to cover supplemental health plan costs. 4. Some elders who are currently making ends meet face a precarious future if their
life circumstances change, such as losing a spouse or experiencing a decline in health status. • A member of an elder couple paying market rate rent in Ocean County has expenses
reduced by only 28% when a spouse dies; $28,392 from $39,624, yet his or her income may decrease substantially based on the mix of Social Security and/or pension income.
• Elders in Ocean County face health care costs of $459 per month – more than they spend on food. A decline in health status results in a $150 monthly increase in health care costs, adding $1,800 annually to the elder’s expenses.
The 2015 New Jersey Elder Economic Security Standard™ Index Page 22
The Impact of Home and Community-Based Long-Term Services and Supports Home and community-based long-term services and supports occur along a continuum ranging from a few hours of care per week to 24/7, year-round care. Not all elders require long-term support, and the Elder Index shows it as an add-on component to the basic Elder Economic Security Standard Index. However, research has shown that two-thirds of seniors will need long-term services at some point in their later years; one-half will have out-of-pocket expenses for care, and 5% will spend as much as $100,000 over their lifetime.15 Using national long-term care utilization data, the Elder Index constructed three packages of home- and community-based long-term services: “low,” “medium,” and “high.”16 The selected packages are representative of a possible continuum. The packages assume that the care is formal, paid care, since the Elder Index measures the costs of goods and services needed by elders in the marketplace. The high package has two variations, one with Adult Day Health Services (ADHS) and one with all services provided at home. Measuring Costs of Home and Community-Based Long-Term Services and Supports The services and supports packages modeled here include hourly in-home services (homemakers/personal care aides and home health aides), care management, supplies, and a personal emergency response system. At the high level of care, there is also an option in which one-half of the care is provided through adult day health services. The long-term services package options are illustrated in Table 6. For example, a “low” level of service use assumes 6 hours of care per week, all of which are in the form of homemaker services. A modest amount of care management is assumed, and fees for a personal emergency response system are also included. In contrast, a “high” in-home service package assumes 36 hours per week of support, half of which are in the form of homemaker services and half in the form of home health assistance. A higher level of care management is assumed, and funds for health care supplies (e.g., incontinence supplies) are included as well as fees for a personal emergency response system. Next, the Elder Index benchmarks the rates for each element of the long-term services package in New Jersey. Table 7 presents private pay rates for each element of the long-term services package.17
15 Kemper, P., Komisar, H. & Alecxih, L. (2006). Long-term care over an uncertain future: What can current retirees expect? Inquiry, 42, 335-350. 16 The authors acknowledge the work of Judith Conahan in developing the long-term care component of the methodology. 17 Private pay rates are from the Genworth Financial 2015 Cost of Care Survey, and additional information retrieved online.
The 2015 New Jersey Elder Economic Security Standard™ Index Page 23
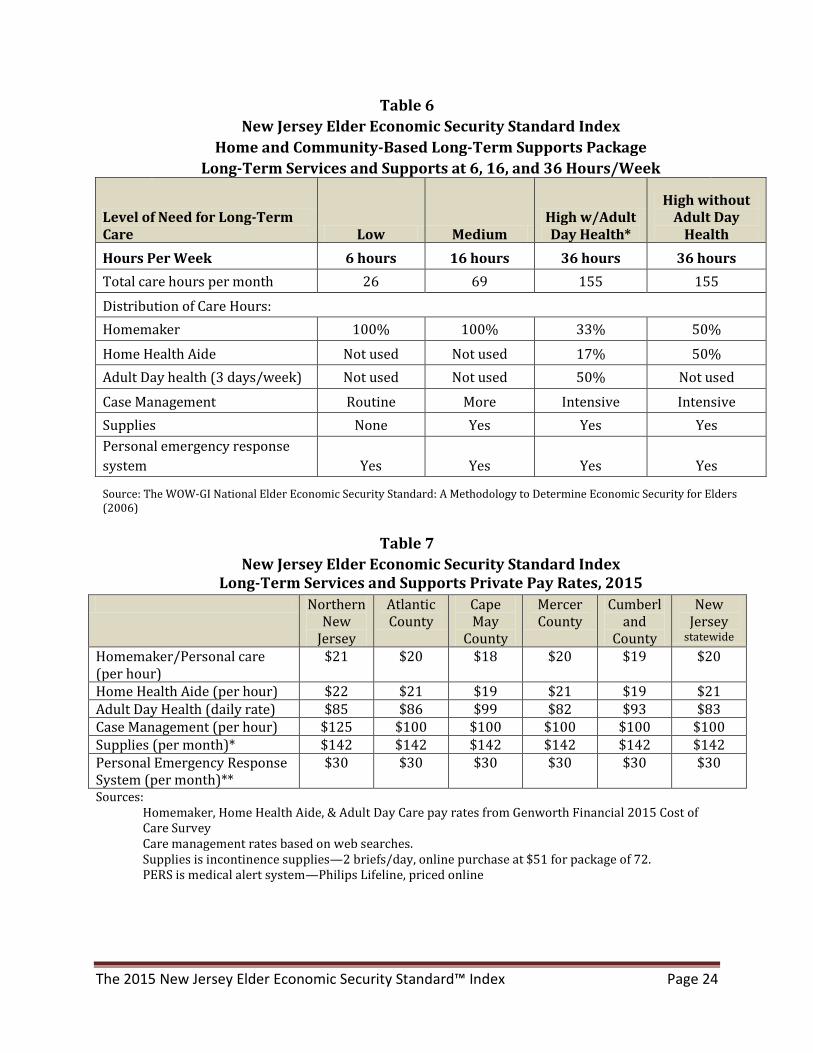
Table 6 New Jersey Elder Economic Security Standard Index
Home and Community-Based Long-Term Supports Package Long-Term Services and Supports at 6, 16, and 36 Hours/Week
Level of Need for Long-Term Care Low Medium
High w/Adult Day Health*
High without Adult Day
Health Hours Per Week 6 hours 16 hours 36 hours 36 hours Total care hours per month 26 69 155 155
Distribution of Care Hours: Homemaker 100% 100% 33% 50%
Home Health Aide Not used Not used 17% 50% Adult Day health (3 days/week) Not used Not used 50% Not used
Case Management Routine More Intensive Intensive Supplies None Yes Yes Yes Personal emergency response system Yes Yes Yes Yes
Source: The WOW-GI National Elder Economic Security Standard: A Methodology to Determine Economic Security for Elders (2006)
Table 7
New Jersey Elder Economic Security Standard Index Long-Term Services and Supports Private Pay Rates, 2015
Northern New
Jersey
Atlantic County
Cape May
County
Mercer County
Cumberland
County
New Jersey
statewide Homemaker/Personal care (per hour)
$21 $20 $18 $20 $19 $20
Home Health Aide (per hour) $22 $21 $19 $21 $19 $21 Adult Day Health (daily rate) $85 $86 $99 $82 $93 $83 Case Management (per hour) $125 $100 $100 $100 $100 $100 Supplies (per month)* $142 $142 $142 $142 $142 $142 Personal Emergency Response System (per month)**
$30 $30 $30 $30 $30 $30
Sources: Homemaker, Home Health Aide, & Adult Day Care pay rates from Genworth Financial 2015 Cost of Care Survey Care management rates based on web searches. Supplies is incontinence supplies—2 briefs/day, online purchase at $51 for package of 72. PERS is medical alert system—Philips Lifeline, priced online
The 2015 New Jersey Elder Economic Security Standard™ Index Page 24
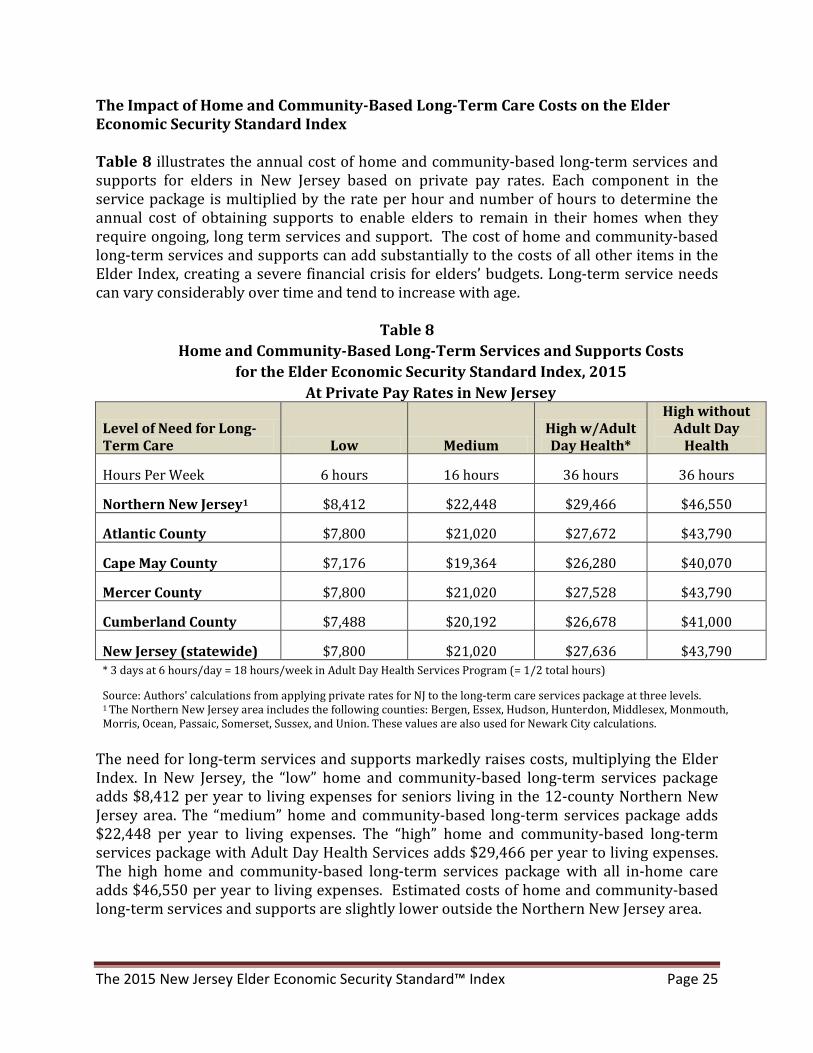
The Impact of Home and Community-Based Long-Term Care Costs on the Elder Economic Security Standard Index Table 8 illustrates the annual cost of home and community-based long-term services and supports for elders in New Jersey based on private pay rates. Each component in the service package is multiplied by the rate per hour and number of hours to determine the annual cost of obtaining supports to enable elders to remain in their homes when they require ongoing, long term services and support. The cost of home and community-based long-term services and supports can add substantially to the costs of all other items in the Elder Index, creating a severe financial crisis for elders’ budgets. Long-term service needs can vary considerably over time and tend to increase with age.
Table 8 Home and Community-Based Long-Term Services and Supports Costs
for the Elder Economic Security Standard Index, 2015 At Private Pay Rates in New Jersey
Level of Need for Long-Term Care Low Medium
High w/Adult Day Health*
High without Adult Day
Health
Hours Per Week 6 hours 16 hours 36 hours 36 hours
Northern New Jersey1 $8,412 $22,448 $29,466 $46,550
Atlantic County $7,800 $21,020 $27,672 $43,790
Cape May County $7,176 $19,364 $26,280 $40,070
Mercer County $7,800 $21,020 $27,528 $43,790
Cumberland County $7,488 $20,192 $26,678 $41,000
New Jersey (statewide) $7,800 $21,020 $27,636 $43,790 * 3 days at 6 hours/day = 18 hours/week in Adult Day Health Services Program (= 1/2 total hours)
Source: Authors' calculations from applying private rates for NJ to the long-term care services package at three levels. 1 The Northern New Jersey area includes the following counties: Bergen, Essex, Hudson, Hunterdon, Middlesex, Monmouth, Morris, Ocean, Passaic, Somerset, Sussex, and Union. These values are also used for Newark City calculations.
The need for long-term services and supports markedly raises costs, multiplying the Elder Index. In New Jersey, the “low” home and community-based long-term services package adds $8,412 per year to living expenses for seniors living in the 12-county Northern New Jersey area. The “medium” home and community-based long-term services package adds $22,448 per year to living expenses. The “high” home and community-based long-term services package with Adult Day Health Services adds $29,466 per year to living expenses. The high home and community-based long-term services package with all in-home care adds $46,550 per year to living expenses. Estimated costs of home and community-based long-term services and supports are slightly lower outside the Northern New Jersey area.
The 2015 New Jersey Elder Economic Security Standard™ Index Page 25

To illustrate the overall impact of purchasing home and community-based long-term services and supports, Table 9 outlines the financial implications at different levels of need and for selected elder household scenarios in Mercer County. Figure 8 illustrates the impact of adding these costs for an elder renter in Mercer County. The impact of long-term care costs on estimated living costs in each county is included in Appendix B. Note that the Elder Index values in Table 9 have been adjusted to reflect an elder in poor health, given that only individuals with poor health are likely to need long-term care. Overview of Impact of Home and Community-Based Long-Term Care Findings for Mercer County The need for home and community-based long-term care can more than double an elder’s expenses, substantially increasing the income needed to meet basic needs:
• For the Mercer County elder household scenarios described in this report, the
Elder Index ranges from $28,860 to $52,836 (without purchasing home and community-based long-term services, but assuming poor health for the elder person or for one member of the elder couple).
• Adding home and community-based long-term supports for one person adds substantially to living expense costs—$7,800 for “low” levels of care, $21,020 “medium” levels of care, and $27,528-$43,790 for “high” levels of care.
• Home and community-based long term supports are preferred by elders to skilled nursing facility care, which is considerably more expensive. National market surveys report an average rate of $116,800 for skilled nursing facility care (semi-private room) in New Jersey.18
When elders become frail and are in poor health, they may need community-based long term services to remain at home. Using the example of an elder renter living alone in Mercer County, Figure 8 illustrates the dramatic increase in annual expenses experienced when low (6 hours/week), medium (16 hours/week), or high (36 hours/week) levels of home- and community-based long-term services are required. For example, compared to the elder renter in poor health who purchases no long-term services (with estimated annual expenses of $30,324), annual expenses are nearly two and a half times higher if high levels of home-based care are required ($74,114).
18 Genworth Financial (2015). 2015 Cost of Care Survey. Richmond, VA: Genworth Financial. https://www.genworth.com/dam/Americas/US/PDFs/Consumer/corporate/130568_040115_gnw.pdf
The 2015 New Jersey Elder Economic Security Standard™ Index Page 26
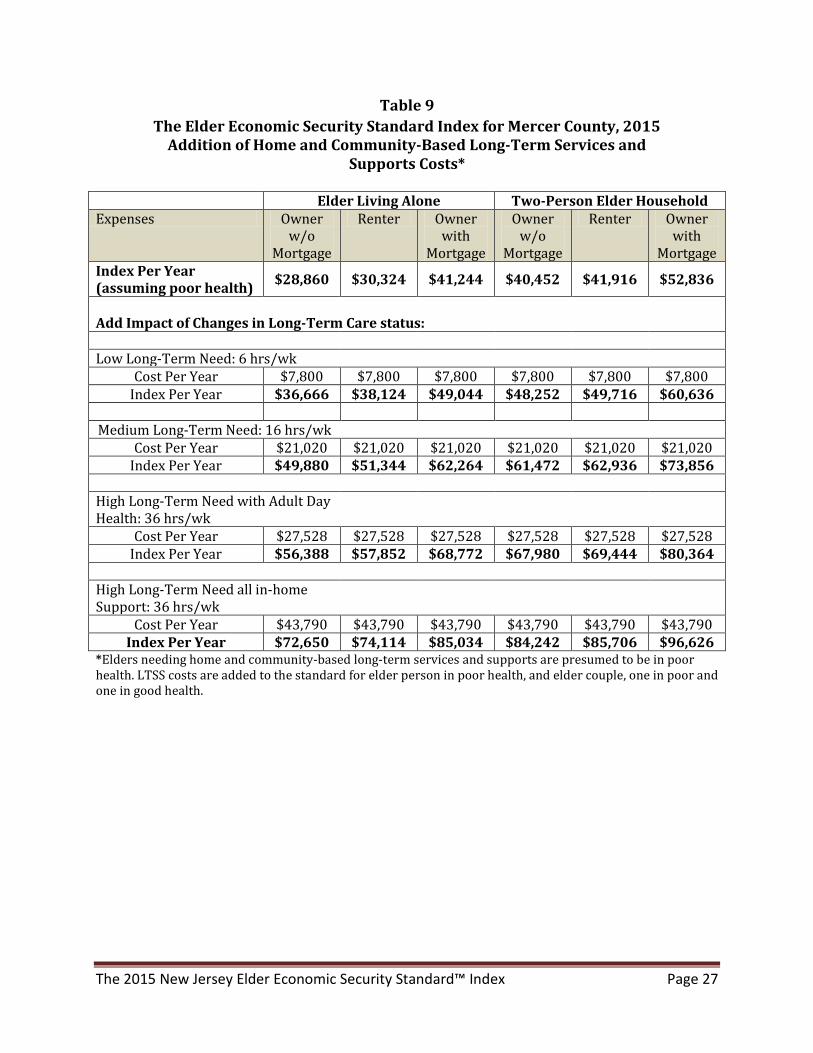
Table 9 The Elder Economic Security Standard Index for Mercer County, 2015
Addition of Home and Community-Based Long-Term Services and Supports Costs*
Elder Living Alone Two-Person Elder Household
Expenses Owner w/o
Mortgage
Renter Owner with
Mortgage
Owner w/o
Mortgage
Renter Owner with
Mortgage Index Per Year (assuming poor health) $28,860 $30,324 $41,244 $40,452 $41,916 $52,836
Add Impact of Changes in Long-Term Care status: Low Long-Term Need: 6 hrs/wk
Cost Per Year $7,800 $7,800 $7,800 $7,800 $7,800 $7,800 Index Per Year $36,666 $38,124 $49,044 $48,252 $49,716 $60,636
Medium Long-Term Need: 16 hrs/wk
Cost Per Year $21,020 $21,020 $21,020 $21,020 $21,020 $21,020 Index Per Year $49,880 $51,344 $62,264 $61,472 $62,936 $73,856
High Long-Term Need with Adult Day Health: 36 hrs/wk
Cost Per Year $27,528 $27,528 $27,528 $27,528 $27,528 $27,528 Index Per Year $56,388 $57,852 $68,772 $67,980 $69,444 $80,364
High Long-Term Need all in-home Support: 36 hrs/wk
Cost Per Year $43,790 $43,790 $43,790 $43,790 $43,790 $43,790 Index Per Year $72,650 $74,114 $85,034 $84,242 $85,706 $96,626
*Elders needing home and community-based long-term services and supports are presumed to be in poor health. LTSS costs are added to the standard for elder person in poor health, and elder couple, one in poor and one in good health.
The 2015 New Jersey Elder Economic Security Standard™ Index Page 27
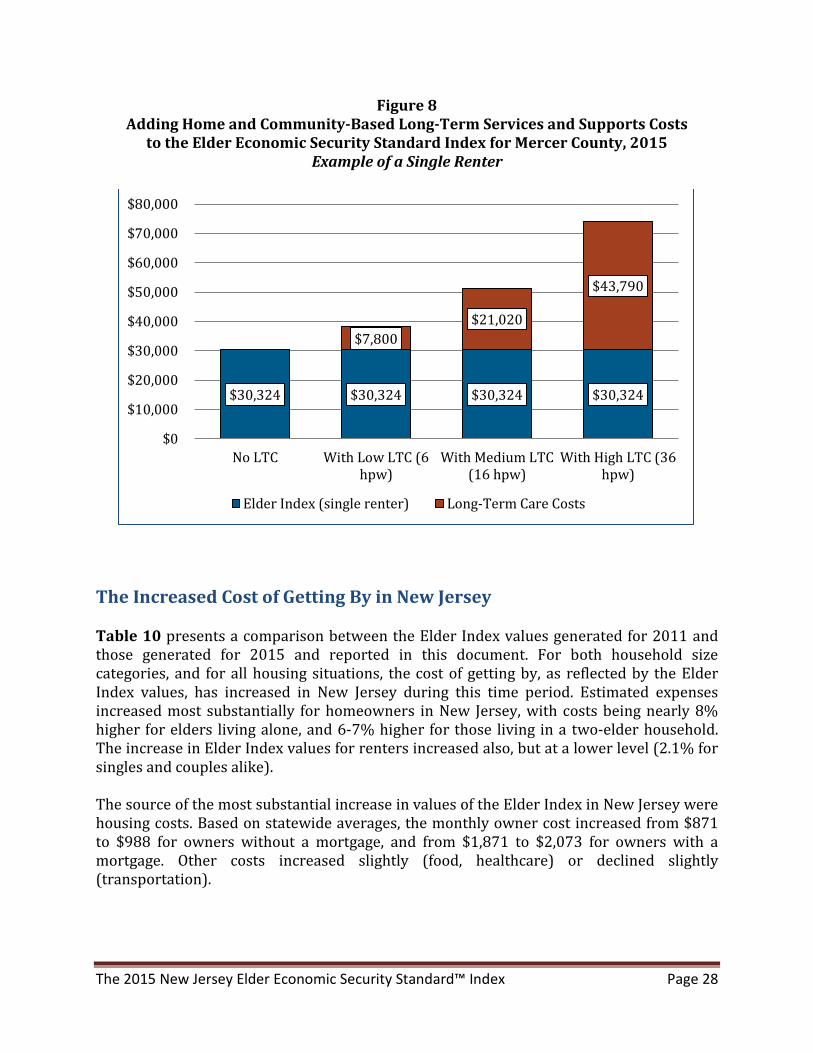
Figure 8 Adding Home and Community-Based Long-Term Services and Supports Costs
to the Elder Economic Security Standard Index for Mercer County, 2015 Example of a Single Renter
The Increased Cost of Getting By in New Jersey Table 10 presents a comparison between the Elder Index values generated for 2011 and those generated for 2015 and reported in this document. For both household size categories, and for all housing situations, the cost of getting by, as reflected by the Elder Index values, has increased in New Jersey during this time period. Estimated expenses increased most substantially for homeowners in New Jersey, with costs being nearly 8% higher for elders living alone, and 6-7% higher for those living in a two-elder household. The increase in Elder Index values for renters increased also, but at a lower level (2.1% for singles and couples alike). The source of the most substantial increase in values of the Elder Index in New Jersey were housing costs. Based on statewide averages, the monthly owner cost increased from $871 to $988 for owners without a mortgage, and from $1,871 to $2,073 for owners with a mortgage. Other costs increased slightly (food, healthcare) or declined slightly (transportation).
$30,324 $30,324 $30,324 $30,324
$7,800 $21,020
$43,790
$0
$10,000
$20,000
$30,000
$40,000
$50,000
$60,000
$70,000
$80,000
No LTC With Low LTC (6hpw)
With Medium LTC(16 hpw)
With High LTC (36hpw)
Elder Index (single renter) Long-Term Care Costs
The 2015 New Jersey Elder Economic Security Standard™ Index Page 28
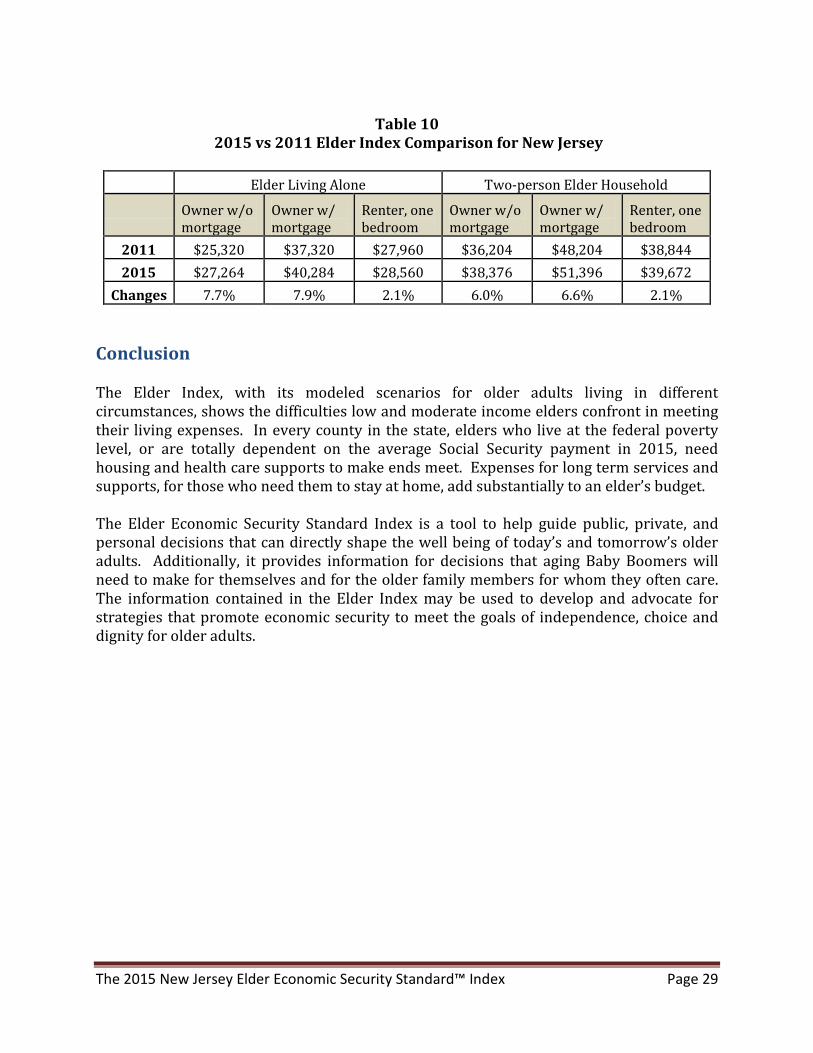
Table 10
2015 vs 2011 Elder Index Comparison for New Jersey
Elder Living Alone Two-person Elder Household
Owner w/o mortgage
Owner w/ mortgage
Renter, one bedroom
Owner w/o mortgage
Owner w/ mortgage
Renter, one bedroom
2011 $25,320 $37,320 $27,960 $36,204 $48,204 $38,844 2015 $27,264 $40,284 $28,560 $38,376 $51,396 $39,672
Changes 7.7% 7.9% 2.1% 6.0% 6.6% 2.1% Conclusion The Elder Index, with its modeled scenarios for older adults living in different circumstances, shows the difficulties low and moderate income elders confront in meeting their living expenses. In every county in the state, elders who live at the federal poverty level, or are totally dependent on the average Social Security payment in 2015, need housing and health care supports to make ends meet. Expenses for long term services and supports, for those who need them to stay at home, add substantially to an elder’s budget. The Elder Economic Security Standard Index is a tool to help guide public, private, and personal decisions that can directly shape the well being of today’s and tomorrow’s older adults. Additionally, it provides information for decisions that aging Baby Boomers will need to make for themselves and for the older family members for whom they often care. The information contained in the Elder Index may be used to develop and advocate for strategies that promote economic security to meet the goals of independence, choice and dignity for older adults.
The 2015 New Jersey Elder Economic Security Standard™ Index Page 29
References Butrica, B., Goldwyn, J. H., & Johnson, R. W. (2005). Understanding Expenditure Patterns in Retirement. Washington, DC: Urban Institute. Available online: http://www.urban.org/publications/411130.html Genworth Financial (2015). 2015 Cost of Care Survey. Available online: https://www.genworth.com/dam/Americas/US/PDFs/Consumer/corporate/130568_040115_gnw.pdf Kemper, P., Komisar, H., &. Alecxih, L. (2006). Long-term care over an uncertain future: What can current retirees expect? Inquiry, 42, 335-350. Mutchler, J., Shih, Y-C., Lyu, J., Bruce, E., & Gottlieb, A. (2015). The Elder Economic Security Standard Index: A new indicator for evaluating economic security in later life. Social Indicators Research, 120, 97-116. DOI: 10.1007/s11205-014-0577-y Russell, Laura Henze, Bruce, Ellen A., Conahan, Judith and Wider Opportunities for Women (2006). The WOW-GI National Elder Economic Security Standard: A Methodology to Determine Economic Security for Elders. Washington, DC: Wider Opportunities for Women. Short, Kathleen (2015). The Supplemental Poverty Measure: 2014. Current Population Reports, P60-254. Washington DC: U.S. Census Bureau. Available online: https://www.census.gov/content/dam/Census/library/publications/2015/demo/p60-254.pdf
The 2015 New Jersey Elder Economic Security Standard™ Index Page 30
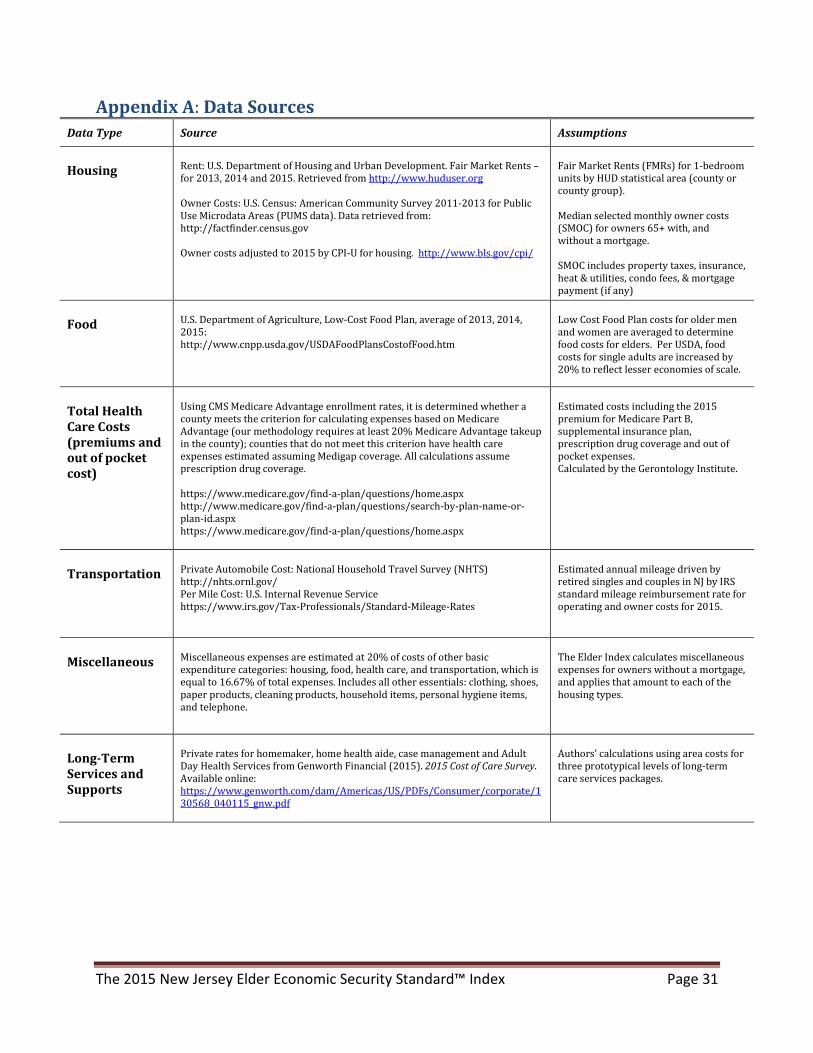
Appendix A: Data Sources Data Type Source Assumptions
Housing Rent: U.S. Department of Housing and Urban Development. Fair Market Rents – for 2013, 2014 and 2015. Retrieved from http://www.huduser.org
Owner Costs: U.S. Census: American Community Survey 2011-2013 for Public Use Microdata Areas (PUMS data). Data retrieved from: http://factfinder.census.gov
Owner costs adjusted to 2015 by CPI-U for housing. http://www.bls.gov/cpi/
Fair Market Rents (FMRs) for 1-bedroom units by HUD statistical area (county or county group).
Median selected monthly owner costs (SMOC) for owners 65+ with, and without a mortgage.
SMOC includes property taxes, insurance, heat & utilities, condo fees, & mortgage payment (if any)
Food U.S. Department of Agriculture, Low-Cost Food Plan, average of 2013, 2014, 2015: http://www.cnpp.usda.gov/USDAFoodPlansCostofFood.htm
Low Cost Food Plan costs for older men and women are averaged to determine food costs for elders. Per USDA, food costs for single adults are increased by 20% to reflect lesser economies of scale.
Total Health Care Costs (premiums and out of pocket cost)
Using CMS Medicare Advantage enrollment rates, it is determined whether a county meets the criterion for calculating expenses based on Medicare Advantage (our methodology requires at least 20% Medicare Advantage takeup in the county); counties that do not meet this criterion have health care expenses estimated assuming Medigap coverage. All calculations assume prescription drug coverage.
https://www.medicare.gov/find-a-plan/questions/home.aspx http://www.medicare.gov/find-a-plan/questions/search-by-plan-name-or-plan-id.aspx https://www.medicare.gov/find-a-plan/questions/home.aspx
Estimated costs including the 2015 premium for Medicare Part B, supplemental insurance plan, prescription drug coverage and out of pocket expenses. Calculated by the Gerontology Institute.
Transportation Private Automobile Cost: National Household Travel Survey (NHTS) http://nhts.ornl.gov/ Per Mile Cost: U.S. Internal Revenue Service https://www.irs.gov/Tax-Professionals/Standard-Mileage-Rates
Estimated annual mileage driven by retired singles and couples in NJ by IRS standard mileage reimbursement rate for operating and owner costs for 2015.
Miscellaneous Miscellaneous expenses are estimated at 20% of costs of other basic expenditure categories: housing, food, health care, and transportation, which is equal to 16.67% of total expenses. Includes all other essentials: clothing, shoes, paper products, cleaning products, household items, personal hygiene items, and telephone.
The Elder Index calculates miscellaneous expenses for owners without a mortgage, and applies that amount to each of the housing types.
Long-Term Services and Supports
Private rates for homemaker, home health aide, case management and Adult Day Health Services from Genworth Financial (2015). 2015 Cost of Care Survey. Available online: https://www.genworth.com/dam/Americas/US/PDFs/Consumer/corporate/130568_040115_gnw.pdf
Authors’ calculations using area costs for three prototypical levels of long-term care services packages.
The 2015 New Jersey Elder Economic Security Standard™ Index Page 31

The 2015 New Jersey Elder Economic Security Standard™ Index Page 32
Monthly Expenses Owner, w/o Mortgage Renter Owner, with
MortgageOwner, w/o Mortgage Renter Owner, with
MortgageHousing $817 $957 $1,727 $817 $957 $1,727Food $260 $260 $260 $476 $476 $476Transportation $236 $236 $236 $366 $366 $366Health Care (Good Health) $459 $459 $459 $918 $918 $918Miscellaneous $354 $354 $354 $515 $515 $515Total Monthly (Index) Expenses $2,126 $2,266 $3,036 $3,092 $3,232 $4,002Total Annual (Index) Expenses $25,512 $27,192 $36,432 $37,104 $38,784 $48,024
Comparative Income BenchmarksFederal Poverty Guideline (2015 DHHS)SSI Payment Maximum - NJ 2015Average County Social Security Benefit 2015
Need for Long-Term Services & Supports (hours/week)
Owner, w/o Mortgage Renter Owner, with
MortgageOwner, w/o Mortgage Renter Owner, with
MortgageLow(6 hrs) $7,800 $33,312 $34,992 $44,232 $44,904 $46,584 $55,824Medium (16 hrs) $21,020 $46,532 $48,212 $57,452 $58,124 $59,804 $69,044High w/ADC (36 hrs) $27,672 $53,184 $54,864 $64,104 $64,776 $66,456 $75,696High w/o ADC (36 hrs) $43,790 $69,302 $70,982 $80,222 $80,894 $82,574 $91,814
To reflect the difference between an elder in good health (depicted in table) and in poor health (and therefore being at higher risk of needing LTSS), $150 should be added to the monthly totals for out-of-pocket medical costs resulting in an annual increase in costs of $1,800 (for an elder person).For information on data sources and assumptions, please refer to Appendix A: Data Sources.
Adding Home- and Community-Based Long-Term Services and Supports (LTSS) to the Elder Economic Security Standard Index (Annual Expenses)
LTSS Cost Per Year
Elder Economic Security Standard Index plus Cost of LTSS
Elder Living Alone Two-person Elder Household
$11,770 $15,930
$9,171 $13,504
$16,637 $27,262
Table B-1:The Elder Economic Security Standard Index for Atlantic County, 2015Monthly Expenses for Selected Household Types
Elder Living Alone Two-person Elder Household
Elder Living Alone Two-person Elder Household
The 2015 New Jersey Elder Economic Security Standard™ Index Page 33
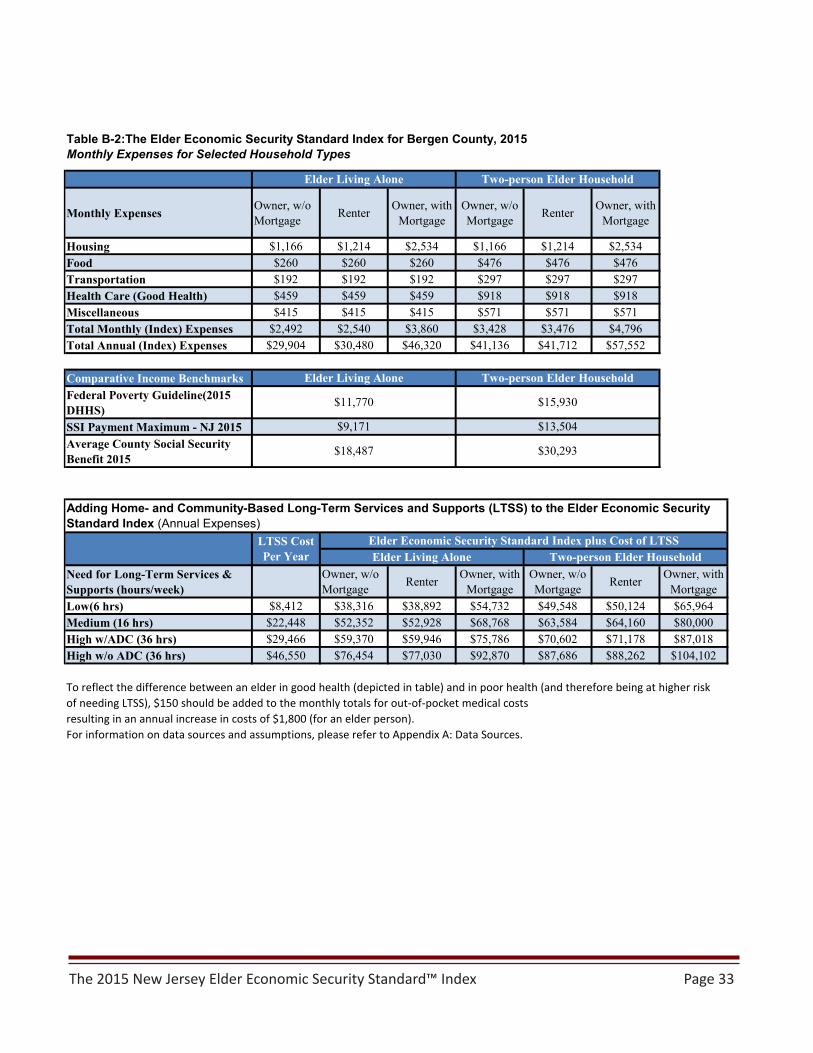
Monthly Expenses Owner, w/o Mortgage Renter Owner, with
MortgageOwner, w/o Mortgage Renter Owner, with
Mortgage
Housing $1,166 $1,214 $2,534 $1,166 $1,214 $2,534Food $260 $260 $260 $476 $476 $476Transportation $192 $192 $192 $297 $297 $297Health Care (Good Health) $459 $459 $459 $918 $918 $918Miscellaneous $415 $415 $415 $571 $571 $571Total Monthly (Index) Expenses $2,492 $2,540 $3,860 $3,428 $3,476 $4,796Total Annual (Index) Expenses $29,904 $30,480 $46,320 $41,136 $41,712 $57,552
Comparative Income BenchmarksFederal Poverty Guideline(2015 DHHS)SSI Payment Maximum - NJ 2015Average County Social Security Benefit 2015
Need for Long-Term Services & Supports (hours/week)
Owner, w/o Mortgage Renter Owner, with
MortgageOwner, w/o Mortgage Renter Owner, with
MortgageLow(6 hrs) $8,412 $38,316 $38,892 $54,732 $49,548 $50,124 $65,964Medium (16 hrs) $22,448 $52,352 $52,928 $68,768 $63,584 $64,160 $80,000High w/ADC (36 hrs) $29,466 $59,370 $59,946 $75,786 $70,602 $71,178 $87,018High w/o ADC (36 hrs) $46,550 $76,454 $77,030 $92,870 $87,686 $88,262 $104,102
To reflect the difference between an elder in good health (depicted in table) and in poor health (and therefore being at higher risk of needing LTSS), $150 should be added to the monthly totals for out-of-pocket medical costs resulting in an annual increase in costs of $1,800 (for an elder person).For information on data sources and assumptions, please refer to Appendix A: Data Sources.
Adding Home- and Community-Based Long-Term Services and Supports (LTSS) to the Elder Economic Security Standard Index (Annual Expenses)
LTSS Cost Per Year
Elder Economic Security Standard Index plus Cost of LTSSElder Living Alone Two-person Elder Household
$11,770 $15,930
$9,171 $13,504
$18,487 $30,293
Table B-2:The Elder Economic Security Standard Index for Bergen County, 2015Monthly Expenses for Selected Household Types
Elder Living Alone Two-person Elder Household
Elder Living Alone Two-person Elder Household
The 2015 New Jersey Elder Economic Security Standard™ Index Page 34
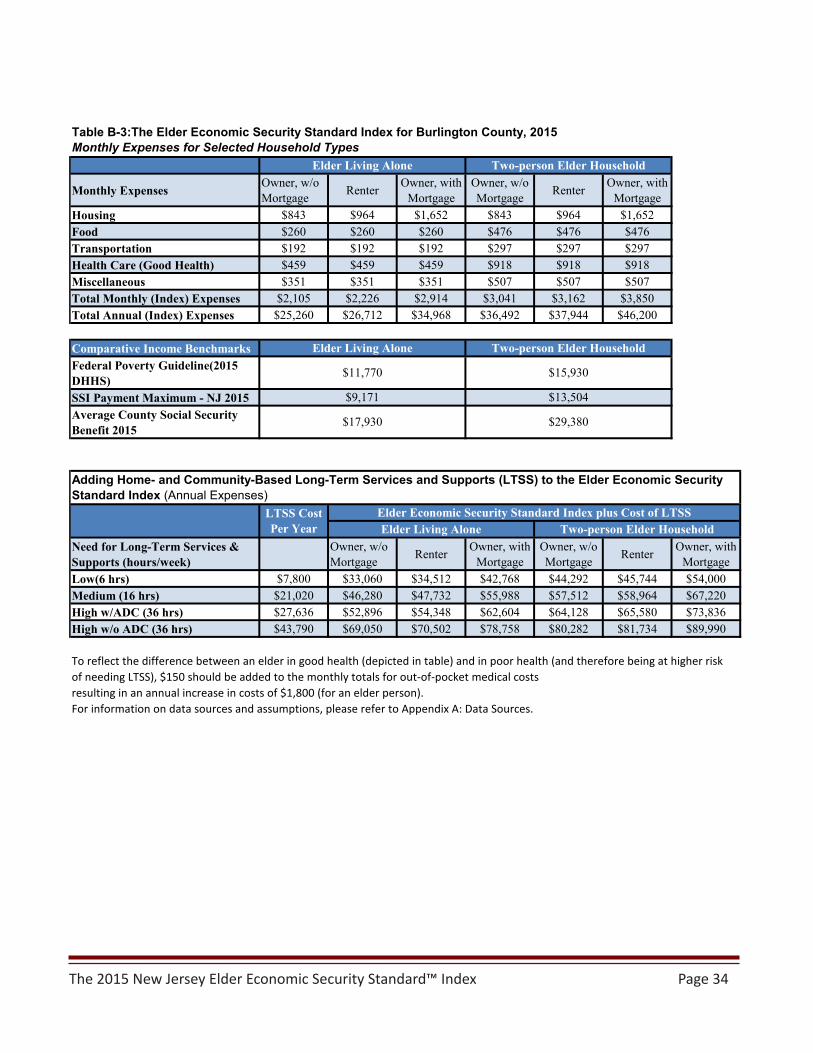
Monthly Expenses Owner, w/o Mortgage Renter Owner, with
MortgageOwner, w/o Mortgage Renter Owner, with
MortgageHousing $843 $964 $1,652 $843 $964 $1,652Food $260 $260 $260 $476 $476 $476Transportation $192 $192 $192 $297 $297 $297Health Care (Good Health) $459 $459 $459 $918 $918 $918Miscellaneous $351 $351 $351 $507 $507 $507Total Monthly (Index) Expenses $2,105 $2,226 $2,914 $3,041 $3,162 $3,850Total Annual (Index) Expenses $25,260 $26,712 $34,968 $36,492 $37,944 $46,200
Comparative Income BenchmarksFederal Poverty Guideline(2015 DHHS)SSI Payment Maximum - NJ 2015Average County Social Security Benefit 2015
Need for Long-Term Services & Supports (hours/week)
Owner, w/o Mortgage Renter Owner, with
MortgageOwner, w/o Mortgage Renter Owner, with
MortgageLow(6 hrs) $7,800 $33,060 $34,512 $42,768 $44,292 $45,744 $54,000Medium (16 hrs) $21,020 $46,280 $47,732 $55,988 $57,512 $58,964 $67,220High w/ADC (36 hrs) $27,636 $52,896 $54,348 $62,604 $64,128 $65,580 $73,836High w/o ADC (36 hrs) $43,790 $69,050 $70,502 $78,758 $80,282 $81,734 $89,990
To reflect the difference between an elder in good health (depicted in table) and in poor health (and therefore being at higher risk of needing LTSS), $150 should be added to the monthly totals for out-of-pocket medical costs resulting in an annual increase in costs of $1,800 (for an elder person).For information on data sources and assumptions, please refer to Appendix A: Data Sources.
$9,171 $13,504
$17,930 $29,380
Adding Home- and Community-Based Long-Term Services and Supports (LTSS) to the Elder Economic Security Standard Index (Annual Expenses)
LTSS Cost Per Year
Elder Economic Security Standard Index plus Cost of LTSSElder Living Alone Two-person Elder Household
$11,770 $15,930
Table B-3:The Elder Economic Security Standard Index for Burlington County, 2015Monthly Expenses for Selected Household Types
Elder Living Alone Two-person Elder Household
Elder Living Alone Two-person Elder Household
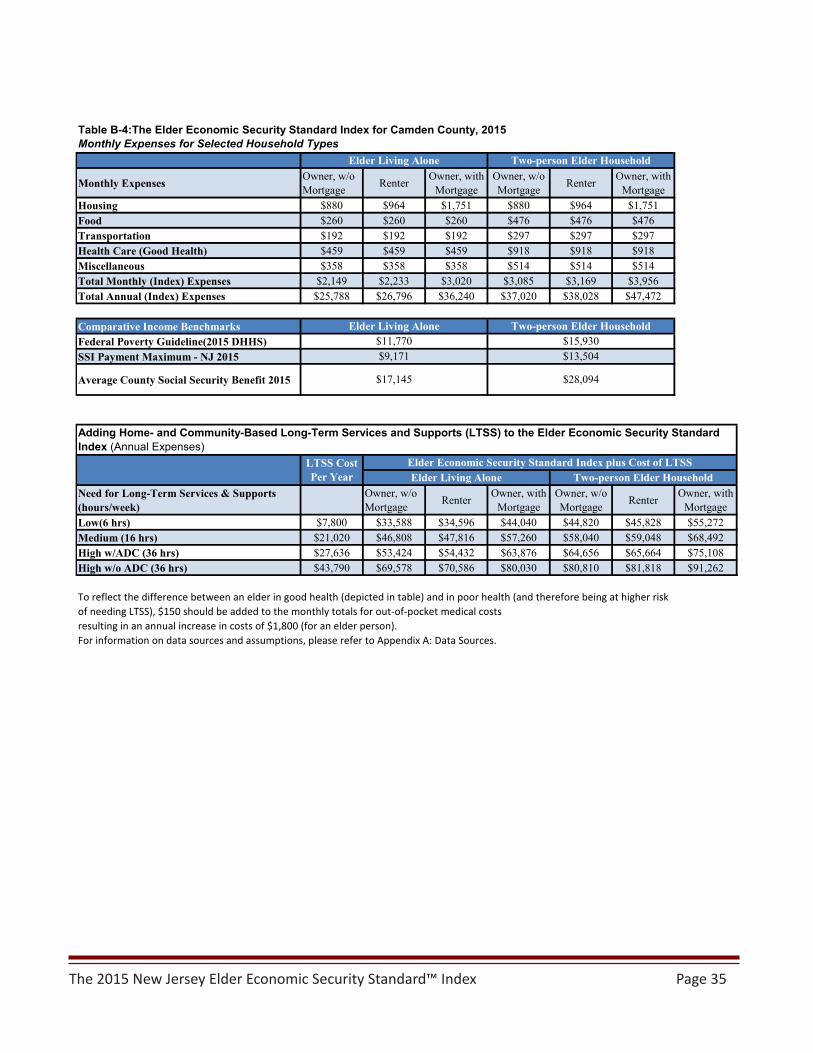
The 2015 New Jersey Elder Economic Security Standard™ Index Page 35
Monthly Expenses Owner, w/o Mortgage Renter Owner, with
MortgageOwner, w/o Mortgage Renter Owner, with
MortgageHousing $880 $964 $1,751 $880 $964 $1,751Food $260 $260 $260 $476 $476 $476Transportation $192 $192 $192 $297 $297 $297Health Care (Good Health) $459 $459 $459 $918 $918 $918Miscellaneous $358 $358 $358 $514 $514 $514Total Monthly (Index) Expenses $2,149 $2,233 $3,020 $3,085 $3,169 $3,956Total Annual (Index) Expenses $25,788 $26,796 $36,240 $37,020 $38,028 $47,472
Comparative Income BenchmarksFederal Poverty Guideline(2015 DHHS)SSI Payment Maximum - NJ 2015
Average County Social Security Benefit 2015
Need for Long-Term Services & Supports (hours/week)
Owner, w/o Mortgage Renter Owner, with
MortgageOwner, w/o Mortgage Renter Owner, with
MortgageLow(6 hrs) $7,800 $33,588 $34,596 $44,040 $44,820 $45,828 $55,272Medium (16 hrs) $21,020 $46,808 $47,816 $57,260 $58,040 $59,048 $68,492High w/ADC (36 hrs) $27,636 $53,424 $54,432 $63,876 $64,656 $65,664 $75,108High w/o ADC (36 hrs) $43,790 $69,578 $70,586 $80,030 $80,810 $81,818 $91,262
To reflect the difference between an elder in good health (depicted in table) and in poor health (and therefore being at higher risk of needing LTSS), $150 should be added to the monthly totals for out-of-pocket medical costs resulting in an annual increase in costs of $1,800 (for an elder person).For information on data sources and assumptions, please refer to Appendix A: Data Sources.
$9,171 $13,504
$17,145 $28,094
Adding Home- and Community-Based Long-Term Services and Supports (LTSS) to the Elder Economic Security Standard Index (Annual Expenses)
LTSS Cost Per Year
Elder Economic Security Standard Index plus Cost of LTSSElder Living Alone Two-person Elder Household
$11,770 $15,930
Table B-4:The Elder Economic Security Standard Index for Camden County, 2015Monthly Expenses for Selected Household Types
Elder Living Alone Two-person Elder Household
Elder Living Alone Two-person Elder Household
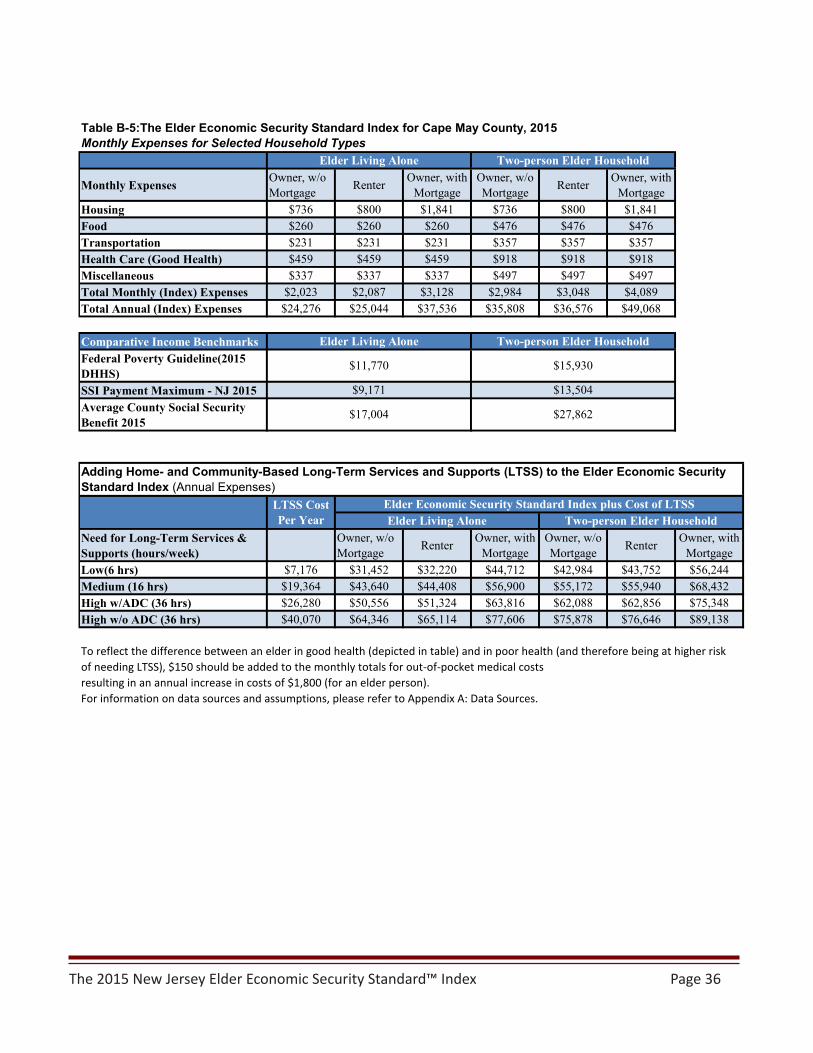
The 2015 New Jersey Elder Economic Security Standard™ Index Page 36
Monthly Expenses Owner, w/o Mortgage Renter Owner, with
MortgageOwner, w/o Mortgage Renter Owner, with
MortgageHousing $736 $800 $1,841 $736 $800 $1,841Food $260 $260 $260 $476 $476 $476Transportation $231 $231 $231 $357 $357 $357Health Care (Good Health) $459 $459 $459 $918 $918 $918Miscellaneous $337 $337 $337 $497 $497 $497Total Monthly (Index) Expenses $2,023 $2,087 $3,128 $2,984 $3,048 $4,089Total Annual (Index) Expenses $24,276 $25,044 $37,536 $35,808 $36,576 $49,068
Comparative Income BenchmarksFederal Poverty Guideline(2015 DHHS)SSI Payment Maximum - NJ 2015Average County Social Security Benefit 2015
Need for Long-Term Services & Supports (hours/week)
Owner, w/o Mortgage Renter Owner, with
MortgageOwner, w/o Mortgage Renter Owner, with
MortgageLow(6 hrs) $7,176 $31,452 $32,220 $44,712 $42,984 $43,752 $56,244Medium (16 hrs) $19,364 $43,640 $44,408 $56,900 $55,172 $55,940 $68,432High w/ADC (36 hrs) $26,280 $50,556 $51,324 $63,816 $62,088 $62,856 $75,348High w/o ADC (36 hrs) $40,070 $64,346 $65,114 $77,606 $75,878 $76,646 $89,138
To reflect the difference between an elder in good health (depicted in table) and in poor health (and therefore being at higher risk of needing LTSS), $150 should be added to the monthly totals for out-of-pocket medical costs resulting in an annual increase in costs of $1,800 (for an elder person).For information on data sources and assumptions, please refer to Appendix A: Data Sources.
$11,770 $15,930
Table B-5:The Elder Economic Security Standard Index for Cape May County, 2015Monthly Expenses for Selected Household Types
Elder Living Alone Two-person Elder Household
Elder Living Alone Two-person Elder Household
LTSS Cost Per Year
Elder Economic Security Standard Index plus Cost of LTSSElder Living Alone Two-person Elder Household
$9,171 $13,504
$17,004 $27,862
Adding Home- and Community-Based Long-Term Services and Supports (LTSS) to the Elder Economic Security Standard Index (Annual Expenses)
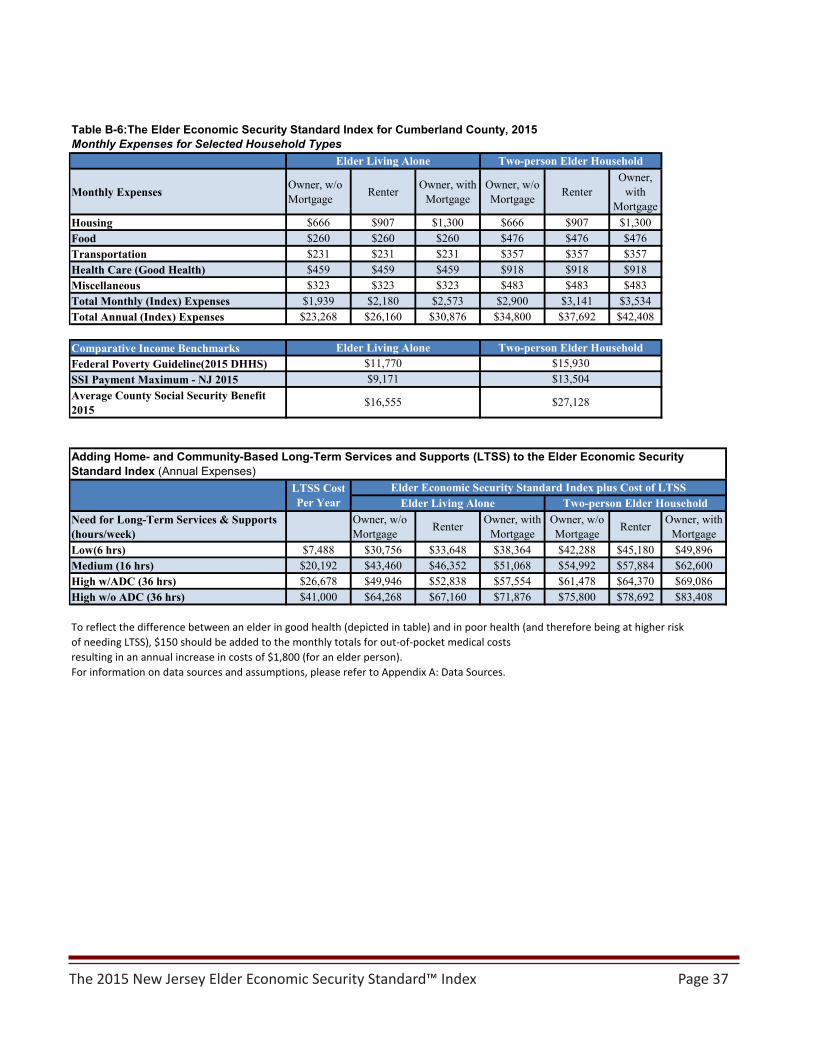
The 2015 New Jersey Elder Economic Security Standard™ Index Page 37
Monthly Expenses Owner, w/o Mortgage Renter Owner, with
MortgageOwner, w/o Mortgage Renter
Owner, with
MortgageHousing $666 $907 $1,300 $666 $907 $1,300Food $260 $260 $260 $476 $476 $476Transportation $231 $231 $231 $357 $357 $357Health Care (Good Health) $459 $459 $459 $918 $918 $918Miscellaneous $323 $323 $323 $483 $483 $483Total Monthly (Index) Expenses $1,939 $2,180 $2,573 $2,900 $3,141 $3,534Total Annual (Index) Expenses $23,268 $26,160 $30,876 $34,800 $37,692 $42,408
Comparative Income BenchmarksFederal Poverty Guideline(2015 DHHS)SSI Payment Maximum - NJ 2015Average County Social Security Benefit 2015
Need for Long-Term Services & Supports (hours/week)
Owner, w/o Mortgage Renter Owner, with
MortgageOwner, w/o Mortgage Renter Owner, with
MortgageLow(6 hrs) $7,488 $30,756 $33,648 $38,364 $42,288 $45,180 $49,896Medium (16 hrs) $20,192 $43,460 $46,352 $51,068 $54,992 $57,884 $62,600High w/ADC (36 hrs) $26,678 $49,946 $52,838 $57,554 $61,478 $64,370 $69,086High w/o ADC (36 hrs) $41,000 $64,268 $67,160 $71,876 $75,800 $78,692 $83,408
To reflect the difference between an elder in good health (depicted in table) and in poor health (and therefore being at higher risk of needing LTSS), $150 should be added to the monthly totals for out-of-pocket medical costs resulting in an annual increase in costs of $1,800 (for an elder person).For information on data sources and assumptions, please refer to Appendix A: Data Sources.
$9,171 $13,504
$16,555 $27,128
Adding Home- and Community-Based Long-Term Services and Supports (LTSS) to the Elder Economic Security Standard Index (Annual Expenses)
LTSS Cost Per Year
Elder Economic Security Standard Index plus Cost of LTSSElder Living Alone Two-person Elder Household
$11,770 $15,930
Table B-6:The Elder Economic Security Standard Index for Cumberland County, 2015Monthly Expenses for Selected Household Types
Elder Living Alone Two-person Elder Household
Elder Living Alone Two-person Elder Household
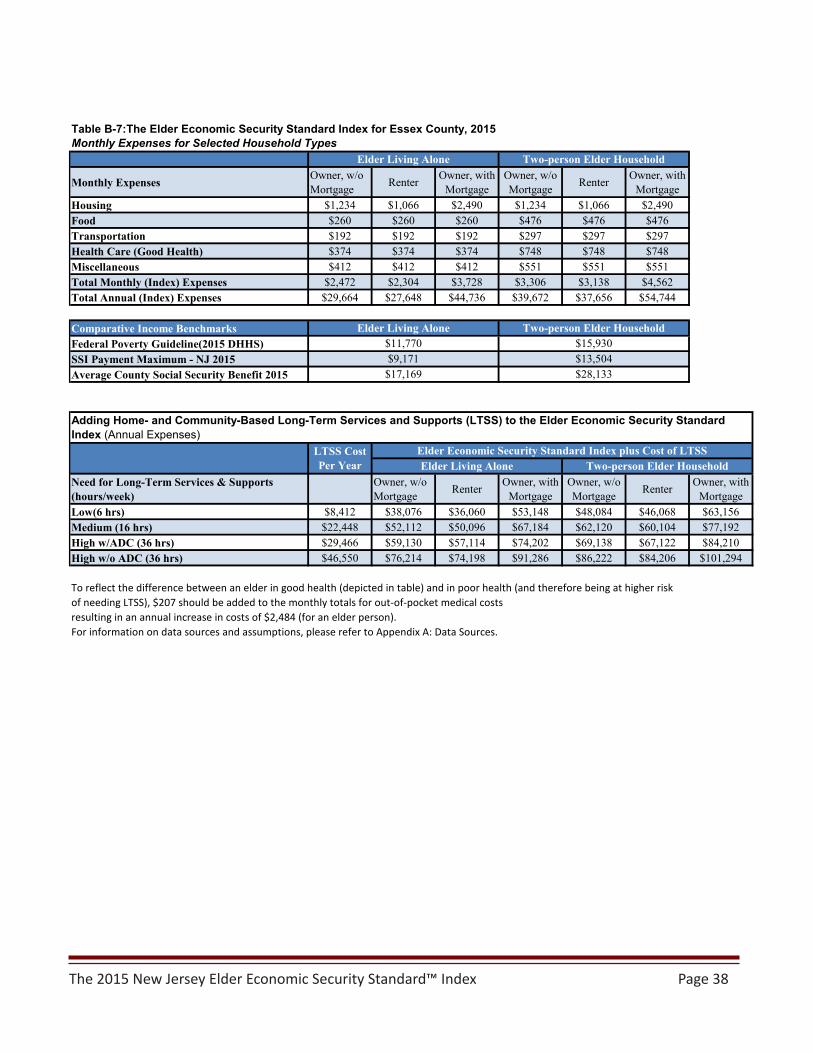
The 2015 New Jersey Elder Economic Security Standard™ Index Page 38
Monthly Expenses Owner, w/o Mortgage Renter Owner, with
MortgageOwner, w/o Mortgage Renter Owner, with
MortgageHousing $1,234 $1,066 $2,490 $1,234 $1,066 $2,490Food $260 $260 $260 $476 $476 $476Transportation $192 $192 $192 $297 $297 $297Health Care (Good Health) $374 $374 $374 $748 $748 $748Miscellaneous $412 $412 $412 $551 $551 $551Total Monthly (Index) Expenses $2,472 $2,304 $3,728 $3,306 $3,138 $4,562Total Annual (Index) Expenses $29,664 $27,648 $44,736 $39,672 $37,656 $54,744
Comparative Income BenchmarksFederal Poverty Guideline(2015 DHHS)SSI Payment Maximum - NJ 2015Average County Social Security Benefit 2015
Need for Long-Term Services & Supports (hours/week)
Owner, w/o Mortgage Renter Owner, with
MortgageOwner, w/o Mortgage Renter Owner, with
MortgageLow(6 hrs) $8,412 $38,076 $36,060 $53,148 $48,084 $46,068 $63,156Medium (16 hrs) $22,448 $52,112 $50,096 $67,184 $62,120 $60,104 $77,192High w/ADC (36 hrs) $29,466 $59,130 $57,114 $74,202 $69,138 $67,122 $84,210High w/o ADC (36 hrs) $46,550 $76,214 $74,198 $91,286 $86,222 $84,206 $101,294
To reflect the difference between an elder in good health (depicted in table) and in poor health (and therefore being at higher risk of needing LTSS), $207 should be added to the monthly totals for out-of-pocket medical costs resulting in an annual increase in costs of $2,484 (for an elder person).For information on data sources and assumptions, please refer to Appendix A: Data Sources.
$11,770 $15,930
Table B-7:The Elder Economic Security Standard Index for Essex County, 2015Monthly Expenses for Selected Household Types
Elder Living Alone Two-person Elder Household
Elder Living Alone Two-person Elder Household
LTSS Cost Per Year
Elder Economic Security Standard Index plus Cost of LTSSElder Living Alone Two-person Elder Household
$9,171 $13,504$17,169 $28,133
Adding Home- and Community-Based Long-Term Services and Supports (LTSS) to the Elder Economic Security Standard Index (Annual Expenses)
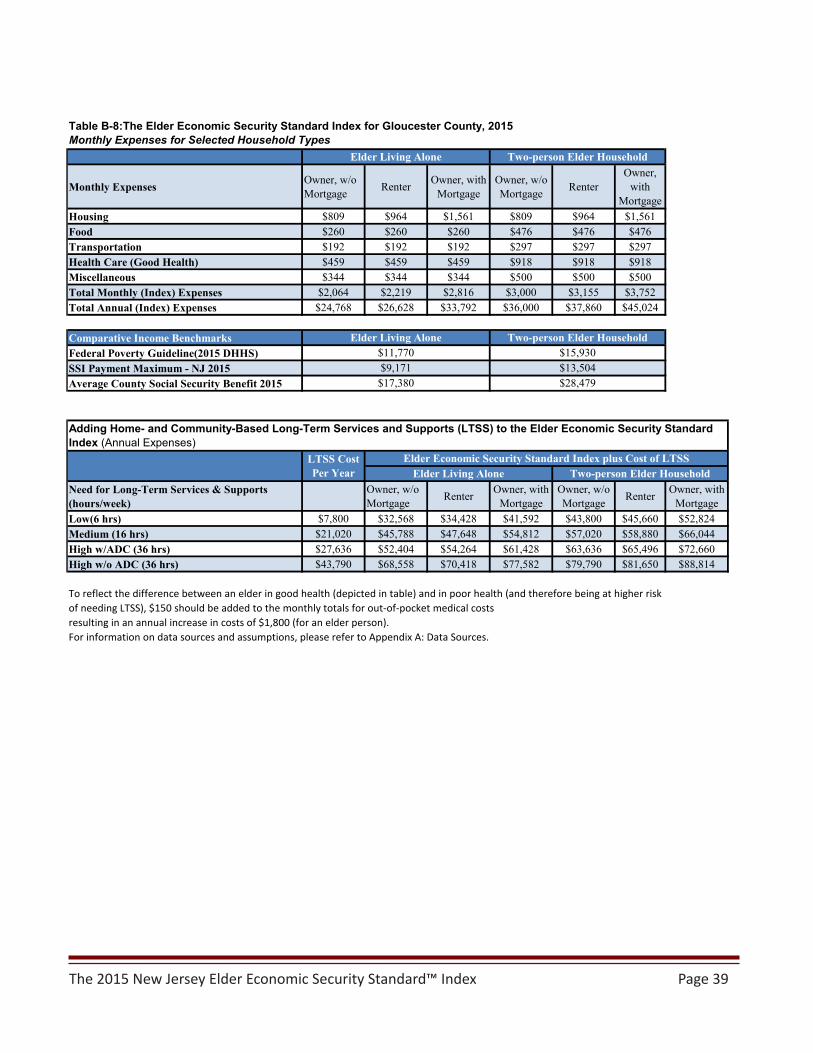
The 2015 New Jersey Elder Economic Security Standard™ Index Page 39
Monthly Expenses Owner, w/o Mortgage Renter Owner, with
MortgageOwner, w/o Mortgage Renter
Owner, with
MortgageHousing $809 $964 $1,561 $809 $964 $1,561Food $260 $260 $260 $476 $476 $476Transportation $192 $192 $192 $297 $297 $297Health Care (Good Health) $459 $459 $459 $918 $918 $918Miscellaneous $344 $344 $344 $500 $500 $500Total Monthly (Index) Expenses $2,064 $2,219 $2,816 $3,000 $3,155 $3,752Total Annual (Index) Expenses $24,768 $26,628 $33,792 $36,000 $37,860 $45,024
Comparative Income BenchmarksFederal Poverty Guideline(2015 DHHS)SSI Payment Maximum - NJ 2015Average County Social Security Benefit 2015
Need for Long-Term Services & Supports (hours/week)
Owner, w/o Mortgage Renter Owner, with
MortgageOwner, w/o Mortgage Renter Owner, with
MortgageLow(6 hrs) $7,800 $32,568 $34,428 $41,592 $43,800 $45,660 $52,824Medium (16 hrs) $21,020 $45,788 $47,648 $54,812 $57,020 $58,880 $66,044High w/ADC (36 hrs) $27,636 $52,404 $54,264 $61,428 $63,636 $65,496 $72,660High w/o ADC (36 hrs) $43,790 $68,558 $70,418 $77,582 $79,790 $81,650 $88,814
To reflect the difference between an elder in good health (depicted in table) and in poor health (and therefore being at higher risk of needing LTSS), $150 should be added to the monthly totals for out-of-pocket medical costs resulting in an annual increase in costs of $1,800 (for an elder person).For information on data sources and assumptions, please refer to Appendix A: Data Sources.
$9,171 $13,504$17,380 $28,479
Adding Home- and Community-Based Long-Term Services and Supports (LTSS) to the Elder Economic Security Standard Index (Annual Expenses)
LTSS Cost Per Year
Elder Economic Security Standard Index plus Cost of LTSSElder Living Alone Two-person Elder Household
$11,770 $15,930
Table B-8:The Elder Economic Security Standard Index for Gloucester County, 2015Monthly Expenses for Selected Household Types
Elder Living Alone Two-person Elder Household
Elder Living Alone Two-person Elder Household

The 2015 New Jersey Elder Economic Security Standard™ Index Page 40
Monthly Expenses Owner, w/o Mortgage Renter Owner, with
MortgageOwner, w/o Mortgage Renter Owner, with
MortgageHousing $1,084 $1,129 $2,415 $1,084 $1,129 $2,415Food $260 $260 $260 $476 $476 $476Transportation $192 $192 $192 $297 $297 $297Health Care (Good Health) $374 $374 $374 $748 $748 $748Miscellaneous $382 $382 $382 $521 $521 $521Total Monthly (Index) Expenses $2,292 $2,337 $3,623 $3,126 $3,171 $4,457Total Annual (Index) Expenses $27,504 $28,044 $43,476 $37,512 $38,052 $53,484
Comparative Income BenchmarksFederal Poverty Guideline(2015 DHHS)SSI Payment Maximum - NJ 2015Average County Social Security Benefit 2015
Need for Long-Term Services & Supports (hours/week)
Owner, w/o Mortgage Renter Owner, with
MortgageOwner, w/o Mortgage Renter Owner, with
MortgageLow(6 hrs) $8,412 $35,916 $36,456 $51,888 $45,924 $46,464 $61,896Medium (16 hrs) $22,448 $49,952 $50,492 $65,924 $59,960 $60,500 $75,932High w/ADC (36 hrs) $29,466 $56,970 $57,510 $72,942 $66,978 $67,518 $82,950High w/o ADC (36 hrs) $46,550 $74,054 $74,594 $90,026 $84,062 $84,602 $100,034
To reflect the difference between an elder in good health (depicted in table) and in poor health (and therefore being at higher risk of needing LTSS), $205 should be added to the monthly totals for out-of-pocket medical costs resulting in an annual increase in costs of $2,460 (for an elder person).For information on data sources and assumptions, please refer to Appendix A: Data Sources.
$9,171 $13,504$14,768 $24,198
Adding Home- and Community-Based Long-Term Services and Supports (LTSS) to the Elder Economic Security Standard Index (Annual Expenses)
LTSS Cost Per Year
Elder Economic Security Standard Index plus Cost of LTSSElder Living Alone Two-person Elder Household
$11,770 $15,930
Table B-9: The Elder Economic Security Standard Index for Hudson County, 2015Monthly Expenses for Selected Household Types
Elder Living Alone Two-person Elder Household
Elder Living Alone Two-person Elder Household
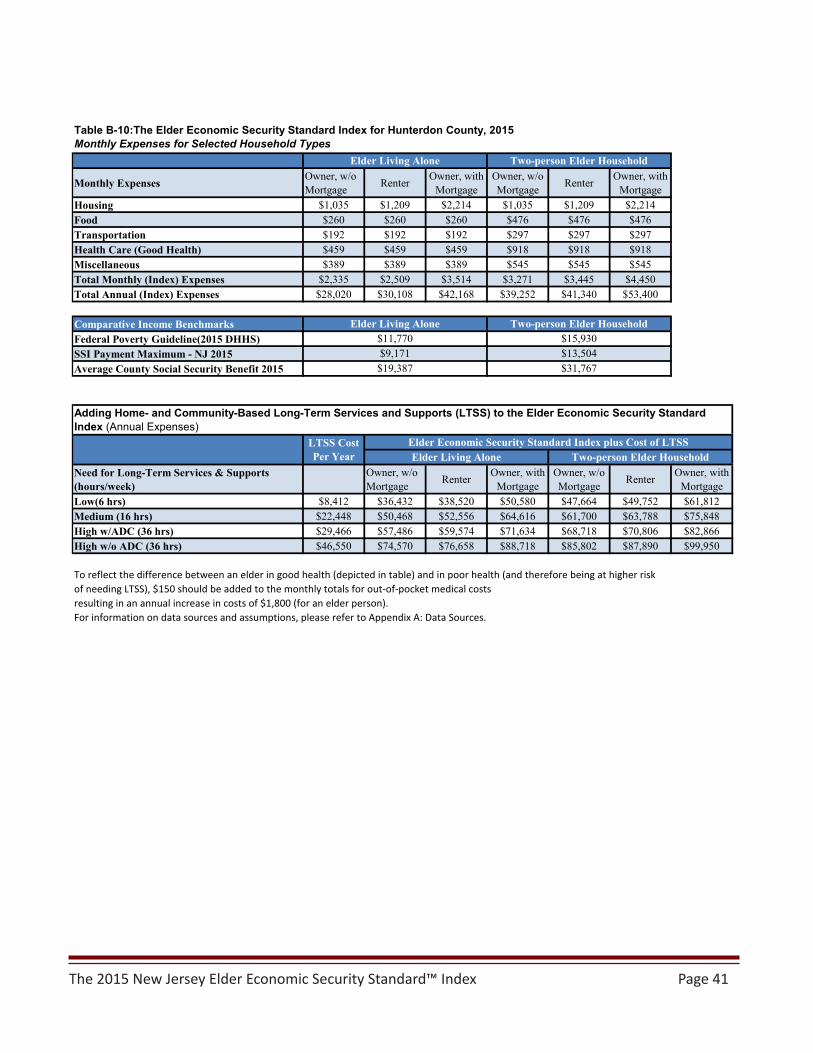
The 2015 New Jersey Elder Economic Security Standard™ Index Page 41
Monthly Expenses Owner, w/o Mortgage Renter Owner, with
MortgageOwner, w/o Mortgage Renter Owner, with
MortgageHousing $1,035 $1,209 $2,214 $1,035 $1,209 $2,214Food $260 $260 $260 $476 $476 $476Transportation $192 $192 $192 $297 $297 $297Health Care (Good Health) $459 $459 $459 $918 $918 $918Miscellaneous $389 $389 $389 $545 $545 $545Total Monthly (Index) Expenses $2,335 $2,509 $3,514 $3,271 $3,445 $4,450Total Annual (Index) Expenses $28,020 $30,108 $42,168 $39,252 $41,340 $53,400
Comparative Income BenchmarksFederal Poverty Guideline(2015 DHHS)SSI Payment Maximum - NJ 2015Average County Social Security Benefit 2015
Need for Long-Term Services & Supports (hours/week)
Owner, w/o Mortgage Renter Owner, with
MortgageOwner, w/o Mortgage Renter Owner, with
MortgageLow(6 hrs) $8,412 $36,432 $38,520 $50,580 $47,664 $49,752 $61,812Medium (16 hrs) $22,448 $50,468 $52,556 $64,616 $61,700 $63,788 $75,848High w/ADC (36 hrs) $29,466 $57,486 $59,574 $71,634 $68,718 $70,806 $82,866High w/o ADC (36 hrs) $46,550 $74,570 $76,658 $88,718 $85,802 $87,890 $99,950
To reflect the difference between an elder in good health (depicted in table) and in poor health (and therefore being at higher risk of needing LTSS), $150 should be added to the monthly totals for out-of-pocket medical costs resulting in an annual increase in costs of $1,800 (for an elder person).For information on data sources and assumptions, please refer to Appendix A: Data Sources.
$9,171 $13,504$19,387 $31,767
Adding Home- and Community-Based Long-Term Services and Supports (LTSS) to the Elder Economic Security Standard Index (Annual Expenses)
LTSS Cost Per Year
Elder Economic Security Standard Index plus Cost of LTSSElder Living Alone Two-person Elder Household
$11,770 $15,930
Table B-10:The Elder Economic Security Standard Index for Hunterdon County, 2015Monthly Expenses for Selected Household Types
Elder Living Alone Two-person Elder Household
Elder Living Alone Two-person Elder Household
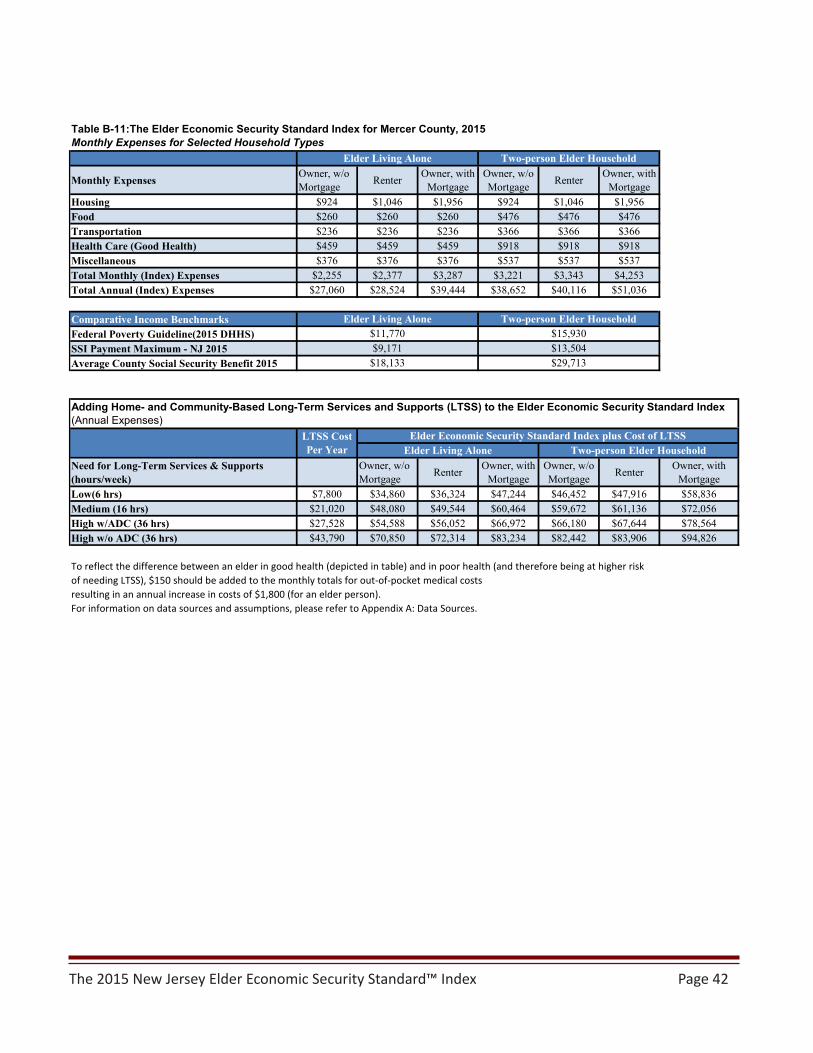
The 2015 New Jersey Elder Economic Security Standard™ Index Page 42
Monthly Expenses Owner, w/o Mortgage Renter Owner, with
MortgageOwner, w/o Mortgage Renter Owner, with
MortgageHousing $924 $1,046 $1,956 $924 $1,046 $1,956Food $260 $260 $260 $476 $476 $476Transportation $236 $236 $236 $366 $366 $366Health Care (Good Health) $459 $459 $459 $918 $918 $918Miscellaneous $376 $376 $376 $537 $537 $537Total Monthly (Index) Expenses $2,255 $2,377 $3,287 $3,221 $3,343 $4,253Total Annual (Index) Expenses $27,060 $28,524 $39,444 $38,652 $40,116 $51,036
Comparative Income BenchmarksFederal Poverty Guideline(2015 DHHS)SSI Payment Maximum - NJ 2015Average County Social Security Benefit 2015
Need for Long-Term Services & Supports (hours/week)
Owner, w/o Mortgage Renter Owner, with
MortgageOwner, w/o Mortgage Renter Owner, with
MortgageLow(6 hrs) $7,800 $34,860 $36,324 $47,244 $46,452 $47,916 $58,836Medium (16 hrs) $21,020 $48,080 $49,544 $60,464 $59,672 $61,136 $72,056High w/ADC (36 hrs) $27,528 $54,588 $56,052 $66,972 $66,180 $67,644 $78,564High w/o ADC (36 hrs) $43,790 $70,850 $72,314 $83,234 $82,442 $83,906 $94,826
To reflect the difference between an elder in good health (depicted in table) and in poor health (and therefore being at higher risk of needing LTSS), $150 should be added to the monthly totals for out-of-pocket medical costs resulting in an annual increase in costs of $1,800 (for an elder person).For information on data sources and assumptions, please refer to Appendix A: Data Sources.
$9,171 $13,504$18,133 $29,713
Adding Home- and Community-Based Long-Term Services and Supports (LTSS) to the Elder Economic Security Standard Index (Annual Expenses)
LTSS Cost Per Year
Elder Economic Security Standard Index plus Cost of LTSSElder Living Alone Two-person Elder Household
$11,770 $15,930
Table B-11:The Elder Economic Security Standard Index for Mercer County, 2015Monthly Expenses for Selected Household Types
Elder Living Alone Two-person Elder Household
Elder Living Alone Two-person Elder Household

The 2015 New Jersey Elder Economic Security Standard™ Index Page 43
Monthly Expenses Owner, w/o Mortgage Renter Owner, with
MortgageOwner, w/o Mortgage Renter Owner, with
MortgageHousing $957 $1,209 $2,039 $957 $1,209 $2,039Food $260 $260 $260 $476 $476 $476Transportation $192 $192 $192 $297 $297 $297Health Care (Good Health) $459 $459 $459 $918 $918 $918Miscellaneous $374 $374 $374 $530 $530 $530Total Monthly (Index) Expenses $2,242 $2,494 $3,324 $3,178 $3,430 $4,260Total Annual (Index) Expenses $26,904 $29,928 $39,888 $38,136 $41,160 $51,120
Comparative Income BenchmarksFederal Poverty Guideline(2015 DHHS)SSI Payment Maximum - NJ 2015Average County Social Security Benefit 2015
Need for Long-Term Services & Supports (hours/week)
Owner, w/o Mortgage Renter Owner, with
MortgageOwner, w/o Mortgage Renter Owner, with
MortgageLow(6 hrs) $8,412 $35,316 $38,340 $48,300 $46,548 $49,572 $59,532Medium (16 hrs) $22,448 $49,352 $52,376 $62,336 $60,584 $63,608 $73,568High w/ADC (36 hrs) $29,466 $56,370 $59,394 $69,354 $67,602 $70,626 $80,586High w/o ADC (36 hrs) $46,550 $73,454 $76,478 $86,438 $84,686 $87,710 $97,670
To reflect the difference between an elder in good health (depicted in table) and in poor health (and therefore being at higher risk of needing LTSS), $150 should be added to the monthly totals for out-of-pocket medical costs resulting in an annual increase in costs of $1,800 (for an elder person).For information on data sources and assumptions, please refer to Appendix A: Data Sources.
$9,171 $13,504$17,867 $29,277
Adding Home- and Community-Based Long-Term Services and Supports (LTSS) to the Elder Economic Security Standard Index (Annual Expenses)
LTSS Cost Per Year
Elder Economic Security Standard Index plus Cost of LTSSElder Living Alone Two-person Elder Household
$11,770 $15,930
Table B-12:The Elder Economic Security Standard Index for Middlesex County, 2015Monthly Expenses for Selected Household Types
Elder Living Alone Two-person Elder Household
Elder Living Alone Two-person Elder Household
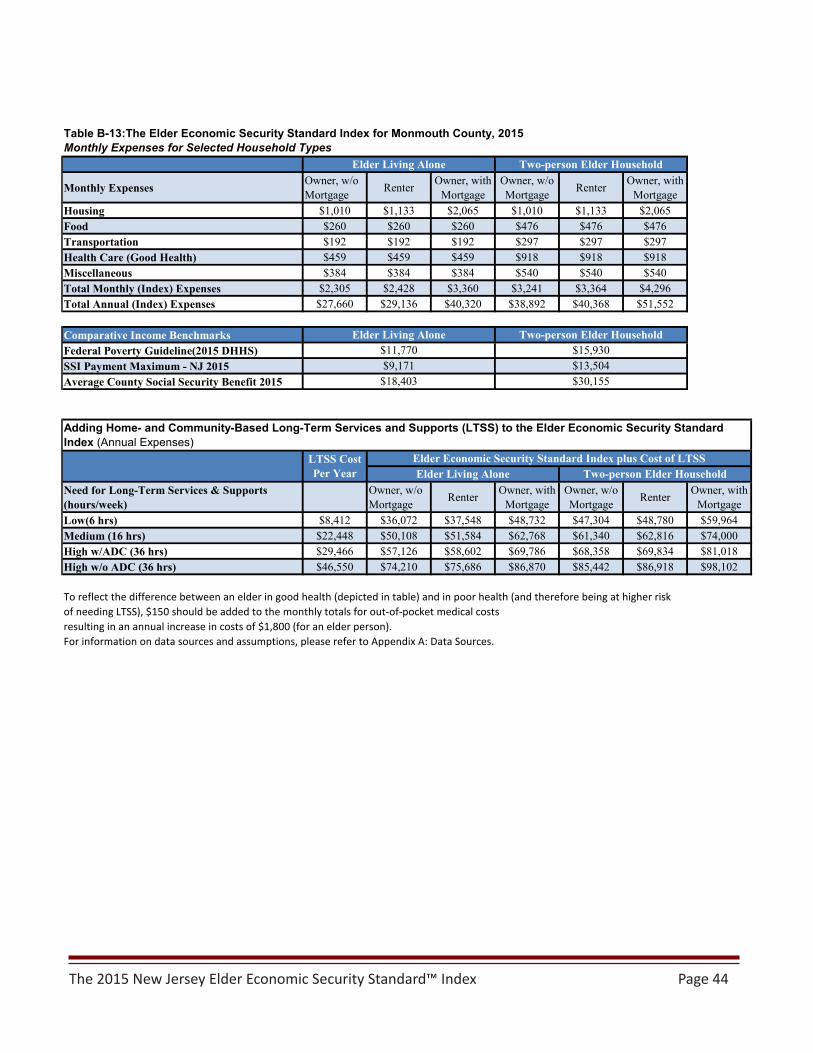
The 2015 New Jersey Elder Economic Security Standard™ Index Page 44
Monthly Expenses Owner, w/o Mortgage Renter Owner, with
MortgageOwner, w/o Mortgage Renter Owner, with
MortgageHousing $1,010 $1,133 $2,065 $1,010 $1,133 $2,065Food $260 $260 $260 $476 $476 $476Transportation $192 $192 $192 $297 $297 $297Health Care (Good Health) $459 $459 $459 $918 $918 $918Miscellaneous $384 $384 $384 $540 $540 $540Total Monthly (Index) Expenses $2,305 $2,428 $3,360 $3,241 $3,364 $4,296Total Annual (Index) Expenses $27,660 $29,136 $40,320 $38,892 $40,368 $51,552
Comparative Income BenchmarksFederal Poverty Guideline(2015 DHHS)SSI Payment Maximum - NJ 2015Average County Social Security Benefit 2015
Need for Long-Term Services & Supports (hours/week)
Owner, w/o Mortgage Renter Owner, with
MortgageOwner, w/o Mortgage Renter Owner, with
MortgageLow(6 hrs) $8,412 $36,072 $37,548 $48,732 $47,304 $48,780 $59,964Medium (16 hrs) $22,448 $50,108 $51,584 $62,768 $61,340 $62,816 $74,000High w/ADC (36 hrs) $29,466 $57,126 $58,602 $69,786 $68,358 $69,834 $81,018High w/o ADC (36 hrs) $46,550 $74,210 $75,686 $86,870 $85,442 $86,918 $98,102
To reflect the difference between an elder in good health (depicted in table) and in poor health (and therefore being at higher risk of needing LTSS), $150 should be added to the monthly totals for out-of-pocket medical costs resulting in an annual increase in costs of $1,800 (for an elder person).For information on data sources and assumptions, please refer to Appendix A: Data Sources.
$9,171 $13,504$18,403 $30,155
Adding Home- and Community-Based Long-Term Services and Supports (LTSS) to the Elder Economic Security Standard Index (Annual Expenses)
LTSS Cost Per Year
Elder Economic Security Standard Index plus Cost of LTSSElder Living Alone Two-person Elder Household
$11,770 $15,930
Table B-13:The Elder Economic Security Standard Index for Monmouth County, 2015Monthly Expenses for Selected Household Types
Elder Living Alone Two-person Elder Household
Elder Living Alone Two-person Elder Household

The 2015 New Jersey Elder Economic Security Standard™ Index Page 45
Monthly Expenses Owner, w/o Mortgage Renter Owner, with
MortgageOwner, w/o Mortgage Renter Owner, with
MortgageHousing $1,091 $1,066 $2,335 $1,091 $1,066 $2,335Food $260 $260 $260 $476 $476 $476Transportation $192 $192 $192 $297 $297 $297Health Care (Good Health) $459 $459 $459 $918 $918 $918Miscellaneous $400 $400 $400 $556 $556 $556Total Monthly (Index) Expenses $2,402 $2,377 $3,646 $3,338 $3,313 $4,582Total Annual (Index) Expenses $28,824 $28,524 $43,752 $40,056 $39,756 $54,984
Comparative Income BenchmarksFederal Poverty Guideline(2015 DHHS)SSI Payment Maximum - NJ 2015Average County Social Security Benefit 2015
Need for Long-Term Services & Supports (hours/week)
Owner, w/o Mortgage Renter Owner, with
MortgageOwner, w/o Mortgage Renter Owner, with
MortgageLow(6 hrs) $8,412 $37,236 $36,936 $52,164 $48,468 $48,168 $63,396Medium (16 hrs) $22,448 $51,272 $50,972 $66,200 $62,504 $62,204 $77,432High w/ADC (36 hrs) $29,466 $58,290 $57,990 $73,218 $69,522 $69,222 $84,450High w/o ADC (36 hrs) $46,550 $75,374 $75,074 $90,302 $86,606 $86,306 $101,534
To reflect the difference between an elder in good health (depicted in table) and in poor health (and therefore being at higher risk of needing LTSS), $150 should be added to the monthly totals for out-of-pocket medical costs resulting in an annual increase in costs of $1,800 (for an elder person).For information on data sources and assumptions, please refer to Appendix A: Data Sources.
$11,770 $15,930
Table B-14:The Elder Economic Security Standard Index for Morris County, 2015Monthly Expenses for Selected Household Types
Elder Living Alone Two-person Elder Household
Elder Living Alone Two-person Elder Household
LTSS Cost Per Year
Elder Economic Security Standard Index plus Cost of LTSSElder Living Alone Two-person Elder Household
$9,171 $13,504$19,097 $31,292
Adding Home- and Community-Based Long-Term Services and Supports (LTSS) to the Elder Economic Security Standard Index (Annual Expenses)
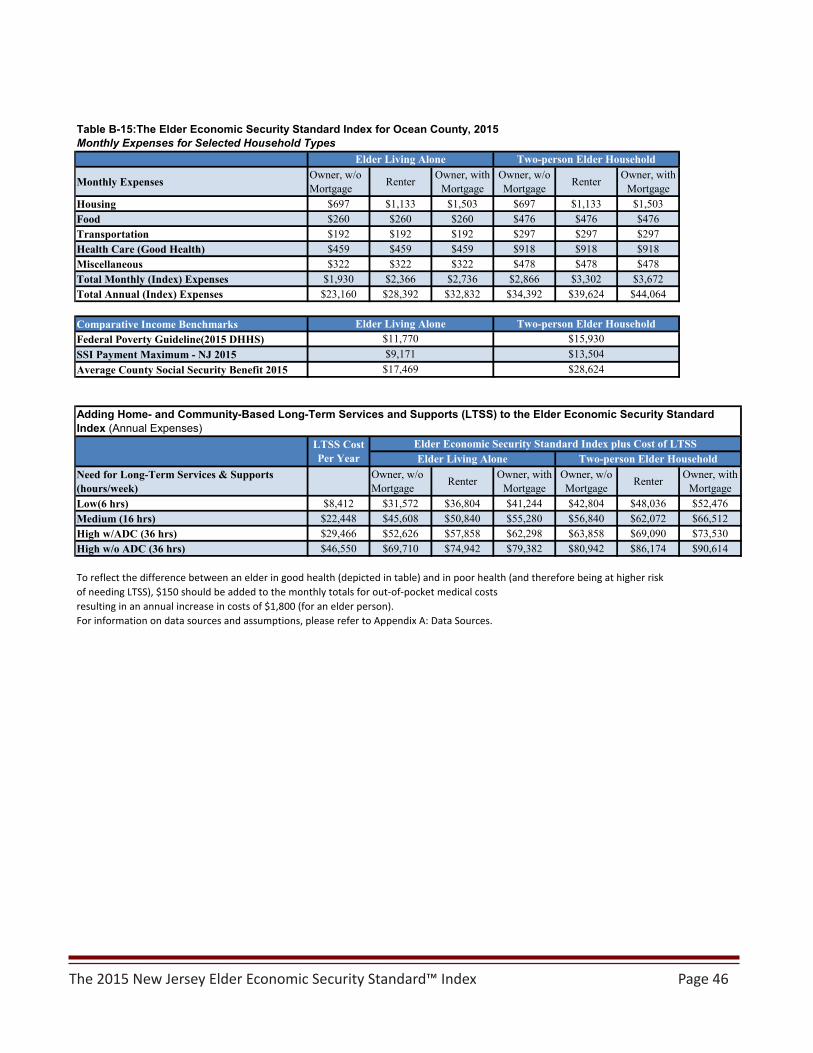
The 2015 New Jersey Elder Economic Security Standard™ Index Page 46
Monthly Expenses Owner, w/o Mortgage Renter Owner, with
MortgageOwner, w/o Mortgage Renter Owner, with
MortgageHousing $697 $1,133 $1,503 $697 $1,133 $1,503Food $260 $260 $260 $476 $476 $476Transportation $192 $192 $192 $297 $297 $297Health Care (Good Health) $459 $459 $459 $918 $918 $918Miscellaneous $322 $322 $322 $478 $478 $478Total Monthly (Index) Expenses $1,930 $2,366 $2,736 $2,866 $3,302 $3,672Total Annual (Index) Expenses $23,160 $28,392 $32,832 $34,392 $39,624 $44,064
Comparative Income BenchmarksFederal Poverty Guideline(2015 DHHS)SSI Payment Maximum - NJ 2015Average County Social Security Benefit 2015
Need for Long-Term Services & Supports (hours/week)
Owner, w/o Mortgage Renter Owner, with
MortgageOwner, w/o Mortgage Renter Owner, with
MortgageLow(6 hrs) $8,412 $31,572 $36,804 $41,244 $42,804 $48,036 $52,476Medium (16 hrs) $22,448 $45,608 $50,840 $55,280 $56,840 $62,072 $66,512High w/ADC (36 hrs) $29,466 $52,626 $57,858 $62,298 $63,858 $69,090 $73,530High w/o ADC (36 hrs) $46,550 $69,710 $74,942 $79,382 $80,942 $86,174 $90,614
To reflect the difference between an elder in good health (depicted in table) and in poor health (and therefore being at higher risk of needing LTSS), $150 should be added to the monthly totals for out-of-pocket medical costs resulting in an annual increase in costs of $1,800 (for an elder person).For information on data sources and assumptions, please refer to Appendix A: Data Sources.
$11,770 $15,930
Table B-15:The Elder Economic Security Standard Index for Ocean County, 2015Monthly Expenses for Selected Household Types
Elder Living Alone Two-person Elder Household
Elder Living Alone Two-person Elder Household
LTSS Cost Per Year
Elder Economic Security Standard Index plus Cost of LTSSElder Living Alone Two-person Elder Household
$9,171 $13,504$17,469 $28,624
Adding Home- and Community-Based Long-Term Services and Supports (LTSS) to the Elder Economic Security Standard Index (Annual Expenses)

The 2015 New Jersey Elder Economic Security Standard™ Index
Monthly Expenses Owner, w/o Mortgage Renter Owner, with
MortgageOwner, w/o Mortgage Renter Owner, with
MortgageHousing $1,141 $1,214 $2,370 $1,141 $1,214 $2,370Food $260 $260 $260 $476 $476 $476Transportation $192 $192 $192 $297 $297 $297Health Care (Good Health) $459 $459 $459 $918 $918 $918Miscellaneous $410 $410 $410 $566 $566 $566Total Monthly (Index) Expenses $2,462 $2,535 $3,691 $3,398 $3,471 $4,627Total Annual (Index) Expenses $29,544 $30,420 $44,292 $40,776 $41,652 $55,524
Comparative Income BenchmarksFederal Poverty Guideline(2015 DHHS)SSI Payment Maximum - NJ 2015Average County Social Security Benefit 2015
Need for Long-Term Services & Supports (hours/week)
Owner, w/o Mortgage Renter Owner, with
MortgageOwner, w/o Mortgage Renter Owner, with
MortgageLow(6 hrs) $8,412 $37,956 $38,832 $52,704 $49,188 $50,064 $63,936Medium (16 hrs) $22,448 $51,992 $52,868 $66,740 $63,224 $64,100 $77,972High w/ADC (36 hrs) $29,466 $59,010 $59,886 $73,758 $70,242 $71,118 $84,990High w/o ADC (36 hrs) $46,550 $76,094 $76,970 $90,842 $87,326 $88,202 $102,074
To reflect the difference between an elder in good health (depicted in table) and in poor health (and therefore being at higher risk of needing LTSS), $150 should be added to the monthly totals for out-of-pocket medical costs resulting in an annual increase in costs of $1,800 (for an elder person).For information on data sources and assumptions, please refer to Appendix A: Data Sources.
$11,770 $15,930
Table B-16:The Elder Economic Security Standard Index for Passaic County, 2015Monthly Expenses for Selected Household Types
Elder Living Alone Two-person Elder Household
Elder Living Alone Two-person Elder Household
LTSS Cost Per Year
Elder Economic Security Standard Index plus Cost of LTSSElder Living Alone Two-person Elder Household
$9,171 $13,504$16,723 $27,403
Adding Home- and Community-Based Long-Term Services and Supports (LTSS) to the Elder Economic Security Standard Index (Annual Expenses)
Page 47

The 2015 New Jersey Elder Economic Security Standard™ Index Page 48
Monthly Expenses Owner, w/o Mortgage Renter Owner, with
MortgageOwner, w/o Mortgage Renter Owner, with
MortgageHousing $750 $964 $1,460 $750 $964 $1,460Food $260 $260 $260 $476 $476 $476Transportation $192 $192 $192 $297 $297 $297Health Care (Good Health) $459 $459 $459 $918 $918 $918Miscellaneous $332 $332 $332 $488 $488 $488Total Monthly (Index) Expenses $1,993 $2,207 $2,703 $2,929 $3,143 $3,639Total Annual (Index) Expenses $23,916 $26,484 $32,436 $35,148 $37,716 $43,668
Comparative Income BenchmarksFederal Poverty Guideline(2015 DHHS)SSI Payment Maximum - NJ 2015Average County Social Security Benefit 2015
Need for Long-Term Services & Supports (hours/week)
Owner, w/o Mortgage Renter Owner, with
MortgageOwner, w/o Mortgage Renter Owner, with
MortgageLow(6 hrs) $7,800 $31,716 $34,284 $40,236 $42,948 $45,516 $51,468Medium (16 hrs) $21,020 $44,936 $47,504 $53,456 $56,168 $58,736 $64,688High w/ADC (36 hrs) $27,636 $51,552 $54,120 $60,072 $62,784 $65,352 $71,304High w/o ADC (36 hrs) $43,790 $67,706 $70,274 $76,226 $78,938 $81,506 $87,458
To reflect the difference between an elder in good health (depicted in table) and in poor health (and therefore being at higher risk of needing LTSS), $150 should be added to the monthly totals for out-of-pocket medical costs resulting in an annual increase in costs of $1,800 (for an elder person).For information on data sources and assumptions, please refer to Appendix A: Data Sources.
$11,770 $15,930
Table B-17:The Elder Economic Security Standard Index for Salem County, 2015Monthly Expenses for Selected Household Types
Elder Living Alone Two-person Elder Household
Elder Living Alone Two-person Elder Household
LTSS Cost Per Year
Elder Economic Security Standard Index plus Cost of LTSSElder Living Alone Two-person Elder Household
$9,171 $13,504$17,223 $28,222
Adding Home- and Community-Based Long-Term Services and Supports (LTSS) to the Elder Economic Security Standard Index (Annual Expenses)
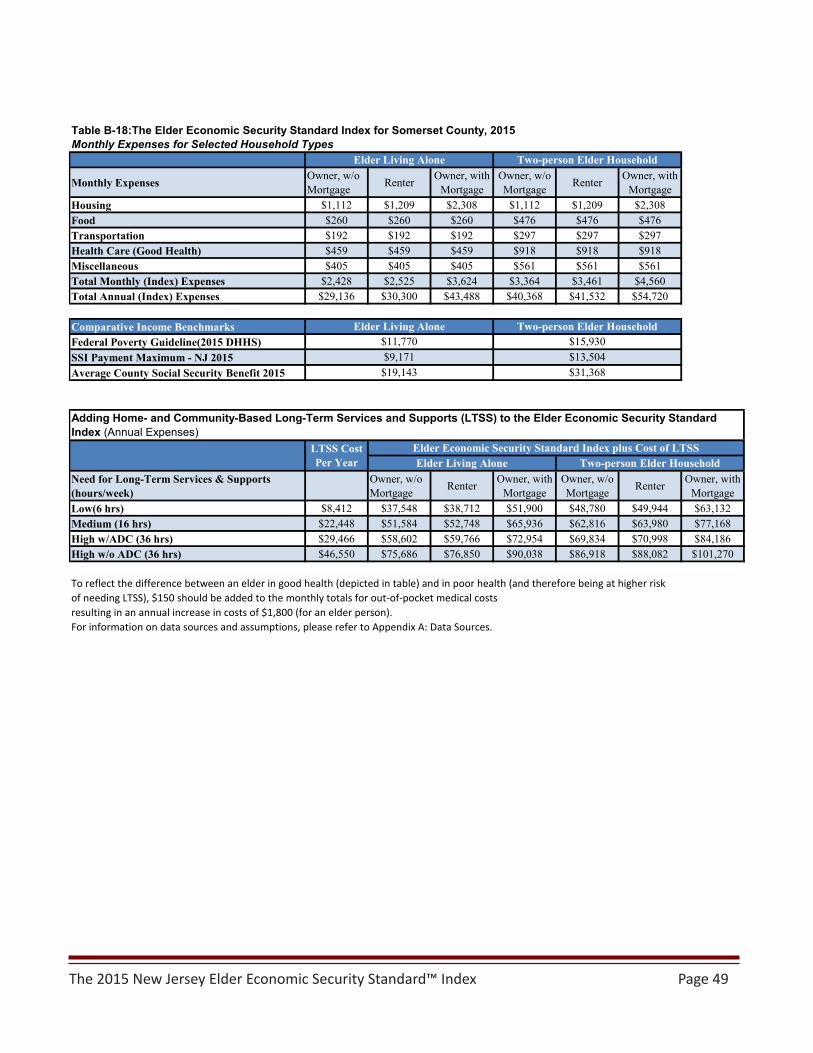
The 2015 New Jersey Elder Economic Security Standard™ Index Page 49
Monthly Expenses Owner, w/o Mortgage Renter Owner, with
MortgageOwner, w/o Mortgage Renter Owner, with
MortgageHousing $1,112 $1,209 $2,308 $1,112 $1,209 $2,308Food $260 $260 $260 $476 $476 $476Transportation $192 $192 $192 $297 $297 $297Health Care (Good Health) $459 $459 $459 $918 $918 $918Miscellaneous $405 $405 $405 $561 $561 $561Total Monthly (Index) Expenses $2,428 $2,525 $3,624 $3,364 $3,461 $4,560Total Annual (Index) Expenses $29,136 $30,300 $43,488 $40,368 $41,532 $54,720
Comparative Income BenchmarksFederal Poverty Guideline(2015 DHHS)SSI Payment Maximum - NJ 2015Average County Social Security Benefit 2015
Need for Long-Term Services & Supports (hours/week)
Owner, w/o Mortgage Renter Owner, with
MortgageOwner, w/o Mortgage Renter Owner, with
MortgageLow(6 hrs) $8,412 $37,548 $38,712 $51,900 $48,780 $49,944 $63,132Medium (16 hrs) $22,448 $51,584 $52,748 $65,936 $62,816 $63,980 $77,168High w/ADC (36 hrs) $29,466 $58,602 $59,766 $72,954 $69,834 $70,998 $84,186High w/o ADC (36 hrs) $46,550 $75,686 $76,850 $90,038 $86,918 $88,082 $101,270
To reflect the difference between an elder in good health (depicted in table) and in poor health (and therefore being at higher risk of needing LTSS), $150 should be added to the monthly totals for out-of-pocket medical costs resulting in an annual increase in costs of $1,800 (for an elder person).For information on data sources and assumptions, please refer to Appendix A: Data Sources.
$11,770 $15,930
Table B-18:The Elder Economic Security Standard Index for Somerset County, 2015Monthly Expenses for Selected Household Types
Elder Living Alone Two-person Elder Household
Elder Living Alone Two-person Elder Household
LTSS Cost Per Year
Elder Economic Security Standard Index plus Cost of LTSSElder Living Alone Two-person Elder Household
$9,171 $13,504$19,143 $31,368
Adding Home- and Community-Based Long-Term Services and Supports (LTSS) to the Elder Economic Security Standard Index (Annual Expenses)

The 2015 New Jersey Elder Economic Security Standard™ Index Page 50
Monthly Expenses Owner, w/o Mortgage Renter Owner, with
MortgageOwner, w/o Mortgage Renter Owner, with
MortgageHousing $944 $1,066 $1,994 $944 $1,066 $1,994Food $260 $260 $260 $476 $476 $476Transportation $192 $192 $192 $297 $297 $297Health Care (Good Health) $459 $459 $459 $918 $918 $918Miscellaneous $371 $371 $371 $527 $527 $527Total Monthly (Index) Expenses $2,226 $2,348 $3,276 $3,162 $3,284 $4,212Total Annual (Index) Expenses $26,712 $28,176 $39,312 $37,944 $39,408 $50,544
Comparative Income BenchmarksFederal Poverty Guideline(2015 DHHS)SSI Payment Maximum - NJ 2015Average County Social Security Benefit 2015
Need for Long-Term Services & Supports (hours/week)
Owner, w/o Mortgage Renter Owner, with
MortgageOwner, w/o Mortgage Renter Owner, with
MortgageLow(6 hrs) $8,412 $35,124 $36,588 $47,724 $46,356 $47,820 $58,956Medium (16 hrs) $22,448 $49,160 $50,624 $61,760 $60,392 $61,856 $72,992High w/ADC (36 hrs) $29,466 $56,178 $57,642 $68,778 $67,410 $68,874 $80,010High w/o ADC (36 hrs) $46,550 $73,262 $74,726 $85,862 $84,494 $85,958 $97,094
To reflect the difference between an elder in good health (depicted in table) and in poor health (and therefore being at higher risk of needing LTSS), $150 should be added to the monthly totals for out-of-pocket medical costs resulting in an annual increase in costs of $1,800 (for an elder person).For information on data sources and assumptions, please refer to Appendix A: Data Sources.
$11,770 $15,930
Table B-19:The Elder Economic Security Standard Index for Sussex County, 2015Monthly Expenses for Selected Household Types
Elder Living Alone Two-person Elder Household
Elder Living Alone Two-person Elder Household
LTSS Cost Per Year
Elder Economic Security Standard Index plus Cost of LTSSElder Living Alone Two-person Elder Household
$9,171 $13,504$18,163 $29,762
Adding Home- and Community-Based Long-Term Services and Supports (LTSS) to the Elder Economic Security Standard Index (Annual Expenses)

The 2015 New Jersey Elder Economic Security Standard™ Index Page 51
Monthly Expenses Owner, w/o Mortgage Renter Owner, with
MortgageOwner, w/o Mortgage Renter Owner, with
MortgageHousing $1,132 $1,066 $2,243 $1,132 $1,066 $2,243Food $260 $260 $260 $476 $476 $476Transportation $192 $192 $192 $297 $297 $297Health Care (Good Health) $459 $459 $459 $918 $918 $918Miscellaneous $409 $409 $409 $565 $565 $565Total Monthly (Index) Expenses $2,452 $2,386 $3,563 $3,388 $3,322 $4,499Total Annual (Index) Expenses $29,424 $28,632 $42,756 $40,656 $39,864 $53,988
Comparative Income BenchmarksFederal Poverty Guideline(2015 DHHS)SSI Payment Maximum - NJ 2015Average County Social Security Benefit 2015
Need for Long-Term Services & Supports (hours/week)
Owner, w/o Mortgage Renter Owner, with
MortgageOwner, w/o Mortgage Renter Owner, with
MortgageLow(6 hrs) $8,412 $37,836 $37,044 $51,168 $49,068 $48,276 $62,400Medium (16 hrs) $22,448 $51,872 $51,080 $65,204 $63,104 $62,312 $76,436High w/ADC (36 hrs) $29,466 $58,890 $58,098 $72,222 $70,122 $69,330 $83,454High w/o ADC (36 hrs) $46,550 $75,974 $75,182 $89,306 $87,206 $86,414 $100,538
To reflect the difference between an elder in good health (depicted in table) and in poor health (and therefore being at higher risk of needing LTSS), $150 should be added to the monthly totals for out-of-pocket medical costs resulting in an annual increase in costs of $1,800 (for an elder person).For information on data sources and assumptions, please refer to Appendix A: Data Sources.
$11,770 $15,930
Table B-20:The Elder Economic Security Standard Index for Union County, 2015Monthly Expenses for Selected Household Types
Elder Living Alone Two-person Elder Household
Elder Living Alone Two-person Elder Household
LTSS Cost Per Year
Elder Economic Security Standard Index plus Cost of LTSSElder Living Alone Two-person Elder Household
$9,171 $13,504$17,405 $28,520
Adding Home- and Community-Based Long-Term Services and Supports (LTSS) to the Elder Economic Security Standard Index (Annual Expenses)
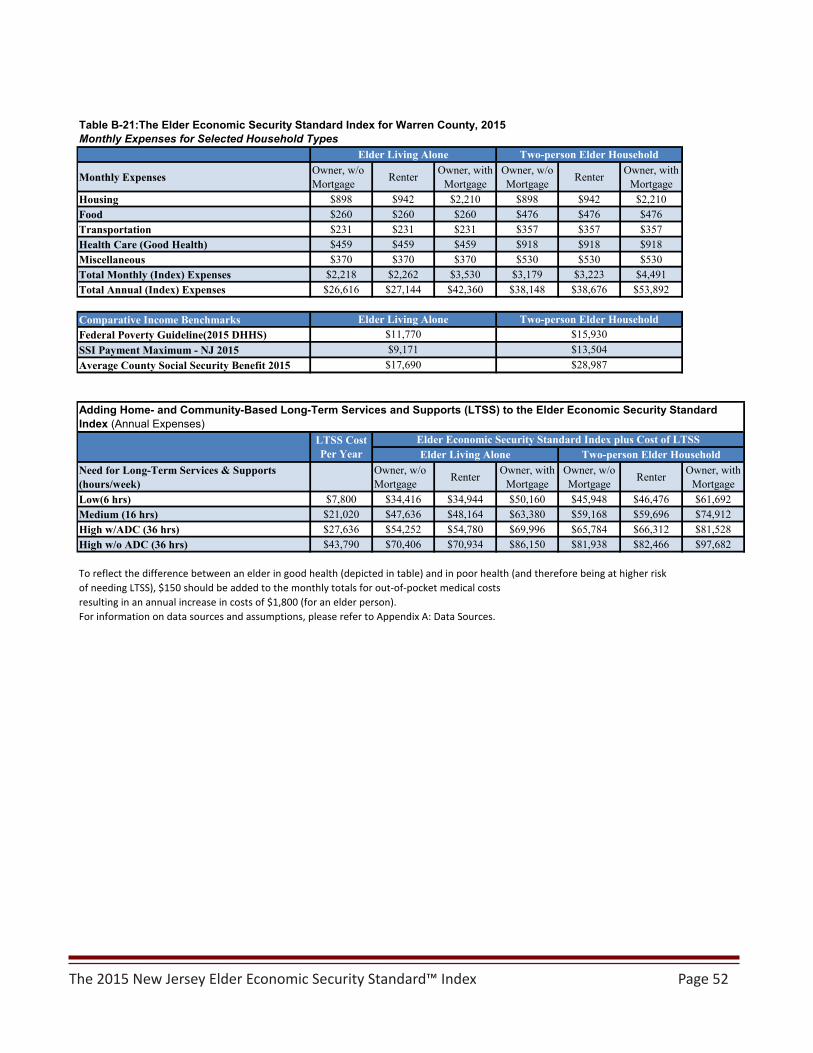
The 2015 New Jersey Elder Economic Security Standard™ Index Page 52
Monthly Expenses Owner, w/o Mortgage Renter Owner, with
MortgageOwner, w/o Mortgage Renter Owner, with
MortgageHousing $898 $942 $2,210 $898 $942 $2,210Food $260 $260 $260 $476 $476 $476Transportation $231 $231 $231 $357 $357 $357Health Care (Good Health) $459 $459 $459 $918 $918 $918Miscellaneous $370 $370 $370 $530 $530 $530Total Monthly (Index) Expenses $2,218 $2,262 $3,530 $3,179 $3,223 $4,491Total Annual (Index) Expenses $26,616 $27,144 $42,360 $38,148 $38,676 $53,892
Comparative Income BenchmarksFederal Poverty Guideline(2015 DHHS)SSI Payment Maximum - NJ 2015Average County Social Security Benefit 2015
Need for Long-Term Services & Supports (hours/week)
Owner, w/o Mortgage Renter Owner, with
MortgageOwner, w/o Mortgage Renter Owner, with
MortgageLow(6 hrs) $7,800 $34,416 $34,944 $50,160 $45,948 $46,476 $61,692Medium (16 hrs) $21,020 $47,636 $48,164 $63,380 $59,168 $59,696 $74,912High w/ADC (36 hrs) $27,636 $54,252 $54,780 $69,996 $65,784 $66,312 $81,528High w/o ADC (36 hrs) $43,790 $70,406 $70,934 $86,150 $81,938 $82,466 $97,682
To reflect the difference between an elder in good health (depicted in table) and in poor health (and therefore being at higher risk of needing LTSS), $150 should be added to the monthly totals for out-of-pocket medical costs resulting in an annual increase in costs of $1,800 (for an elder person).For information on data sources and assumptions, please refer to Appendix A: Data Sources.
$11,770 $15,930
Table B-21:The Elder Economic Security Standard Index for Warren County, 2015Monthly Expenses for Selected Household Types
Elder Living Alone Two-person Elder Household
Elder Living Alone Two-person Elder Household
LTSS Cost Per Year
Elder Economic Security Standard Index plus Cost of LTSSElder Living Alone Two-person Elder Household
$9,171 $13,504$17,690 $28,987
Adding Home- and Community-Based Long-Term Services and Supports (LTSS) to the Elder Economic Security Standard Index (Annual Expenses)
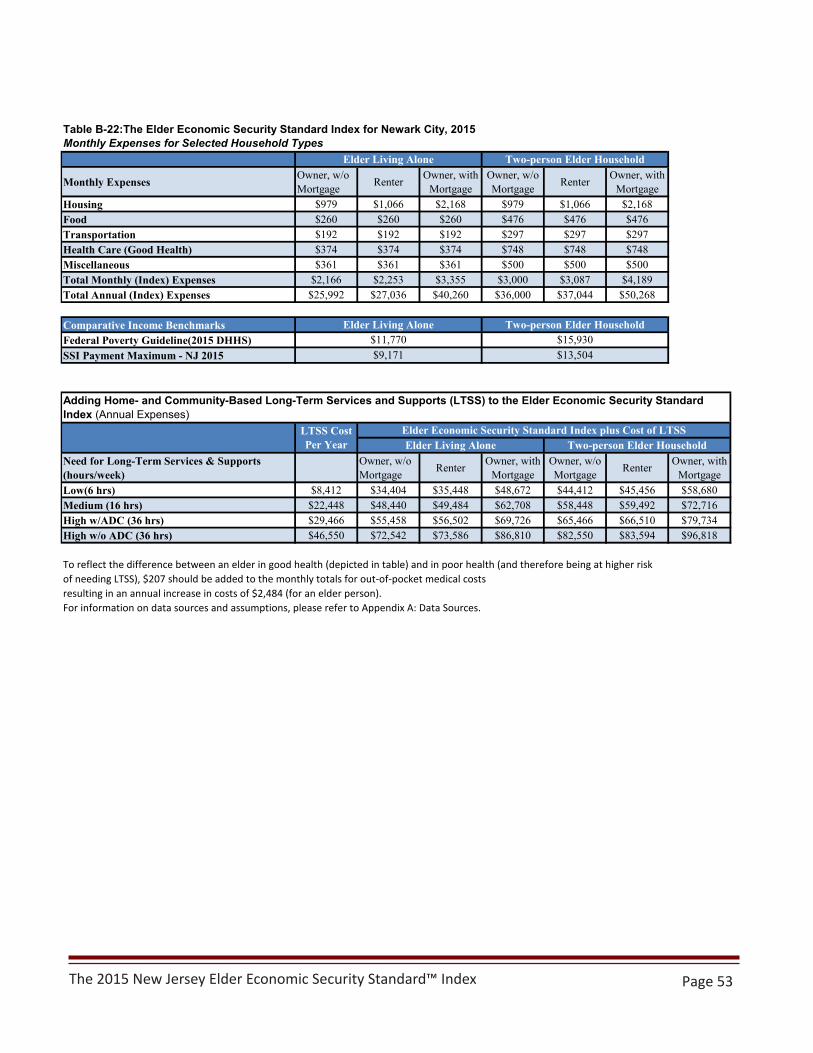
The 2015 New Jersey Elder Economic Security Standard™ Index Page 53
Monthly Expenses Owner, w/o Mortgage Renter Owner, with
MortgageOwner, w/o Mortgage Renter Owner, with
MortgageHousing $979 $1,066 $2,168 $979 $1,066 $2,168Food $260 $260 $260 $476 $476 $476Transportation $192 $192 $192 $297 $297 $297Health Care (Good Health) $374 $374 $374 $748 $748 $748Miscellaneous $361 $361 $361 $500 $500 $500Total Monthly (Index) Expenses $2,166 $2,253 $3,355 $3,000 $3,087 $4,189Total Annual (Index) Expenses $25,992 $27,036 $40,260 $36,000 $37,044 $50,268
Comparative Income BenchmarksFederal Poverty Guideline(2015 DHHS)SSI Payment Maximum - NJ 2015
Need for Long-Term Services & Supports (hours/week)
Owner, w/o Mortgage Renter Owner, with
MortgageOwner, w/o Mortgage Renter Owner, with
MortgageLow(6 hrs) $8,412 $34,404 $35,448 $48,672 $44,412 $45,456 $58,680Medium (16 hrs) $22,448 $48,440 $49,484 $62,708 $58,448 $59,492 $72,716High w/ADC (36 hrs) $29,466 $55,458 $56,502 $69,726 $65,466 $66,510 $79,734High w/o ADC (36 hrs) $46,550 $72,542 $73,586 $86,810 $82,550 $83,594 $96,818
To reflect the difference between an elder in good health (depicted in table) and in poor health (and therefore being at higher risk of needing LTSS), $207 should be added to the monthly totals for out-of-pocket medical costs resulting in an annual increase in costs of $2,484 (for an elder person).For information on data sources and assumptions, please refer to Appendix A: Data Sources.
$11,770 $15,930
Table B-22:The Elder Economic Security Standard Index for Newark City, 2015Monthly Expenses for Selected Household Types
Elder Living Alone Two-person Elder Household
Elder Living Alone Two-person Elder Household
$9,171 $13,504
Adding Home- and Community-Based Long-Term Services and Supports (LTSS) to the Elder Economic Security Standard Index (Annual Expenses)
LTSS Cost Per Year
Elder Economic Security Standard Index plus Cost of LTSSElder Living Alone Two-person Elder Household
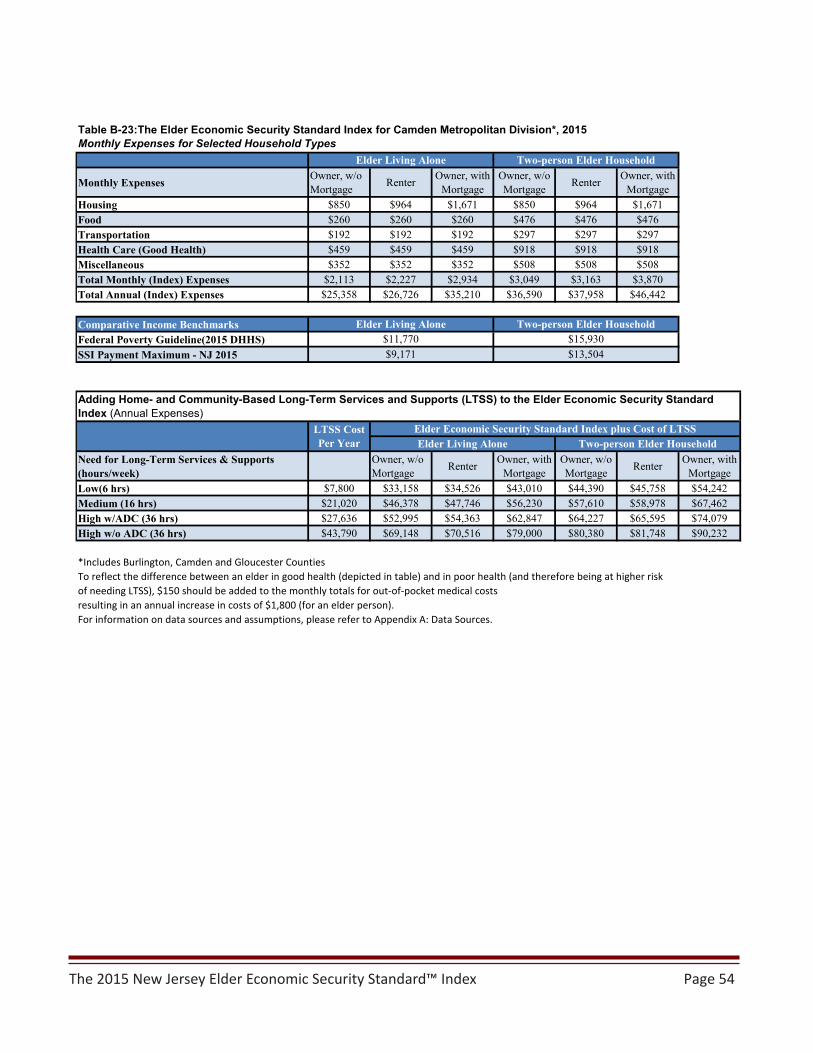
The 2015 New Jersey Elder Economic Security Standard™ Index Page 54
Monthly Expenses Owner, w/o Mortgage Renter Owner, with
MortgageOwner, w/o Mortgage Renter Owner, with
MortgageHousing $850 $964 $1,671 $850 $964 $1,671Food $260 $260 $260 $476 $476 $476Transportation $192 $192 $192 $297 $297 $297Health Care (Good Health) $459 $459 $459 $918 $918 $918Miscellaneous $352 $352 $352 $508 $508 $508Total Monthly (Index) Expenses $2,113 $2,227 $2,934 $3,049 $3,163 $3,870Total Annual (Index) Expenses $25,358 $26,726 $35,210 $36,590 $37,958 $46,442
Comparative Income BenchmarksFederal Poverty Guideline(2015 DHHS)SSI Payment Maximum - NJ 2015
Need for Long-Term Services & Supports (hours/week)
Owner, w/o Mortgage Renter Owner, with
MortgageOwner, w/o Mortgage Renter Owner, with
MortgageLow(6 hrs) $7,800 $33,158 $34,526 $43,010 $44,390 $45,758 $54,242Medium (16 hrs) $21,020 $46,378 $47,746 $56,230 $57,610 $58,978 $67,462High w/ADC (36 hrs) $27,636 $52,995 $54,363 $62,847 $64,227 $65,595 $74,079High w/o ADC (36 hrs) $43,790 $69,148 $70,516 $79,000 $80,380 $81,748 $90,232
*Includes Burlington, Camden and Gloucester CountiesTo reflect the difference between an elder in good health (depicted in table) and in poor health (and therefore being at higher risk of needing LTSS), $150 should be added to the monthly totals for out-of-pocket medical costs resulting in an annual increase in costs of $1,800 (for an elder person).For information on data sources and assumptions, please refer to Appendix A: Data Sources.
$11,770 $15,930
Table B-23:The Elder Economic Security Standard Index for Camden Metropolitan Division*, 2015Monthly Expenses for Selected Household Types
Elder Living Alone Two-person Elder Household
Elder Living Alone Two-person Elder Household
$9,171 $13,504
Adding Home- and Community-Based Long-Term Services and Supports (LTSS) to the Elder Economic Security Standard Index (Annual Expenses)
LTSS Cost Per Year
Elder Economic Security Standard Index plus Cost of LTSSElder Living Alone Two-person Elder Household
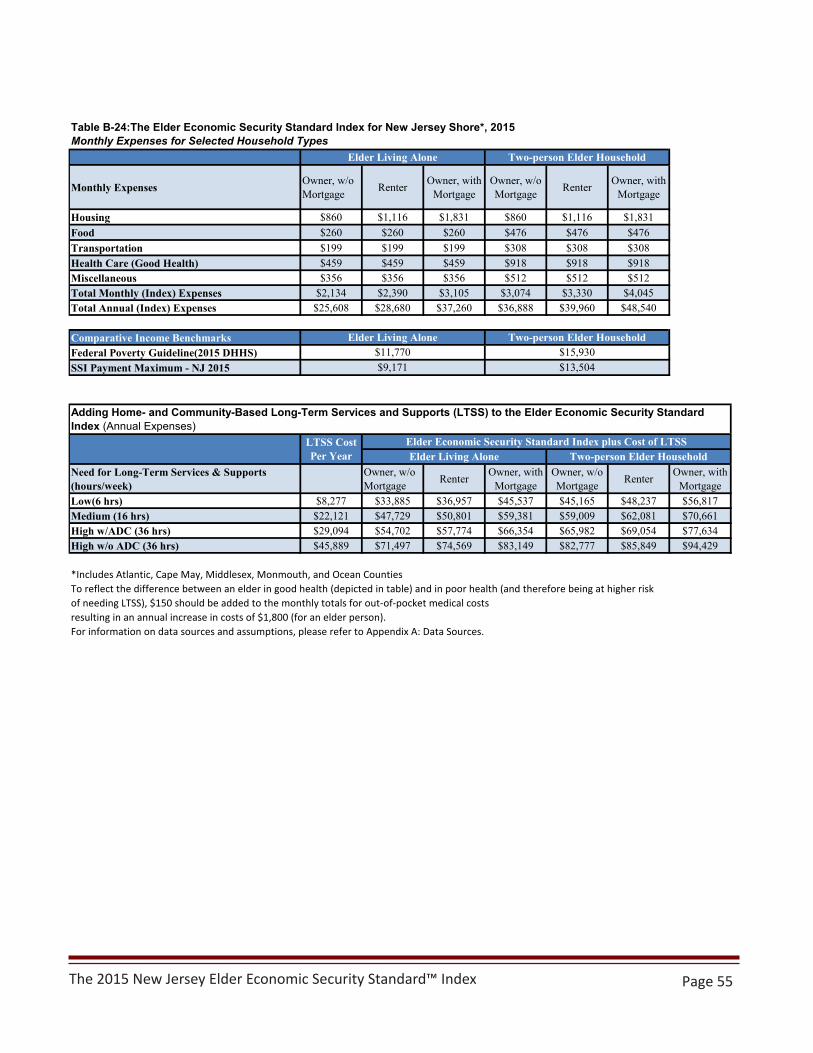
The 2015 New Jersey Elder Economic Security Standard™ Index Page 55
Monthly Expenses Owner, w/o Mortgage Renter Owner, with
MortgageOwner, w/o Mortgage Renter Owner, with
Mortgage
Housing $860 $1,116 $1,831 $860 $1,116 $1,831Food $260 $260 $260 $476 $476 $476Transportation $199 $199 $199 $308 $308 $308Health Care (Good Health) $459 $459 $459 $918 $918 $918Miscellaneous $356 $356 $356 $512 $512 $512Total Monthly (Index) Expenses $2,134 $2,390 $3,105 $3,074 $3,330 $4,045Total Annual (Index) Expenses $25,608 $28,680 $37,260 $36,888 $39,960 $48,540
Comparative Income BenchmarksFederal Poverty Guideline(2015 DHHS)SSI Payment Maximum - NJ 2015
Need for Long-Term Services & Supports (hours/week)
Owner, w/o Mortgage Renter Owner, with
MortgageOwner, w/o Mortgage Renter Owner, with
MortgageLow(6 hrs) $8,277 $33,885 $36,957 $45,537 $45,165 $48,237 $56,817Medium (16 hrs) $22,121 $47,729 $50,801 $59,381 $59,009 $62,081 $70,661High w/ADC (36 hrs) $29,094 $54,702 $57,774 $66,354 $65,982 $69,054 $77,634High w/o ADC (36 hrs) $45,889 $71,497 $74,569 $83,149 $82,777 $85,849 $94,429
*Includes Atlantic, Cape May, Middlesex, Monmouth, and Ocean CountiesTo reflect the difference between an elder in good health (depicted in table) and in poor health (and therefore being at higher risk of needing LTSS), $150 should be added to the monthly totals for out-of-pocket medical costs resulting in an annual increase in costs of $1,800 (for an elder person).For information on data sources and assumptions, please refer to Appendix A: Data Sources.
$11,770 $15,930
Table B-24:The Elder Economic Security Standard Index for New Jersey Shore*, 2015Monthly Expenses for Selected Household Types
Elder Living Alone Two-person Elder Household
Elder Living Alone Two-person Elder Household
$9,171 $13,504
Adding Home- and Community-Based Long-Term Services and Supports (LTSS) to the Elder Economic Security Standard Index (Annual Expenses)
LTSS Cost Per Year
Elder Economic Security Standard Index plus Cost of LTSSElder Living Alone Two-person Elder Household
THE GERONTOLOGY INSTITUTE John W. McCormack Graduate School of Policy Studies
University of Massachusetts Boston
The Gerontology Institute addresses social and economic issues associated with population aging. The Institute conducts research, analyzes policy issues, and engages in public education. It also encourages the participation of older people in aging services and policy development. In its work with local, state, national, and international organizations, the Institute has five priorities: 1) productive aging; 2) health care for the elderly; 3) long-term supports and services; 4) economic security for older adults; and 5) social and demographic research on aging. TheInstitute pays particular attention to the special needs of low-income and minority elderly.
The Gerontology Institute was created in 1984 by the Massachusetts Legislature. In 2003, the Gerontology Institute became a founding member of the John W. McCormack Graduate School of Policy Studies at the University of Massachusetts Boston. Programs housed at the Gerontology Institute include the Pension Action Center, the Center for Social and Demographic Research on Aging, the Center for Long-Term Services and Supports, and the Osher Lifelong Learning Institute (OLLI), a non-credit educational program for adult learners ages 50 and older.
The Institute supports the University’s educational programs in Gerontology, including a Ph.D. program in Gerontology, a Master of Science in Gerontology that focuses on management issues for professionals in the field of aging, and undergraduate programs including the Frank J. Manning Certificate Program in Gerontology, which prepares students for roles in aging services.
Together, the Gerontology Institute and Department provide editorial leadership for two scholarly, peer-reviewed journals: the Journal of Aging & Social Policy, a journal focusing on policy issues in aging societies with an international perspective, and Research on Aging, an interdisciplinary journal designed to highlight the expanding research in the field of social gerontology.
Gerontology Institute Phone: 617-287-7300 Fax: 617-287-2080 https://www.umb.edu/gerontologyinstitute