THE 2015 GENENTECH ONCOLOGY TREND REPORT Oncology Trends.pdf · 10/30/2015 1 THE 2015 GENENTECH...
20
10/30/2015 1 THE 2015 GENENTECH ONCOLOGY TREND REPORT Perspectives From Managed Care, Specialty Pharmacies, Oncologists, Practice Managers, and Employers ©2015 Genentech, South San Francisco, CA February 2015 MCM/031015/0062 2 Mission Statement The mission of The 2015 Genentech Oncology Trend Report: Perspectives From Managed Care, Specialty Pharmacies, Oncologists, Practice Managers, and Employers is to provide timely and useful information on the latest cancer care trends and developments. Updated annually, the publication is designed to serve as a unique resource for those seeking an understanding of the issues surrounding cancer management and practice. The content of this report was prepared by Emron with the guidance of an editorial board and is based on primary research of key stakeholders, as well as published literature. Statements and opinions contained in this report do not necessarily reflect those of Genentech or the editorial board.
Transcript of THE 2015 GENENTECH ONCOLOGY TREND REPORT Oncology Trends.pdf · 10/30/2015 1 THE 2015 GENENTECH...

10/30/2015
1
THE 2015 GENENTECH ONCOLOGY TREND REPORT
Perspectives From Managed Care, Specialty Pharmacies, Oncologists, Practice Managers, and Employers
©2015 Genentech, South San Francisco, CA February 2015
MCM/031015/0062
2
Mission Statement
The mission of The 2015 Genentech Oncology Trend Report: Perspectives
From Managed Care, Specialty Pharmacies, Oncologists, Practice Managers,
and Employers is to provide timely and useful information on the latest cancer
care trends and developments. Updated annually, the publication is designed to
serve as a unique resource for those seeking an understanding of the issues
surrounding cancer management and practice.
The content of this report was prepared by Emron with the guidance of an
editorial board and is based on primary research of key stakeholders, as well
as published literature. Statements and opinions contained in this report
do not necessarily reflect those of Genentech or the editorial board.
10/30/2015
2
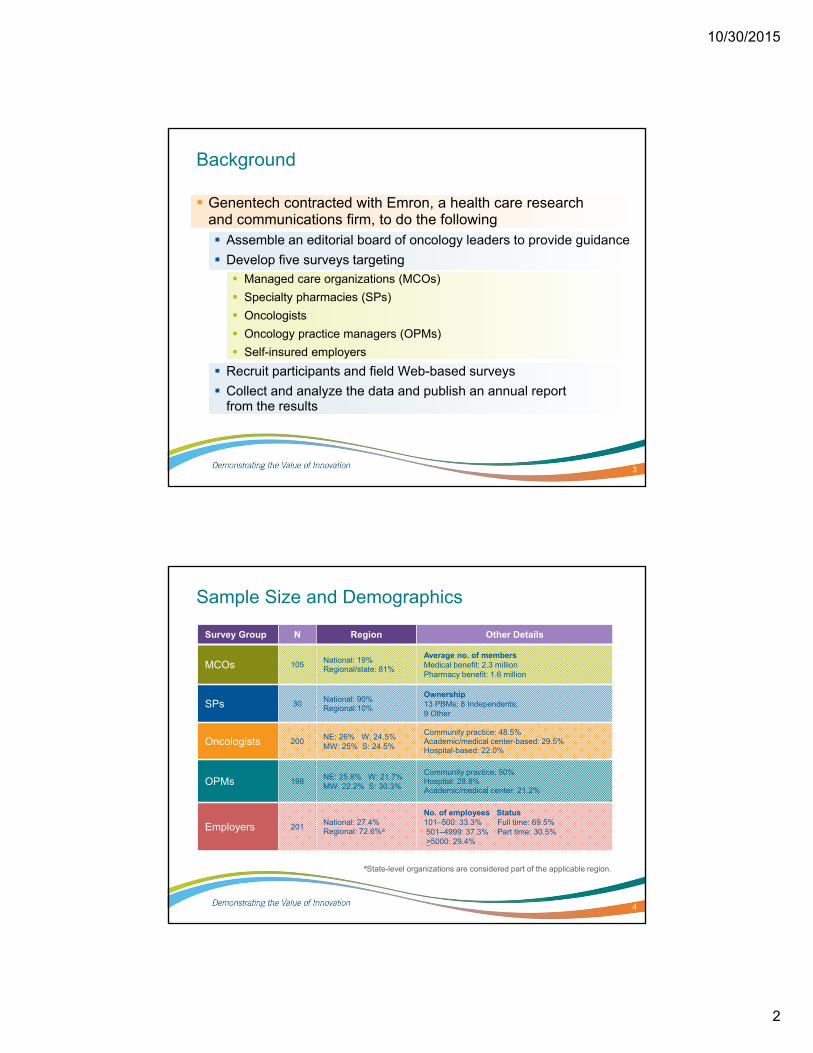
Background
Genentech contracted with Emron, a health care research and communications firm, to do the following Assemble an editorial board of oncology leaders to provide guidance
Develop five surveys targeting
Managed care organizations (MCOs)
Specialty pharmacies (SPs)
Oncologists
Oncology practice managers (OPMs)
Self-insured employers
Recruit participants and field Web-based surveys
Collect and analyze the data and publish an annual report from the results
3
4
Sample Size and Demographics
Survey Group N Region Other Details
MCOs 105National: 19%Regional/state: 81%
Average no. of membersMedical benefit: 2.3 millionPharmacy benefit: 1.6 million
SPs 30National: 90%Regional:10%
Ownership13 PBMs; 8 Independents; 9 Other
Oncologists 200NE: 26% W: 24.5%MW: 25% S: 24.5%
Community practice: 48.5% Academic/medical center-based: 29.5% Hospital-based: 22.0%
OPMs 198NE: 25.8% W: 21.7%MW: 22.2% S: 30.3%
Community practice: 50% Hospital: 28.8% Academic/medical center: 21.2%
Employers 201National: 27.4%Regional: 72.6%a
No. of employees Status101–500: 33.3% Full time: 69.5% 501–4999: 37.3% Part time: 30.5% >5000: 29.4%
ªState-level organizations are considered part of the applicable region.

10/30/2015
3
Presentation Organized by Key Themes
Guidelines & Pathways
Cancer Drug Management
Oncology Practice Drug Spending & Revenue
Cancer Drug Coverage & Access
Oncology Practice Consolidation, Workload & Staffing
Palliative Care & Advance Care Planning
Cancer Survivorship Care
Pharmacogenomics
Population Health Management
Health Information Technology & Mobile Health
5
Guidelines & Pathways
Balancing Standardization With Personalization
6
MCOs section, Illustration, page 11.
aTreatment standardization refers to guidelines and pathways; personalization refers to molecular and biomarker testing.

10/30/2015
4
Guidelines & Pathways
Use by MCOs
7
Adapted from the MCOs section, Figure 6, page 13.
Types of cancers treated using guidelines and pathwaysPercentage of MCOs following cancer treatment guidelines or pathways, 2013 and 2014
Cancer Treatment…
Guidelines & Pathways
Use by Oncologists
8
Adapted from the Oncologists section, Figure 10, page 50.
NCCN = National Comprehensive Cancer Network; ASCO = American Society of Clinical Oncology.
10/30/2015
5
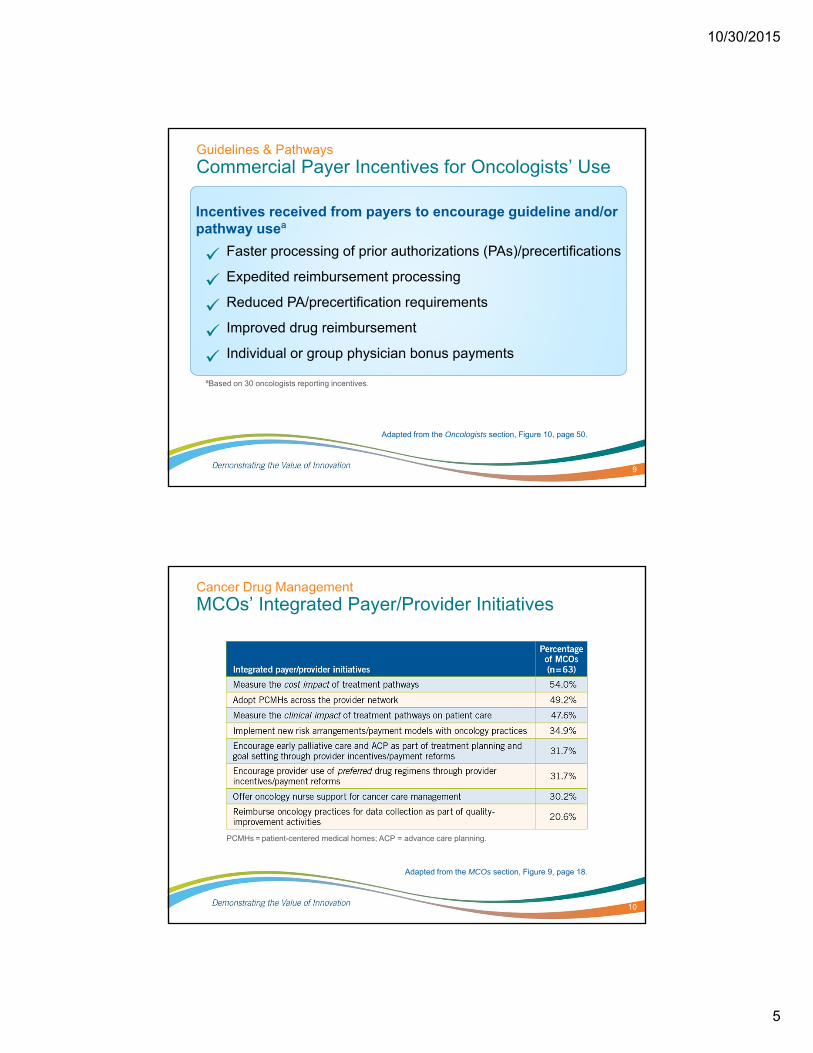
Guidelines & Pathways
Commercial Payer Incentives for Oncologists’ Use
9
Adapted from the Oncologists section, Figure 10, page 50.
Incentives received from payers to encourage guideline and/or pathway useª
Faster processing of prior authorizations (PAs)/precertifications
Expedited reimbursement processing
Reduced PA/precertification requirements
Improved drug reimbursement
Individual or group physician bonus payments
ªBased on 30 oncologists reporting incentives.
Cancer Drug Management
MCOs’ Integrated Payer/Provider Initiatives
10
Adapted from the MCOs section, Figure 9, page 18.
PCMHs = patient-centered medical homes; ACP = advance care planning.

10/30/2015
6
Cancer Drug Management
MCOs Adopt Patient-Centered Medical Homes
11
Adapted from the MCOs section, Figure 9, page 18.
PCMHs = patient-centered medical homes.
Organization of PCMHs adopted by MCOs
Percentage of MCOs (n=31)
Cancer Drug Management
MCOs Apply New Provider Payment Models
12
Adapted from the MCOs section, Figure 10, page 19.
Payment models implemented or piloted with network oncologists

10/30/2015
7
Oncology Practice Drug Spending & Revenue
Drug Buy and Bill Among Practices
13
Adapted from the OPMs section, Figure 4, page 61.
ªWhite bagging is defined as obtaining patient-specific drugs directly from the specialty pharmacy (SP) for in-practice use. Brown bagging is defined as obtaining drugs through the patient who receives the drug(s) from an SP and transports them to the office.
Drug sources for in-practice administration
Oncology Practice Drug Spending & Revenue
OPMs Forecast Drug Expenses in 2014 vs 2013
14
Adapted from the OPMs section, Figure 4, page 61.

10/30/2015
8
Oncology Practice Drug Spending & Revenue
Oncology Practice Parenteral Drug Margin
15
Adapted from the OPMs section, Figure 11, page 70.
GPO = group purchasing organization.
Initiatives to mitigate declineChange over the last 12 months
Cancer Drug Coverage & Access
Escalation in Patient Out-of-Pocket Costs…
Was identified among the top 3 most pressing challenges facing cancer care today by
16
73.3%of
SPs
64.1%of
OPMs
51.5%of
oncologists
40.8%of
employers
Adapted from illustrations on pp. 39, 52, 72, and 85.

10/30/2015
9
Cancer Drug Coverage & Access
OPMs See Changes in Patients’ Health Insurance
17
Adapted from the OPMs section, Figure 1, page 58.
FFS = fee for service; HIX = state and/or federal health insurance exchange.
Change in select patient populations over the last 12 months
Cancer Drug Coverage & Access
MCOs’ Forecasts for Drug Cost Sharing in 2015
18
Adapted from the MCOs section, Figure 14, page 24.
MCOs forecasting increased oncology drug cost sharing for 2015

10/30/2015
10
Cancer Drug Coverage & Access
Practice Collection of Patient OOPs Reported by OPMs
19
Adapted from the OPMs section, Figure 14, page 72.
EOB = Explanation of Benefits.
Success in collecting patient OOP drug cost share, 2010 to 2014
Patient support through financial assistance
Most common policies regarding OOP collection
Cancer Drug Coverage & Access
Drug Shortages: Consequences and Coping Strategies Reported by Oncologists
20
Adapted from the Oncologists section, Figure 12, page 51.
Economic and clinical impact of drug shortages over the last 12 months
Practice strategies to cope with drug shortages

10/30/2015
11
Cancer Drug Coverage & Access
Drug Distribution Channels Reported by MCOs
21
Adapted from the MCOs section, Figure 15, page 25.
Distribution channels for oncology drugs
Oncology Practice Consolidation, Workload & Staffing
OPMs Report on Practice Reorganizational Strategies─Current and/or Under Consideration
22
OPMs section, Figure 5, page 63.
ªRelationship established by a physicians services agreement.
Major drivers of reorganization

10/30/2015
12
Oncology Practice Consolidation, Workload & Staffing
How MCOs Ensure Use of the Most Cost-Effective Site of Service
23
Adapted from the MCOs section, Illustration, page 22.
Utilization Management
Create site-specific rules for certain conditions and services
Institute PA/precertification to ensure selection of the lowest-cost site
Develop a drug list appropriate for home care or self-administration
Move infusion services to 340B-qualified hospital infusion centers
Promote the community hospital setting over the academic setting, where appropriate
Oncologist Reimbursement
Set reimbursement for physician-administered drugs at the specialty pharmacy rate
Increase reimbursement for in-practice drug administration vs hospital administration
Provide recommendations to oncologists for the most cost-effective sites and infusion suites
Enter into risk-sharing arrangements with providers
PA=prior authorization.
Oncology Practice Consolidation, Workload & Staffing
How MCOs Ensure Use of the Most Cost-Effective Site of Service (cont.)
24
Member Awareness
Encourage members to choose the most cost-effective options through cost-share differences and education
Direct case-management referrals to cost-effective settings
Encourage members to discuss site-of-care cost differences with their oncologist
Contracting
Contract with appropriate sites and implement narrow or preferred networks
Direct care away from the outpatient hospital setting
Set up outpatient infusion clinics
Adapted from the MCOs section, Illustration, page 22.

10/30/2015
13
Oncology Practice Consolidation, Workload & Staffing
Communication Demands and EHRs Fuel Oncologists’ Workload
25
Adapted from the Oncologists section, Figure 2, page 42.
EHRs = electronic health records.
Oncology Practice Consolidation, Workload & Staffing
How OPMs Are Improving Practice Efficiency
26
OPMs section, Illustration, page 65.
Initiatives to Improve Practice Efficiency and the Oncologist-Patient Interaction
Expanding the role of APPs, nurses, pharmacists, medical assistants, and care coordinators
Hiring/adding medical scribes
Cross-training staff
Hiring more staff
Adjusting practice hours; scheduling more time for patient visits
Implementing EHRs, voice recognition software, automated check-in, and patient portals
APPs = advanced practice providers; EHRs = electronic health records.

10/30/2015
14
Palliative Care & Advance Care Planning
Oncologists Described the Timing of Palliative Care Discussions
27
Oncologists section, Illustration, page 47.
Palliative Care & Advance Care Planning
Top MCO Initiatives Regarding Palliative Care and ACP
28
MCOs section, Table 3, page 21.
ACP = advance care planning.

10/30/2015
15
Cancer Survivorship Care
Survivorship Care Plans (SCPs) Provided by Oncologists
29
Oncologists section, Figure 6, page 46.
Provision of written/printed SCP (N=200)
Cancer Survivorship Care
Resources Used to Create Survivorship Care Plans (SCPs)
30
Oncologists section, Figure 6, page 46.
ASCO = American Society of Clinical Oncologists; NCCN = National Comprehensive Cancer Network.

10/30/2015
16
Pharmacogenomics
How MCOs Manage Molecular/Biomarker Testing
New molecular/biomarker tests sometimes (45.7%) or always (9.5%) trigger a Pharmacy & Therapeutics committee and/or coverage review of cancer agents by MCOs
23.8% of MCOs are considering their review protocols for a new molecular/biomarker test
34.3% are in the early stages of strategy development to manage testing platforms and laboratories
26.7% of MCOs require a prior authorization for biomarker testing, 21.9% restrict drug coverage to favorable results, and 21.0% restrict testing coverage based on evidence
31
Pharmacogenomics
Oncologists Provide Precision Medicine
32
Oncologists section, Figure 9, page 49.
Initiatives to identify appropriate use and preferred vendors
Impact of precision medicine on cost-effectiveness of treatment decisions
Increase in referrals over the last 12 months
Whole-genomeSequencing (WGS)

10/30/2015
17
Population Health Management
Employers Offer Cancer Programs
Nearly four in 10 employers offer population health management programs
72.2% (n=57) offered a cancer program in 2014
8.9% (n=7) plan to offer a cancer program in 2015
Only one-fifth of the cancer programs include health care consumerism, quality, and cost transparency tools
Interest in encouraging cancer program participation
78.9% are more inclined to offer financial rewards than a year ago
49.1% are more inclined to offer financial penalties than a year ago
33
Population Health Management
Health Risk or Well-Being Assessments
34
Employers section, Figure 9, page 83.
Health risk or well-being assessments are part of employers’ health benefits strategy
Offer incentives to encourage voluntary assessment completion (n = 116)

10/30/2015
18
Population Health Management
Differential Insurance Premiums for Employees Who Smoke
35
Adapted from the Employers section, Figure 12, page 88.
Incentives for smoking cessationᵃ
Employment decisions made based on
smoking statusᵇ
aValue of incentive applied to cost of individual health coverage.
ᵇIn states where legal to do so.
Health Information Technology & Mobile Health
EHR Features and Capabilities
36
75.8% OPMs (n=150) reported EHRs in 2014; 27 OPMs (13.6%) expect to implement them in 2015.
Adapted from the OPMs section, Table 4, page 74.
EHRs = electronic health records.

10/30/2015
19
Health Information Technology & Mobile Health
Mobile health (mHealth)
mHealth continues to grow among stakeholders
About half of the MCOs offer mHealth apps; few (5.7%) are cancer-specific Include retail pharmacy locators, refill and appointment reminders,
physician finders/directory
Many SPs offer (46.7%) or plan to offer in 2015 (33.3%) Apps include refill and adherence reminders, proactive messages
on order status, simple assessments and education, patient and oncology specialist interaction regarding oncology therapy questions
37.0% of oncologists use mobile devices to access EHRs; 59.0% have secure email with staff and patients; 25.0% had secure texting in 2014/planned for in 2015
37
Health Information Technology & Mobile Health
Alternative Patient Visits Using Technology
Telehealth and e-communication are emerging areas to watch
Few MCOs currently pay oncologists for telehealth (9.5%) and e-communication (11.4%). Nearly one-third of MCOs are considering payment strategies for alternative visits in 2015
Three SPs provided video consults in 2014, one SP will offer them in 2015, and nine SPs are developing a telemedicine strategy
38 oncologists across all practice settings provided telehealth in 2014/plan for 2015
12.1% of OPMs reported use of telehealth in 2014 and 9.1% plan to provide it in 2015
38

10/30/2015
20
THE 2015 GENENTECH ONCOLOGY TREND REPORT
Perspectives From Managed Care, Specialty Pharmacies, Oncologists, Practice Managers, and Employers
©2015 Genentech, South San Francisco, CA February 2015