The 2015 Field Guide to Education Reform
46
2015 ED UCATIO N
-
Upload
colorado-succeeds -
Category
Documents
-
view
215 -
download
1
description
This reference tool provides a snapshot of key data-points and features of Colorado’s public education system, compiled and published by Colorado Succeeds. To download, login into Issuu and download the document directly. To download without logging in, visit this url: http://bit.ly/1CmcyBV
Transcript of The 2015 Field Guide to Education Reform

2015
What grade didyour school get? EDUCATION

2015EDUCATION
22
ABOUT COLORADO SUCCEEDS
Colorado Succeeds is a non-profit, non-partisan coalition of business leaders committed to dramatically improving the state’s education system. Our members are business executives from corporations of all sizes and sectors across Colorado, united in pursuit of immediate and continuous improvement to the state’s education system.
Our vision is that every student in Colorado graduates with the knowledge, skills, and behaviors necessary to succeed in a competitive global economy.
We work to achieve systemic change by ensuring that Colorado’s education policies and practices are created and executed according to what is best for students, which also serves the interests of our state’s workforce, economy, and quality of life. We accomplish this by:
1) advocating for policy frameworks that facilitate increased innovation;2) identifying, scaling, and replicating innovative and successful educational models;3) collaborating with diverse coalitions to reimagine education.
Through our BizCARES Network, comprised of chambers of commerce, economic development organizations, business roundtables, and industry associations, Colorado Succeeds works with business leaders representing every county of Colorado.
For more information, contact:Colorado [email protected]
Connect Online:www.coloradosucceeds.orgfacebook.com/coloradosucceedstwitter.com/cosucceedswww.linkedin.com/company/colorado-succeeds
INTRODUCTION
This handy Field Guide is designed to give you quick and easy access to key data that will support you in your work to improve Colorado’s education system.
The Governor, Legislature, and State Board of Education are unified in an ambitious commitment to graduate all kids from high school prepared for college and the workforce.
That is the right goal, but the current status and pace of progress is not on track to meet the need.
Colorado currently spends approximately 40% of its general fund budget on K-12 education, but only delivers on its promise to one out of every four students, as measured by ACT college readiness standards.
The Field Guide provides information and insights into the state’s education system to help policymakers, business and civic leaders, students, parents, and the public effectively engage in the process of improving it.
General Overview 3
Student Performance 17
Education and the Economy 31
Leadership 36

43
FIELD GUIDE TO EDUCATION IN COLORADO
Source: Colorado Department of Education (2014)
-
●
●
●
●
●
●
Who AttendsColoradoPublic Schools?
GENERAL OVERVIEW
●
●
●
●
●
●
●
●
● ●
● ●
● ●
● ● ● ● ● ● ● ● ● ● ● ● ● ●
● ●
● ●
● ●
●
●
●
●
●
●
●
●
●
●
●
●
●
●
●
●
●
●
●
●
●
●
●
●
●
● ●
● ●
● ●
● ● ● ● ● ● ● ● ● ● ● ● ● ●
● ●
● ●
●
●
●
●
●
●
●
●
●
●
●
●
●
●
●
●
●
●
●
●
●
●
●
●
●
● ●
● ● ● ● ● ● ● ● ● ● ●
● ●
●
●
●
●
●
●
●
●
●
●
●
●
●
●
●
●
●
●
●
● ●
● ● ● ● ● ● ● ● ● ● ●
● ●
●
●
●
●
●
●
●
●
●
●
●
●
EnglishLanguageLearners
42.22%
14.45%
Free& ReducedLunch
51.27%
48.75%
Total Pupil Countfor 2013-2014School Year876,999
Male449,636
Female427,363
Racial/Ethnic Group Pupil Count Percentage October 2013
Native American 6,574 0.7%
Asian 26,895 3.1%
African American 41,107 4.7%
Hispanic/Latino 287,402 32.8%
White 482,405 55%
Hawaiian/Pacific Islander 1,991 0.2%
Two or More Races 30,625 3.5%
Total 876,999 100%
Colorado Students bySpecified Type of Instruction Title 1
Who Attends ColoradoPublic Schools?
Source: Colorado Department of Education (2014)
Type of Instruction Number Percentage of Students
Gifted and Talented 66,661 7.6%
Special Education 88,190 10.1%
English LanguageLearners 126,750 14.5%
Online 16,215 1.8%
Title 1 203,270 23.2%
● ● ● ● ● ● ● ● ● ● ● ● ● ● ● ● ● ● ● ● ● ● ● ● ● ● ● ● ● ● ● ● ● ● ● ● ● ● ● ● ● ● ● ● ● ● ● ● ● ●
●
is the largest federal education funding program.
It provides funding for high
poverty schools to help students who
are behind academically or at risk of falling
behind.
●
●

65
FIELD GUIDE TO EDUCATION IN COLORADO
178 School Districts
District Size Number Number % of All(Students) of Students of Districts Students
Over 50,000 292,482 4 33.3%
25,000-49,999 200,691 6 22.9%
10,000-24,999 184,188 11 21.0%
5,000-9,999 77,528 11 8.8%
1,000-4,999 84,773 41 9.7%
500-999 15,530 21 1.8%
Under 500 21,807 92 2.5%
TOTAL 876,999 186 100%
Source: Colorado Department of Education (2013)
There are 178 traditionally defined school districts in Colorado,and an additional eight that are special local educationagencies, such as regional education service agencies(RESAs), supervisory unions, state operated agencies,federally operated agencies, and independent charterdistricts with student enrollment greaterthan zero.
Schools by Level Total Percentage
Elementary 1,058 58%
Middle/Junior High 287 16%
Senior High 479 26%
Total 1,824 100%
Source: Colorado Department of Education (2014)
Colorado Schools by Type
Colorado has seen nearly 41%
growth in student enrollment in the
past two decades.

87
FIELD GUIDE TO EDUCATION IN COLORADO
10 Largest School Districtsby Student Population
The largest 10of the 178 schooldistricts (5% oftotal districts) inColorado represent56.2% of thestate’s students.
School StudentDistrict Population
Denver County 86,043
Jefferson County R-1 85,983
Douglas County RE 1 66,230
Cherry Creek 5 54,226
Adams 12 Five Star Schools 42,230
Adams-Arapahoe 28J (Aurora) 40,877
Boulder Valley RE 2 30,546
St. Vrain Valley RE 1J 30,195
Poudre R-1 28,439
Colorado Springs 11 28,404
Total 493,173
Source: Colorado Department of Education (2013) -
State Spending on K-12Public Education
Year State education funding State average per-pupil funding
Source: State of Colorado Joint Budget Committee Appropriations Report: Fiscal Year 2013-14
Colorado StateOperating BudgetGeneral Fund Appropriations
FY 2013-14 = $8.09 BillionHealth Service/Health Care
Higher Education
General Government*
Education (K-12)
Corrections/Judicial
Other
Source: Colorado School Finance Project (2014)
38.3%
35.1%
8.1%
13.1%1.1%4.3%
2008-09 $5,349,019,294 $6,874
2009-10 $5,587,765,303 $7,078
2010-11 $5,441,412,219 $6,814
2011-12 $5,232,445,847 $6,474
2012-13 $5,297,963,176 $6,479
2013-14 $5,508,386,124 $6,652

87
FIELD GUIDE TO EDUCATION IN COLORADO
10 Largest School Districtsby Student Population
The largest 10of the 178 schooldistricts (5% oftotal districts) inColorado represent56.2% of thestate’s students.
School StudentDistrict Population
Denver County 186,043
Jefferson County R-1 85,983
Douglas County RE 1 66,230
Cherry Creek 5 54,226
Adams 12 Five Star Schools 42,230
Adams-Arapahoe 28J (Aurora) 40,877
Boulder Valley RE 2 30,546
St. Vrain Valley RE 1J 30,195
Poudre R-1 28,439
Colorado Springs 11 28,404
Total 493,173
Source: Colorado Department of Education (2013) -
State Spending on K-12Public Education
Year State education funding State average per-pupil funding
Source: State of Colorado Joint Budget Committee Appropriations Report: Fiscal Year 2013-14
Colorado StateOperating BudgetGeneral Fund Appropriations
FY 2013-14 = $8.09 BillionHealth Service/Health Care
Higher Education
General Government*
Education (K-12)
Corrections/Judicial
Other
Source: Colorado School Finance Project (2014)
38.3%
35.1%
8.1%
13.1%1.1%4.3%
2008-09 $5,349,019,294 $6,874
2009-10 $5,587,765,303 $7,078
2010-11 $5,441,412,219 $6,814
2011-12 $5,232,445,847 $6,474
2012-13 $5,297,963,176 $6,479
2013-14 $5,508,386,124 $6,652

109
FIELD GUIDE TO EDUCATION IN COLORADO
●
●
●
●
●
● ● ● ● ● ● ● ●
● ●
●
●
●
●
●
●
●
●
●
●
●
●
● ●
● ● ● ● ● ● ● ●
●
●
●
●
●
●
●
●
Preschool inColorado
Source: Colorado Department of Education (2013)
Only
70%of children inColorado have access tofull-day kindergarten
●
●
●
●
●
●
● ● ●
Kindergartenin Colorado
Source: Colorado Department of Education (2013)
Colorado does not mandate full-day kindergartenand does not pay for full-day kindergarten
Colorado requires school districts to offer kindergarten; however, the state does notmandate that they offer full-day kindergartenand only provides a little more than half ofthe funding per kindergarten student.School districts may raise additionaltaxes to pay for full-day kindergarten.
●
●
●
●
● ● ● ● ● ● ●
●
●
●
●
●
●
●
●
●
●
●
●
● ● ● ● ● ● ●
●
●
●
●
●
●
●
●
Source: Colorado School Finance Project
-
The Colorado Preschool Program is the state’s public preschool initiative, and serves children aged three-to-five years, who are vulnerable of starting grade school unprepared. Since its creation in 1988, it has served over 296,000 young children.
It is not a universal program, and the available slots are capped by the legislature.
Total enrollment in the 2012-13 school year was 19,538 students.Over 67% of those students were served by public schools.
“The goal for earlylearning is to improve the health, social-emotional,and cognitive outcomes for all children from birth through 3rd grade, so thatall children, particularly those with high needs, are on track for graduating high school college- and career-ready.” – U.S. Department of Education

1211
Colorado Charter Schools Charter schools are tuition-free, public schools that have the flexibility tobe more innovative and are held accountable for student achievement.
In 2013-14, there were 96,000 students attending 200 charter schoolcampuses in Colorado. This represents 11% of total K-12 public schoolenrollment in the state.
55.6%
30.5%
6.2%
3.7%
0.7%
0.2%
White
Hispanic/Latino
African American
Asian
Native American
· Native Hawaiian
3.2%
32.2%
0 10 20 30 40 50
· Two or more races
4.5%
3.1%
0.8%
60
0.2%
3.3%
65
Population Comparison (2012-2013) Colorado Charter & Traditional Public School Demographics:
55.9%
Charter Schools Traditional Public Schools
Source: Colorado League of Charter Schools
Charter School InstituteThe Colorado Charter School Institute (CSI) is the state's only non-district charter school authorizer. Currently, the Institute authorizes 34 Colorado charter schools across the state.
In 2004, House Bill 04-1362 created CSI and granted it the authority to approve or deny charter school applications, monitor Institute charter school operations, and assist in the conversion of certain district charter schools to an Institute charter school.
CSI may authorize charter schools in districts that have not retained exclusive authority to authorize charter schools within their district. It acceptsapplications from those interested in starting a charter school, as well as those interested in transferring, expanding, or replicating an existing charter school.
Students Charter School Statewide Demographics Institute Average
Students Identify as Minority 50% 44%
Students Qualify for Free & Reduced Lunch 47% 40%
Students are English Language Learners 25% 14%
GovernanceAs an independent state agency, a nine-member Board of Directors governs CSI; seven appointed by the Governor and two by the Commissioner of Education. Source: Colorado Department of Education (2014); Charter School Institute (2014)
FIELD GUIDE TO EDUCATION IN COLORADO

1413
FIELD GUIDE TO EDUCATION IN COLORADO
Comparing Student ProficiencyUnder the Former State Test (CSAP and TCAP)
Source: Colorado Department of Education (2014); National Center for Education Statistics (2013)Note: Proficiency rate for state test is the sum of the proficient and advanced scores.
Student Achievement in4th and 8th Grade Math
State Test
NAEP72%
50% 52%
4th Grade Math 8th Grade Math
42%
Student Achievement in4th and 8th Grade Reading
State Test
NAEP67%
40%
66%
4th Grade Reading 8th Grade Reading
40%
AssessmentColorado AcademicStandards Research shows that by 2020, employers will hire candidates based on their ability to:
• Convey complex information clearly
• Draw conclusions
• Make recommendations based on facts and reasoning
The Colorado Academic Standards were designed to ensure students learn how to think critically, reason through problems, make informed decisions, and effectively communicate.
State standards for student learning define what students should know and be able to do at the end of a grade level or grade span. Standards improve student outcomes by setting a bar for student performance, defining the floor—but not the ceiling—of student learning.
Standards for student learning are not new in Colorado.
1993House Bill 93-1313
initiated standards-based
education for all of
Colorado.
1996The state legislature
established the Colorado
student assessment
program in 1996.
2008-2009The state underwent a
public engagement
process to review and
revise the standards.
2009The Colorado State Board
of Education approved
updated standards in all
10 content areas,
creating the Colorado
Academic Standards,
including the Common
Core State Standards in
Math and English
Language Arts.
Source: Future Forward Colorado (2014)
To ensure that students are meeting the standards and learning for postsecondary and workforce success, Colorado joined the Partnership for Assessment of Readiness for College and Careers (PARCC), and adapted the test to create the Colorado Measures of Academic Success, or CMAS.
The CMAS measures student mastery of the new, more rigorous standards. CMAS will be administered for the first time in Math and English during the 2014-2015 school year.
• A Colorado representatives serves on the governing board of PARCC • There were 21 Colorado educators, 34 Colorado Department of Education officials, and 19 Colorado school administrators involved in the development of PARCC tests to ensure it would meet the needs of Colorado’s students • Districts maintain autonomy to build curriculum • Teachers maintain ability to design instruction
In the past, the rigor and reliability of Colorado’s standardized tests did not meet international standards, but the National Assessment of Educational Progress (NAEP) test did. This is one reason Colorado decided to join a consortium of other states: to create a more sophisticated and comparable state assessment.

FIELD GUIDE TO EDUCATION IN COLORADO
15 16
Policy Progress & AccomplishmentsMany consider Colorado a national leader and model for educationreform based on the major policies that have been implemented over thelast few years, most notably:
YEAR POLICY DESCRIPTION
.
Source: Colorado Department of Education
YEAR POLICY DESCRIPTION
2008 Senate Bill Colorado’s Achievement Plan for Kids 08-212 (CAP4K), created focused, coherent, and rigorous academic standards (preschool through postsecondary); informative assessments aligned to the new standards; school readiness definition, assessments, and plans; and a common definition of postsecondary and workforce readiness.
2008 Senate Bill The Innovation Schools Act created a process 08-130 for a public school or group of public schools to submit an innovation plan to its school district board of education to allow them to implement innovations within the school or group of schools, such as: delivery of educational services, personnel administration and decision-making, and budgeting.
2009 Senate Bill School and District Accountability created 09-163 shared accountability measures for districts and schools; placed significant value on student academic growth and postsecondary readiness; developed a cycle of support and intervention for struggling schools and districts, and emphasized school and district improvement efforts.
2010 Senate Bill Teacher PREP linked the effectiveness of 10-036 teacher preparation programs to the academic outcomes produced by the teachers who attended those preparation programs.
2010 Senate Bill The Great Teachers and Leaders Act ensured 10-191 that there are annual performance evaluations for all educators based on statewide quality standards; evaluations are focused on meaningful feedback and continuous professional growth; non-probationary status is earned and retained based on demonstrated effectiveness; and that school leaders are empowered to make staffing decisions for their building.
2010 State Board Colorado Academic Standards (CAS) were of Education approved by the Colorado State Board of Adopted Education to update standards in all 10 content Colorado areas and incorporate the Common Core State Academic Standards in Math and English Language Arts. Standards The standards set rigorous teaching and learning objectives, but specific curriculum and pedagogy remain the right and responsibility of local districts, schools, and educators.
2012 House Bill Colorado READ Act focuses on early literacy 12-1238 development, assessment to identify struggling readers and diagnose the root cause of their reading difficulties, parent engagement in creating a customized READ plan—including research-proven interventions to bring their child up to grade level—and shared accountability for literacy growth and achievement.
2013 House Bill The Student Success Act established school-level 13-1292 financial reporting, providing school leaders a tool to measure return on investment, and allows taxpayers to evaluate how their money is being spent. The bill tripled charter school facilities funding and dedicated $18 million annually to fund the early literacy reforms in the READ Act.
17 18
FIELD GUIDE TO EDUCATION IN COLORADO
● ●
● ●
● ●
● ●
● ●
● ●
● ●
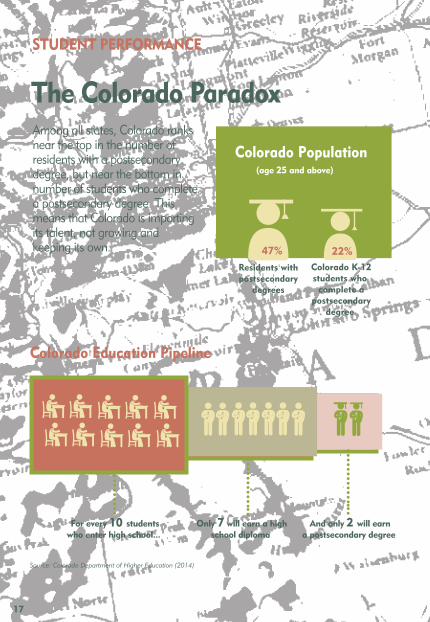
STUDENT PERFORMANCE
The Colorado Paradox
Colorado Population(age 25 and above)
Residents withpostsecondary
degrees
Colorado K-12students who
complete apostsecondary
degree
22%
Colorado Education Pipeline
● ●
● ●
● ●
● ●
● ●
● ●
●●
● ●
● ●
● ●
● ●
● ●
●
47%
For every 10 studentswho enter high school...
Only 7 will earn a highschool diploma
And only 2 will earna postsecondary degree
Source: Colorado Department of Higher Education (2014)
Elementary & Middle SchoolStudents Fall Behind Early
●
●
●
●
● ●
● ● ● ● ● ● ● ●
● ●
●
●
●
●
●
●
●
●
●
●
●
●
●
●
● ●
● ● ● ● ● ● ● ● ●
●
●
●
●
●
●
●
●
●
●
Only 50% or lessof Colorado’s
elementary and middleSchool students perform
at grade level inReading and Math.
2007 2009 2011 2013
4th Grade Reading Proficiency NAEP 36% 40% 39% 41%
4th Grade Math Proficiency NAEP 41% 45% 47% 50%
8th Grade Reading Proficiency NAEP 35% 32% 40% 40%
8th Grade Math Proficiency NAEP 37% 40% 43% 42%
Source: Colorado Department of Education (2013)
Among all states, Colorado ranks near the top in the number of residents with a postsecondary degree, but near the bottom in number of students who complete a postsecondary degree. This means that Colorado is importing its talent, not growing and keeping its own.

17 18
FIELD GUIDE TO EDUCATION IN COLORADO
● ●
● ●
● ●
● ●
● ●
● ●
● ●
STUDENT PERFORMANCE
The Colorado Paradox
Colorado Population(age 25 and above)
Residents withpostsecondary
degrees
Colorado K-12students who
complete apostsecondary
degree
22%
Colorado Education Pipeline
● ●
● ●
● ●
● ●
● ●
● ●
●●
● ●
● ●
● ●
● ●
● ●
●
47%
For every 10 studentswho enter high school...
Only 7 will earn a highschool diploma
And only 2 will earna postsecondary degree
Source: Colorado Department of Higher Education (2014)
Elementary & Middle SchoolStudents Fall Behind Early
●
●
●
●
● ●
● ● ● ● ● ● ● ●
● ●
●
●
●
●
●
●
●
●
●
●
●
●
●
●
● ●
● ● ● ● ● ● ● ● ●
●
●
●
●
●
●
●
●
●
●
Only 50% or lessof Colorado’s
elementary and middleSchool students perform
at grade level inReading and Math.
2007 2009 2011 2013
4th Grade Reading Proficiency NAEP 36% 40% 39% 41%
4th Grade Math Proficiency NAEP 41% 45% 47% 50%
8th Grade Reading Proficiency NAEP 35% 32% 40% 40%
8th Grade Math Proficiency NAEP 37% 40% 43% 42%
Source: Colorado Department of Education (2013)
Among all states, Colorado ranks near the top in the number of residents with a postsecondary degree, but near the bottom in number of students who complete a postsecondary degree. This means that Colorado is importing its talent, not growing and keeping its own.

FIELD GUIDE TO EDUCATION IN COLORADO
2019
Annual Rate of Student Improvement/Domestic Comparison
Source: Harvard’s Program on Education Policy and Governance & EducationNext Report, Achievement Growth: International and U.S. State Trends in Student Performance
MarylandFlorida
DelawareMassachusetts
LouisianaSouth Carolina
New JerseyKentuckyArkansas
VirginiaHawaii
North CarolinaMississippi
GeorgiaOhio
PennsylvaniaCalifornia
TexasNew YorkColoradoAlabama
TennesseeNew Hampshire
WyomingIdaho
MinnesotaMissouri
Rhode IslandIndiana
ConnecticutArizona
New MexicoUtah
North DakotaMichigan
West VirginiaNebraskaWisconsinOklahoma
MaineIowa
Annual test score change as % of standard deviation0 0.5 1 1.5 2 2.5 3 3.5
Annual Rate of Student Improvement/International Comparison
In student
growth, the U.S.
is in the middleof the packinternationally.
Source: Harvard’s Program on Education Policy and Governance & EducationNext Report, Achievement Growth: International and U.S. State Trends in Student Performance
LatviaChileBrazil
PortugalHong Kong
GermanyPoland
LiechtensteinSlovenia
ColombiaLithuania
United KingdomSingapore
SwitzerlandGreeceMexico
IsraelFinland
ItalyNew Zealand
DenmarkKorea Rep.
HungaryIran
United StatesTaiwan*BelgiumCanadaCyprus
AustraliaJordan
Russian Fed.Indonesia
AustriaSpain
IcelandJapan
NetherlandsTunisia
Argentina
(*Chinese Taipei)
Annual test score change –as % of standard deviation0 1 2 3 4 5
In student
growth, Colorado
is in the middleof the packdomestically.

2221
2015
FIELD GUIDE TO EDUCATION IN COLORADO
Demographics and theAchievement Gap
Four-year high schoolgraduation:
White African American Hispanic Students Students Students
83% 70% 65%
Meets at least three outof four ACT college
readiness benchmarks:
White African American Hispanic Students Students Students
48% 14% 18%
Source: Colorado Department of Education, ACT, Inc. (2014)
Colorado’s NationalAchievement Gap Rankings Income and ethnic gaps in student performance are alarming. Colorado is in poor standing compared to the other states.
In Colorado, academic performance varies widely by demographic subgroup, and this results in a significant achievement gap. This is most pronounced for African American and Hispanic students. These students’ National Assessment of Educational Progress (NAEP) scores, high school graduation, and college completion rates are dramatically lower than those of their white peers.
Higher Education Attainment Gap
Colorado has the one of the largest postsecondary degree attainment gaps in the nation.
College Degree Attainment Rate Among Colorado Adults (ages 25-64)
White 53.5%
African American 33.9%
Hispanic/Latino 19.0%
Asian 54.3%
Native American 26.1%
Source: U.S. Census Bureau (2012)
Source: National Assessment of Educational Progress (2013)
4th 4th 8th 8thGAP Grade Grade Grade Grade Math Reading Math Reading
LowIncome/ 13th 10th 6th 6thNon-Low LARGEST LARGEST LARGEST LARGESTIncome GAP GAP GAP GAP
African 8th 3rd 4th 2ndAmerican/ LARGEST LARGEST LARGEST LARGESTWhite GAP GAP GAP GAP
Hispanic or 9th 6th 9th 10thLatino/ LARGEST LARGEST LARGEST LARGEST
White GAP GAP GAP GAP

2015
FIELD GUIDE TO EDUCATION IN COLORADO
2423
Nation’s 2nd LargestAchievement Gap
Colorado High SchoolGraduation RatesOnly 76.9% of Colorado students graduated from high school in four yearsin 2012-2013.
Four-YearColorado Graduation Rates
76.9% 61.4% 85.9% 69.5% 65.4% 82.8% 58.5% 63.7%All Students Native Asian African Hispanic/ White ELL Economically American American Latino Students Disadvantaged
●
●
●
●
● ●
● ● ● ● ● ● ● ●
● ●
●
●
●
●
●
●
●
●
●
●
●
●
●
●
●
● ●
● ● ● ● ● ● ● ●
●
●
●
●
●
●
●
●
●
●
For the first time in American history,students today are less likely to graduatefrom high school than their parents.The U.S. is the only industrialized countryin the world where this is true.
Source: Colorado Department of Education (2014)
8th Grade Reading Gap between African American and White Students
Source: National Center for Education Statistics (2013)
West VirginiaHawaii
North DakotaVermont
TennesseeFloridaAlaska
DelawareWashington
GeorgiaNorth Carolina
OklahomaLouisianaMaryland
IowaNew Jersey
NebraskaSouth Carolina
ArizonaNew York
NevadaIndiana
MichiganArkansasAlabama
Rhode IslandKentucky
VirginiaConnecticut
TexasNew Mexico
OhioMississippi
MissouriCalifornia
KansasMinnesota
PennsylvaniaIllinois
MassachusettsColorado
Wisconsin
Achievement gap (grade levels)0 1 2 3 4 5
According to the U.SDepartment of
Education
●
● ●
●
● ●
● ● ● ● ● ● ● ● ●
●
● ●
●
●
●
●
●
●
●
●
●
●
● ●
● ● ● ● ● ● ● ● ●
●
● ●
●
●
●
●
●
●
Colorado’s
African American
students are over
three grade levels
behind.

2015
FIELD GUIDE TO EDUCATION IN COLORADO
2423
Nation’s 2nd LargestAchievement Gap
Colorado High SchoolGraduation RatesOnly 76.9% of Colorado students graduated from high school in four yearsin 2012-2013.
Four-YearColorado Graduation Rates
76.9% 61.4% 85.9% 69.5% 65.4% 82.8% 58.5% 63.7%All Students Native Asian African Hispanic/ White ELL Economically American American Latino Students Disadvantaged
●
●
●
●
● ●
● ● ● ● ● ● ● ●
● ●
●
●
●
●
●
●
●
●
●
●
●
●
●
●
●
● ●
● ● ● ● ● ● ● ●
●
●
●
●
●
●
●
●
●
●
For the first time in American history,students today are less likely to graduatefrom high school than their parents.The U.S. is the only industrialized countryin the world where this is true.
Source: Colorado Department of Education (2014)
8th Grade Reading Gap between African American and White Students
Source: National Center for Education Statistics (2013)
West VirginiaHawaii
North DakotaVermont
TennesseeFloridaAlaska
DelawareWashington
GeorgiaNorth Carolina
OklahomaLouisianaMaryland
IowaNew Jersey
NebraskaSouth Carolina
ArizonaNew York
NevadaIndiana
MichiganArkansasAlabama
Rhode IslandKentucky
VirginiaConnecticut
TexasNew Mexico
OhioMississippi
MissouriCalifornia
KansasMinnesota
PennsylvaniaIllinois
MassachusettsColorado
Wisconsin
Achievement gap (grade levels)0 1 2 3 4 5
According to the U.SDepartment of
Education
●
●
●
●
● ●
● ● ● ● ● ● ● ● ●
●
● ●
●
●
●
●
●
●
●
●
●
●
● ●
● ● ● ● ● ● ● ● ●
●
● ●
●
●
●
●
●
●
Colorado’s
African American
students are over
three grade levels
behind.

2625
FIELD GUIDE TO EDUCATION IN COLORADO
Sour
ce:
Col
orad
o D
epar
tmen
t of
Edu
catio
n (2
013)
Colorado’s StudentPopulation Changes andthe Achievement Gap
,
.
8.5%
-4.6%
50.0%
45.0%
40.0%
35.0%
30.0%
25.0%
20.0%
15.0%
10.0%
5.0%
0.0%
-5.0%
-10.0%
-15.0%
-20.0%
-25.0%
-30.0%
15.75%
All Native Asian African Hispanic/ White Students American American Latino
-6.70%
-4.40%
-1.1%-4.20%
-6.76%-3.37% -4.70%
-1.36%
14.17%
Percentage of Colorado High School StudentsMeeting ACT College ReadinessBenchmarks by Subject
College Readiness
Science All Subjects
Source: ACT, Inc. (2014)
70%
60%
50%
40%
30%
20%
10%
0%English Reading Math
62%
42%39%
36%
25%
Colorado’sstate goal:
“to graduate allstudents
from high schoolprepared
for college."
% ChangeGraduationRate
% ChangeStudentPopulation
49.71%
-29.92%
Many Colorado students are not properly prepared when they leave high school and enter college. Less than 50% of high school graduates are prepared for college level reading, math, and science. Only 25% score at the college-ready level in all four core subjects, according to their ACT performance.
Over the last 10 years, the population of Hispanic students in Colorado has increased by 50%, while their graduation rate has decreased by 4%.
●
●
●
●
●
● ●
● ● ● ● ● ● ● ●
●
●
●
●
●
●
●
●
●
●
●
●
●
●
● ●
● ● ● ● ● ● ● ●
●
●
●
●
●
●
●
●
●

2827
FIELD GUIDE TO EDUCATION IN COLORADO
Math Writing Reading
47%
31%
Colorado Department of Higher Education (2013); Legislative Report on remedial education (2013)
21%
45.0%
40.0%
35.0%
30.0%
25.0%
20.0%
15.0%
10.0%
5.0%
0.0%
College Remediationby Subject
Student Persistencein Colorado
100
76
45
22
Colorado’s Annual Average Pipeline Performance
0 20 40 60 80 100
Begin 9th Grade
Graduate HighSchool in
Four Years
Enroll in College/Postsecondary
Program
Earn aPostsecondary
Degree
Source: Colorado Department of Higher Education (2014)
50.0%
Nearly HALF of Colorado’s high
school graduates need remediation
in math.
Less than a quarter of Colorado students persist through collegeto earn an on-time degree.
●
●
●
●
●
● ●
● ● ● ● ● ● ● ●
●
●
●
●
●
●
●
●
●
●
●
●
●
●
● ●
● ● ● ● ● ● ● ●
●
●
●
●
●
●
●
●
●

3029
FIELD GUIDE TO EDUCATION IN COLORADO
Success StoriesSchools with at least 50% low-incomestudents who earned an “A” or “B”from ColoradoSchoolGrades.com. These elementary schools are closing Colorado’s achievement gap.
.
Elementary Schools
AAA
AThese middle and high schools are closing Colorado’sachievement gap.
Middle & High Schools
Source: Colorado School Grades (2014)
Source: Colorado School Grades (2014)
School District
Chipeta Elementary School Mesa County Valley 51
Fairview Elementary School Westminster 50 (Adams 50)
Harris Bilingual Elementary School Poudre R-1
KIPP Montbello College Prep Denver County 1
KIPP Sunshine Peak Academy Denver County 1
McKinley-Thatcher Elementary School Denver County 1
McMeen Elementary School Denver County 1
Montview Math & Health Sciences Adams-Arapahoe 28JElementary School (Aurora Public Schools)
STEM Launch Adams 12 Five Star Schools
Sunset Ridge Elementary School Westminster 50 (Adams 50)
Middle School District
Cotopaxi Junior-Senior High School Cotopaxi RE-3
Del Norte Middle School Del Norte C-7
DSST: Cole Middle School Denver County 1
DSST: College View Middle School Denver County 1
DSST: Green Valley Ranch Middle School Denver County 1
KIPP Sunshine Peak Academy Denver County 1
Strive Prep: Green Valley Ranch Denver County 1
Strive Prep: Sunnyside Denver County 1
Strive Prep: Westwood Denver County 1
Victory Preparatory Academy Middle School Charter School Institute
High School District
Aurora West College Preparatory Academy Adams-Arapahoe 28J (Aurora Public Schools)
CEC Middle College of Denver Denver County 1
DSST: Green Valley Ranch High School Denver County 1
Harrison High School Harrison 2
Lyons Middle/Senior High School St. Vrain Valley RE1J
York International Mapleton 1

3231
FIELD GUIDE TO EDUCATION IN COLORADO
Achievement Gap=Earning Gap
0
20
40
60
80
100
Colorado Graduation Rate by Race/Ethnicity
All White Asian African Hispanic NativeStudents American Latino American
82.8%
69.5%
85.9%
65.4%76.9%
61.4%
0
Colorado Income Disparity Across Race/Ethnicity
All White Asian African Hispanic NativeStudents American American
$10,000
$20,000
$30,000
$40,000
$50,000
$60,000
$70,000
Med
ian
hous
ehol
d in
com
e
$59,255$63,755
$39,941 $37,289$39,223
$56,765
Source: United States Census Bureau (2012)
EDUCATION AND THE ECONOMY
Economic Impact of Dropouts
$101 million in annual earnings $80 million
in annual spending
$12 million in auto sales
●
●
●
●
●
●
●
High school graduates are not the only Coloradans who benefit from a diploma. If Colorado raised the graduation rate to 90%, the state’s economy would see the following increases:
Source: Alliance for Excellent Education (2013)
Source: Colorado Department of Education (2013)
●
●
●
●
●
●
●
$282 million in home sales
$136 million in gross state product
$4.5 million in state/local tax revenues
●
●
●
●
●
●
●
●
●
●
●
●
●
●
●
●
●
●
●
●
●
●
●
●
●
●
●
●

3433
FIELD GUIDE TO EDUCATION IN COLORADO
●
●
●
●
●
● ●
● ● ● ● ● ● ● ●
●
●
●
●
●
●
●
●
●
●
●
●
●
●
● ●
● ● ● ● ● ● ● ●
●
●
●
●
●
●
●
●
Workforce Development:Fastest Growing Industries/Jobs
Education Supply and Demand
Ranking Industry New jobs in 2015
1 Professional and Business Services 12,800
2 Leisure and Hospitality 11,200
3 Education and Health Services 9,300
4 Trade, Transportation, and Utilities 9,100
5 Construction 6,000
6 Government 4,500
7 Financial Activities 2,700
8 Natural Resources and Mining 2,300
9 Manufacturing 2,200
10 Other service industries 1,300
22% Colorado is only producing 22 postsecondary degree holders for every 100 students who enterhigh school.
● ● ● ● ● ● ●
●
●
●
●
●
●
●
●
● ●
● ● ● ● ● ● ● ●
●
●
●
●
●
●
●
●
●
●
●
●
●
●
● ●
● ● ● ● ● ● ● ●
●
●
●
●
●
●
●
●
74% ● ● ● ● ● ● ●
●
●
●
By 2020, 74% of jobs in Coloradowill require a postsecondary education.
●●
●
●
●
●
●
● ●
● ● ● ● ● ● ● ●
●
●
●
●
●
●
●
●
●
●
●
●
●
●
● ●
● ● ● ● ● ● ● ●
●
●
●
●
●
●
●
●
50%
● ● ● ● ● ● ●
●
●
●
●
This means employers will have to import up to 50% of qualified workers or these jobs will go unfilled.
Source: Colorado Department of Higher Education (2014)
Source: 2015 Colorado Business Economic Outlook

3635
FIELD GUIDE TO EDUCATION IN COLORADO
Leadership in Educationfor Colorado
Source: Colorado Department of Education
LEADERSHIP
State Board of Education
Valentina "Val" Flores (D) 1st Congressional District Denver
Angelika Schroeder (D) 2nd Congressional District Boulder
Marcia Neal (R) 3rd Congressional District Grand Junction
Pam Mazanec (R) 4th Congressional District Fort Collins
Steve Durham (R) 5th Congressional District Colorado Springs
Debora Scheffel (R) 6th Congressional District Parker
Jane Goff (D) 7th Congressional District Arvada
Robert Hammond Commissioner of Education
Carey Taylor Markel Director of State Board Relations
Workforce DevelopmentUnless the state doubles its current postsecondary attainment rate, employers will have to recruit at least 50% of its high-skills workers from outside of Colorado.
STEMOver the next decade, STEM (Science, Technology, Engineering, and Math) occupations in Colorado are expected to grow by more than the national average, but the state’s students are not on track to meet this workforce demand.
Career Technical EducationCareer and Technical Education (CTE) is expanding in Colorado. Enrollment in high school level CTE has increased 13% over the last five years. The majority of CTE courses are offered at the middle and secondary levels.
50% $19million
150 1,200
Source: Colorado Department of Higher Education (2014), Colorado Department of Education (2014), Colorado Education Initiative (2014)
of STEM jobs in the state are projected to go unfilled by
Colorado workers
in annual costs incurred by Coloradoemployers to import talent to fill
unmet demand
of secondary students are
enrolled in some form of
CTE studies
school districts offer CTE programs
school-basedCTE programs
in Colorado
45%

3837
FIELD GUIDE TO EDUCATION IN COLORADO
Elected State Senators
Office Senate Party Home City Office Senate Party Home City
Education Committee Member
SD 1 Sen. Jerry Sonnenberg R Sterling
SD 2 Sen. Kevin Grantham R Canon City
SD 3 Sen. Leroy Garcia Jr. D Pueblo
SD 4 Majority Leader Mark Scheffel R Parker
SD 5 Sen. Kerry Donovan D Vail
SD 6 President Pro Tempore Ellen Roberts R Durango
SD 7 Sen. Ray Scott R Grand Junction
SD 8 Majority Caucus Whip Randy Baumgardner R Cowdrey
SD 9 Sen. Kent Lambert R Colorado Springs
SD 10 Sen. Owen Hill R Colorado Springs
SD 11 Sen. Michael Merrifield D Colorado Springs
SD 12 President Bill Cadman R Colorado Springs
SD 13 Sen. John Cooke R Kersey
SD 14 Sen. John Kefalas D Fort Collins
SD 15 Assistant Majority Leader Kevin Lundberg R Berthoud
SD 16 Sen. Tim Neville R Littleton
SD 17 Minority Whip Matt Jones D Louisville
SD 18 Assistant Minority Leader Rollie Heath D Boulder
SD 19 Sen. Laura Woods R Arvada
SD 20 Sen. Cheri Jahn D Wheat Ridge
SD 21 Minority Caucus Chair Jessie Ulibarri D Westminster
SD 22 Sen. Andy Kerr D Lakewood
SD 23 Majority Caucus Chair Vicki Marble R Fort Collins
SD 24 Sen. Beth Martinez Humenik R Thornton
SD 25 Sen. Mary Hodge D Brighton
SD 26 Sen. Linda Newell D Littleton
SD 27 Sen. David Balmer R Centennial
SD 28 Sen. Nancy Todd D Aurora
SD 29 Minority Leader Morgan Carroll D Aurora
SD 30 Sen. Chris Holbert R Parker
SD 31 Sen. Pat Steadman D Denver
SD 32 Sen. Irene Aguilar D Denver
SD 33 Sen. Michael Johnston D Denver
SD 34 Sen. Lucia Guzman D Denver
SD 35 Sen. Larry Crowder R Alamosa
(as of January 2015)

4039
FIELD GUIDE TO EDUCATION IN COLORADO
Elected State Representatives
HD 1 Rep. Susan Lontine D Denver
HD 2 Rep. Alec Garnett D Denver
HD 3 Rep. Daniel Kagan D Englewood
HD 4 Speaker Pro Tempore Dan Pabon D Denver
HD 5 Rep. Crisanta Duran D Denver
HD 6 Rep. Lois Court D Denver
HD 7 Majority Caucus Chair Angela Williams D Denver
HD 8 Rep. Beth McCann D Denver
HD 9 Rep. Paul Rosenthal D Denver
HD 10 Speaker Dickey Lee Hullinghorst D Boulder
HD 11 Rep. Jonathan Singer D Longmont
HD 12 Rep. Mike Foote D Lafayette
HD 13 Rep. KC Becker D Boulder
HD 14 Rep. Dan Nordberg R Colorado Springs
HD 15 Rep. Gordon Klingenschmitt R Colorado Springs
HD 16 Rep. Janak Joshi R Colorado Springs
HD 17 Rep. Kit Roupe R Colorado Springs
Office House Party Home City Office House Party Home City
Education Committee Member (as of January 2015)
HD 34 Rep. Steve Lebsock D Thornton
HD 35 Rep. Faith Winter D Westminster
HD 36 Majority Whip Su Ryden D Aurora
HD 37 Rep. Jack Tate R Centennial
HD 38 Rep. Kathleen Conti R Littleton
HD 39 Minority Whip Polly Lawrence R Littleton
HD 40 Rep. John Buckner D Aurora
HD 41 Rep. Jovan Melton D Aurora
HD 42 Rep. Rhonda Fields D Aurora
HD 43 Rep. Kevin Van Winkle R Highlands Ranch
HD 44 Rep. Kim Ransom R Acres Green
HD 45 Rep. Patrick Neville R Castle Rock
HD 46 Rep. Daneya Esgar D Pueblo
HD 47 Rep. Clarice Navarro R Pueblo
HD 48 Rep. Steve Humphrey R Severance
HD 49 Rep. Perry Buck R Windsor
HD 50 Rep. Dave Young D Greeley
HD 51 Minority Leader Brian DelGrosso R Loveland
HD 52 Rep. Joann Ginal D Fort Collins
HD 53 Rep. Jeni Arndt D Fort Collins
HD 54 Rep. Yeulin Willett R Grand Junction
HD 55 Rep. Dan Thurlow R Grand Junction
HD 56 Rep. Kevin Priola R Henderson
HD 57 Rep. Bob Rankin R Carbondale
HD 58 Rep. Don Coram R Montrose
HD 59 Rep. J. Paul Brown R Ignacio
HD 60 Rep. Jim Wilson R Salida
HD 61 Rep. Millie Hamner D Dillon
HD 62 Rep. Ed Vigil D Fort Garland
HD 63 Rep. Lori Saine R Dacono
HD 64 Rep. Tim Dore R Elizabeth
HD 65 Rep. Jon Becker R Fort Morgan
HD 18 Rep. Pete Lee D Colorado Springs
HD 19 Rep. Paul Lundeen R Colorado Springs
HD 20 Rep. Terri Carver R Colorado Springs
HD 21 Minority Caucus Chair Lois Landgraf R Fountain
HD 22 Rep. Justin Everett R Littleton
HD 23 Rep. Max Tyler D Lakewood
HD 24 Rep. Jessie Danielson D Wheat Ridge
HD 25 Rep. Jon Keyser R Morrison
HD 26 Rep. Diane Mitsch Bush D Steamboat Springs
HD 27 Assistant Minority Leader Libby Szabo R Arvada
HD 28 Rep. Brittany Pettersen D Lakewood
HD 29 Rep. Tracy Kraft-Tharp D Arvada
HD 30 Rep. JoAnn Windholz R Commerce City
HD 31 Rep. Joe Salazar D Thornton
HD 32 Assistant Majority Leader Dominick Moreno D Commerce City
HD 33 Rep. Dianne Primavera D Broomfield

4241
FIELD GUIDE TO EDUCATION IN COLORADO
HD 1 Rep. Susan Lontine D Denver
HD 2 Rep. Alec Garnett D Denver
HD 3 Rep. Daniel Kagan D Englewood
HD 4 Speaker Pro Tempore Dan Pabon D Denver
HD 5 Rep. Crisanta Duran D Denver
HD 6 Rep. Lois Court D Denver
HD 7 Majority Caucus Chair Angela Williams D Denver
HD 8 Rep. Beth McCann D Denver
HD 9 Rep. Paul Rosenthal D Denver
HD 10 Speaker Dickey Lee Hullinghorst D Boulder
HD 11 Rep. Jonathan Singer D Longmont
HD 12 Rep. Mike Foote D Lafayette
HD 13 Rep. KC Becker D Boulder
HD 14 Rep. Dan Nordberg R Colorado Springs
HD 15 Rep. Gordon Klingenschmitt R Colorado Springs
HD 16 Rep. Janak Joshi R Colorado Springs
HD 17 Rep. Kit Roupe R Colorado Springs
Elected State RepresentativesOffice House Party Home City Office House Party Home City
Education Committee Member (as of January 2015)
HD 34 Rep. Steve Lebsock D Thornton
HD 35 Rep. Faith Winter D Westminster
HD 36 Majority Whip Su Ryden D Aurora
HD 37 Rep. Jack Tate R Centennial
HD 38 Rep. Kathleen Conti R Littleton
HD 39 Minority Whip Polly Lawrence R Littleton
HD 40 Rep. John Buckner D Aurora
HD 41 Rep. Jovan Melton D Aurora
HD 42 Rep. Rhonda Fields D Aurora
HD 43 Rep. Kevin Van Winkle R Highlands Ranch
HD 44 Rep. Kim Ransom R Acres Green
HD 45 Rep. Patrick Neville R Castle Rock
HD 46 Rep. Daneya Esgar D Pueblo
HD 47 Rep. Clarice Navarro R Pueblo
HD 48 Rep. Steve Humphrey R Severance
HD 49 Rep. Perry Buck R Windsor
HD 50 Rep. Dave Young D Greeley
HD 51 Minority Leader Brian DelGrosso R Loveland
HD 52 Rep. Joann Ginal D Fort Collins
HD 53 Rep. Jeni Arndt D Fort Collins
HD 54 Rep. Yeulin Willett R Grand Junction
HD 55 Rep. Dan Thurlow R Grand Junction
HD 56 Rep. Kevin Priola R Henderson
HD 57 Rep. Bob Rankin R Carbondale
HD 58 Rep. Don Coram R Montrose
HD 59 Rep. J. Paul Brown R Ignacio
HD 60 Rep. Jim Wilson R Salida
HD 61 Rep. Millie Hamner D Dillon
HD 62 Rep. Ed Vigil D Fort Garland
HD 63 Rep. Lori Saine R Dacono
HD 64 Rep. Tim Dore R Elizabeth
HD 65 Rep. Jon Becker R Fort Morgan
HD 18 Rep. Pete Lee D Colorado Springs
HD 19 Rep. Paul Lundeen R Colorado Springs
HD 20 Rep. Terri Carver R Colorado Springs
HD 21 Minority Caucus Chair Lois Landgraf R Fountain
HD 22 Rep. Justin Everett R Littleton
HD 23 Rep. Max Tyler D Lakewood
HD 24 Rep. Jessie Danielson D Wheat Ridge
HD 25 Rep. Jon Keyser R Morrison
HD 26 Rep. Diane Mitsch Bush D Steamboat Springs
HD 27 Assistant Minority Leader Libby Szabo R Arvada
HD 28 Rep. Brittany Pettersen D Lakewood
HD 29 Rep. Tracy Kraft-Tharp D Arvada
HD 30 Rep. JoAnn Windholz R Commerce City
HD 31 Rep. Joe Salazar D Thornton
HD 32 Assistant Majority Leader Dominick Moreno D Commerce City
HD 33 Rep. Dianne Primavera D Broomfield

FIELD GUIDE TO EDUCATION IN COLORADO
4443
Franklin Gothic Med
Colorado Succeeds Board of Directors
● ● ● ● ● ● ● ● ● ● ● ● ● ● ● ● ● ● ● ● ● ● ● ● ● ● ● ● ● ● ● ● ● ● ● ● ●● ● ● ● ● ● ● ● ● ● ● ● ● ● ● ● ● ● ● ● ●
Colorado Succeeds Board of Trustees
●
●
●
●
●
●
●
●
●
●
●
●
●
●
●
●
●
●
●
●
●
●
●
●
●
●
●
●
●
●
●
●
●
●
●
●
●
●
●
●
●
●
●
●
●
●
●
●
●
●
●
●
●
●
●
●
●
●
●
●
●
●
●
●
●
●
●
●
●
●
●
●
●
●
●
●
●
●
●
●
●
●
●
●
●
●
●
●
●
●
●
●
●
●
●
●
●
●
●
●
●
●
●
●
●
●
●
●
●
●
●
●
●
●
●
●
●
●
●
●
●
●
●
●
●
●
●
●
●
●
●
●
●
●
●
●
●
●
●
●
●
●
Colorado Succeeds Board of Advisors
●
●
●
●
●
●
●
●
●
●
●
●
●
●
●
●
●
●
●
●
●
●
●
●
●
●
●
●
●
●
●
●
●
●
●
●
●
●
●
●●
●
●
●
●
●
●
●
●
●
●
●
●
●
●
●
●
●
●
●
●
●
●
●
●
●
●
●
●
●
●
●
●
●
●
●
●
●
●
●
●
●
●
●
●
●
●
●
●
●
●
●
●
●
●
●
●
●
●
●
●
●
●
●
●
●
●
●
●
●
●
●●
●
●
●
●
●
●
●
●
●
●
●
●
●
●
●
●
●
●
●
●
●
●
●
●
●
●
●
●
●
●
●

2015
What grade didyour school get? EDUCATION