The 2014 U.S. Corporate Venture Capital Year in Review
46
Analysis of 2014’s corporate venture capital activity. Released February 2015
-
Upload
cb-insights -
Category
Data & Analytics
-
view
1.361 -
download
3
Transcript of The 2014 U.S. Corporate Venture Capital Year in Review

Analysis of 2014’s corporate venture capital activity. Released February 2015

2
CB Insights is a National Science Foundation-backed company that uses data to provide VCs, corporate strategy, M&A teams and business development professionals with intelligence on emerging companies and disruptive technology trends. To see how our data can make your life easier, visit: www.cbinsights.com
3

4
In 2014, VC funding hit the highest levels since 2000 and corporate VCs played a huge part. Corporate venture capital activity saw a spike in 2014 as deals by corporate venture arms jumped 25% YoY while funding rose 76% behind participation in some of 2014’s largest venture deals ranging from Cloudera to Tango to Slack.
In 2014, 54 different corporate venture arms participated in at least one U.S. seed VC round. That’s compared to just 10 corporate VCs who did a seed deal in 2010.
Corporate VC participation hit another multi-year high as 96 unique corporate VCs completed an investment in Q4’14, a 32% rise from the same quarter last year and a 60% jump from the same quarter two years ago.
Corporate venture capital investors participated in 18% of the 3,617 total venture capital deals in 2014. That’s up from 2013 when CVCs participated in just over 15% of all VC deals.
Google Ventures led all corporate VCs, investing in 60+% more companies than second place Intel Capital in 2014. Salesforce came in at #3 after a busy 2014, which included investments in Anaplan, Mulesoft, Docusign and others.
Average deal size with corporate venture participation reached $23M+ in three of the four quarters in 2014. This was a significant step up from 2013 where average CVC deal sizes never topped $17M.
Healthcare CVC funding jumped 23% YoY in 2014 behind an array of $40M+ deals. YoY healthcare CVC deals rose 8%.
Google Ventures and Intel Capital led corporate VCs by number of U.S.-based exits in 2014, each notching over 3x more exits than third place SR One. In a huge year for healthcare IPOs, four healthcare-focused CVCs made the top 10, all of which counted three or more IPO exits.
Corporations making strategic investments in U.S. companies but not as part of a specific separately demarcated venture group are not included. Page 45 details the rules and definitions we use.

“Designed by a VC insider who truly knows the space and understands end-user needs.”
Greg Bae Investments & Biz Dev Comcast Ventures
Jack Leeney Portfolio Manager Telefonica Ventures
“CB Insights are changing the way investors access private company information.”
Kevin Diestel Investor Sapphire Ventures
“We've found CBI to have the best data for the most accurate market view.”
“They have the best quality data in the market for anyone looking to get an inside look at private company financings.”
Ian Sigalow Partner Greycroft Partners
“CB Insights' intuitive user interface, analytical capabilities, and detailed investment information create a very powerful tool for our team's research needs.”
Nate D’Anna Corporate Development Cisco
“We track dealflow, understand valuation multiples, analyze industry trends and identify comparable companies. It is great to see CB Insights innovating in the venture capital data space.
Will Porteous General Partner RRE Ventures
5
6

In a year that saw VC funding jump to levels not seen since 2000, corporate VCs played a huge role. In 2014, corporate venture capital activity saw a spike as deals by corporate venture arms jumped 25% YoY and 55% from 2012. YoY funding rose 76%.
7

On a monthly basis, April and October each saw corporate venture deal tallies spike. March, June and October each saw over $1.8B+ in CVC funding participation, highlighted by large deals including Magic Leap, Slack and Tango.
8

California took 50%+ of CVC deal share in each quarter of 2014, while Massachusetts and New York saw nearly an equal share of CVC deals.
9
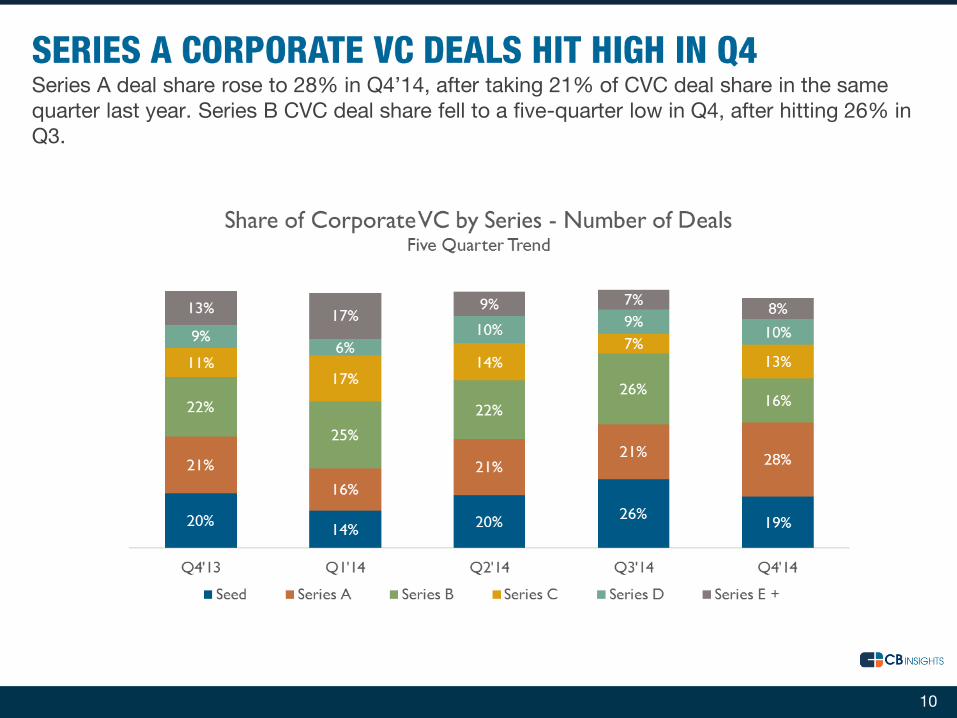
Series A deal share rose to 28% in Q4’14, after taking 21% of CVC deal share in the same quarter last year. Series B CVC deal share fell to a five-quarter low in Q4, after hitting 26% in Q3.
10

11
After Series E+ deals took 52% of CVC funding participation in Q1 behind Cloudera’s mega-deal and Series D took 43% in Q2, CVC funding share was more evenly distributed in Q3 and Q4.

The proliferation of mobile technologies led the mobile sector to top healthcare by corporate venture deal share in three of four quarters in 2014.
12
13
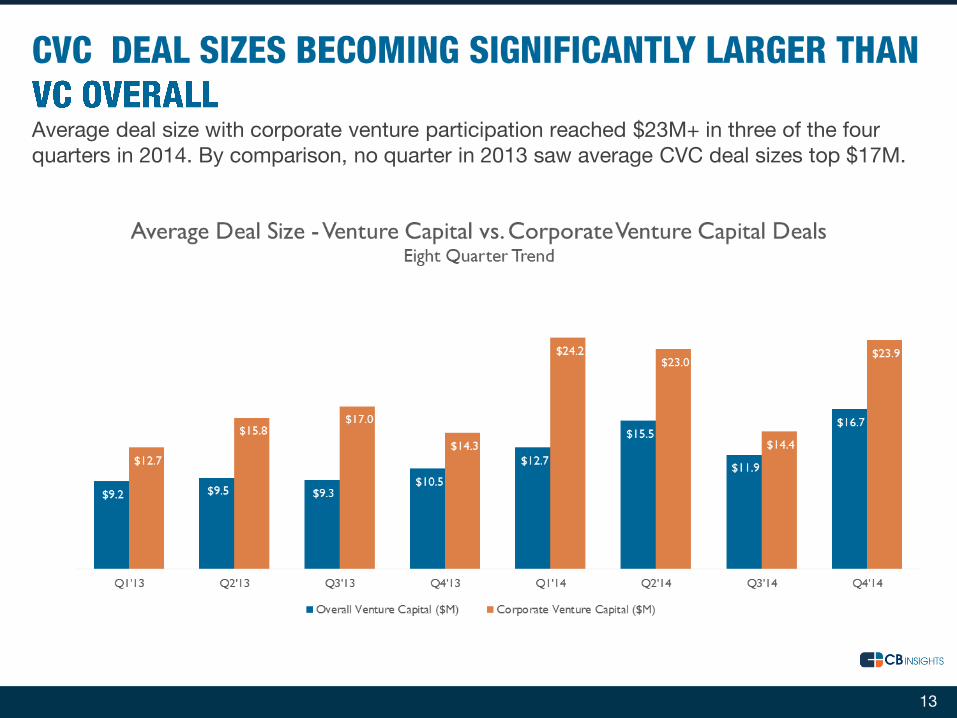
Average deal size with corporate venture participation reached $23M+ in three of the four quarters in 2014. By comparison, no quarter in 2013 saw average CVC deal sizes top $17M.

14
Corporate venture firms participated in 18% of the 3,617 total venture capital deals in 2014. That’s up from 2013 when CVCs participated in just over 15% of all VC deal activity.

15
Corporate VC participation hit a multi-year high as 96 corporate VCs completed an investment in Q4, a 32% rise from the same quarter last year and a 60% jump from the same quarter two years ago.

16
In 2014, 54 different corporate venture arms participated in at least one U.S. seed VC round. That’s compared to just 10 corporate VCs who did a deal in 2010. Coupled with the increasing # of micro VCs and larger VCs doing seed deals, there is an abundance of funding at the seed stage.
17
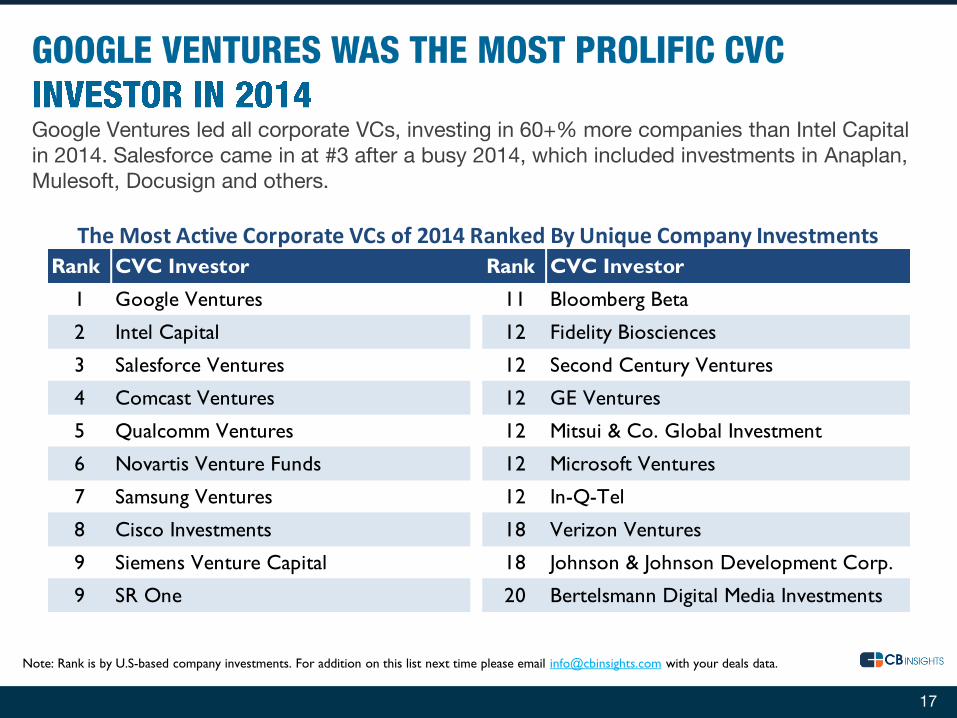
Google Ventures led all corporate VCs, investing in 60+% more companies than Intel Capital in 2014. Salesforce came in at #3 after a busy 2014, which included investments in Anaplan, Mulesoft, Docusign and others.
Note: Rank is by U.S-based company investments. For addition on this list next time please email [email protected] with your deals data.
Rank CVC Investor Rank CVC Investor
1 Google Ventures 11 Bloomberg Beta
2 Intel Capital 12 Fidelity Biosciences
3 Salesforce Ventures 12 Second Century Ventures
4 Comcast Ventures 12 GE Ventures
5 Qualcomm Ventures 12 Mitsui & Co. Global Investment
6 Novartis Venture Funds 12 Microsoft Ventures
7 Samsung Ventures 12 In-Q-Tel
8 Cisco Investments 18 Verizon Ventures
9 Siemens Venture Capital 18 Johnson & Johnson Development Corp.
9 SR One 20 Bertelsmann Digital Media Investments
The Most Active Corporate VCs of 2014 Ranked By Unique Company Investments
18
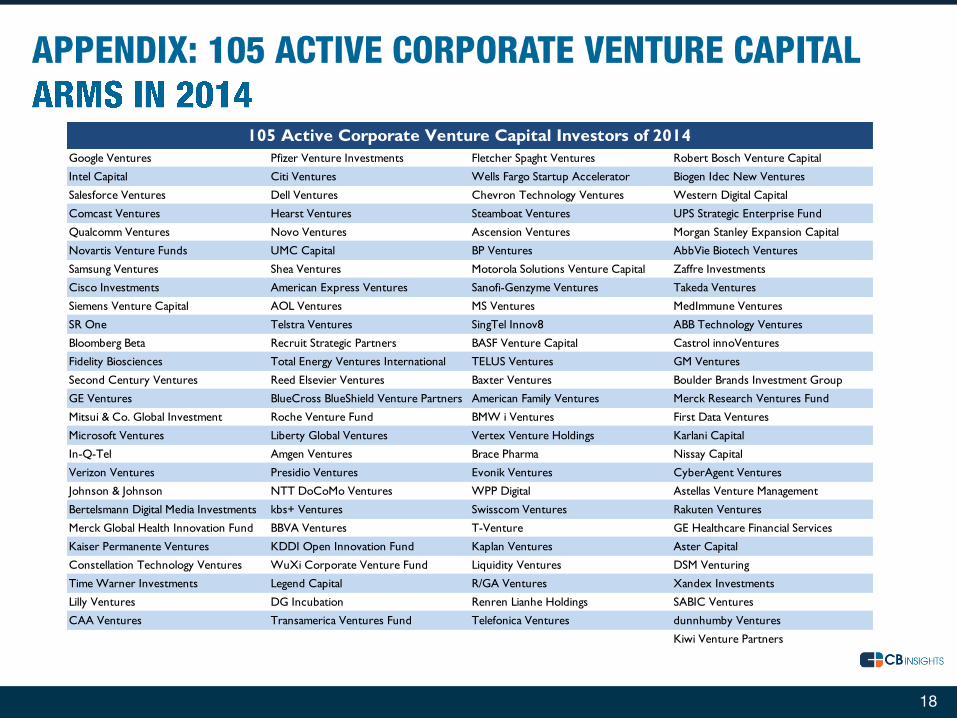
Google Ventures Pfizer Venture Investments Fletcher Spaght Ventures Robert Bosch Venture Capital
Intel Capital Citi Ventures Wells Fargo Startup Accelerator Biogen Idec New Ventures
Salesforce Ventures Dell Ventures Chevron Technology Ventures Western Digital Capital
Comcast Ventures Hearst Ventures Steamboat Ventures UPS Strategic Enterprise Fund
Qualcomm Ventures Novo Ventures Ascension Ventures Morgan Stanley Expansion Capital
Novartis Venture Funds UMC Capital BP Ventures AbbVie Biotech Ventures
Samsung Ventures Shea Ventures Motorola Solutions Venture Capital Zaffre Investments
Cisco Investments American Express Ventures Sanofi-Genzyme Ventures Takeda Ventures
Siemens Venture Capital AOL Ventures MS Ventures MedImmune Ventures
SR One Telstra Ventures SingTel Innov8 ABB Technology Ventures
Bloomberg Beta Recruit Strategic Partners BASF Venture Capital Castrol innoVentures
Fidelity Biosciences Total Energy Ventures International TELUS Ventures GM Ventures
Second Century Ventures Reed Elsevier Ventures Baxter Ventures Boulder Brands Investment Group
GE Ventures BlueCross BlueShield Venture Partners American Family Ventures Merck Research Ventures Fund
Mitsui & Co. Global Investment Roche Venture Fund BMW i Ventures First Data Ventures
Microsoft Ventures Liberty Global Ventures Vertex Venture Holdings Karlani Capital
In-Q-Tel Amgen Ventures Brace Pharma Nissay Capital
Verizon Ventures Presidio Ventures Evonik Ventures CyberAgent Ventures
Johnson & Johnson NTT DoCoMo Ventures WPP Digital Astellas Venture Management
Bertelsmann Digital Media Investments kbs+ Ventures Swisscom Ventures Rakuten Ventures
Merck Global Health Innovation Fund BBVA Ventures T-Venture GE Healthcare Financial Services
Kaiser Permanente Ventures KDDI Open Innovation Fund Kaplan Ventures Aster Capital
Constellation Technology Ventures WuXi Corporate Venture Fund Liquidity Ventures DSM Venturing
Time Warner Investments Legend Capital R/GA Ventures Xandex Investments
Lilly Ventures DG Incubation Renren Lianhe Holdings SABIC Ventures
CAA Ventures Transamerica Ventures Fund Telefonica Ventures dunnhumby Ventures
Kiwi Venture Partners
105 Active Corporate Venture Capital Investors of 2014

19
Google Ventures and Intel Capital led corporate VCs by number of U.S.-based exits in 2014, each notching over 3x more exits than third place SR One. With a huge year for healthcare IPOs, four healthcare-focused CVCs made the list, all of which counted three or more IPO exits.
Rank CVC Investor Select 2014 Exits
1 Google Ventures OnDeck Capital, Hubspot, Nest Labs
2 Intel Capital Yodlee, [x+1], Prolexic Technolgies
3 SR One Dicerna, iPierian, Concert Pharma
4 Qualcomm Ventures Divide, MoboTap, Location Labs
4 Samsung Ventures Fixmo, Cloudant, Engrade
4 Motorola Solutions Venture Capital Fixmo, Zephyr Technology, Lumidigm
4 Mitsui & Co. Global Investment ProteinSimple, Change Healthcare, Location Labs
8 Novartis Venture Funds Alios BioPharma, Akebia Therapeutics, Celladon
8 Novo Ventures Alios BiopPharma, Nevro, Otonomy
8 Johnson & Johnson Development Corp. Celladon, Nevro, CardioMems
The Top Corporate Venture Capital Firms By Number of U.S. Exits in 2014

20
The CB Insights platform has the details on each and every transaction in 2014. That includes all 2,866
tech exits in this report.
Some of our happy customers

21

After Q1’14 saw Internet CVC deals on par with 2013 tallies, deal activity jumped in the subsequent two quarters, hitting 75+ deals each in Q2 and Q3. Internet funding with CVC participation increased 122% behind several $100M+ deals.
22

San Francisco topped the list of U.S. cities by total Internet corporate venture capital deals. Four of the five largest Internet CVC deals of 2014 involved Google Ventures or Google Capital.
23
Note: Venture capital deals included in the ranking may be tranched fundings.
Company Round Amount ($M) Top Cities Deals Dollars ($M)
Cloudera Series F $900 San Francisco 68 $1,197
SurveyMonkey Private Equity $250 New York 35 $562
Flatiron Health Series B $130 Palo Alto 10 $1,185
Slack Technologies Series D $120 Mountain View 9 $180
DataStax Series E $106 Redwood City 7 $117
Top Internet Deals: 2014 Top Internet Cities: 2014

California took 63% of Internet deals involving corporate VCs in Q4’14, as the state’s share rose for the second consecutive quarter after falling to 51% in Q2’14.
24

After rising for the fourth consecutive quarter, Series A deal share by corporate VCs reached 30% in Q4’14. Series B CVC deal share fell for the second consecutive quarter and hit 10% in Q4.
25

26

Uber’s $1.2B round of financing buoyed mobile as funding peaked to a five-quarter high of nearly $1.4B in Q2. On a year-over-year basis, CVCs completed 5% more deals in the mobile sector in 2014.
27

San Francisco leads the list of U.S. cities for Mobile & Telecom corporate venture capital deals. Top mobile CVC deals spread across from grocery delivery to messaging to enterprise app development.
28
Note: Venture capital deals included in the ranking may be tranched fundings.
Company Round Amount ($M) Top Cities Deals Dollars ($M)
Uber Series D $1,200 San Francisco 33 $1,617
TangoMe Series D $280 New York 11 $70
Instacart Series C $220 Menlo Park 5 $12
NantMobile Series C $50 Palo Alto 4 $23
Kony Series E $50 Mountain View 4 $318
Top Mobile Cities: 2014Top Mobile Deals: 2014

California’s share of corporate venture deals in mobile dropped to 49% in Q3 but jumped back to 58% in Q4.
29

Mobile Series A deal share by corporate VCs rose to a four-quarter high at 26% in Q4. Series C deal share hit a five-quarter high at 23% in Q4, after taking just 3% share in Q3.
30

31

Healthcare CVC funding jumped 23% YoY in 2014 behind an array of $40M+ deals in Q2’14. YoY healthcare CVC deals rose 8%.
32

Naurex’s $80M Series C and Viamet’s $60M Series D were the two largest CVC-backed deals in healthcare in 2014. Cambridge topped all cities for corporate venture healthcare deals and dollars.
33
Note: Venture capital deals included in the ranking may be tranched fundings.
Company Round Amount ($M) Top Cities Deals Dollars ($M)
Naurex Series C $80 Cambridge 17 $335
Viamet Pharmaceuticals Series D $60 San Diego 6 $150
Aduro BioTech Series C $55 South San Francisco 4 $118
Coherus BioSciences Series C $55 San Francisco 3 $53
Syros Pharmaceuticals Series B $53 Irvine 3 $72
Top Healthcare Cities: 2014Top Healthcare Deals: 2014
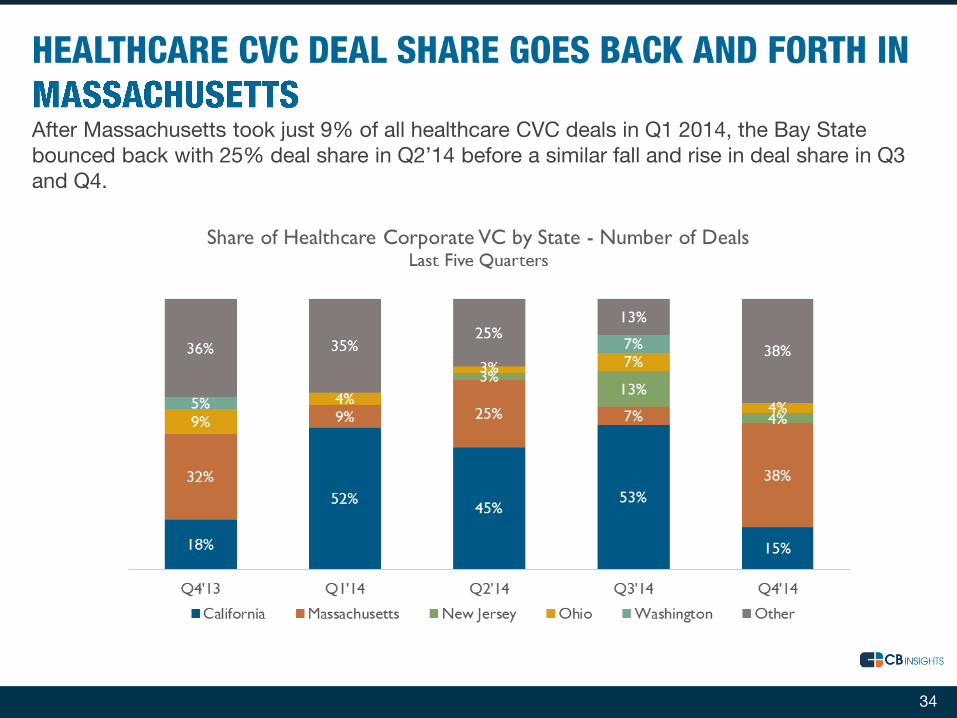
After Massachusetts took just 9% of all healthcare CVC deals in Q1 2014, the Bay State bounced back with 25% deal share in Q2’14 before a similar fall and rise in deal share in Q3 and Q4.
34

In Q4’14, Series A healthcare CVC deals rose to a five-quarter high to take nearly 1/2 of all deal share. Series B deal share fell to 24% in Q4 after taking over half of all CVC healthcare deals in Q3.
35
36

California corporate VC deals jumped 32% on a year-over-year basis with an average of 87 corporate venture deals per quarter in 2014. CVC funding in California-based companies ticked down in the second half of 2014 after topping $2B in Q1 and Q2.
37

The Greater Bay Area dominated the top 5 California cities in terms of CVC deals and dollars. Tech took all of California’s largest deals with corporate venture participation.
38
Company Round Amount ($M) Top Cities Deals Dollars ($M)
Uber Series D $1,200 San Francisco 121 $3,058
Cloudera Series F $900 Palo Alto 25 $1,381
TangoMe Series D $280 Sunnyvale 20 $245
SurveyMonkey Private Equity $250 Mountain View 19 $610
Instacart Series C $220 San Jose 16 $409
Slack Technologies Series D $120 Redwood City 15 $265
Top Cities in California: 2014Top Deals in California: 2014
Note: Venture capital deals included in the ranking may be tranched fundings.

39

Funding with corporate VC participation picked up in Q4’14 hitting $433M behind multiple $50M+ deals. Year-over-year CVC deal activity in Massachusetts rose 22%.
40

Cambridge led all cities for deals, while healthcare took 3 of the top 5 Mass. CVC deals including WuXi PharmaTech-backed Syros Pharma’s $53M Series B and Fidelity Biosciences-backed Blueprint Medicine’s $50M Series C.
41
Note: Venture capital deals included in the ranking may be tranched fundings.
Company Round Amount ($M) Top Cities Deals Dollars ($M)
Syros Pharmaceuticals Series B $53 Cambridge 26 $397
Kaminario Series E $53 Boston 9 $80
Blueprint Medicines Series C $50 Waltham 5 $51
Veracode Series F $40 Acton 3 $20
Aileron Therapeutics Series E - II $33 Burlington 2 $50
Top Deals in Massachusetts: 2014 Top Cities in Massachusetts: 2014

42

Corporate venture deals in NY rose 28% YoY and hit a four-year quarterly high in Q4’14. After Q2’14 saw NY CVC funding jump to $323M behind Flatiron Health’s Series B, Q3 and Q4 each saw smaller funding totals.
43

Google Ventures’ participation in Flatiron Health’s $130M Series B marked the largest NY based CVC financing round in 2014. Google Ventures-backed OnDeck Capital, now public, and MassMutual Ventures-backed IEX Group both notched $75M+ rounds in 2014.
44
Note: Venture capital deals included in the ranking may be tranched fundings.
Company Round Amount ($M) Top Cities Deals Dollars ($M)
Flatiron Health Series B $130 New York 58 $743
OnDeck Capital Series E $77 Brooklyn 9 $48
IEX Group Series C $75 Long Island City 1 $8
Kaltura Series E $47 Oneonta 1 $21
Sprinklr Series D $40
Top Deals in New York: 2014 Top Cities in New York: 2014

45
Measuring corporate venture activity is important. We encourage you to review the methodology and definitions employed by us to better understand the numbers presented in this report. If you have any questions about our definitions or methodological principles, please reach out to us directly. What is included? Equity financings into emerging companies. Funding must come from corporate venture groups. Fundings of only private companies. Public companies of any kind on any exchange (including Pink Sheets) are excluded from our numbers even if they received investment by a venture firm(s) Companies must be headquartered in the USA. Our geographic data is based on the city and state where the company receiving investment is headquartered. If a company has a satellite office/presence in multiple cities or was founded in a particular city but has moved its HQ, our results reflect only this HQ address. Only include the investment made in the quarter for tranched investments. If a company does a second closing of its Series B round for $5M and previously had closed $2M in a prior quarter, only the $5M is reflected in our results. Round #s reflect what has closed – not what is intended. If a company indicates the closing of $5M out of a desired raise of $15M, our numbers reflect only the amount which has closed. Only verifiable fundings are included. Fundings are verified via (1) various federal & state regulatory filings (2) direct confirmation with firm or investor, or (3) press release. Funding close date matters. Fundings are provided based on funding close date and not on announcement date.
What is not? Strategic corporate investments. Corporations making strategic investments in companies but not as part of a specific organized venture group are not included. Angel investment. These are not included in numbers unless an investment round included Angels investing alongside a corporate venture group. No contingent funding. If a company receives a commitment for $20M subject to hitting certain milestones but first gets $8M, only the $8M is included in our data. No business development/R&D arrangements whether transferable into equity now, later or never. If a company signs a $300M R&D partnership with a larger corporation, this is not equity financing nor is it from a venture capital firm. As a result, it is not included. Buyouts, Consolidations and Recapitalizations. All three of these of transaction types are commonly employed by private equity firms and are tracked by CB Insights. However, they are excluded for the purposes of this report. Private equity investments into companies which may have received venture capital investment prior are also not included. Private placements. These investments also known as PIPEs (Private Investment in Public Equities) even if made by a corporate venture group(s) are not included. Debt/loans of any kind. Venture debt or any kind of debt/loan issued to emerging, startup companies even if included as an additional part of an equity financing is not included. If a company receives $3M with $2M from venture investors and $1M in debt, only the $2M is included in these statistics. Government funding. Grants, loans, equity financings by the federal government, state agencies or public-private partnerships to emerging, startup companies are not included. Strictly corporate venture outfits. Incubator investments. Investments of money as equity or debt and/or services by incubators are not included.

46
Web | www.cbinsights.com Twitter | @cbinsights Tel | 212.292.3148