The 2012 State New Economy Index 2012 State New economy Index ... Industry Investment in R&D ......
84
THE 2012 State New Economy Index Benchmarking Economic Transformation in the States
Transcript of The 2012 State New Economy Index 2012 State New economy Index ... Industry Investment in R&D ......

The
2012 State New economy Index
Benchmark ing economic Transformat ion in the S ta tes

I n fo rmat ion Techno logy and Innovat ion Foundat ion | The 2012 S ta te New Economy Index
About the InformAtIon technology And InnovAtIon foundAtIonThe Information Technology and Innovation Foundation (ITIF) is a Washington, D.C.-based nonprofit, nonpartisan think tank at the cutting edge of designing innovation policies and documenting how advances in technology are creating new economic opportunities to boost economic growth and improve quality of life in the United States and around the world.
Our mission is to help policymakers better understand the nature of the new innovation economy and the types of public policies needed to drive innovation, productivity and broad-based prosperity.
ITIF publishes policy reports, holds forums and policy debates, advises elected officials and their staff, and is an active resource for the media. We develop new and creative policy proposals to advance innovation, analyze existing policy issues through the lens of advancing innovation and productivity, and oppose policies that hinder digital transformation and innovation.
For FurTher INFormaTIoN, To vIew ThIS reporT oNlINe, or To learN more aBouT ITIF, vISIT uS oNlINe aT www.ITIF.org.
ITIF appreciates the financial assistance received from the Ewing Marion Kauffman Foundation for this project. The contents and views of this publication are solely the responsibility of ITIF.
www.itif.org • [email protected]
1101 K Street NW • Suite 610 Washington, DC 20005
Phone: (202) 449-1351 • Fax: (202) 638-4922

The 2012 S ta te New Economy Index | I n fo rmat ion Techno logy and Innovat ion Foundat ion
THE 2012 STATE NEW ECONOMY INDEX
Benchmarking Economic Transformation in the States
Robert D. Atkinson and Luke A. Stewart Information Technology and Innovation Foundation
December 2012

I n fo rmat ion Techno logy and Innovat ion Foundat ion | The 2012 S ta te New Economy Index

RepoRt Section DiviDeR
The 2012 S ta te New economy Index | I n fo rmat ion Techno logy and Innovat ion Foundat ion | 1
Report Section Divider
The 2012 S ta te New economy Index | I n fo rmat ion Techno logy and Innovat ion Foundat ion | 1
tAble of contentS
Introduction ....................................................................................................................................................................................... 3 The Evidence of Competitive Decline ................................................................................................................... 3 Is Innovation What the Doctor Ordered? .............................................................................................................. 4 Box 1: The Decline of Manufacturing Competitiveness ........................................................................................ 5
The Index ......................................................................................................................................................................................... 10 Overall Scores ..................................................................................................................................................11 Indicator Scores by Rank ............................................................................................................................. 12 Indicator Scores by State .............................................................................................................................. 14 Summary of Results .........................................................................................................................................16 Knowledge Jobs................................................................................................................................................18 Information Technology Jobs ....................................................................................................................... 19 Managerial, Professional and Technical Jobs ................................................................................................. 20 Workforce Education ................................................................................................................................... 21 Immigration of Knowledge Workers ............................................................................................................ 22 Migration of U.S. Knowledge Workers ........................................................................................................ 23 Manufacturing Value Added ........................................................................................................................ 24 High-Wage Traded Services .......................................................................................................................... 25 Globalization ...................................................................................................................................................26 Foreign Direct Investment ........................................................................................................................... 27 Export Focus of Manufacturing and Services ............................................................................................... 28 Economic Dynamism .......................................................................................................................................30 Job Churning ............................................................................................................................................... 31 Fast Growing Firms ...................................................................................................................................... 32 Initial Public Offerings................................................................................................................................. 33 Entrepreneurial Activity ............................................................................................................................... 34 Inventor Patents ........................................................................................................................................... 35 The Digital Economy .......................................................................................................................................36 Online Population ....................................................................................................................................... 37 E-Government ............................................................................................................................................. 38 Online Agriculture ....................................................................................................................................... 39 Broadband Telecommunications .................................................................................................................. 40 Health IT..................................................................................................................................................... 41 Innovation Capacity .........................................................................................................................................42 High-Tech Jobs ............................................................................................................................................ 43 Scientists and Engineers ............................................................................................................................... 44 Patents ......................................................................................................................................................... 45 Industry Investment in R&D ....................................................................................................................... 46 Non-Industry Investment in R&D .............................................................................................................. 47 Movement Toward a Green Economy .......................................................................................................... 48 Venture Capital ............................................................................................................................................ 49
State economic Development in an era of relative u.S. economic Decline .................................................................................. 50 Policies to Reduce Zero-Sum Competition .......................................................................................................... 51 Policies to Spur Win-Win Economic Growth ...................................................................................................... 52 Policies to Support Manufacturing Competitiveness ........................................................................................... 54
Conclusion........................................................................................................................................................................................ 57
appendix: Index methodology .......................................................................................................................................................... 58 Indicator Weights ................................................................................................................................................ 59 Indicator Methodologies and Data Sources ......................................................................................................... 60
endnotes ......................................................................................................................................................................................... 69
about the authors............................................................................................................................................................................. 78

I n fo rmat ion Techno logy and Innovat ion Foundat ion | The 2012 S ta te New Economy Index
“It is not the strongest of the species that survive, nor the most intelligent,
but the ones most responsive to change.”
— Charles Darwin

The 2012 S ta te New economy Index | I n fo rmat ion Techno logy and Innovat ion Foundat ion | 3
The Evidence of Competit ive Decline IntroductIon
IntroductIon
More than three years on from the end of the Great Recession, only six states have regained employment levels enjoyed prior
to the recession, and 17 states are still more than 5 percent below their pre-recession employment levels.1 As many state economies continue to struggle through the lingering effects of the Great Recession, a question commonly asked is, “What is this seemingly invisible force that prevents the economy from returning to pre-recession and especially 1990s growth rates?” In other words, why is it that, despite massive monetary and fiscal stimulus, employment seems locked in persistent malaise?
Some argue that the problem is a lack of consumer demand and that more federal government stimulus spending is the answer. Others argue that it is uncertainty over the massive national debt and that fiscal austerity is the answer. However, one diagnosis that has gone largely unnoticed holds that this invisible force holding back economic growth is the decline in the competitiveness of the U.S. economy in the global marketplace. As ITIF points out in Innovation Economics: The Race for Global Advantage, this decline has been a relatively untold story over the past decade, although its symptoms have clearly manifested in the dramatic fall in manufacturing employment and investment since 2000.2 The failure of the United States to adapt to a global economy that is evermore dependent on knowledge and innovation for growth—the so-called “New Economy”—is causing traded sector firms, and manufacturers in particular, to look to other, more competitive countries when it comes to choosing locations. And this loss of traded sector
activity, including jobs and investment, holds back the entire U.S. economy and its component state economies as well.
For the United States to be competitive, one key will be to compete more on the basis of innovation and entrepreneurship, and less on cost. With a globalized economy enabling easy access to low cost production systems in nations like Mexico and China, U.S. competitive advantage will continue to be found in making things and providing traded services that other nations are unable to make or provide as easily or as efficiently. And success in this means, among other things, having a workforce and jobs based on higher skills; robust global connections; dynamic firms, including strong, high-growth startups; industries and individuals embracing digital technologies; and strong capabilities in technological innovation. These keys are the same for state economies and this is why the State New Economy Index focuses on these five areas.
the evidence of competitive decline
The evidence is clear that over the last decade the competitiveness of the U.S. economy has declined relative to that of many other nations. In 2010, the Boston Consulting Group ranked the United States just eighth in global innovation-based competitiveness, analyzing factors such as corporate and government R&D investment, venture capital, and scientists and engineers, among others.3 In 2011, ITIF ranked the United States fourth out of 40 nations in innovation-based competitiveness.4 The World Economic Forum’s (WEF) 2012 Global Competitiveness ranking puts the United States in seventh place.5 Apologists for the status
The evidence is clear that over the last decade the competitiveness of the U.S. economy has declined relative to that of many other nations.

4 | In fo rmat ion Techno logy and Innovat ion Foundat ion | The 2012 S ta te New economy Index
Is Innovation What the Doctor Ordered?IntroductIon
quo might point out that the United States is still in the top 10 in all three studies. But it is not just that we are no longer number one, as we were as recently as the early 2000s; in fact, our relative competitive position is slipping rapidly. In the WEF study, the United States fell to seventh from a fifth place ranking just one year prior.6 And the ITIF report found that the United States was second-to-last out of 44 countries in the rate of change in its competitive position between 1999 and 2011.7
The manufacturing sector is where U.S. competitiveness decline has been most dramatically felt. U.S. manufacturing employment has declined 33 percent between 2000 and 2011, exceeding the loss during the Great Depression.8 As Box 1 explains, manufacturing is still the key enabler of most states’ traded-sector strength, and when an economy’s traded sector declines, the rest of the economy declines with it. Indeed, the United States has seen its global share of manufacturing eviscerated in industry after industry. For example, whereas the United States claimed 29 percent of the printed circuit board (PCB) production in 1998, by 2009 that share had plummeted to 8 percent. Likewise, the U.S. share of the photovoltaic market (solar panels) cratered from 30 percent in 1999 to less than 6 percent in 2008. Meanwhile, China’s position in these industries has been the direct inverse of America’s. Its share of PCB manufacturing grew from 7 percent in 1999 to over 31 percent in 2008, and its share of the solar panels market grew from 6 percent to 32 percent. The song remains the same across the manufacturing landscape. The U.S. share of global passenger vehicle production fell by almost half from 1999 to 2008 (15 percent to 8 percent), as the Chinese share rocketed from less than
2 percent to nearly 13 percent, making China now the world’s largest manufacturer of passenger vehicles. The United States’ longtime strength in machine tools has evaporated, with U.S. production of machine tools falling to 5 percent and China’s rising to 35 percent.9
While manufacturing is hard hit, isn’t the U.S. high-tech industry doing well? Not really. After running a trade surplus for decades in high-tech products, the United States began to run a trade deficit in this sector in the 2000s. “I’m not telling you the sky is falling, but I have a duty to report that some of the indicators are not good,” stated Russell Hancock, Chief Executive of Joint Venture Silicon Valley Network, which has indexed the region’s business climate each year since 1995.10
This is not to say that the U.S. economy will not rebound in the regular course of the business cycle and that unemployment rates will not fall in virtually all states. But it is to say that something is now fundamentally different than it was in the last century. In this century, the U.S. economy faces a challenge like never before. Unless the United States addresses this fundamental economic competitiveness challenge, it will be difficult for the U.S. economy and, by extension, individual state economies to thrive.
Is Innovation What the doctor ordered?
Some have argued that given the economic downturn, now is not the time to focus on innovation; rather, our chief concern should be job creation. Yet fostering innovation and creating jobs are inextricably linked. Most studies of the issue have found that innovation is positively correlated to job growth in the mid to
U.S. manufacturing employment has declined 33 percent between 2000 and 2011, exceeding the loss during the Great Depression.
IntroductIon
The 2012 S ta te New economy Index | I n fo rmat ion Techno logy and Innovat ion Foundat ion | 5
The Decline of Manufacturing Competit iveness
Box 1: The Decline of Manufacturing CompetitivenessFrom 1980 to 2000, U.S. real GDP grew by 3.32 percent
per year; from 2000 to 2011, it grew by 1.56 percent per
year.11 From 1980 to 2000, U.S. real personal income
grew by 3.35 percent per year; from 2000 to 2011, it
grew by 1.63 percent per year.12 And from 1980 to 2000,
U.S. total nonfarm employment grew by 1.90 percent per
year; from 2000 to 2011 it declined by 0.03 percent per
year.13 Perhaps the single most important reason for this
incredibly poor performance of the U.S. economy over
the last decade was the unprecedented decline in U.S.
manufacturing. Although manufacturing jobs peaked in
1979, manufacturing job loss was relatively modest in the
1980s and 1990s. From 1980 to 2000, manufacturing jobs
declined by an average of 0.5 percent per year. But from
2000 to 2011 the rate of loss dramatically accelerated, with
manufacturing jobs shrinking at a rate nearly six times faster
(3.1 percent per year). During this period, manufacturing
lost 5.4 million jobs for a decline of 31.4 percent. Strikingly,
in each day since the year 2000, America had, on average,
17 fewer manufacturing establishments than it had the
previous day.14
Some observers have argued that all is well with U.S.
manufacturing because they view manufacturing as a “rust
belt” industry where the losses are largely confined to a
few states whose economies are concentrated in what are
essentially “buggy whip” industries. To be sure, the rust
belt states saw significant losses in the last decade. The
deterioration of the automobile industry led to a loss of
close to half of Michigan’s manufacturing jobs—Detroit
alone lost 150,000 auto industry jobs between 2000 and
2008. But manufacturing loss has been a significant feature
of almost every state. For example, North Carolina, often
referred to as the “new South” due to the presence of many
federal labs and IT and pharmaceutical firms, ranks second
in the loss of manufacturing jobs between 2000 and 2011.
In fact, only five states saw less than double-digit declines
in manufacturing employment (with only Alaska and North
Dakota actually creating jobs), and in none of these states
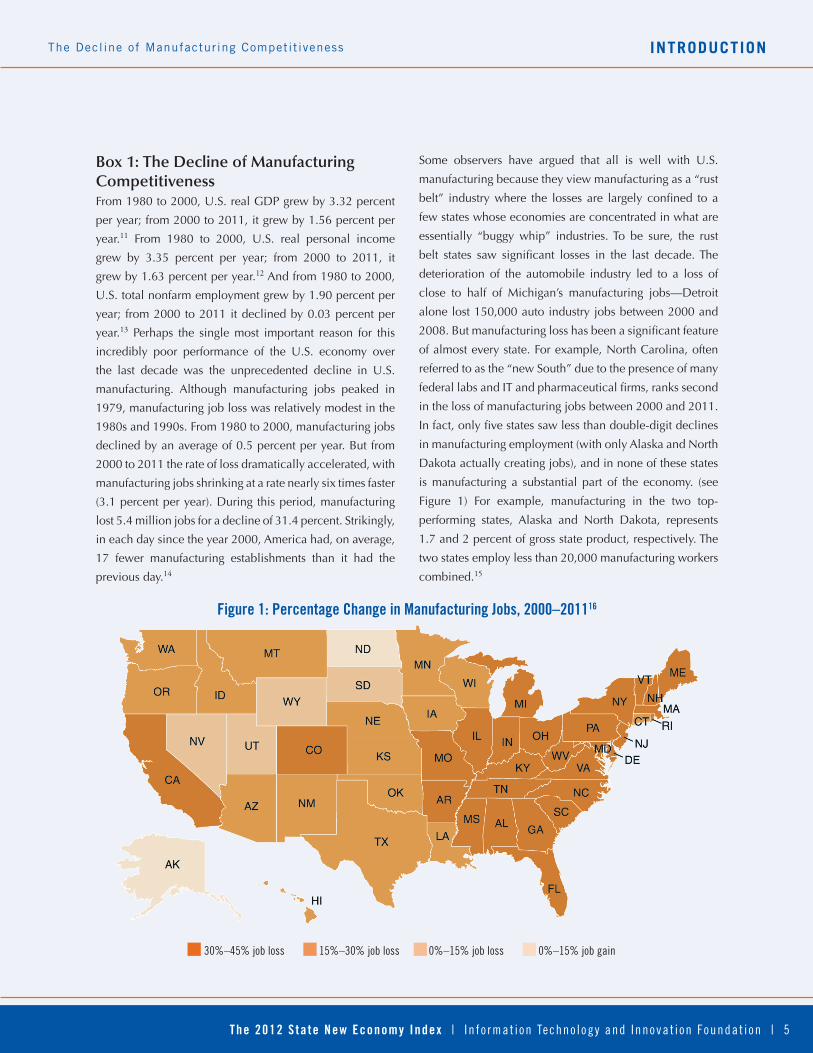
is manufacturing a substantial part of the economy. (see
Figure 1) For example, manufacturing in the two top-
performing states, Alaska and North Dakota, represents
1.7 and 2 percent of gross state product, respectively. The
two states employ less than 20,000 manufacturing workers
combined.15
Figure 1: percentage Change in manufacturing Jobs, 2000–201116
30%–45% job loss 15%–30% job loss 0%–15% job loss 0%–15% job gain

IntroductIon
6 | In fo rmat ion Techno logy and Innovat ion Foundat ion | The 2012 S ta te New economy Index
The Decline of Manufacturing Competit iveness
Why does the decline of manufacturing matter? For one,
manufacturing (particularly advanced, technology-based
manufacturing) is still the key enabler of U.S. traded-
sector strength. This is important because traded sector
establishments provide the economic foundation upon
which the rest of an economy grows. Indeed, there is
no sector more important to the vitality of the 50 state
economies than manufacturing. This effect is most clearly
evident in local economies, but as one aggregates these
effects up to the state and national levels, they apply just
the same. As Gene Sperling, director of the White House
National Economic Council, recently put it, “If an auto
plant opens up, a Walmart can be expected to follow. But
the converse does not necessarily hold—that a Walmart
opening does not definitely bring an auto plant with
it.”17 In other words, manufacturing establishments are
the “anchors” of an economy, and when the anchor is
uplifted, the rest of the economy drifts away. Moreover,
manufacturing remains a key source of jobs that both
pay well—21 percent more than the average hourly
compensation in private sector service industries—
and have large employment multiplier effects—each
manufacturing job supports as many as 2.9 other jobs in
the rest of the economy.18 Average wages in U.S. high-
technology industries (which are principally in traded
sectors) are 93 percent higher than the average private
sector wage.19
Why is American manufacturing in decline? In short, a major
factor has been the loss of international competitiveness
among U.S. manufacturing establishments. This is
evident in a number of areas, including faltering rates of
manufacturing output and productivity growth, investment,
and entrepreneurship. In the first area, a major reason
why there has not been more alarm over this is that most
economists and pundits argue that the manufacturing jobs
losses are the result of superior productivity performance.
In this narrative, rapid productivity growth, not output
loss, is driving manufacturing job losses.20 Lamentably,
the state of American manufacturing has been seriously
misdiagnosed on two counts. First, even when relying on
official U.S. government data, it is clear that manufacturing
output growth has lagged in most manufacturing industries
this decade. Second, there are substantial upward biases
in the federal government’s official statistics that lead to
manufacturing real output and productivity growth being
significantly overstated.21
The decline in manufacturing entrepreneurship—the
formation of new manufacturing companies—is evident
in the manufacturing establishment statistics. In a healthy
industry, steady growth in employment often masks the
constant churning of firm creation and destruction. As less
innovative and efficient companies go out of business and
more innovative and competitive entrepreneurial firms
take their place, there is a net increase in jobs. This effect
has been termed “creative destruction”—there is some
decline and some growth, but the net result is growth.
The highly competitive nature of most industries produces
this process of dynamic equilibrium. But, over the last
decade, the dynamic in the U.S. manufacturing sector
has been quite different. In no year since 2001 have there
been more manufacturing establishment openings than
closings. The picture is just as bleak when analyzing the
net job gains or losses from these openings and closings.
In the 1990s, losses from closing and contracting plants
were more or less offset by gains from new and expanding
plants. (See Figure 2) But, in the 2000s, the gains declined
dramatically—on average about 10,000 fewer jobs per year
than in the 1990s. While there were a significant number of
manufacturing establishments losing jobs during the 2001
recession, ordinarily, post-recession, one would expect
things to return to normal. They did not. From the end of the
2001 recession to the beginning of the Great Recession, in
only five quarters did more manufacturing establishments
gain jobs than lose them, and even in those cases, the
share of gainers over losers was quite small. And then the
Great Recession hit, again causing a significant number
of manufacturing establishments to close or contract. And,
once again, things have not returned to normal: since
the Great Recession, there have been only five quarters
in which gainers moderately outnumbered losers.22

IntroductIon
The 2012 S ta te New economy Index | I n fo rmat ion Techno logy and Innovat ion Foundat ion | 7
The Decline of Manufacturing Competit iveness
Figure 2: gross manufacturing Job gains and losses (millions) 1992–201123
While creative destruction represents an ever-innovating,
entrepreneurial economy, the steady loss of manufacturing
establishments indicates declining entrepreneurial activity
and a loss of competitiveness.24
We see a decline in manufacturing investment in the
dramatic fall in the number of major relocations and new
facilities built in the United States. These are the major
facilities (such as new factories, corporate and regional
headquarters, etc.) that states intensely compete for. From
1995 to 2000, the average number of new or expanded
facilities per year was 5,139. At this rate the typical state
could expect to see 103 new or expanded facilities per
year. From 2000 to 2005 these fell to 3,896 per year on
average, and from 2005 to 2011, they fell even further to
just 2,824 per year.25 As a result, a typical state can now
expect to see an average of just 56 a year.
The decline in U.S. manufacturing competitiveness is a
weight that drags down and holds back state economic
growth. Indeed, from 2000 to 2010 there was a very
strong positive correlation (0.67) between change in
manufacturing jobs and change in overall employment in
the states. The correlation was even stronger (0.81) when
manufacturing employment changes were correlated
with total employment changes two years later. It was
also closely correlated (0.47) to percent change in per-
capita income over the same period.26 In other words,
manufacturing job loss was closely related to slow or even
declining overall state employment and to slower income
growth.
We see a decline in manufacturing investment in the dramatic fall in the number of major relocations and new facilities built in the United States.
0
200
400
600
800
1,000
1,200
1992 1995 1998 2001 2004 2007 2010
Job Gains Job Losses

8 | In fo rmat ion Techno logy and Innovat ion Foundat ion | The 2012 S ta te New economy Index
Is Innovation What the Doctor Ordered?IntroductIon
long term.27 Innovation leads to job growth in three fundamental ways. First, innovation gives a region’s firms a first-mover advantage in new products and services, expanding exports and creating expansionary employment effects in the short term. In fact, in the United States, growth in exports leads to twice as many jobs as an equivalent expansion of sales domestically.28 Second, innovation’s expansionary effects lead to a virtuous cycle of expanding employment. For example, in the early- to mid-1990s, the emergence of information technology as a general-purpose technology drove broad-based economic growth, creating hundreds of thousands of new jobs, which, in turn, led to additional job growth in supporting industries. Finally, when innovation leads to higher productivity, it also leads to increased wages and lower prices, both of which expand domestic economic activity and create jobs.29
Nevertheless, more jobs alone, while a critical step for recovery, will not be enough to get America’s economy back onto the trajectory of the growth rates experienced in the 1990s. Instead, the economy will need to transition from low-skilled, low-wage jobs to more highly skilled and thus higher-wage jobs, and from our traditional industrial manufacturing makeup to a 21st century mix of employment in high-tech fields such as biotechnology, clean energy, information technology, nanotechnology, and advanced manufacturing. Innovation will be indispensible in helping us get there. Highly innovative economies are characterized by a diverse mix of high-paying, capital-intense, productive industries, while less dynamic economies tend to focus on a handful of commodity-driven industries that are
low-wage and concentrated in lower portions of the value chain. As the Organization for Economic Co-operation and Development (OECD) explains, “Technology both eliminates jobs and creates jobs. Generally it destroys lower-wage, lower-productivity jobs, while it creates jobs that are more productive and highly skilled and better paid. Historically, the income-generating effects of new technologies have proved more powerful than the labor-displacing effects: technological progress has been accompanied not only by higher output and productivity, but also by higher overall employment.”30
While it is true that unemployment is dangerously high and policies should be put in place to create jobs, policies focused on short-term employment alone are a sprinter’s strategy; mid- and long-term growth will rely on more substantive innovation policies.
The lack of real economic vitality in the last decade was a causal factor in the financial crisis and the subsequent Great Recession. Indeed, if the recession has taught economists anything, it should be that economic growth and stability stem from a mix of highly productive and innovative industries. Thus, if one industry falters, others can pick up the slack. For example, would GM have invested as much as in its failed hedge fund (making it more of a financial services firm than a manufacturer) if the company had been able to produce globally competitive hybrid cars? Would society have invested so much in housing if we had a strong demand for investments in real wealth-creating activities, like innovative and technology-based industries?
The point is that it is not enough for the United States to just “create jobs, any jobs.” If we are unconcerned about
If we are unconcerned about the mix of jobs our economy is creating, the United States increasingly risks seeing its employment base shift towards a lower-value-added, lower-wage composition.

The 2012 S ta te New economy Index | I n fo rmat ion Techno logy and Innovat ion Foundat ion | 9
IntroductIonIs Innovation What the Doctor Ordered?
the mix of jobs our economy is creating, the United States increasingly risks seeing its employment base shift toward a lower-value-added, lower-wage composition. We are already seeing evidence of this. For example, in 2009, the Bureau of Labor Statistics found that between 2000 and 2007, the average wage paid across occupations increased by 22 cents, but that the average wage actually received by workers increased by only 8 cents. The reason for this was that U.S. workers had shifted into lower-paying occupations—in other words, if the United States had the exact same composition of jobs in 2007 that it had in 2000, then workers would have realized that 22 cent wage increase, but since workers had generally moved into lower-paying occupations, the wage increase they actually received was less than half that amount.31 No doubt, this has resulted in part from increased global competition and the continued relocation of not just low-value but also high-value-added manufacturing activities to foreign countries. Even more worrying, this deterioration in U.S. employees’ income occurred well before the onset of the Great Recession. Going forward, innovation and entrepreneurship will be critical to ensuring higher real wages for American citizens across the board; indeed up to 90 percent of per-capita income growth stems directly from innovation.32
To be well positioned to drive innovation-based growth state economies need to be firmly grounded in New Economy success factors. The following section of the report uses 26 indicators to assess each state’s fundamental capacity to successfully navigate the shoals of economic change. It measures the extent to which state economies
are structured and operate according to the tenets of the New Economy. In other words, it examines the degree to which state economies are knowledge-based, globalized, entrepreneurial, IT-driven, and innovation based. With these indicators as a frame of reference, the final section, “State Economic Development in an Era of Relative U.S. Economic Decline,” outlines the policies states will need to articulate and implement in order to develop the effective “innovation strategies” they need to remain competitive in the New Economy. A state innovation strategy entails three key policy areas: 1) policies to reduce zero-sum competition; 2) policies to spur “win-win” economic results; and 3) policies to support the traded sector—manufacturing in particular.
To be well positioned to drive innovation-based growth, state economies need to be firmly grounded in New Economy success factors.

10 | In fo rmat ion Techno logy and Innovat ion Foundat ion | The 2012 S ta te New economy Index
the Index
*Due to changes in methodology, changes in rank from previous editions may not positively reflect changes in economic structure.
the Index
This report builds on five prior State New Economy Indexes published in 1999, 2002, 2007, 2008 and 2010.33 The purpose of the State New
Economy Index is to measure the economic structure of states. Unlike some other reports which assess state economic performance or state economic policies, this report focuses more narrowly on a simple question: to what degree does the structure of state economies match the ideal structure of the New Economy? For example, we know that a defining characteristic of the New Economy is that it is global. Therefore, the Index uses a number of variables to measure each state economy’s degree of global integration.
Overall, the report uses 26 indicators, divided into five categories that best capture what is new about the New Economy:
1. Knowledge jobs: Indicators measure employment of IT professionals outside the IT industry; jobs held by managers, professionals, and technicians; the educational attainment of the workforce; immigration of knowledge workers; migration of domestic knowledge workers; worker productivity in the manufacturing sector; and employment in high-wage traded services.
2. Globalization: Indicators measure foreign direct investment and the export orientation of manufacturing and services.
3. Economic dynamism: Indicators measure the degree of job churning; the number of fast growing firms; the number and value of initial public stock offerings (IPOs); the number of entrepreneurs starting new businesses; and the number of individual inventor patents granted.
4. The digital economy: Indicators measure the percentage of households online; the degree
to which state governments use information technologies to deliver services; Internet and computer use by farmers; residential and business access to broadband telecommunications; and use of information technology in the healthcare system.
5. Innovation capacity: Indicators measure the number of jobs in high-tech industries; the number of scientists and engineers in the private sector; the number of patents granted; industry investment in research and development; non-industry investment in research and development; movement toward a green energy economy; and venture capital investment.

The 2012 S ta te New economy Index | I n fo rmat ion Techno logy and Innovat ion Foundat ion | 11
the IndexOveral l Scores
overAll ScoreS
1 92.4 Massachusetts 1 1 1 1 +0 +0
2 82.1 Delaware 9 9 7 6 +5 +4
3 79.5 Washington 4 4 4 2 +1 -1
4 79.1 California 2 2 5 7 +1 +3
5 79.1 Maryland 11 5 3 3 -2 -2
6 77.9 Virginia 12 8 8 8 +2 +2
7 76.8 Colorado 3 3 9 9 +2 +2
8 76.4 Utah 6 16 12 12 +4 +4
9 76.0 Connecticut 5 7 6 5 -3 -4
10 75.6 New Jersey 8 6 2 4 -8 -6
11 72.5 New York 16 11 10 10 -1 -1
12 71.9 New Hampshire 7 12 13 11 +1 -1
13 69.7 Minnesota 14 14 11 13 -2 +0
14 69.3 Oregon 15 13 17 14 +3 +0
15 67.2 Vermont 18 26 20 23 +5 +8
16 66.7 Arizona 10 15 22 20 +6 +4
17 65.7 Texas 17 10 14 18 -3 +1
18 64.8 Georgia 25 18 18 19 +0 +1
19 64.5 Michigan 34 22 19 17 +0 -2
20 64.3 Illinois 22 19 16 15 -4 -5
21 61.4 Florida 20 17 23 21 +2 +0
22 60.6 Pennsylvania 24 21 21 22 -1 +0
23 60.5 Rhode Island 29 23 15 16 -8 -7
24 60.5 Idaho 23 20 24 27 +0 +3
25 60.2 North Carolina 30 24 26 24 +1 -1
26 59.0 Nevada 21 31 27 30 +1 +4
27 58.9 Maine 28 29 32 28 +5 +1
28 58.7 Alaska 13 39 25 31 -3 +3
29 57.7 Kansas 27 30 34 26 +5 -3
30 56.8 New Mexico 19 25 33 32 +3 +2
31 55.8 Wisconsin 32 37 30 29 -1 -2
32 55.5 Ohio 33 27 29 25 -3 -7
33 54.9 Missouri 35 28 35 33 +2 +0
34 54.1 North Dakota 45 47 37 36 +3 +2
35 53.7 Nebraska 36 36 28 34 -7 -1
36 53.5 Hawaii 26 38 41 40 +5 +4
37 53.1 Montana 46 41 42 37 +5 +0
38 52.9 Iowa 42 40 38 38 +0 +0
39 52.2 Tennessee 31 34 36 41 -3 +2
40 49.8 South Carolina 38 35 39 39 -1 -1
41 49.5 Wyoming 41 43 43 46 +2 +5
42 49.4 Indiana 37 32 31 35 -11 -7
43 48.0 South Dakota 43 46 48 45 +5 +2
44 46.1 Louisiana 47 44 44 43 +0 -1
45 45.7 Kentucky 39 42 45 44 +0 -1
46 45.7 Alabama 44 45 46 47 +0 +1
47 45.5 Oklahoma 40 33 40 42 -7 -5
48 41.7 Arkansas 49 49 47 48 -1 +0
49 37.9 West Virginia 48 48 50 49 +1 +0
50 37.4 Mississippi 50 50 49 50 -1 +0
2012 rank
2012 Score State
1999rank
2002rank
2007rank
2010rank
Change from2007* 2010*
2012 rank
2012 Score State
1999rank
2002rank
2007rank
2010rank
Change from2007* 2010*
*Due to changes in methodology, changes in rank from previous editions may not positively reflect changes in economic structure.
100th–76th percentile 75th–51st percentile50th–26th percentile25th–1st percentile

12 | In fo rmat ion Techno logy and Innovat ion Foundat ion | The 2012 S ta te New economy Index
Indicator Scores by Rankthe Index
State rank Score rank Score rank Score rank Score rank Score rank Score rank Score rank Score rank Score rank Score rank Score rank Score rank Score rank Score rank Score rank Score rank Score rank Score rank Score rank Score rank Score rank Score rank Score rank Score rank Score rank Score rank Score
Massachusetts 1 92.4 5 2.8% 1 37.9% 1 0.55 12 13.7 2 14.7 16 102.5% 9 12.7% 14 $62,836 6 4.3% 35 30.8% 2 0.028% 3 6.64 MA 23 0.29% 5 0.117 11 83.8% 14 90.0 3 7.63 2 8.57 2 57% 1 7.8% 3 5.4% 9 1.34 8 4.1% 4 1.4% 37 4.59 2 0.86%
Delaware 2 82.1 3 2.8% 20 30.5% 23 0.41 40 11.8 27 13.2 22 99.4% 1 16.6% 2 $117,608 2 4.8% 12 38.3% 7 0.018% 32 4.15 DE 38 0.24% 31 0.058 33 79.1% 25 86.7 34 3.80 1 9.36 15 37% 12 4.5% 9 3.8% 2 1.80 1 11.7% 48 0.3% 27 4.82 25 0.07%
Washington 3 79.5 4 2.8% 5 33.7% 11 0.46 19 13.0 13 13.9 7 107.3% 29 9.7% 4 $97,445 32 2.4% 46 27.3% 6 0.019% 24 4.90 WA 40 0.24% 6 0.105 3 88.4% 25 86.7 10 7.09 8 6.61 13 38% 8 5.7% 1 6.0% 1 2.70 10 3.6% 8 0.8% 5 5.96 6 0.18%
California 4 79.1 10 2.1% 9 32.9% 16 0.43 36 12.0 12 14.0 13 103.4% 8 12.8% 15 $62,481 25 2.9% 48 25.7% 5 0.019% 8 6.15 CA 1 0.46% 2 0.135 9 84.2% 5 93.3 22 5.31 13 6.08 40 25% 5 6.0% 6 4.6% 4 1.63 5 4.7% 11 0.7% 23 4.98 1 0.89%
Maryland 5 79.1 2 2.9% 2 37.2% 2 0.51 6 13.9 9 14.0 11 105.6% 23 10.7% 24 $48,258 24 2.9% 20 35.6% 3 0.026% 14 5.52 MD 30 0.27% 11 0.085 15 83.3% 14 90.0 34 3.80 4 7.50 28 30% 4 6.4% 4 5.3% 17 1.06 24 2.6% 2 4.4% 26 4.84 15 0.11%
Virginia 6 77.9 1 3.2% 3 35.2% 5 0.48 10 13.7 6 14.2 5 112.6% 6 13.3% 25 $44,767 23 3.0% 17 36.5% 1 0.032% 27 4.61 VA 43 0.22% 28 0.060 29 79.8% 3 96.7 37 3.50 18 5.44 24 33% 3 6.7% 2 6.0% 18 1.04 15 3.1% 5 1.3% 18 5.08 7 0.18%
Colorado 7 76.8 6 2.7% 6 33.4% 3 0.51 9 13.8 14 13.8 21 99.9% 12 11.9% 42 $35,210 31 2.4% 5 44.0% 9 0.017% 9 5.96 CO 3 0.44% 9 0.089 18 82.7% 5 93.3 14 6.64 16 5.63 35 28% 6 5.8% 5 5.1% 11 1.32 23 2.7% 13 0.7% 48 4.30 3 0.28%
Utah 8 76.4 25 1.7% 24 30.1% 12 0.44 22 12.8 19 13.7 1 125.5% 14 11.7% 9 $74,282 44 1.8% 2 44.8% 4 0.023% 10 5.92 UT 19 0.33% 1 0.216 1 90.1% 1 100.0 9 7.53 12 6.19 49 21% 10 4.9% 16 3.3% 23 0.91 28 2.5% 23 0.5% 40 4.50 4 0.26%
Connecticut 9 76.0 12 2.0% 4 34.8% 4 0.50 38 11.8 8 14.1 9 106.5% 3 15.3% 23 $48,952 3 4.6% 50 24.0% 8 0.017% 5 6.44 CT 25 0.29% 7 0.104 20 82.0% 25 86.7 3 7.63 11 6.32 15 37% 15 4.1% 14 3.5% 12 1.30 3 5.7% 39 0.4% 6 5.93 23 0.08%
New Jersey 10 75.6 7 2.6% 7 33.0% 6 0.48 30 12.4 11 14.0 40 91.1% 7 13.0% 16 $61,580 4 4.5% 36 30.7% 10 0.016% 18 5.34 NJ 37 0.26% 8 0.100 17 82.9% 34 83.3 1 8.04 3 7.84 45 23% 7 5.7% 7 4.0% 7 1.44 4 5.4% 43 0.3% 15 5.27 13 0.11%
New York 11 72.5 13 2.0% 11 32.6% 9 0.46 37 11.9 7 14.1 24 98.0% 2 15.8% 8 $78,006 12 3.5% 16 36.7% 12 0.013% 16 5.42 NY 12 0.37% 19 0.073 32 79.3% 5 93.3 21 5.44 7 6.67 28 30% 24 3.6% 31 2.7% 8 1.35 29 2.3% 31 0.5% 11 5.37 5 0.23%
N Hampshire 12 71.9 15 2.0% 14 31.5% 8 0.47 49 10.4 4 14.4 42 87.6% 20 10.8% 36 $38,456 1 4.9% 15 36.8% 20 0.010% 32 4.15 NH 33 0.26% 4 0.123 4 86.4% 44 80.0 3 7.63 5 7.09 3 50% 9 5.4% 10 3.7% 33 0.71 7 4.4% 21 0.6% 1 6.33 9 0.16%
Minnesota 13 69.7 8 2.4% 10 32.7% 10 0.46 25 12.6 17 13.7 17 102.1% 4 14.1% 28 $42,307 29 2.6% 25 33.5% 18 0.010% 26 4.82 MN 44 0.22% 12 0.085 14 83.4% 5 93.3 20 5.54 23 4.94 1 61% 13 4.4% 11 3.7% 13 1.17 6 4.5% 38 0.4% 24 4.92 12 0.11%
Oregon 14 69.3 27 1.7% 17 30.8% 18 0.43 15 13.4 18 13.7 3 116.4% 18 10.8% 13 $63,231 42 1.9% 18 35.9% 32 0.005% 32 4.15 OR 24 0.29% 3 0.125 5 86.2% 5 93.3 2 7.86 14 6.06 10 42% 14 4.2% 23 3.1% 21 0.93 9 3.8% 32 0.4% 3 6.18 8 0.16%
Vermont 15 67.2 33 1.5% 8 32.9% 7 0.48 7 13.8 1 14.9 49 81.6% 47 6.6% 6 $88,916 28 2.6% 9 40.4% 29 0.005% 32 4.15 VT 8 0.42% 16 0.079 12 83.5% 34 83.3 3 7.63 34 4.37 4 47% 22 3.6% 35 2.5% 14 1.17 25 2.6% 25 0.5% 2 6.32 18 0.10%
Arizona 16 66.7 11 2.1% 16 30.8% 25 0.39 33 12.1 29 13.1 8 106.9% 16 11.1% 22 $52,884 35 2.3% 6 42.9% 17 0.011% 30 4.50 AZ 5 0.42% 17 0.078 13 83.5% 14 90.0 49 1.66 10 6.36 22 34% 19 3.8% 15 3.5% 24 0.91 14 3.1% 14 0.7% 8 5.78 14 0.11%
Texas 17 65.7 17 2.0% 26 29.9% 37 0.37 43 11.5 32 13.1 10 106.5% 21 10.7% 1 $134,040 22 3.0% 39 30.4% 11 0.015% 6 6.38 TX 7 0.42% 29 0.059 24 80.2% 14 90.0 39 3.27 28 4.67 28 30% 23 3.6% 13 3.6% 22 0.92 21 2.8% 40 0.3% 49 4.26 10 0.15%
Georgia 18 64.8 19 1.9% 22 30.3% 26 0.39 29 12.5 33 13.0 14 103.1% 10 12.5% 12 $63,579 14 3.5% 8 41.6% 14 0.011% 13 5.60 GA 4 0.43% 37 0.049 26 79.9% 25 86.7 32 4.00 20 5.23 39 26% 26 3.4% 28 2.9% 15 1.10 32 2.2% 29 0.5% 33 4.68 16 0.11%
Michigan 19 64.5 29 1.6% 18 30.7% 33 0.38 13 13.6 38 12.8 15 103.0% 33 9.2% 18 $56,877 26 2.8% 24 34.8% 35 0.004% 7 6.36 MI 41 0.23% 18 0.073 23 80.8% 1 100.0 30 4.56 33 4.45 13 38% 18 3.9% 8 3.8% 10 1.32 2 5.9% 28 0.5% 20 5.01 32 0.02%
Illinois 20 64.3 23 1.8% 12 31.9% 13 0.44 21 12.8 10 14.0 20 100.2% 5 13.5% 21 $55,767 15 3.4% 28 32.7% 22 0.009% 20 5.31 IL 42 0.23% 22 0.062 28 79.9% 14 90.0 24 5.21 22 4.95 20 35% 21 3.6% 30 2.9% 26 0.86 18 3.0% 27 0.5% 12 5.37 11 0.13%
Florida 21 61.4 30 1.6% 34 28.2% 34 0.38 42 11.6 31 13.1 37 92.7% 19 10.8% 5 $94,440 36 2.3% 3 44.6% 23 0.009% 21 5.07 FL 10 0.39% 14 0.081 25 79.9% 25 86.7 18 6.09 15 5.71 37 27% 28 3.3% 32 2.7% 25 0.89 38 1.8% 45 0.3% 34 4.67 30 0.04%
Pennsylvania 22 60.6 26 1.7% 27 29.6% 30 0.39 41 11.7 16 13.7 18 101.9% 13 11.8% 34 $39,256 13 3.5% 27 33.4% 13 0.011% 19 5.31 PA 49 0.17% 26 0.061 37 78.1% 3 96.7 33 3.90 29 4.65 19 36% 17 4.0% 26 3.0% 29 0.81 12 3.4% 16 0.6% 14 5.32 17 0.10%
Rhode Island 23 60.5 21 1.8% 15 31.2% 15 0.43 50 8.7 3 14.5 44 85.3% 24 10.6% 50 $22,302 5 4.4% 10 40.0% 38 0.003% 32 4.15 RI 39 0.24% 30 0.058 29 79.8% 34 83.3 3 7.63 6 6.72 8 46% 16 4.1% 19 3.1% 30 0.81 33 2.1% 3 1.5% 50 3.94 20 0.09%
Idaho 24 60.5 20 1.8% 19 30.5% 38 0.37 39 11.8 35 13.0 48 81.6% 43 7.7% 10 $65,365 47 1.6% 4 44.0% 27 0.006% 32 4.15 ID 11 0.39% 13 0.083 10 84.1% 48 76.7 11 6.98 25 4.87 31 29% 11 4.6% 17 3.2% 5 1.56 11 3.6% 9 0.7% 13 5.34 41 0.01%
North Carolina 25 60.2 16 2.0% 28 29.2% 29 0.39 18 13.1 23 13.4 12 104.8% 22 10.7% 31 $41,099 11 3.6% 23 35.0% 16 0.011% 17 5.40 NC 21 0.31% 42 0.044 40 76.5% 34 83.3 23 5.22 38 3.99 15 37% 20 3.8% 21 3.1% 31 0.76 31 2.2% 18 0.6% 19 5.01 21 0.09%
Nevada 26 59.0 47 1.1% 50 22.5% 44 0.33 23 12.7 43 12.4 2 125.4% 41 8.3% 3 $103,904 30 2.5% 13 38.3% 15 0.011% 32 4.15 NV 2 0.45% 15 0.080 8 84.3% 34 83.3 49 1.66 17 5.46 42 24% 41 2.2% 48 1.7% 6 1.53 17 3.0% 50 0.2% 17 5.20 38 0.01%
Maine 27 58.9 43 1.2% 25 30.0% 24 0.39 11 13.7 21 13.6 27 97.2% 38 8.5% 37 $38,105 9 3.8% 11 39.9% 46 0.001% 32 4.15 ME 20 0.32% 45 0.040 21 81.7% 34 83.3 3 7.63 37 4.26 8 46% 38 2.4% 45 2.0% 34 0.66 26 2.6% 35 0.4% 4 6.03 24 0.08%
Alaska 28 58.7 31 1.5% 13 31.6% 19 0.42 32 12.4 39 12.8 38 92.4% 28 9.7% 39 $37,411 20 3.0% 1 46.1% 49 0.000% 32 4.15 AK 6 0.42% 35 0.050 2 88.6% 34 83.3 26 4.67 35 4.32 45 23% 35 2.5% 12 3.7% 19 1.03 46 1.2% 36 0.4% 32 4.72 46 0.00%
Kansas 29 57.7 24 1.8% 31 28.7% 17 0.43 4 14.2 37 12.9 43 87.4% 32 9.3% 41 $35,929 21 3.0% 31 32.1% 19 0.010% 32 4.15 KS 22 0.31% 32 0.057 6 84.8% 14 90.0 26 4.67 9 6.50 22 34% 29 3.3% 24 3.0% 32 0.75 45 1.4% 41 0.3% 36 4.59 26 0.06%
New Mexico 30 56.8 34 1.5% 21 30.4% 31 0.39 20 12.9 28 13.2 4 115.0% 45 6.8% 46 $27,124 48 1.4% 21 35.3% 41 0.002% 32 4.15 NM 27 0.29% 21 0.066 39 76.8% 25 86.7 38 3.46 47 2.67 25 32% 2 7.1% 18 3.2% 28 0.81 42 1.5% 1 6.6% 35 4.61 19 0.09%
Wisconsin 31 55.8 22 1.8% 36 28.0% 27 0.39 5 14.0 15 13.8 33 94.6% 25 10.2% 44 $34,432 39 2.2% 38 30.4% 39 0.003% 23 4.90 WI 47 0.21% 20 0.072 16 83.2% 34 83.3 19 5.55 21 5.22 4 47% 33 2.9% 27 3.0% 35 0.64 19 2.9% 26 0.5% 21 5.00 31 0.03%
Ohio 32 55.5 18 1.9% 30 29.1% 40 0.36 24 12.7 25 13.3 35 94.3% 17 11.1% 27 $42,450 17 3.2% 43 28.9% 31 0.005% 28 4.55 OH 29 0.28% 27 0.061 35 78.4% 25 86.7 36 3.57 41 3.76 4 47% 31 3.1% 20 3.1% 27 0.82 16 3.1% 20 0.6% 39 4.55 28 0.05%
Missouri 33 54.9 9 2.3% 23 30.1% 36 0.37 17 13.2 24 13.4 29 95.2% 15 11.3% 45 $34,203 34 2.3% 47 26.5% 34 0.004% 31 4.41 MO 17 0.35% 38 0.047 36 78.2% 5 93.3 42 2.91 39 3.89 10 42% 30 3.2% 22 3.1% 36 0.64 22 2.7% 33 0.4% 38 4.57 27 0.06%
North Dakota 34 54.1 40 1.3% 48 26.1% 22 0.42 3 14.5 26 13.2 23 98.6% 42 8.0% 20 $56,318 33 2.3% 22 35.2% 28 0.005% 32 4.15 ND 26 0.29% 23 0.062 27 79.9% 14 90.0 16 6.40 24 4.91 20 35% 39 2.4% 43 2.1% 41 0.52 35 2.0% 15 0.7% 43 4.44 36 0.01%
Nebraska 35 53.7 14 2.0% 37 27.8% 21 0.42 47 11.1 41 12.8 31 94.9% 11 12.2% 33 $40,115 41 2.0% 37 30.7% 47 0.001% 25 4.87 NE 28 0.29% 34 0.053 19 82.5% 25 86.7 13 6.83 19 5.37 25 32% 32 3.0% 29 2.9% 45 0.38 37 1.9% 24 0.5% 29 4.77 46 0.00%
Hawaii 36 53.5 44 1.2% 33 28.5% 14 0.43 28 12.5 5 14.3 46 83.0% 39 8.4% 40 $37,273 19 3.1% 33 31.9% 43 0.002% 32 4.15 HI 46 0.21% 39 0.046 34 78.6% 25 86.7 26 4.67 26 4.80 27 31% 40 2.3% 39 2.2% 3 1.76 27 2.5% 17 0.6% 16 5.21 45 0.00%
Montana 37 53.1 45 1.1% 32 28.5% 20 0.42 35 12.1 22 13.4 30 95.0% 49 6.5% 26 $42,603 50 1.1% 7 42.6% 33 0.004% 12 5.65 MT 13 0.36% 25 0.062 41 75.7% 34 83.3 12 6.96 48 2.56 35 28% 43 2.1% 37 2.4% 20 0.97 30 2.3% 12 0.7% 7 5.92 40 0.01%
Iowa 38 52.9 28 1.6% 38 27.7% 35 0.37 34 12.1 20 13.7 19 100.5% 26 10.0% 43 $35,020 38 2.2% 44 28.6% 45 0.001% 22 4.99 IA 31 0.27% 33 0.055 31 79.5% 34 83.3 15 6.50 27 4.71 4 47% 37 2.5% 36 2.4% 38 0.56 13 3.3% 30 0.5% 31 4.72 33 0.02%
Tennessee 39 52.2 32 1.5% 35 28.0% 42 0.34 8 13.8 30 13.1 28 95.4% 36 9.0% 19 $56,419 18 3.2% 49 24.5% 21 0.009% 2 6.84 TN 15 0.35% 43 0.041 47 72.2% 5 93.3 47 2.17 40 3.83 37 27% 34 2.5% 38 2.3% 39 0.56 40 1.6% 7 0.9% 22 4.99 29 0.04%
South Carolina 40 49.8 38 1.3% 42 27.1% 39 0.37 31 12.4 36 12.9 26 97.3% 35 9.0% 11 $63,916 7 4.3% 30 32.1% 37 0.003% 32 4.15 SC 34 0.26% 44 0.040 44 74.4% 48 76.7 43 2.71 45 3.14 40 25% 36 2.5% 33 2.7% 42 0.50 39 1.8% 22 0.6% 9 5.60 35 0.01%
Wyoming 41 49.5 49 0.8% 43 26.6% 32 0.39 1 15.5 40 12.8 39 91.8% 50 6.4% 30 $41,187 43 1.9% 19 35.9% 49 0.000% 1 6.90 WY 45 0.22% 10 0.086 7 84.4% 44 80.0 17 6.25 32 4.45 42 24% 50 1.4% 41 2.2% 16 1.10 47 1.1% 49 0.2% 41 4.49 46 0.00%
Indiana 42 49.4 36 1.3% 45 26.5% 43 0.34 26 12.6 34 13.0 25 97.4% 44 7.5% 35 $38,517 10 3.8% 32 31.9% 25 0.007% 15 5.48 IN 48 0.20% 41 0.045 43 74.7% 48 76.7 26 4.67 43 3.55 15 37% 27 3.3% 34 2.6% 40 0.53 20 2.9% 34 0.4% 47 4.30 22 0.08%
South Dakota 43 48.0 41 1.3% 47 26.4% 28 0.39 2 14.7 47 12.2 50 79.3% 34 9.1% 49 $24,756 49 1.3% 26 33.4% 42 0.002% 11 5.89 SD 35 0.26% 24 0.062 22 81.0% 5 93.3 25 5.10 30 4.52 12 39% 44 2.0% 44 2.1% 46 0.33 44 1.5% 44 0.3% 28 4.81 39 0.01%
Louisiana 44 46.1 48 0.8% 44 26.5% 48 0.31 44 11.4 42 12.5 6 108.4% 27 10.0% 7 $79,970 40 2.0% 40 29.9% 40 0.002% 32 4.15 LA 9 0.40% 36 0.050 42 74.9% 14 90.0 44 2.49 36 4.29 50 20% 48 1.8% 46 1.9% 44 0.39 49 0.8% 37 0.4% 42 4.46 37 0.01%
Kentucky 45 45.7 42 1.3% 39 27.5% 46 0.31 46 11.3 46 12.3 41 89.2% 37 9.0% 17 $60,202 8 3.8% 34 30.9% 36 0.004% 29 4.52 KY 18 0.33% 48 0.030 48 72.0% 5 93.3 45 2.19 46 2.90 31 29% 42 2.2% 42 2.1% 43 0.44 43 1.5% 42 0.3% 44 4.42 42 0.01%
Alabama 46 45.7 35 1.4% 40 27.5% 45 0.33 16 13.2 49 12.2 36 93.6% 40 8.4% 38 $38,074 16 3.3% 45 27.5% 26 0.006% 32 4.15 AL 36 0.26% 46 0.035 45 74.2% 44 80.0 46 2.18 44 3.22 47 22% 25 3.4% 25 3.0% 48 0.29 41 1.6% 6 1.0% 10 5.51 44 0.00%
Oklahoma 47 45.5 37 1.3% 29 29.2% 41 0.34 45 11.4 45 12.3 34 94.4% 31 9.4% 47 $26,730 46 1.7% 29 32.2% 24 0.008% 4 6.52 OK 32 0.26% 40 0.045 38 77.3% 44 80.0 30 4.56 42 3.56 31 29% 45 2.0% 40 2.2% 37 0.59 48 1.1% 47 0.3% 45 4.39 34 0.02%
Arkansas 48 41.7 39 1.3% 46 26.5% 49 0.29 27 12.5 44 12.4 47 82.8% 30 9.5% 48 $25,064 37 2.2% 14 37.4% 48 0.001% 32 4.15 AR 14 0.36% 49 0.029 50 70.9% 14 90.0 41 3.16 49 1.73 31 29% 47 1.9% 47 1.8% 50 0.20 34 2.0% 46 0.3% 25 4.88 46 0.00%
West Virginia 49 37.9 46 1.1% 41 27.3% 50 0.26 48 10.7 50 11.9 45 85.1% 48 6.5% 29 $41,685 27 2.7% 41 29.2% 44 0.001% 32 4.15 WV 50 0.16% 47 0.034 46 72.9% 14 90.0 39 3.27 31 4.47 47 22% 46 2.0% 49 1.7% 47 0.30 36 1.9% 10 0.7% 46 4.32 43 0.00%
Mississippi 50 37.4 50 0.6% 49 25.4% 47 0.31 14 13.4 48 12.2 32 94.7% 46 6.7% 32 $40,876 45 1.7% 42 29.0% 30 0.005% 32 4.15 MI 16 0.35% 50 0.020 49 71.4% 14 90.0 48 2.16 50 1.66 42 24% 49 1.5% 50 1.4% 49 0.25 50 0.7% 19 0.6% 30 4.74 46 0.00%
U.S. Average - 61.0 - 2.0% - 30.9% - 0.41 - 12.4 - 13.4 - 100% - 11.5% - $62,611 - 3.0% - 33.0% - 0.017% - 5.00 U.S. - 0.33% - 0.076 - 80.2% - 87.7 - 5.00 - 5.00 - 36% - 4.1% - 3.5% - 1.08 - 3.6% - 0.7% - 5.00 - 0.23%
OVERALL
Information Technology
Jobs
Managerial, Professional, and
Technical JobsWorkforce Education
Immigration of Knowledge
Workers
Migration of U.S. Knowledge
WorkersManufacturing Value Added
High-Wage Traded Services
Export Focus of Manufacturing
and ServicesForeign Direct
InvestmentJob
ChurningFast Growing
FirmsInitial Public
Offerings State

The 2012 S ta te New economy Index | I n fo rmat ion Techno logy and Innovat ion Foundat ion | 13
the IndexIndicator Scores by Rank
State rank Score rank Score rank Score rank Score rank Score rank Score rank Score rank Score rank Score rank Score rank Score rank Score rank Score rank Score rank Score rank Score rank Score rank Score rank Score rank Score rank Score rank Score rank Score rank Score rank Score rank Score rank Score
Massachusetts 1 92.4 5 2.8% 1 37.9% 1 0.55 12 13.7 2 14.7 16 102.5% 9 12.7% 14 $62,836 6 4.3% 35 30.8% 2 0.028% 3 6.64 MA 23 0.29% 5 0.117 11 83.8% 14 90.0 3 7.63 2 8.57 2 57% 1 7.8% 3 5.4% 9 1.34 8 4.1% 4 1.4% 37 4.59 2 0.86%
Delaware 2 82.1 3 2.8% 20 30.5% 23 0.41 40 11.8 27 13.2 22 99.4% 1 16.6% 2 $117,608 2 4.8% 12 38.3% 7 0.018% 32 4.15 DE 38 0.24% 31 0.058 33 79.1% 25 86.7 34 3.80 1 9.36 15 37% 12 4.5% 9 3.8% 2 1.80 1 11.7% 48 0.3% 27 4.82 25 0.07%
Washington 3 79.5 4 2.8% 5 33.7% 11 0.46 19 13.0 13 13.9 7 107.3% 29 9.7% 4 $97,445 32 2.4% 46 27.3% 6 0.019% 24 4.90 WA 40 0.24% 6 0.105 3 88.4% 25 86.7 10 7.09 8 6.61 13 38% 8 5.7% 1 6.0% 1 2.70 10 3.6% 8 0.8% 5 5.96 6 0.18%
California 4 79.1 10 2.1% 9 32.9% 16 0.43 36 12.0 12 14.0 13 103.4% 8 12.8% 15 $62,481 25 2.9% 48 25.7% 5 0.019% 8 6.15 CA 1 0.46% 2 0.135 9 84.2% 5 93.3 22 5.31 13 6.08 40 25% 5 6.0% 6 4.6% 4 1.63 5 4.7% 11 0.7% 23 4.98 1 0.89%
Maryland 5 79.1 2 2.9% 2 37.2% 2 0.51 6 13.9 9 14.0 11 105.6% 23 10.7% 24 $48,258 24 2.9% 20 35.6% 3 0.026% 14 5.52 MD 30 0.27% 11 0.085 15 83.3% 14 90.0 34 3.80 4 7.50 28 30% 4 6.4% 4 5.3% 17 1.06 24 2.6% 2 4.4% 26 4.84 15 0.11%
Virginia 6 77.9 1 3.2% 3 35.2% 5 0.48 10 13.7 6 14.2 5 112.6% 6 13.3% 25 $44,767 23 3.0% 17 36.5% 1 0.032% 27 4.61 VA 43 0.22% 28 0.060 29 79.8% 3 96.7 37 3.50 18 5.44 24 33% 3 6.7% 2 6.0% 18 1.04 15 3.1% 5 1.3% 18 5.08 7 0.18%
Colorado 7 76.8 6 2.7% 6 33.4% 3 0.51 9 13.8 14 13.8 21 99.9% 12 11.9% 42 $35,210 31 2.4% 5 44.0% 9 0.017% 9 5.96 CO 3 0.44% 9 0.089 18 82.7% 5 93.3 14 6.64 16 5.63 35 28% 6 5.8% 5 5.1% 11 1.32 23 2.7% 13 0.7% 48 4.30 3 0.28%
Utah 8 76.4 25 1.7% 24 30.1% 12 0.44 22 12.8 19 13.7 1 125.5% 14 11.7% 9 $74,282 44 1.8% 2 44.8% 4 0.023% 10 5.92 UT 19 0.33% 1 0.216 1 90.1% 1 100.0 9 7.53 12 6.19 49 21% 10 4.9% 16 3.3% 23 0.91 28 2.5% 23 0.5% 40 4.50 4 0.26%
Connecticut 9 76.0 12 2.0% 4 34.8% 4 0.50 38 11.8 8 14.1 9 106.5% 3 15.3% 23 $48,952 3 4.6% 50 24.0% 8 0.017% 5 6.44 CT 25 0.29% 7 0.104 20 82.0% 25 86.7 3 7.63 11 6.32 15 37% 15 4.1% 14 3.5% 12 1.30 3 5.7% 39 0.4% 6 5.93 23 0.08%
New Jersey 10 75.6 7 2.6% 7 33.0% 6 0.48 30 12.4 11 14.0 40 91.1% 7 13.0% 16 $61,580 4 4.5% 36 30.7% 10 0.016% 18 5.34 NJ 37 0.26% 8 0.100 17 82.9% 34 83.3 1 8.04 3 7.84 45 23% 7 5.7% 7 4.0% 7 1.44 4 5.4% 43 0.3% 15 5.27 13 0.11%
New York 11 72.5 13 2.0% 11 32.6% 9 0.46 37 11.9 7 14.1 24 98.0% 2 15.8% 8 $78,006 12 3.5% 16 36.7% 12 0.013% 16 5.42 NY 12 0.37% 19 0.073 32 79.3% 5 93.3 21 5.44 7 6.67 28 30% 24 3.6% 31 2.7% 8 1.35 29 2.3% 31 0.5% 11 5.37 5 0.23%
N Hampshire 12 71.9 15 2.0% 14 31.5% 8 0.47 49 10.4 4 14.4 42 87.6% 20 10.8% 36 $38,456 1 4.9% 15 36.8% 20 0.010% 32 4.15 NH 33 0.26% 4 0.123 4 86.4% 44 80.0 3 7.63 5 7.09 3 50% 9 5.4% 10 3.7% 33 0.71 7 4.4% 21 0.6% 1 6.33 9 0.16%
Minnesota 13 69.7 8 2.4% 10 32.7% 10 0.46 25 12.6 17 13.7 17 102.1% 4 14.1% 28 $42,307 29 2.6% 25 33.5% 18 0.010% 26 4.82 MN 44 0.22% 12 0.085 14 83.4% 5 93.3 20 5.54 23 4.94 1 61% 13 4.4% 11 3.7% 13 1.17 6 4.5% 38 0.4% 24 4.92 12 0.11%
Oregon 14 69.3 27 1.7% 17 30.8% 18 0.43 15 13.4 18 13.7 3 116.4% 18 10.8% 13 $63,231 42 1.9% 18 35.9% 32 0.005% 32 4.15 OR 24 0.29% 3 0.125 5 86.2% 5 93.3 2 7.86 14 6.06 10 42% 14 4.2% 23 3.1% 21 0.93 9 3.8% 32 0.4% 3 6.18 8 0.16%
Vermont 15 67.2 33 1.5% 8 32.9% 7 0.48 7 13.8 1 14.9 49 81.6% 47 6.6% 6 $88,916 28 2.6% 9 40.4% 29 0.005% 32 4.15 VT 8 0.42% 16 0.079 12 83.5% 34 83.3 3 7.63 34 4.37 4 47% 22 3.6% 35 2.5% 14 1.17 25 2.6% 25 0.5% 2 6.32 18 0.10%
Arizona 16 66.7 11 2.1% 16 30.8% 25 0.39 33 12.1 29 13.1 8 106.9% 16 11.1% 22 $52,884 35 2.3% 6 42.9% 17 0.011% 30 4.50 AZ 5 0.42% 17 0.078 13 83.5% 14 90.0 49 1.66 10 6.36 22 34% 19 3.8% 15 3.5% 24 0.91 14 3.1% 14 0.7% 8 5.78 14 0.11%
Texas 17 65.7 17 2.0% 26 29.9% 37 0.37 43 11.5 32 13.1 10 106.5% 21 10.7% 1 $134,040 22 3.0% 39 30.4% 11 0.015% 6 6.38 TX 7 0.42% 29 0.059 24 80.2% 14 90.0 39 3.27 28 4.67 28 30% 23 3.6% 13 3.6% 22 0.92 21 2.8% 40 0.3% 49 4.26 10 0.15%
Georgia 18 64.8 19 1.9% 22 30.3% 26 0.39 29 12.5 33 13.0 14 103.1% 10 12.5% 12 $63,579 14 3.5% 8 41.6% 14 0.011% 13 5.60 GA 4 0.43% 37 0.049 26 79.9% 25 86.7 32 4.00 20 5.23 39 26% 26 3.4% 28 2.9% 15 1.10 32 2.2% 29 0.5% 33 4.68 16 0.11%
Michigan 19 64.5 29 1.6% 18 30.7% 33 0.38 13 13.6 38 12.8 15 103.0% 33 9.2% 18 $56,877 26 2.8% 24 34.8% 35 0.004% 7 6.36 MI 41 0.23% 18 0.073 23 80.8% 1 100.0 30 4.56 33 4.45 13 38% 18 3.9% 8 3.8% 10 1.32 2 5.9% 28 0.5% 20 5.01 32 0.02%
Illinois 20 64.3 23 1.8% 12 31.9% 13 0.44 21 12.8 10 14.0 20 100.2% 5 13.5% 21 $55,767 15 3.4% 28 32.7% 22 0.009% 20 5.31 IL 42 0.23% 22 0.062 28 79.9% 14 90.0 24 5.21 22 4.95 20 35% 21 3.6% 30 2.9% 26 0.86 18 3.0% 27 0.5% 12 5.37 11 0.13%
Florida 21 61.4 30 1.6% 34 28.2% 34 0.38 42 11.6 31 13.1 37 92.7% 19 10.8% 5 $94,440 36 2.3% 3 44.6% 23 0.009% 21 5.07 FL 10 0.39% 14 0.081 25 79.9% 25 86.7 18 6.09 15 5.71 37 27% 28 3.3% 32 2.7% 25 0.89 38 1.8% 45 0.3% 34 4.67 30 0.04%
Pennsylvania 22 60.6 26 1.7% 27 29.6% 30 0.39 41 11.7 16 13.7 18 101.9% 13 11.8% 34 $39,256 13 3.5% 27 33.4% 13 0.011% 19 5.31 PA 49 0.17% 26 0.061 37 78.1% 3 96.7 33 3.90 29 4.65 19 36% 17 4.0% 26 3.0% 29 0.81 12 3.4% 16 0.6% 14 5.32 17 0.10%
Rhode Island 23 60.5 21 1.8% 15 31.2% 15 0.43 50 8.7 3 14.5 44 85.3% 24 10.6% 50 $22,302 5 4.4% 10 40.0% 38 0.003% 32 4.15 RI 39 0.24% 30 0.058 29 79.8% 34 83.3 3 7.63 6 6.72 8 46% 16 4.1% 19 3.1% 30 0.81 33 2.1% 3 1.5% 50 3.94 20 0.09%
Idaho 24 60.5 20 1.8% 19 30.5% 38 0.37 39 11.8 35 13.0 48 81.6% 43 7.7% 10 $65,365 47 1.6% 4 44.0% 27 0.006% 32 4.15 ID 11 0.39% 13 0.083 10 84.1% 48 76.7 11 6.98 25 4.87 31 29% 11 4.6% 17 3.2% 5 1.56 11 3.6% 9 0.7% 13 5.34 41 0.01%
North Carolina 25 60.2 16 2.0% 28 29.2% 29 0.39 18 13.1 23 13.4 12 104.8% 22 10.7% 31 $41,099 11 3.6% 23 35.0% 16 0.011% 17 5.40 NC 21 0.31% 42 0.044 40 76.5% 34 83.3 23 5.22 38 3.99 15 37% 20 3.8% 21 3.1% 31 0.76 31 2.2% 18 0.6% 19 5.01 21 0.09%
Nevada 26 59.0 47 1.1% 50 22.5% 44 0.33 23 12.7 43 12.4 2 125.4% 41 8.3% 3 $103,904 30 2.5% 13 38.3% 15 0.011% 32 4.15 NV 2 0.45% 15 0.080 8 84.3% 34 83.3 49 1.66 17 5.46 42 24% 41 2.2% 48 1.7% 6 1.53 17 3.0% 50 0.2% 17 5.20 38 0.01%
Maine 27 58.9 43 1.2% 25 30.0% 24 0.39 11 13.7 21 13.6 27 97.2% 38 8.5% 37 $38,105 9 3.8% 11 39.9% 46 0.001% 32 4.15 ME 20 0.32% 45 0.040 21 81.7% 34 83.3 3 7.63 37 4.26 8 46% 38 2.4% 45 2.0% 34 0.66 26 2.6% 35 0.4% 4 6.03 24 0.08%
Alaska 28 58.7 31 1.5% 13 31.6% 19 0.42 32 12.4 39 12.8 38 92.4% 28 9.7% 39 $37,411 20 3.0% 1 46.1% 49 0.000% 32 4.15 AK 6 0.42% 35 0.050 2 88.6% 34 83.3 26 4.67 35 4.32 45 23% 35 2.5% 12 3.7% 19 1.03 46 1.2% 36 0.4% 32 4.72 46 0.00%
Kansas 29 57.7 24 1.8% 31 28.7% 17 0.43 4 14.2 37 12.9 43 87.4% 32 9.3% 41 $35,929 21 3.0% 31 32.1% 19 0.010% 32 4.15 KS 22 0.31% 32 0.057 6 84.8% 14 90.0 26 4.67 9 6.50 22 34% 29 3.3% 24 3.0% 32 0.75 45 1.4% 41 0.3% 36 4.59 26 0.06%
New Mexico 30 56.8 34 1.5% 21 30.4% 31 0.39 20 12.9 28 13.2 4 115.0% 45 6.8% 46 $27,124 48 1.4% 21 35.3% 41 0.002% 32 4.15 NM 27 0.29% 21 0.066 39 76.8% 25 86.7 38 3.46 47 2.67 25 32% 2 7.1% 18 3.2% 28 0.81 42 1.5% 1 6.6% 35 4.61 19 0.09%
Wisconsin 31 55.8 22 1.8% 36 28.0% 27 0.39 5 14.0 15 13.8 33 94.6% 25 10.2% 44 $34,432 39 2.2% 38 30.4% 39 0.003% 23 4.90 WI 47 0.21% 20 0.072 16 83.2% 34 83.3 19 5.55 21 5.22 4 47% 33 2.9% 27 3.0% 35 0.64 19 2.9% 26 0.5% 21 5.00 31 0.03%
Ohio 32 55.5 18 1.9% 30 29.1% 40 0.36 24 12.7 25 13.3 35 94.3% 17 11.1% 27 $42,450 17 3.2% 43 28.9% 31 0.005% 28 4.55 OH 29 0.28% 27 0.061 35 78.4% 25 86.7 36 3.57 41 3.76 4 47% 31 3.1% 20 3.1% 27 0.82 16 3.1% 20 0.6% 39 4.55 28 0.05%
Missouri 33 54.9 9 2.3% 23 30.1% 36 0.37 17 13.2 24 13.4 29 95.2% 15 11.3% 45 $34,203 34 2.3% 47 26.5% 34 0.004% 31 4.41 MO 17 0.35% 38 0.047 36 78.2% 5 93.3 42 2.91 39 3.89 10 42% 30 3.2% 22 3.1% 36 0.64 22 2.7% 33 0.4% 38 4.57 27 0.06%
North Dakota 34 54.1 40 1.3% 48 26.1% 22 0.42 3 14.5 26 13.2 23 98.6% 42 8.0% 20 $56,318 33 2.3% 22 35.2% 28 0.005% 32 4.15 ND 26 0.29% 23 0.062 27 79.9% 14 90.0 16 6.40 24 4.91 20 35% 39 2.4% 43 2.1% 41 0.52 35 2.0% 15 0.7% 43 4.44 36 0.01%
Nebraska 35 53.7 14 2.0% 37 27.8% 21 0.42 47 11.1 41 12.8 31 94.9% 11 12.2% 33 $40,115 41 2.0% 37 30.7% 47 0.001% 25 4.87 NE 28 0.29% 34 0.053 19 82.5% 25 86.7 13 6.83 19 5.37 25 32% 32 3.0% 29 2.9% 45 0.38 37 1.9% 24 0.5% 29 4.77 46 0.00%
Hawaii 36 53.5 44 1.2% 33 28.5% 14 0.43 28 12.5 5 14.3 46 83.0% 39 8.4% 40 $37,273 19 3.1% 33 31.9% 43 0.002% 32 4.15 HI 46 0.21% 39 0.046 34 78.6% 25 86.7 26 4.67 26 4.80 27 31% 40 2.3% 39 2.2% 3 1.76 27 2.5% 17 0.6% 16 5.21 45 0.00%
Montana 37 53.1 45 1.1% 32 28.5% 20 0.42 35 12.1 22 13.4 30 95.0% 49 6.5% 26 $42,603 50 1.1% 7 42.6% 33 0.004% 12 5.65 MT 13 0.36% 25 0.062 41 75.7% 34 83.3 12 6.96 48 2.56 35 28% 43 2.1% 37 2.4% 20 0.97 30 2.3% 12 0.7% 7 5.92 40 0.01%
Iowa 38 52.9 28 1.6% 38 27.7% 35 0.37 34 12.1 20 13.7 19 100.5% 26 10.0% 43 $35,020 38 2.2% 44 28.6% 45 0.001% 22 4.99 IA 31 0.27% 33 0.055 31 79.5% 34 83.3 15 6.50 27 4.71 4 47% 37 2.5% 36 2.4% 38 0.56 13 3.3% 30 0.5% 31 4.72 33 0.02%
Tennessee 39 52.2 32 1.5% 35 28.0% 42 0.34 8 13.8 30 13.1 28 95.4% 36 9.0% 19 $56,419 18 3.2% 49 24.5% 21 0.009% 2 6.84 TN 15 0.35% 43 0.041 47 72.2% 5 93.3 47 2.17 40 3.83 37 27% 34 2.5% 38 2.3% 39 0.56 40 1.6% 7 0.9% 22 4.99 29 0.04%
South Carolina 40 49.8 38 1.3% 42 27.1% 39 0.37 31 12.4 36 12.9 26 97.3% 35 9.0% 11 $63,916 7 4.3% 30 32.1% 37 0.003% 32 4.15 SC 34 0.26% 44 0.040 44 74.4% 48 76.7 43 2.71 45 3.14 40 25% 36 2.5% 33 2.7% 42 0.50 39 1.8% 22 0.6% 9 5.60 35 0.01%
Wyoming 41 49.5 49 0.8% 43 26.6% 32 0.39 1 15.5 40 12.8 39 91.8% 50 6.4% 30 $41,187 43 1.9% 19 35.9% 49 0.000% 1 6.90 WY 45 0.22% 10 0.086 7 84.4% 44 80.0 17 6.25 32 4.45 42 24% 50 1.4% 41 2.2% 16 1.10 47 1.1% 49 0.2% 41 4.49 46 0.00%
Indiana 42 49.4 36 1.3% 45 26.5% 43 0.34 26 12.6 34 13.0 25 97.4% 44 7.5% 35 $38,517 10 3.8% 32 31.9% 25 0.007% 15 5.48 IN 48 0.20% 41 0.045 43 74.7% 48 76.7 26 4.67 43 3.55 15 37% 27 3.3% 34 2.6% 40 0.53 20 2.9% 34 0.4% 47 4.30 22 0.08%
South Dakota 43 48.0 41 1.3% 47 26.4% 28 0.39 2 14.7 47 12.2 50 79.3% 34 9.1% 49 $24,756 49 1.3% 26 33.4% 42 0.002% 11 5.89 SD 35 0.26% 24 0.062 22 81.0% 5 93.3 25 5.10 30 4.52 12 39% 44 2.0% 44 2.1% 46 0.33 44 1.5% 44 0.3% 28 4.81 39 0.01%
Louisiana 44 46.1 48 0.8% 44 26.5% 48 0.31 44 11.4 42 12.5 6 108.4% 27 10.0% 7 $79,970 40 2.0% 40 29.9% 40 0.002% 32 4.15 LA 9 0.40% 36 0.050 42 74.9% 14 90.0 44 2.49 36 4.29 50 20% 48 1.8% 46 1.9% 44 0.39 49 0.8% 37 0.4% 42 4.46 37 0.01%
Kentucky 45 45.7 42 1.3% 39 27.5% 46 0.31 46 11.3 46 12.3 41 89.2% 37 9.0% 17 $60,202 8 3.8% 34 30.9% 36 0.004% 29 4.52 KY 18 0.33% 48 0.030 48 72.0% 5 93.3 45 2.19 46 2.90 31 29% 42 2.2% 42 2.1% 43 0.44 43 1.5% 42 0.3% 44 4.42 42 0.01%
Alabama 46 45.7 35 1.4% 40 27.5% 45 0.33 16 13.2 49 12.2 36 93.6% 40 8.4% 38 $38,074 16 3.3% 45 27.5% 26 0.006% 32 4.15 AL 36 0.26% 46 0.035 45 74.2% 44 80.0 46 2.18 44 3.22 47 22% 25 3.4% 25 3.0% 48 0.29 41 1.6% 6 1.0% 10 5.51 44 0.00%
Oklahoma 47 45.5 37 1.3% 29 29.2% 41 0.34 45 11.4 45 12.3 34 94.4% 31 9.4% 47 $26,730 46 1.7% 29 32.2% 24 0.008% 4 6.52 OK 32 0.26% 40 0.045 38 77.3% 44 80.0 30 4.56 42 3.56 31 29% 45 2.0% 40 2.2% 37 0.59 48 1.1% 47 0.3% 45 4.39 34 0.02%
Arkansas 48 41.7 39 1.3% 46 26.5% 49 0.29 27 12.5 44 12.4 47 82.8% 30 9.5% 48 $25,064 37 2.2% 14 37.4% 48 0.001% 32 4.15 AR 14 0.36% 49 0.029 50 70.9% 14 90.0 41 3.16 49 1.73 31 29% 47 1.9% 47 1.8% 50 0.20 34 2.0% 46 0.3% 25 4.88 46 0.00%
West Virginia 49 37.9 46 1.1% 41 27.3% 50 0.26 48 10.7 50 11.9 45 85.1% 48 6.5% 29 $41,685 27 2.7% 41 29.2% 44 0.001% 32 4.15 WV 50 0.16% 47 0.034 46 72.9% 14 90.0 39 3.27 31 4.47 47 22% 46 2.0% 49 1.7% 47 0.30 36 1.9% 10 0.7% 46 4.32 43 0.00%
Mississippi 50 37.4 50 0.6% 49 25.4% 47 0.31 14 13.4 48 12.2 32 94.7% 46 6.7% 32 $40,876 45 1.7% 42 29.0% 30 0.005% 32 4.15 MI 16 0.35% 50 0.020 49 71.4% 14 90.0 48 2.16 50 1.66 42 24% 49 1.5% 50 1.4% 49 0.25 50 0.7% 19 0.6% 30 4.74 46 0.00%
U.S. Average - 61.0 - 2.0% - 30.9% - 0.41 - 12.4 - 13.4 - 100% - 11.5% - $62,611 - 3.0% - 33.0% - 0.017% - 5.00 U.S. - 0.33% - 0.076 - 80.2% - 87.7 - 5.00 - 5.00 - 36% - 4.1% - 3.5% - 1.08 - 3.6% - 0.7% - 5.00 - 0.23%
StateEntrepreneurial
ActivityInventor Patents
Online Population E-government
Online Agriculture
Broadband Tele-communication
Health IT
High-Tech Jobs
Scientists and Engineers Patents
Industry Investment
in R&D
Non-Industry Investment in
R&D
Movement Toward a Green
EconomyVenture Capital

14 | In fo rmat ion Techno logy and Innovat ion Foundat ion | The 2012 S ta te New economy Index
Indicator Scores by Statethe Index
State rank Score rank Score rank Score rank Score rank Score rank Score rank Score rank Score rank Score rank Score rank Score rank Score rank Score rank Score rank Score rank Score rank Score rank Score rank Score rank Score rank Score rank Score rank Score rank Score rank Score rank Score rank Score
Alabama 46 45.7 35 1.4% 40 27.5% 45 0.33 16 13.2 49 12.2 36 93.6% 40 8.4% 38 $38,074 16 3.3% 45 27.5% 26 0.006% 32 4.15 AL 36 0.26% 46 0.035 45 74.2% 44 80.0 46 2.18 44 3.22 47 22% 25 3.4% 25 3.0% 48 0.29 41 1.6% 6 1.0% 10 5.51 44 0.00%
Alaska 28 58.7 31 1.5% 13 31.6% 19 0.42 32 12.4 39 12.8 38 92.4% 28 9.7% 39 $37,411 20 3.0% 1 46.1% 49 0.000% 32 4.15 AK 6 0.42% 35 0.050 2 88.6% 34 83.3 26 4.67 35 4.32 45 23% 35 2.5% 12 3.7% 19 1.03 46 1.2% 36 0.4% 32 4.72 46 0.00%
Arizona 16 66.7 11 2.1% 16 30.8% 25 0.39 33 12.1 29 13.1 8 106.9% 16 11.1% 22 $52,884 35 2.3% 6 42.9% 17 0.011% 30 4.50 AZ 5 0.42% 17 0.078 13 83.5% 14 90.0 49 1.66 10 6.36 22 34% 19 3.8% 15 3.5% 24 0.91 14 3.1% 14 0.7% 8 5.78 14 0.11%
Arkansas 48 41.7 39 1.3% 46 26.5% 49 0.29 27 12.5 44 12.4 47 82.8% 30 9.5% 48 $25,064 37 2.2% 14 37.4% 48 0.001% 32 4.15 AR 14 0.36% 49 0.029 50 70.9% 14 90.0 41 3.16 49 1.73 31 29% 47 1.9% 47 1.8% 50 0.20 34 2.0% 46 0.3% 25 4.88 46 0.00%
California 4 79.1 10 2.1% 9 32.9% 16 0.43 36 12.0 12 14.0 13 103.4% 8 12.8% 15 $62,481 25 2.9% 48 25.7% 5 0.019% 8 6.15 CA 1 0.46% 2 0.135 9 84.2% 5 93.3 22 5.31 13 6.08 40 25% 5 6.0% 6 4.6% 4 1.63 5 4.7% 11 0.7% 23 4.98 1 0.89%
Colorado 7 76.8 6 2.7% 6 33.4% 3 0.51 9 13.8 14 13.8 21 99.9% 12 11.9% 42 $35,210 31 2.4% 5 44.0% 9 0.017% 9 5.96 CO 3 0.44% 9 0.089 18 82.7% 5 93.3 14 6.64 16 5.63 35 28% 6 5.8% 5 5.1% 11 1.32 23 2.7% 13 0.7% 48 4.30 3 0.28%
Connecticut 9 76.0 12 2.0% 4 34.8% 4 0.50 38 11.8 8 14.1 9 106.5% 3 15.3% 23 $48,952 3 4.6% 50 24.0% 8 0.017% 5 6.44 CT 25 0.29% 7 0.104 20 82.0% 25 86.7 3 7.63 11 6.32 15 37% 15 4.1% 14 3.5% 12 1.30 3 5.7% 39 0.4% 6 5.93 23 0.08%
Delaware 2 82.1 3 2.8% 20 30.5% 23 0.41 40 11.8 27 13.2 22 99.4% 1 16.6% 2 $117,608 2 4.8% 12 38.3% 7 0.018% 32 4.15 DE 38 0.24% 31 0.058 33 79.1% 25 86.7 34 3.80 1 9.36 15 37% 12 4.5% 9 3.8% 2 1.80 1 11.7% 48 0.3% 27 4.82 25 0.07%
Florida 21 61.4 30 1.6% 34 28.2% 34 0.38 42 11.6 31 13.1 37 92.7% 19 10.8% 5 $94,440 36 2.3% 3 44.6% 23 0.009% 21 5.07 FL 10 0.39% 14 0.081 25 79.9% 25 86.7 18 6.09 15 5.71 37 27% 28 3.3% 32 2.7% 25 0.89 38 1.8% 45 0.3% 34 4.67 30 0.04%
Georgia 18 64.8 19 1.9% 22 30.3% 26 0.39 29 12.5 33 13.0 14 103.1% 10 12.5% 12 $63,579 14 3.5% 8 41.6% 14 0.011% 13 5.60 GA 4 0.43% 37 0.049 26 79.9% 25 86.7 32 4.00 20 5.23 39 26% 26 3.4% 28 2.9% 15 1.10 32 2.2% 29 0.5% 33 4.68 16 0.11%
Hawaii 36 53.5 44 1.2% 33 28.5% 14 0.43 28 12.5 5 14.3 46 83.0% 39 8.4% 40 $37,273 19 3.1% 33 31.9% 43 0.002% 32 4.15 HI 46 0.21% 39 0.046 34 78.6% 25 86.7 26 4.67 26 4.80 27 31% 40 2.3% 39 2.2% 3 1.76 27 2.5% 17 0.6% 16 5.21 45 0.00%
Idaho 24 60.5 20 1.8% 19 30.5% 38 0.37 39 11.8 35 13.0 48 81.6% 43 7.7% 10 $65,365 47 1.6% 4 44.0% 27 0.006% 32 4.15 ID 11 0.39% 13 0.083 10 84.1% 48 76.7 11 6.98 25 4.87 31 29% 11 4.6% 17 3.2% 5 1.56 11 3.6% 9 0.7% 13 5.34 41 0.01%
Illinois 20 64.3 23 1.8% 12 31.9% 13 0.44 21 12.8 10 14.0 20 100.2% 5 13.5% 21 $55,767 15 3.4% 28 32.7% 22 0.009% 20 5.31 IL 42 0.23% 22 0.062 28 79.9% 14 90.0 24 5.21 22 4.95 20 35% 21 3.6% 30 2.9% 26 0.86 18 3.0% 27 0.5% 12 5.37 11 0.13%
Indiana 42 49.4 36 1.3% 45 26.5% 43 0.34 26 12.6 34 13.0 25 97.4% 44 7.5% 35 $38,517 10 3.8% 32 31.9% 25 0.007% 15 5.48 IN 48 0.20% 41 0.045 43 74.7% 48 76.7 26 4.67 43 3.55 15 37% 27 3.3% 34 2.6% 40 0.53 20 2.9% 34 0.4% 47 4.30 22 0.08%
Iowa 38 52.9 28 1.6% 38 27.7% 35 0.37 34 12.1 20 13.7 19 100.5% 26 10.0% 43 $35,020 38 2.2% 44 28.6% 45 0.001% 22 4.99 IA 31 0.27% 33 0.055 31 79.5% 34 83.3 15 6.50 27 4.71 4 47% 37 2.5% 36 2.4% 38 0.56 13 3.3% 30 0.5% 31 4.72 33 0.02%
Kansas 29 57.7 24 1.8% 31 28.7% 17 0.43 4 14.2 37 12.9 43 87.4% 32 9.3% 41 $35,929 21 3.0% 31 32.1% 19 0.010% 32 4.15 KS 22 0.31% 32 0.057 6 84.8% 14 90.0 26 4.67 9 6.50 22 34% 29 3.3% 24 3.0% 32 0.75 45 1.4% 41 0.3% 36 4.59 26 0.06%
Kentucky 45 45.7 42 1.3% 39 27.5% 46 0.31 46 11.3 46 12.3 41 89.2% 37 9.0% 17 $60,202 8 3.8% 34 30.9% 36 0.004% 29 4.52 KY 18 0.33% 48 0.030 48 72.0% 5 93.3 45 2.19 46 2.90 31 29% 42 2.2% 42 2.1% 43 0.44 43 1.5% 42 0.3% 44 4.42 42 0.01%
Louisiana 44 46.1 48 0.8% 44 26.5% 48 0.31 44 11.4 42 12.5 6 108.4% 27 10.0% 7 $79,970 40 2.0% 40 29.9% 40 0.002% 32 4.15 LA 9 0.40% 36 0.050 42 74.9% 14 90.0 44 2.49 36 4.29 50 20% 48 1.8% 46 1.9% 44 0.39 49 0.8% 37 0.4% 42 4.46 37 0.01%
Maine 27 58.9 43 1.2% 25 30.0% 24 0.39 11 13.7 21 13.6 27 97.2% 38 8.5% 37 $38,105 9 3.8% 11 39.9% 46 0.001% 32 4.15 ME 20 0.32% 45 0.040 21 81.7% 34 83.3 3 7.63 37 4.26 8 46% 38 2.4% 45 2.0% 34 0.66 26 2.6% 35 0.4% 4 6.03 24 0.08%
Maryland 5 79.1 2 2.9% 2 37.2% 2 0.51 6 13.9 9 14.0 11 105.6% 23 10.7% 24 $48,258 24 2.9% 20 35.6% 3 0.026% 14 5.52 MD 30 0.27% 11 0.085 15 83.3% 14 90.0 34 3.80 4 7.50 28 30% 4 6.4% 4 5.3% 17 1.06 24 2.6% 2 4.4% 26 4.84 15 0.11%
Massachusetts 1 92.4 5 2.8% 1 37.9% 1 0.55 12 13.7 2 14.7 16 102.5% 9 12.7% 14 $62,836 6 4.3% 35 30.8% 2 0.028% 3 6.64 MA 23 0.29% 5 0.117 11 83.8% 14 90.0 3 7.63 2 8.57 2 57% 1 7.8% 3 5.4% 9 1.34 8 4.1% 4 1.4% 37 4.59 2 0.86%
Michigan 19 64.5 29 1.6% 18 30.7% 33 0.38 13 13.6 38 12.8 15 103.0% 33 9.2% 18 $56,877 26 2.8% 24 34.8% 35 0.004% 7 6.36 MI 41 0.23% 18 0.073 23 80.8% 1 100.0 30 4.56 33 4.45 13 38% 18 3.9% 8 3.8% 10 1.32 2 5.9% 28 0.5% 20 5.01 32 0.02%
Minnesota 13 69.7 8 2.4% 10 32.7% 10 0.46 25 12.6 17 13.7 17 102.1% 4 14.1% 28 $42,307 29 2.6% 25 33.5% 18 0.010% 26 4.82 MN 44 0.22% 12 0.085 14 83.4% 5 93.3 20 5.54 23 4.94 1 61% 13 4.4% 11 3.7% 13 1.17 6 4.5% 38 0.4% 24 4.92 12 0.11%
Mississippi 50 37.4 50 0.6% 49 25.4% 47 0.31 14 13.4 48 12.2 32 94.7% 46 6.7% 32 $40,876 45 1.7% 42 29.0% 30 0.005% 32 4.15 MS 16 0.35% 50 0.020 49 71.4% 14 90.0 48 2.16 50 1.66 42 24% 49 1.5% 50 1.4% 49 0.25 50 0.7% 19 0.6% 30 4.74 46 0.00%
Missouri 33 54.9 9 2.3% 23 30.1% 36 0.37 17 13.2 24 13.4 29 95.2% 15 11.3% 45 $34,203 34 2.3% 47 26.5% 34 0.004% 31 4.41 MO 17 0.35% 38 0.047 36 78.2% 5 93.3 42 2.91 39 3.89 10 42% 30 3.2% 22 3.1% 36 0.64 22 2.7% 33 0.4% 38 4.57 27 0.06%
Montana 37 53.1 45 1.1% 32 28.5% 20 0.42 35 12.1 22 13.4 30 95.0% 49 6.5% 26 $42,603 50 1.1% 7 42.6% 33 0.004% 12 5.65 MT 13 0.36% 25 0.062 41 75.7% 34 83.3 12 6.96 48 2.56 35 28% 43 2.1% 37 2.4% 20 0.97 30 2.3% 12 0.7% 7 5.92 40 0.01%
Nebraska 35 53.7 14 2.0% 37 27.8% 21 0.42 47 11.1 41 12.8 31 94.9% 11 12.2% 33 $40,115 41 2.0% 37 30.7% 47 0.001% 25 4.87 NE 28 0.29% 34 0.053 19 82.5% 25 86.7 13 6.83 19 5.37 25 32% 32 3.0% 29 2.9% 45 0.38 37 1.9% 24 0.5% 29 4.77 46 0.00%
Nevada 26 59.0 47 1.1% 50 22.5% 44 0.33 23 12.7 43 12.4 2 125.4% 41 8.3% 3 $103,904 30 2.5% 13 38.3% 15 0.011% 32 4.15 NV 2 0.45% 15 0.080 8 84.3% 34 83.3 49 1.66 17 5.46 42 24% 41 2.2% 48 1.7% 6 1.53 17 3.0% 50 0.2% 17 5.20 38 0.01%
N Hampshire 12 71.9 15 2.0% 14 31.5% 8 0.47 49 10.4 4 14.4 42 87.6% 20 10.8% 36 $38,456 1 4.9% 15 36.8% 20 0.010% 32 4.15 NH 33 0.26% 4 0.123 4 86.4% 44 80.0 3 7.63 5 7.09 3 50% 9 5.4% 10 3.7% 33 0.71 7 4.4% 21 0.6% 1 6.33 9 0.16%
New Jersey 10 75.6 7 2.6% 7 33.0% 6 0.48 30 12.4 11 14.0 40 91.1% 7 13.0% 16 $61,580 4 4.5% 36 30.7% 10 0.016% 18 5.34 NJ 37 0.26% 8 0.100 17 82.9% 34 83.3 1 8.04 3 7.84 45 23% 7 5.7% 7 4.0% 7 1.44 4 5.4% 43 0.3% 15 5.27 13 0.11%
New Mexico 30 56.8 34 1.5% 21 30.4% 31 0.39 20 12.9 28 13.2 4 115.0% 45 6.8% 46 $27,124 48 1.4% 21 35.3% 41 0.002% 32 4.15 NM 27 0.29% 21 0.066 39 76.8% 25 86.7 38 3.46 47 2.67 25 32% 2 7.1% 18 3.2% 28 0.81 42 1.5% 1 6.6% 35 4.61 19 0.09%
New York 11 72.5 13 2.0% 11 32.6% 9 0.46 37 11.9 7 14.1 24 98.0% 2 15.8% 8 $78,006 12 3.5% 16 36.7% 12 0.013% 16 5.42 NY 12 0.37% 19 0.073 32 79.3% 5 93.3 21 5.44 7 6.67 28 30% 24 3.6% 31 2.7% 8 1.35 29 2.3% 31 0.5% 11 5.37 5 0.23%
North Carolina 25 60.2 16 2.0% 28 29.2% 29 0.39 18 13.1 23 13.4 12 104.8% 22 10.7% 31 $41,099 11 3.6% 23 35.0% 16 0.011% 17 5.40 NC 21 0.31% 42 0.044 40 76.5% 34 83.3 23 5.22 38 3.99 15 37% 20 3.8% 21 3.1% 31 0.76 31 2.2% 18 0.6% 19 5.01 21 0.09%
North Dakota 34 54.1 40 1.3% 48 26.1% 22 0.42 3 14.5 26 13.2 23 98.6% 42 8.0% 20 $56,318 33 2.3% 22 35.2% 28 0.005% 32 4.15 ND 26 0.29% 23 0.062 27 79.9% 14 90.0 16 6.40 24 4.91 20 35% 39 2.4% 43 2.1% 41 0.52 35 2.0% 15 0.7% 43 4.44 36 0.01%
Ohio 32 55.5 18 1.9% 30 29.1% 40 0.36 24 12.7 25 13.3 35 94.3% 17 11.1% 27 $42,450 17 3.2% 43 28.9% 31 0.005% 28 4.55 OH 29 0.28% 27 0.061 35 78.4% 25 86.7 36 3.57 41 3.76 4 47% 31 3.1% 20 3.1% 27 0.82 16 3.1% 20 0.6% 39 4.55 28 0.05%
Oklahoma 47 45.5 37 1.3% 29 29.2% 41 0.34 45 11.4 45 12.3 34 94.4% 31 9.4% 47 $26,730 46 1.7% 29 32.2% 24 0.008% 4 6.52 OK 32 0.26% 40 0.045 38 77.3% 44 80.0 30 4.56 42 3.56 31 29% 45 2.0% 40 2.2% 37 0.59 48 1.1% 47 0.3% 45 4.39 34 0.02%
Oregon 14 69.3 27 1.7% 17 30.8% 18 0.43 15 13.4 18 13.7 3 116.4% 18 10.8% 13 $63,231 42 1.9% 18 35.9% 32 0.005% 32 4.15 OR 24 0.29% 3 0.125 5 86.2% 5 93.3 2 7.86 14 6.06 10 42% 14 4.2% 23 3.1% 21 0.93 9 3.8% 32 0.4% 3 6.18 8 0.16%
Pennsylvania 22 60.6 26 1.7% 27 29.6% 30 0.39 41 11.7 16 13.7 18 101.9% 13 11.8% 34 $39,256 13 3.5% 27 33.4% 13 0.011% 19 5.31 PA 49 0.17% 26 0.061 37 78.1% 3 96.7 33 3.90 29 4.65 19 36% 17 4.0% 26 3.0% 29 0.81 12 3.4% 16 0.6% 14 5.32 17 0.10%
Rhode Island 23 60.5 21 1.8% 15 31.2% 15 0.43 50 8.7 3 14.5 44 85.3% 24 10.6% 50 $22,302 5 4.4% 10 40.0% 38 0.003% 32 4.15 RI 39 0.24% 30 0.058 29 79.8% 34 83.3 3 7.63 6 6.72 8 46% 16 4.1% 19 3.1% 30 0.81 33 2.1% 3 1.5% 50 3.94 20 0.09%
South Carolina 40 49.8 38 1.3% 42 27.1% 39 0.37 31 12.4 36 12.9 26 97.3% 35 9.0% 11 $63,916 7 4.3% 30 32.1% 37 0.003% 32 4.15 SC 34 0.26% 44 0.040 44 74.4% 48 76.7 43 2.71 45 3.14 40 25% 36 2.5% 33 2.7% 42 0.50 39 1.8% 22 0.6% 9 5.60 35 0.01%
South Dakota 43 48.0 41 1.3% 47 26.4% 28 0.39 2 14.7 47 12.2 50 79.3% 34 9.1% 49 $24,756 49 1.3% 26 33.4% 42 0.002% 11 5.89 SD 35 0.26% 24 0.062 22 81.0% 5 93.3 25 5.10 30 4.52 12 39% 44 2.0% 44 2.1% 46 0.33 44 1.5% 44 0.3% 28 4.81 39 0.01%
Tennessee 39 52.2 32 1.5% 35 28.0% 42 0.34 8 13.8 30 13.1 28 95.4% 36 9.0% 19 $56,419 18 3.2% 49 24.5% 21 0.009% 2 6.84 TN 15 0.35% 43 0.041 47 72.2% 5 93.3 47 2.17 40 3.83 37 27% 34 2.5% 38 2.3% 39 0.56 40 1.6% 7 0.9% 22 4.99 29 0.04%
Texas 17 65.7 17 2.0% 26 29.9% 37 0.37 43 11.5 32 13.1 10 106.5% 21 10.7% 1 $134,040 22 3.0% 39 30.4% 11 0.015% 6 6.38 TX 7 0.42% 29 0.059 24 80.2% 14 90.0 39 3.27 28 4.67 28 30% 23 3.6% 13 3.6% 22 0.92 21 2.8% 40 0.3% 49 4.26 10 0.15%
Utah 8 76.4 25 1.7% 24 30.1% 12 0.44 22 12.8 19 13.7 1 125.5% 14 11.7% 9 $74,282 44 1.8% 2 44.8% 4 0.023% 10 5.92 UT 19 0.33% 1 0.216 1 90.1% 1 100.0 9 7.53 12 6.19 49 21% 10 4.9% 16 3.3% 23 0.91 28 2.5% 23 0.5% 40 4.50 4 0.26%
Vermont 15 67.2 33 1.5% 8 32.9% 7 0.48 7 13.8 1 14.9 49 81.6% 47 6.6% 6 $88,916 28 2.6% 9 40.4% 29 0.005% 32 4.15 VT 8 0.42% 16 0.079 12 83.5% 34 83.3 3 7.63 34 4.37 4 47% 22 3.6% 35 2.5% 14 1.17 25 2.6% 25 0.5% 2 6.32 18 0.10%
Virginia 6 77.9 1 3.2% 3 35.2% 5 0.48 10 13.7 6 14.2 5 112.6% 6 13.3% 25 $44,767 23 3.0% 17 36.5% 1 0.032% 27 4.61 VA 43 0.22% 28 0.060 29 79.8% 3 96.7 37 3.50 18 5.44 24 33% 3 6.7% 2 6.0% 18 1.04 15 3.1% 5 1.3% 18 5.08 7 0.18%
Washington 3 79.5 4 2.8% 5 33.7% 11 0.46 19 13.0 13 13.9 7 107.3% 29 9.7% 4 $97,445 32 2.4% 46 27.3% 6 0.019% 24 4.90 WA 40 0.24% 6 0.105 3 88.4% 25 86.7 10 7.09 8 6.61 13 38% 8 5.7% 1 6.0% 1 2.70 10 3.6% 8 0.8% 5 5.96 6 0.18%
West Virginia 49 37.9 46 1.1% 41 27.3% 50 0.26 48 10.7 50 11.9 45 85.1% 48 6.5% 29 $41,685 27 2.7% 41 29.2% 44 0.001% 32 4.15 WV 50 0.16% 47 0.034 46 72.9% 14 90.0 39 3.27 31 4.47 47 22% 46 2.0% 49 1.7% 47 0.30 36 1.9% 10 0.7% 46 4.32 43 0.00%
Wisconsin 31 55.8 22 1.8% 36 28.0% 27 0.39 5 14.0 15 13.8 33 94.6% 25 10.2% 44 $34,432 39 2.2% 38 30.4% 39 0.003% 23 4.90 WI 47 0.21% 20 0.072 16 83.2% 34 83.3 19 5.55 21 5.22 4 47% 33 2.9% 27 3.0% 35 0.64 19 2.9% 26 0.5% 21 5.00 31 0.03%
Wyoming 41 49.5 49 0.8% 43 26.6% 32 0.39 1 15.5 40 12.8 39 91.8% 50 6.4% 30 $41,187 43 1.9% 19 35.9% 49 0.000% 1 6.90 WY 45 0.22% 10 0.086 7 84.4% 44 80.0 17 6.25 32 4.45 42 24% 50 1.4% 41 2.2% 16 1.10 47 1.1% 49 0.2% 41 4.49 46 0.00%
U.S. Average - 61.0 - 2.0% - 30.9% - 0.41 - 12.4 - 13.4 - 100% - 11.5% - $62,611 - 3.0% - 33.0% - 0.017% - 5.00 U.S. - 0.33% - 0.076 - 80.2% - 87.7 - 5.00 - 5.00 - 36% - 4.1% - 3.5% - 1.08 - 3.6% - 0.7% - 5.00 - 0.23%
OVERALL
Information Technology
Jobs
Managerial, Professional, and
Technical JobsWorkforce Education
Immigration of Knowledge
Workers
Migration of U.S. Knowledge
WorkersManufacturing Value Added
High-Wage Traded Services
Export Focus of Manufacturing
and ServicesForeign Direct
InvestmentJob
ChurningFast Growing
FirmsInitial Public
Offerings State

The 2012 S ta te New economy Index | I n fo rmat ion Techno logy and Innovat ion Foundat ion | 15
Indicator Scores by State the Index
State rank Score rank Score rank Score rank Score rank Score rank Score rank Score rank Score rank Score rank Score rank Score rank Score rank Score rank Score rank Score rank Score rank Score rank Score rank Score rank Score rank Score rank Score rank Score rank Score rank Score rank Score rank Score
Alabama 46 45.7 35 1.4% 40 27.5% 45 0.33 16 13.2 49 12.2 36 93.6% 40 8.4% 38 $38,074 16 3.3% 45 27.5% 26 0.006% 32 4.15 AL 36 0.26% 46 0.035 45 74.2% 44 80.0 46 2.18 44 3.22 47 22% 25 3.4% 25 3.0% 48 0.29 41 1.6% 6 1.0% 10 5.51 44 0.00%
Alaska 28 58.7 31 1.5% 13 31.6% 19 0.42 32 12.4 39 12.8 38 92.4% 28 9.7% 39 $37,411 20 3.0% 1 46.1% 49 0.000% 32 4.15 AK 6 0.42% 35 0.050 2 88.6% 34 83.3 26 4.67 35 4.32 45 23% 35 2.5% 12 3.7% 19 1.03 46 1.2% 36 0.4% 32 4.72 46 0.00%
Arizona 16 66.7 11 2.1% 16 30.8% 25 0.39 33 12.1 29 13.1 8 106.9% 16 11.1% 22 $52,884 35 2.3% 6 42.9% 17 0.011% 30 4.50 AZ 5 0.42% 17 0.078 13 83.5% 14 90.0 49 1.66 10 6.36 22 34% 19 3.8% 15 3.5% 24 0.91 14 3.1% 14 0.7% 8 5.78 14 0.11%
Arkansas 48 41.7 39 1.3% 46 26.5% 49 0.29 27 12.5 44 12.4 47 82.8% 30 9.5% 48 $25,064 37 2.2% 14 37.4% 48 0.001% 32 4.15 AR 14 0.36% 49 0.029 50 70.9% 14 90.0 41 3.16 49 1.73 31 29% 47 1.9% 47 1.8% 50 0.20 34 2.0% 46 0.3% 25 4.88 46 0.00%
California 4 79.1 10 2.1% 9 32.9% 16 0.43 36 12.0 12 14.0 13 103.4% 8 12.8% 15 $62,481 25 2.9% 48 25.7% 5 0.019% 8 6.15 CA 1 0.46% 2 0.135 9 84.2% 5 93.3 22 5.31 13 6.08 40 25% 5 6.0% 6 4.6% 4 1.63 5 4.7% 11 0.7% 23 4.98 1 0.89%
Colorado 7 76.8 6 2.7% 6 33.4% 3 0.51 9 13.8 14 13.8 21 99.9% 12 11.9% 42 $35,210 31 2.4% 5 44.0% 9 0.017% 9 5.96 CO 3 0.44% 9 0.089 18 82.7% 5 93.3 14 6.64 16 5.63 35 28% 6 5.8% 5 5.1% 11 1.32 23 2.7% 13 0.7% 48 4.30 3 0.28%
Connecticut 9 76.0 12 2.0% 4 34.8% 4 0.50 38 11.8 8 14.1 9 106.5% 3 15.3% 23 $48,952 3 4.6% 50 24.0% 8 0.017% 5 6.44 CT 25 0.29% 7 0.104 20 82.0% 25 86.7 3 7.63 11 6.32 15 37% 15 4.1% 14 3.5% 12 1.30 3 5.7% 39 0.4% 6 5.93 23 0.08%
Delaware 2 82.1 3 2.8% 20 30.5% 23 0.41 40 11.8 27 13.2 22 99.4% 1 16.6% 2 $117,608 2 4.8% 12 38.3% 7 0.018% 32 4.15 DE 38 0.24% 31 0.058 33 79.1% 25 86.7 34 3.80 1 9.36 15 37% 12 4.5% 9 3.8% 2 1.80 1 11.7% 48 0.3% 27 4.82 25 0.07%
Florida 21 61.4 30 1.6% 34 28.2% 34 0.38 42 11.6 31 13.1 37 92.7% 19 10.8% 5 $94,440 36 2.3% 3 44.6% 23 0.009% 21 5.07 FL 10 0.39% 14 0.081 25 79.9% 25 86.7 18 6.09 15 5.71 37 27% 28 3.3% 32 2.7% 25 0.89 38 1.8% 45 0.3% 34 4.67 30 0.04%
Georgia 18 64.8 19 1.9% 22 30.3% 26 0.39 29 12.5 33 13.0 14 103.1% 10 12.5% 12 $63,579 14 3.5% 8 41.6% 14 0.011% 13 5.60 GA 4 0.43% 37 0.049 26 79.9% 25 86.7 32 4.00 20 5.23 39 26% 26 3.4% 28 2.9% 15 1.10 32 2.2% 29 0.5% 33 4.68 16 0.11%
Hawaii 36 53.5 44 1.2% 33 28.5% 14 0.43 28 12.5 5 14.3 46 83.0% 39 8.4% 40 $37,273 19 3.1% 33 31.9% 43 0.002% 32 4.15 HI 46 0.21% 39 0.046 34 78.6% 25 86.7 26 4.67 26 4.80 27 31% 40 2.3% 39 2.2% 3 1.76 27 2.5% 17 0.6% 16 5.21 45 0.00%
Idaho 24 60.5 20 1.8% 19 30.5% 38 0.37 39 11.8 35 13.0 48 81.6% 43 7.7% 10 $65,365 47 1.6% 4 44.0% 27 0.006% 32 4.15 ID 11 0.39% 13 0.083 10 84.1% 48 76.7 11 6.98 25 4.87 31 29% 11 4.6% 17 3.2% 5 1.56 11 3.6% 9 0.7% 13 5.34 41 0.01%
Illinois 20 64.3 23 1.8% 12 31.9% 13 0.44 21 12.8 10 14.0 20 100.2% 5 13.5% 21 $55,767 15 3.4% 28 32.7% 22 0.009% 20 5.31 IL 42 0.23% 22 0.062 28 79.9% 14 90.0 24 5.21 22 4.95 20 35% 21 3.6% 30 2.9% 26 0.86 18 3.0% 27 0.5% 12 5.37 11 0.13%
Indiana 42 49.4 36 1.3% 45 26.5% 43 0.34 26 12.6 34 13.0 25 97.4% 44 7.5% 35 $38,517 10 3.8% 32 31.9% 25 0.007% 15 5.48 IN 48 0.20% 41 0.045 43 74.7% 48 76.7 26 4.67 43 3.55 15 37% 27 3.3% 34 2.6% 40 0.53 20 2.9% 34 0.4% 47 4.30 22 0.08%
Iowa 38 52.9 28 1.6% 38 27.7% 35 0.37 34 12.1 20 13.7 19 100.5% 26 10.0% 43 $35,020 38 2.2% 44 28.6% 45 0.001% 22 4.99 IA 31 0.27% 33 0.055 31 79.5% 34 83.3 15 6.50 27 4.71 4 47% 37 2.5% 36 2.4% 38 0.56 13 3.3% 30 0.5% 31 4.72 33 0.02%
Kansas 29 57.7 24 1.8% 31 28.7% 17 0.43 4 14.2 37 12.9 43 87.4% 32 9.3% 41 $35,929 21 3.0% 31 32.1% 19 0.010% 32 4.15 KS 22 0.31% 32 0.057 6 84.8% 14 90.0 26 4.67 9 6.50 22 34% 29 3.3% 24 3.0% 32 0.75 45 1.4% 41 0.3% 36 4.59 26 0.06%
Kentucky 45 45.7 42 1.3% 39 27.5% 46 0.31 46 11.3 46 12.3 41 89.2% 37 9.0% 17 $60,202 8 3.8% 34 30.9% 36 0.004% 29 4.52 KY 18 0.33% 48 0.030 48 72.0% 5 93.3 45 2.19 46 2.90 31 29% 42 2.2% 42 2.1% 43 0.44 43 1.5% 42 0.3% 44 4.42 42 0.01%
Louisiana 44 46.1 48 0.8% 44 26.5% 48 0.31 44 11.4 42 12.5 6 108.4% 27 10.0% 7 $79,970 40 2.0% 40 29.9% 40 0.002% 32 4.15 LA 9 0.40% 36 0.050 42 74.9% 14 90.0 44 2.49 36 4.29 50 20% 48 1.8% 46 1.9% 44 0.39 49 0.8% 37 0.4% 42 4.46 37 0.01%
Maine 27 58.9 43 1.2% 25 30.0% 24 0.39 11 13.7 21 13.6 27 97.2% 38 8.5% 37 $38,105 9 3.8% 11 39.9% 46 0.001% 32 4.15 ME 20 0.32% 45 0.040 21 81.7% 34 83.3 3 7.63 37 4.26 8 46% 38 2.4% 45 2.0% 34 0.66 26 2.6% 35 0.4% 4 6.03 24 0.08%
Maryland 5 79.1 2 2.9% 2 37.2% 2 0.51 6 13.9 9 14.0 11 105.6% 23 10.7% 24 $48,258 24 2.9% 20 35.6% 3 0.026% 14 5.52 MD 30 0.27% 11 0.085 15 83.3% 14 90.0 34 3.80 4 7.50 28 30% 4 6.4% 4 5.3% 17 1.06 24 2.6% 2 4.4% 26 4.84 15 0.11%
Massachusetts 1 92.4 5 2.8% 1 37.9% 1 0.55 12 13.7 2 14.7 16 102.5% 9 12.7% 14 $62,836 6 4.3% 35 30.8% 2 0.028% 3 6.64 MA 23 0.29% 5 0.117 11 83.8% 14 90.0 3 7.63 2 8.57 2 57% 1 7.8% 3 5.4% 9 1.34 8 4.1% 4 1.4% 37 4.59 2 0.86%
Michigan 19 64.5 29 1.6% 18 30.7% 33 0.38 13 13.6 38 12.8 15 103.0% 33 9.2% 18 $56,877 26 2.8% 24 34.8% 35 0.004% 7 6.36 MI 41 0.23% 18 0.073 23 80.8% 1 100.0 30 4.56 33 4.45 13 38% 18 3.9% 8 3.8% 10 1.32 2 5.9% 28 0.5% 20 5.01 32 0.02%
Minnesota 13 69.7 8 2.4% 10 32.7% 10 0.46 25 12.6 17 13.7 17 102.1% 4 14.1% 28 $42,307 29 2.6% 25 33.5% 18 0.010% 26 4.82 MN 44 0.22% 12 0.085 14 83.4% 5 93.3 20 5.54 23 4.94 1 61% 13 4.4% 11 3.7% 13 1.17 6 4.5% 38 0.4% 24 4.92 12 0.11%
Mississippi 50 37.4 50 0.6% 49 25.4% 47 0.31 14 13.4 48 12.2 32 94.7% 46 6.7% 32 $40,876 45 1.7% 42 29.0% 30 0.005% 32 4.15 MS 16 0.35% 50 0.020 49 71.4% 14 90.0 48 2.16 50 1.66 42 24% 49 1.5% 50 1.4% 49 0.25 50 0.7% 19 0.6% 30 4.74 46 0.00%
Missouri 33 54.9 9 2.3% 23 30.1% 36 0.37 17 13.2 24 13.4 29 95.2% 15 11.3% 45 $34,203 34 2.3% 47 26.5% 34 0.004% 31 4.41 MO 17 0.35% 38 0.047 36 78.2% 5 93.3 42 2.91 39 3.89 10 42% 30 3.2% 22 3.1% 36 0.64 22 2.7% 33 0.4% 38 4.57 27 0.06%
Montana 37 53.1 45 1.1% 32 28.5% 20 0.42 35 12.1 22 13.4 30 95.0% 49 6.5% 26 $42,603 50 1.1% 7 42.6% 33 0.004% 12 5.65 MT 13 0.36% 25 0.062 41 75.7% 34 83.3 12 6.96 48 2.56 35 28% 43 2.1% 37 2.4% 20 0.97 30 2.3% 12 0.7% 7 5.92 40 0.01%
Nebraska 35 53.7 14 2.0% 37 27.8% 21 0.42 47 11.1 41 12.8 31 94.9% 11 12.2% 33 $40,115 41 2.0% 37 30.7% 47 0.001% 25 4.87 NE 28 0.29% 34 0.053 19 82.5% 25 86.7 13 6.83 19 5.37 25 32% 32 3.0% 29 2.9% 45 0.38 37 1.9% 24 0.5% 29 4.77 46 0.00%
Nevada 26 59.0 47 1.1% 50 22.5% 44 0.33 23 12.7 43 12.4 2 125.4% 41 8.3% 3 $103,904 30 2.5% 13 38.3% 15 0.011% 32 4.15 NV 2 0.45% 15 0.080 8 84.3% 34 83.3 49 1.66 17 5.46 42 24% 41 2.2% 48 1.7% 6 1.53 17 3.0% 50 0.2% 17 5.20 38 0.01%
N Hampshire 12 71.9 15 2.0% 14 31.5% 8 0.47 49 10.4 4 14.4 42 87.6% 20 10.8% 36 $38,456 1 4.9% 15 36.8% 20 0.010% 32 4.15 NH 33 0.26% 4 0.123 4 86.4% 44 80.0 3 7.63 5 7.09 3 50% 9 5.4% 10 3.7% 33 0.71 7 4.4% 21 0.6% 1 6.33 9 0.16%
New Jersey 10 75.6 7 2.6% 7 33.0% 6 0.48 30 12.4 11 14.0 40 91.1% 7 13.0% 16 $61,580 4 4.5% 36 30.7% 10 0.016% 18 5.34 NJ 37 0.26% 8 0.100 17 82.9% 34 83.3 1 8.04 3 7.84 45 23% 7 5.7% 7 4.0% 7 1.44 4 5.4% 43 0.3% 15 5.27 13 0.11%
New Mexico 30 56.8 34 1.5% 21 30.4% 31 0.39 20 12.9 28 13.2 4 115.0% 45 6.8% 46 $27,124 48 1.4% 21 35.3% 41 0.002% 32 4.15 NM 27 0.29% 21 0.066 39 76.8% 25 86.7 38 3.46 47 2.67 25 32% 2 7.1% 18 3.2% 28 0.81 42 1.5% 1 6.6% 35 4.61 19 0.09%
New York 11 72.5 13 2.0% 11 32.6% 9 0.46 37 11.9 7 14.1 24 98.0% 2 15.8% 8 $78,006 12 3.5% 16 36.7% 12 0.013% 16 5.42 NY 12 0.37% 19 0.073 32 79.3% 5 93.3 21 5.44 7 6.67 28 30% 24 3.6% 31 2.7% 8 1.35 29 2.3% 31 0.5% 11 5.37 5 0.23%
North Carolina 25 60.2 16 2.0% 28 29.2% 29 0.39 18 13.1 23 13.4 12 104.8% 22 10.7% 31 $41,099 11 3.6% 23 35.0% 16 0.011% 17 5.40 NC 21 0.31% 42 0.044 40 76.5% 34 83.3 23 5.22 38 3.99 15 37% 20 3.8% 21 3.1% 31 0.76 31 2.2% 18 0.6% 19 5.01 21 0.09%
North Dakota 34 54.1 40 1.3% 48 26.1% 22 0.42 3 14.5 26 13.2 23 98.6% 42 8.0% 20 $56,318 33 2.3% 22 35.2% 28 0.005% 32 4.15 ND 26 0.29% 23 0.062 27 79.9% 14 90.0 16 6.40 24 4.91 20 35% 39 2.4% 43 2.1% 41 0.52 35 2.0% 15 0.7% 43 4.44 36 0.01%
Ohio 32 55.5 18 1.9% 30 29.1% 40 0.36 24 12.7 25 13.3 35 94.3% 17 11.1% 27 $42,450 17 3.2% 43 28.9% 31 0.005% 28 4.55 OH 29 0.28% 27 0.061 35 78.4% 25 86.7 36 3.57 41 3.76 4 47% 31 3.1% 20 3.1% 27 0.82 16 3.1% 20 0.6% 39 4.55 28 0.05%
Oklahoma 47 45.5 37 1.3% 29 29.2% 41 0.34 45 11.4 45 12.3 34 94.4% 31 9.4% 47 $26,730 46 1.7% 29 32.2% 24 0.008% 4 6.52 OK 32 0.26% 40 0.045 38 77.3% 44 80.0 30 4.56 42 3.56 31 29% 45 2.0% 40 2.2% 37 0.59 48 1.1% 47 0.3% 45 4.39 34 0.02%
Oregon 14 69.3 27 1.7% 17 30.8% 18 0.43 15 13.4 18 13.7 3 116.4% 18 10.8% 13 $63,231 42 1.9% 18 35.9% 32 0.005% 32 4.15 OR 24 0.29% 3 0.125 5 86.2% 5 93.3 2 7.86 14 6.06 10 42% 14 4.2% 23 3.1% 21 0.93 9 3.8% 32 0.4% 3 6.18 8 0.16%
Pennsylvania 22 60.6 26 1.7% 27 29.6% 30 0.39 41 11.7 16 13.7 18 101.9% 13 11.8% 34 $39,256 13 3.5% 27 33.4% 13 0.011% 19 5.31 PA 49 0.17% 26 0.061 37 78.1% 3 96.7 33 3.90 29 4.65 19 36% 17 4.0% 26 3.0% 29 0.81 12 3.4% 16 0.6% 14 5.32 17 0.10%
Rhode Island 23 60.5 21 1.8% 15 31.2% 15 0.43 50 8.7 3 14.5 44 85.3% 24 10.6% 50 $22,302 5 4.4% 10 40.0% 38 0.003% 32 4.15 RI 39 0.24% 30 0.058 29 79.8% 34 83.3 3 7.63 6 6.72 8 46% 16 4.1% 19 3.1% 30 0.81 33 2.1% 3 1.5% 50 3.94 20 0.09%
South Carolina 40 49.8 38 1.3% 42 27.1% 39 0.37 31 12.4 36 12.9 26 97.3% 35 9.0% 11 $63,916 7 4.3% 30 32.1% 37 0.003% 32 4.15 SC 34 0.26% 44 0.040 44 74.4% 48 76.7 43 2.71 45 3.14 40 25% 36 2.5% 33 2.7% 42 0.50 39 1.8% 22 0.6% 9 5.60 35 0.01%
South Dakota 43 48.0 41 1.3% 47 26.4% 28 0.39 2 14.7 47 12.2 50 79.3% 34 9.1% 49 $24,756 49 1.3% 26 33.4% 42 0.002% 11 5.89 SD 35 0.26% 24 0.062 22 81.0% 5 93.3 25 5.10 30 4.52 12 39% 44 2.0% 44 2.1% 46 0.33 44 1.5% 44 0.3% 28 4.81 39 0.01%
Tennessee 39 52.2 32 1.5% 35 28.0% 42 0.34 8 13.8 30 13.1 28 95.4% 36 9.0% 19 $56,419 18 3.2% 49 24.5% 21 0.009% 2 6.84 TN 15 0.35% 43 0.041 47 72.2% 5 93.3 47 2.17 40 3.83 37 27% 34 2.5% 38 2.3% 39 0.56 40 1.6% 7 0.9% 22 4.99 29 0.04%
Texas 17 65.7 17 2.0% 26 29.9% 37 0.37 43 11.5 32 13.1 10 106.5% 21 10.7% 1 $134,040 22 3.0% 39 30.4% 11 0.015% 6 6.38 TX 7 0.42% 29 0.059 24 80.2% 14 90.0 39 3.27 28 4.67 28 30% 23 3.6% 13 3.6% 22 0.92 21 2.8% 40 0.3% 49 4.26 10 0.15%
Utah 8 76.4 25 1.7% 24 30.1% 12 0.44 22 12.8 19 13.7 1 125.5% 14 11.7% 9 $74,282 44 1.8% 2 44.8% 4 0.023% 10 5.92 UT 19 0.33% 1 0.216 1 90.1% 1 100.0 9 7.53 12 6.19 49 21% 10 4.9% 16 3.3% 23 0.91 28 2.5% 23 0.5% 40 4.50 4 0.26%
Vermont 15 67.2 33 1.5% 8 32.9% 7 0.48 7 13.8 1 14.9 49 81.6% 47 6.6% 6 $88,916 28 2.6% 9 40.4% 29 0.005% 32 4.15 VT 8 0.42% 16 0.079 12 83.5% 34 83.3 3 7.63 34 4.37 4 47% 22 3.6% 35 2.5% 14 1.17 25 2.6% 25 0.5% 2 6.32 18 0.10%
Virginia 6 77.9 1 3.2% 3 35.2% 5 0.48 10 13.7 6 14.2 5 112.6% 6 13.3% 25 $44,767 23 3.0% 17 36.5% 1 0.032% 27 4.61 VA 43 0.22% 28 0.060 29 79.8% 3 96.7 37 3.50 18 5.44 24 33% 3 6.7% 2 6.0% 18 1.04 15 3.1% 5 1.3% 18 5.08 7 0.18%
Washington 3 79.5 4 2.8% 5 33.7% 11 0.46 19 13.0 13 13.9 7 107.3% 29 9.7% 4 $97,445 32 2.4% 46 27.3% 6 0.019% 24 4.90 WA 40 0.24% 6 0.105 3 88.4% 25 86.7 10 7.09 8 6.61 13 38% 8 5.7% 1 6.0% 1 2.70 10 3.6% 8 0.8% 5 5.96 6 0.18%
West Virginia 49 37.9 46 1.1% 41 27.3% 50 0.26 48 10.7 50 11.9 45 85.1% 48 6.5% 29 $41,685 27 2.7% 41 29.2% 44 0.001% 32 4.15 WV 50 0.16% 47 0.034 46 72.9% 14 90.0 39 3.27 31 4.47 47 22% 46 2.0% 49 1.7% 47 0.30 36 1.9% 10 0.7% 46 4.32 43 0.00%
Wisconsin 31 55.8 22 1.8% 36 28.0% 27 0.39 5 14.0 15 13.8 33 94.6% 25 10.2% 44 $34,432 39 2.2% 38 30.4% 39 0.003% 23 4.90 WI 47 0.21% 20 0.072 16 83.2% 34 83.3 19 5.55 21 5.22 4 47% 33 2.9% 27 3.0% 35 0.64 19 2.9% 26 0.5% 21 5.00 31 0.03%
Wyoming 41 49.5 49 0.8% 43 26.6% 32 0.39 1 15.5 40 12.8 39 91.8% 50 6.4% 30 $41,187 43 1.9% 19 35.9% 49 0.000% 1 6.90 WY 45 0.22% 10 0.086 7 84.4% 44 80.0 17 6.25 32 4.45 42 24% 50 1.4% 41 2.2% 16 1.10 47 1.1% 49 0.2% 41 4.49 46 0.00%
U.S. Average - 61.0 - 2.0% - 30.9% - 0.41 - 12.4 - 13.4 - 100% - 11.5% - $62,611 - 3.0% - 33.0% - 0.017% - 5.00 U.S. - 0.33% - 0.076 - 80.2% - 87.7 - 5.00 - 5.00 - 36% - 4.1% - 3.5% - 1.08 - 3.6% - 0.7% - 5.00 - 0.23%
StateEntrepreneurial
ActivityInventor Patents
Online Population E-government
Online Agriculture
Broadband Tele-communication
Health IT
High-Tech Jobs
Scientists and Engineers Patents
Industry Investment
in R&D
Non-Industry Investment in
R&D
Movement Toward a Green
EconomyVenture Capital

16 | In fo rmat ion Techno logy and Innovat ion Foundat ion | The 2012 S ta te New economy Index
the Index Summary of Results
SummAry of reSultS
The state that is farthest along on the path to the New Economy is Massachusetts, as it has been in all previous editions of the State New Economy
Index. Boasting a concentration of software, hardware, and biotech firms supported by world-class universities such as MIT and Harvard, Massachusetts survived the early 2000s downturn and was less hard hit than the nation as a whole during the Great Recession, at least in terms of job growth and per-capita income growth. However, Massachusetts no longer holds the commanding lead it held in the 2010 index; in this edition, it shares the top quartile with Delaware, Washington, California, and Maryland. Second-place Delaware is perhaps the most globalized of states, with business-friendly corporation law that attracts both domestic and foreign companies and supports a high-wage traded service sector. The state has moved up four ranks from 2010, driven by big improvements in entrepreneurship levels, R&D investment, and movement toward a green economy. Washington state, in third place, scores high due not only to its strength in software and aviation, but also because of the entrepreneurial hotbed of activity that has developed in the Puget Sound region, and heavy use of digital technologies in all its sectors. Fourth-ranked California thrives on innovation capacity, due in no small part to Silicon Valley and high-tech clusters in Southern California. California still dominates in venture capital, receiving 50 percent of all U.S. venture investments, and also scores extremely well across the board on R&D, patent, entrepreneurship and skilled workforce indicators.34
Maryland occupies fifth place and Virginia sixth. Their high rankings are primarily due to high concentrations of knowledge workers, many employed with the federal government or related contractors in the suburbs of Washington, D.C. Colorado, in seventh place, maintains a highly dynamic economy along with an educated workforce. The state is also a hotbed for venture capital investment in the middle of the country, ranking behind
only California and Massachusetts. Eighth-place Utah is ranked number one in economic dynamism while it ranks third in digital economy factors. Moreover, its high-tech manufacturing cluster centered around Salt Lake City and Provo support its first-place ranking in manufacturing value added. Ninth-place Connecticut’s success is not based on any one area or indicator. In fact Connecticut does not rank first on any of the 26 indicators; however, the state scores highly across most indicators, having a highly educated population, strong defense and financial industries, and robust R&D investment. New Jersey’s strong pharmaceutical industry, coupled with a high-tech agglomeration around Princeton, an advanced services sector in Northern New Jersey, and high levels of inward foreign direct investment help put it in tenth place. However, relative to its peers, the state has declined in many categories—most notably in entrepreneurial activity, health IT, and initial public offerings—which explains its fall from its fourth-place ranking in 2010.
In general, these top 10 New Economy states have more in common than just high-tech firms. They also tend to have a high concentration of managers, professionals, and college-educated residents working in “knowledge jobs” (jobs that require at least a two-year degree). In fact, the variable that is most closely correlated (0.84) with a high overall ranking is workforce education. With one or two exceptions, their manufacturers tend to be more geared toward global markets, both in terms of export orientation and the amount of foreign direct investment. Almost all are at the forefront of the IT revolution, with a large share of their institutions and residents embracing the digital economy. Most have a solid “innovation infrastructure” that fosters and supports technological innovation. Many have high levels of domestic and foreign immigration of highly mobile, highly skilled knowledge workers seeking good employment opportunities coupled with a high quality of life.

The 2012 S ta te New economy Index | I n fo rmat ion Techno logy and Innovat ion Foundat ion | 17
the IndexSummary of Results
While top-ranked states tend to be richer (there is a strong correlation of 0.64 between overall rank rankings and per-capita income), wealth is not a simple determinant of states’ progress in adapting to the New Economy. Some states with higher per-capita incomes lag behind in their scores (such as Hawaii, North Dakota and Wyoming), while other states with lower incomes do better than their incomes would predict (such as Arizona, Georgia, Michigan, North Carolina, and especially, Utah).
The two states whose economies have lagged the most in making the transition to the New Economy are Mississippi and West Virginia. Arkansas, Oklahoma, Alabama, Kentucky, Louisiana, South Dakota, Indiana and Wyoming round out the bottom 10. Historically, the economies of many of these Southern and Plains states depended on natural resources or on mass-production manufacturing, and relied on low costs rather than innovative capacity to gain competitive advantage. But, in the New Economy, innovative capacity (derived through universities, R&D investments, scientists and engineers, highly skilled workers, and entrepreneurial capabilities) is increasingly the driver of competitive success.
Regionally, the New Economy has taken hold most strongly in the Northeast, the mid-Atlantic, the Mountain West, and the Pacific regions; 14 of the top 20 states are in these four regions. (The six outside these regions are Georgia, Illinois, Michigan, Minnesota, Texas and Virginia.) In contrast, 17 of the 20 lowest-ranking states are in the Midwest, Great Plains, and the South. Given some states’ reputations as technology-based, New Economy states, their scores seem surprising at first. For example, North Carolina and New Mexico rank 24th and 32nd, respectively, in spite of the fact that the region around Research Triangle Park boasts top universities, a highly educated workforce, cutting-edge technology companies, and global connections, while Albuquerque and Los Alamos are home to leading
national laboratories. In both cases, however, many parts of the state outside these metropolitan regions are more rooted in the old economy—with more jobs in traditional manufacturing, agriculture, and lower-skilled services, a less-educated workforce, and a less-developed innovation infrastructure. As these examples reveal, most state economies are in fact a composite of many local economies that differ in the degree to which they are structured in accordance with New Economy factors.
Previous editions of the State New Economy Index have found strong correlations between the overall score on the index and the growth in per capita GDP. The natural resources boom following the recession has changed this, and now lower scoring states such as the Dakotas and Wyoming have seen booms in their income, while higher scoring states such as California have languished under the effects of the real estate market bust. Yet, while yielding impressive performance in the short term, resource booms are not a winning economic strategy for the long run. As history has shown, such an undiversified approach leaves an economy at the mercy of world price fluctuations that bring busts as well as booms. In fact, despite the recession, looking over the longer term, from 1997 (the earliest available data) to 2011 there are indeed positive correlations between the overall index score and both real GDP growth (0.30) and growth in real GDP per capita (0.17)—and, as previous indexes have found, prior to the recession and the resource boom those correlations were even higher.35
As the global economy recovers and reintegrates, the New Economy factors that drove income growth pre-recession will be the most important factors driving economic growth, and states that embrace the New Economy can expect to sustain greater per-capita GDP growth for the foreseeable future.

18 | In fo rmat ion Techno logy and Innovat ion Foundat ion | The 2012 S ta te New economy Index
Knowledge Jobsthe Index
KnoWledge JobSThe old economy was driven by workers who were skilled with their hands and who could reliably work in repetitive and sometimes physically demanding jobs. In the New Economy, knowledge-based jobs drive prosperity. These jobs tend to be managerial, professional and technical positions held by individuals with at least two years of college education. Such skilled and educated workers are the backbone of states’ most important industries, from high-value-added manufacturing to high-wage traded services.
The “knowledge jobs” indicators measure six aspects of knowledge-based employment: 1) employment in IT occupations in non-IT sectors; 2) the share of the private sector employed in managerial, professional, and technical occupations; 3) the education level of the workforce; 4) the average educational attainment of recent immigrants; 5) the average education attainment of recent U.S. interstate migrants 6) worker productivity in the manufacturing sector; and 7) employment in high-wage traded services.
2012 2012 2010 rank State Score rank* 1 Massachusetts 18.14 1
2 Virginia 17.57 4
3 Maryland 16.80 3
4 Connecticut 15.51 2
5 Colorado 15.25 11
6 Minnesota 14.28 6
7 Washington 14.26 8
8 New York 13.94 9
9 New Jersey 13.86 7
10 Utah 13.28 15
11 Delaware 13.20 5
12 California 13.02 13
13 Illinois 12.76 12
14 Oregon 12.55 21
15 New Hampshire 11.06 10
16 Arizona 11.02 27
17 Vermont 10.86 17
18 Georgia 10.80 26
19 North Carolina 10.76 28
20 Missouri 10.69 18
21 Pennsylvania 10.19 14
22 Wisconsin 9.97 22
23 Texas 9.85 32
24 Michigan 9.72 23
25 New Mexico 9.60 36
26 Nebraska 9.38 19
27 Alaska 9.38 30
28 Ohio 9.37 16
29 Kansas 9.35 20
30 Rhode Island 9.22 24
31 Maine 9.19 25
32 Iowa 8.95 29
33 North Dakota 8.74 31
34 Hawaii 8.35 37
35 Florida 8.13 33
36 Tennessee 7.86 40
37 Montana 7.58 43
38 South Carolina 7.26 38
39 Idaho 7.11 47
40 Nevada 6.97 45
41 Wyoming 6.75 48
42 South Dakota 6.61 34
43 Oklahoma 6.43 39
44 Indiana 6.35 35
45 Alabama 6.20 44
46 Louisiana 5.98 42
47 Kentucky 4.87 41
48 Arkansas 4.68 46
49 Mississippi 4.06 49
50 West Virginia 2.29 50
u.S. average 10.00
*Due to methodological changes, ranking comparisons are not exact.
Aggregated Knowledge Job Scores
100th–76th percentile 75th–51st percentile 50th–26th percentile 25th–1st percentile

The 2012 S ta te New economy Index | I n fo rmat ion Techno logy and Innovat ion Foundat ion | 19
the IndexKnowledge Jobs
Information Technology JobsEmployment in IT occupations in non-IT industries as a share of private sector employment
Why Is This Important? The IT revolution continues to transform the economy, as businesses in all industries use IT to find new ways to boost productivity, develop new products and services, and create new business models. The number of IT workers in non-IT industries is a good proxy to measure the extent to which traditional industries are making use of IT. IT workers, even in “traditional” industries, are bringing IT to an ever-growing list of applications, from standard website design, to tracking supply and product shipments in real time, to streamlining internal office operations, to finding new ways to communicate with customers. In fact, because of the continuing digital transformation of the economy, IT jobs grew by 22.2 percent between 2001 and 2011, versus only 0.2 percent for private sector employment in general.36
The Rankings: Even after controlling for the size of states’ software and IT-producing industries, most of the states with high scores are those with more technology-driven economies, including every one of the top five. In these
states, the creation of strong IT-producing industries leads to complementary work in non-IT fields. Number-one-ranked Virginia, for example, has the highest concentration of IT workers in both IT and non-IT industries.37 Low-scoring states tend to have natural resource-based or traditional manufacturing-based economies.
“IT jobs grew by 22.2 percent between 2001 and 2011, versus only 0.2 percent
for employment in general.”
The Top Fivepercentage of IT jobs in
non-IT industries
1 Virginia 3.2%
2 Maryland 2.9%
3 Delaware 2.8%
4 Washington 2.8%
5 Massachusetts 2.8%
u.S. average 2.0%
Source: Bureau of Labor Statistics, 2011
The Top Five movers 2010 rank 2012 rank rank Change
1 Arizona 20 11 +9
1 Vermont 42 33 +9
3 California 18 10 +8
3 Idaho 28 20 +8
3 Nebraska 22 14 +8
100th–76th percentile 75th–51st percentile 50th–26th percentile 25th–1st percentile
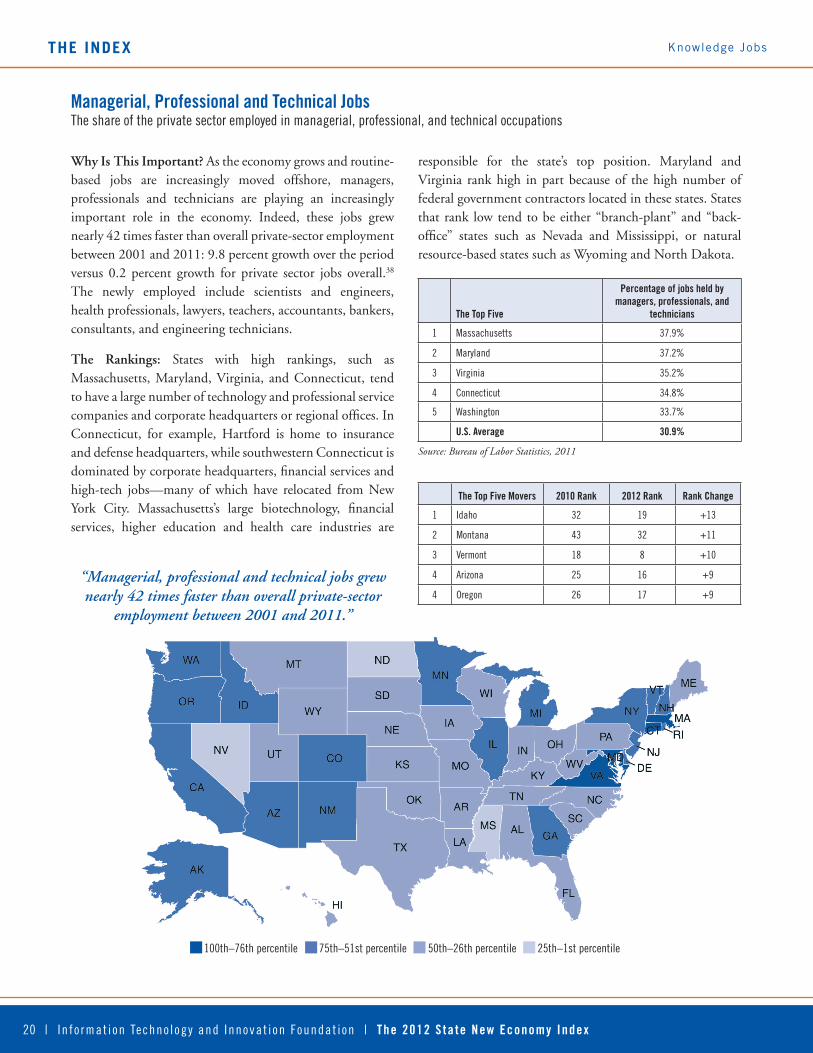
20 | In fo rmat ion Techno logy and Innovat ion Foundat ion | The 2012 S ta te New economy Index
the Index Knowledge Jobs
managerial, professional and Technical JobsThe share of the private sector employed in managerial, professional, and technical occupations
Why Is This Important? As the economy grows and routine-based jobs are increasingly moved offshore, managers, professionals and technicians are playing an increasingly important role in the economy. Indeed, these jobs grew nearly 42 times faster than overall private-sector employment between 2001 and 2011: 9.8 percent growth over the period versus 0.2 percent growth for private sector jobs overall.38 The newly employed include scientists and engineers, health professionals, lawyers, teachers, accountants, bankers, consultants, and engineering technicians.
The Rankings: States with high rankings, such as Massachusetts, Maryland, Virginia, and Connecticut, tend to have a large number of technology and professional service companies and corporate headquarters or regional offices. In Connecticut, for example, Hartford is home to insurance and defense headquarters, while southwestern Connecticut is dominated by corporate headquarters, financial services and high-tech jobs—many of which have relocated from New York City. Massachusetts’s large biotechnology, financial services, higher education and health care industries are
responsible for the state’s top position. Maryland and Virginia rank high in part because of the high number of federal government contractors located in these states. States that rank low tend to be either “branch-plant” and “back-office” states such as Nevada and Mississippi, or natural resource-based states such as Wyoming and North Dakota.
“Managerial, professional and technical jobs grew nearly 42 times faster than overall private-sector
employment between 2001 and 2011.”
100th–76th percentile 75th–51st percentile 50th–26th percentile 25th–1st percentile
The Top Five
percentage of jobs held by managers, professionals, and
technicians
1 Massachusetts 37.9%
2 Maryland 37.2%
3 Virginia 35.2%
4 Connecticut 34.8%
5 Washington 33.7%
u.S. average 30.9%
Source: Bureau of Labor Statistics, 2011
The Top Five movers 2010 rank 2012 rank rank Change
1 Idaho 32 19 +13
2 Montana 43 32 +11
3 Vermont 18 8 +10
4 Arizona 25 16 +9
4 Oregon 26 17 +9

The 2012 S ta te New economy Index | I n fo rmat ion Techno logy and Innovat ion Foundat ion | 21
Why Is This Important? In the New Economy, an educated workforce is critical to increasing productivity and fostering innovation. Fortunately, the American workforce has become more educated (at least in terms of number of years of schooling) to meet the economy’s increased need for skilled workers. In 2010, 28 percent of Americans over 25 years of age held at least a bachelor’s degree, up from 24 percent in 2000, 21 percent in 1990, and 16 percent in 1980.39 Unfortunately, it’s increasingly clear many of these graduates are failing to gain the competencies they need.40 One recent study found that over one-third of college graduates made no progress on the Collegiate Learning Assessment between the time they entered college and when they graduated.41
The Rankings: States such as Massachusetts, Maryland and Connecticut, with strong higher-education systems and high-tech industrial clusters tend to attract and retain
individuals with the most years of schooling. Colorado attracts individuals from other regions who, on average, have more years of schooling than those heading to other fast-growing Western states. Likewise, Virginia and Maryland are sustained, in part, by migration of highly educated individuals to the Washington, D.C., metropolitan area.42 Meanwhile, those that have historically invested less in education (like Alabama, Louisiana, Mississippi, and Nevada) tend to fall near the bottom.
the IndexKnowledge Jobs
workforce educationA weighted measure of the education attainment of residents aged 25 years and over
“In 2010, 28 percent of Americans over 25 years of age held at least a bachelor’s degree, up from 24 percent in 2000 and 21 percent in 1990.”
The Top Five Composite score
1 Massachusetts 0.55
2 Maryland 0.51
3 Colorado 0.51
4 Connecticut 0.50
5 Virginia 0.48
u.S. average 0.41
Source: Census Bureau, 2010
The Top Five movers 2010 rank 2012 rank rank Change
1 Georgia 34 26 +8
1 North Carolina 37 29 +8
3 California 22 16 +6
4 Rhode Island 20 15 +5
5 Arizona 29 25 +4
5 Illinois 17 13 +4
5 New Jersey 10 6 +4
5 New Mexico 35 31 +4
5 Texas 41 37 +4
100th–76th percentile 75th–51st percentile 50th–26th percentile 25th–1st percentile

22 | In fo rmat ion Techno logy and Innovat ion Foundat ion | The 2012 S ta te New economy Index
the Index Knowledge Jobs
Immigration of Knowledge workersThe average educational attainment of recent migrants from abroad aged 25 years and over
Why Is This Important? To compete in the New Economy, states need a supply of talented labor with the right skills and education to meet the demands of globally competitive businesses. And in a world with ever-increasing flows of talent across national borders, a small, but growing share of this talent pool is coming from overseas. In many cases, these workers do more than merely fill occupational gaps; by bringing new ideas and perspectives from other countries and cultures, they can enhance states’ levels of innovation.43 For example, foreign-born and foreign-educated scientists and engineers in the United States are over-represented among authors of the most-cited scientific papers and among inventors holding highly cited patents.44 In fact, 76 percent of patents at the top-10 patent-producing universities included at least one foreign-born inventor, and 40 percent of 2010 Fortune 500 companies were founded by immigrants.45 Another study found that 16 percent of fast growing “gazelle” firms had at least one foreign-born founder.46
The Rankings: Northern Midwest states dominate the top five, primarily due to very low levels of immigration of workers with less than a high-school diploma. Only 3 percent of migrants to Wyoming had less than a high school diploma. For South Dakota it is 5 percent; North Dakota is 2 percent; Kansas is 3 percent; and Wisconsin is 9 percent. Compare this to Rhode Island, in which over 43 percent of immigrants had less than a high school diploma, many of them coming from Latin America and the Caribbean. Additionally, Wyoming, South Dakota, and Wisconsin each have a high share of their immigrants having a graduate or professional degree, with 37 percent, 34 percent, and 21 percent respectively. Compare this to West Virginia, ranked third-to-last, which saw almost no immigrants with a graduate or professional degree settle in the state.
“Seventy-six percent of patents at the top-10 patent-producing universities included at least
one foreign-born inventor.”
100th–76th percentile 75th–51st percentile 50th–26th percentile 25th–1st percentile
The Top Five average years of education
1 Wyoming 15.5
2 South Dakota 14.7
3 North Dakota 14.5
4 Kansas 14.2
5 Wisconsin 14.0
u.S. average 12.4
Source: Census Bureau, 2010
The Top Five movers 2010 rank 2012 rank rank Change
1 Wyoming 48 1 +47
2 Colorado 37 9 +28
3 Alabama 41 16 +25
4 Nevada 47 23 +24
4 Tennessee 32 8 +24
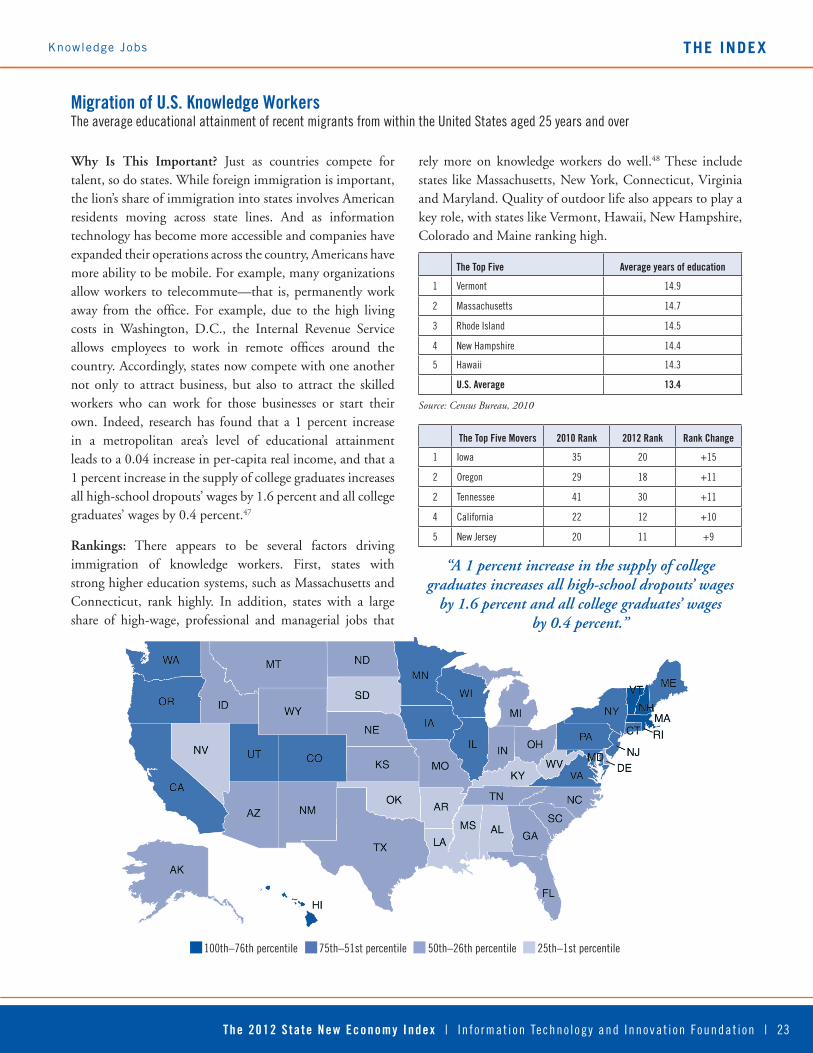
The 2012 S ta te New economy Index | I n fo rmat ion Techno logy and Innovat ion Foundat ion | 23
the IndexKnowledge Jobs
migration of u.S. Knowledge workersThe average educational attainment of recent migrants from within the United States aged 25 years and over
Why Is This Important? Just as countries compete for talent, so do states. While foreign immigration is important, the lion’s share of immigration into states involves American residents moving across state lines. And as information technology has become more accessible and companies have expanded their operations across the country, Americans have more ability to be mobile. For example, many organizations allow workers to telecommute—that is, permanently work away from the office. For example, due to the high living costs in Washington, D.C., the Internal Revenue Service allows employees to work in remote offices around the country. Accordingly, states now compete with one another not only to attract business, but also to attract the skilled workers who can work for those businesses or start their own. Indeed, research has found that a 1 percent increase in a metropolitan area’s level of educational attainment leads to a 0.04 increase in per-capita real income, and that a 1 percent increase in the supply of college graduates increases all high-school dropouts’ wages by 1.6 percent and all college graduates’ wages by 0.4 percent.47
Rankings: There appears to be several factors driving immigration of knowledge workers. First, states with strong higher education systems, such as Massachusetts and Connecticut, rank highly. In addition, states with a large share of high-wage, professional and managerial jobs that
rely more on knowledge workers do well.48 These include states like Massachusetts, New York, Connecticut, Virginia and Maryland. Quality of outdoor life also appears to play a key role, with states like Vermont, Hawaii, New Hampshire, Colorado and Maine ranking high.
“A 1 percent increase in the supply of college graduates increases all high-school dropouts’ wages
by 1.6 percent and all college graduates’ wages by 0.4 percent.”
The Top Five average years of education
1 Vermont 14.9
2 Massachusetts 14.7
3 Rhode Island 14.5
4 New Hampshire 14.4
5 Hawaii 14.3
u.S. average 13.4
Source: Census Bureau, 2010
The Top Five movers 2010 rank 2012 rank rank Change
1 Iowa 35 20 +15
2 Oregon 29 18 +11
2 Tennessee 41 30 +11
4 California 22 12 +10
5 New Jersey 20 11 +9
100th–76th percentile 75th–51st percentile 50th–26th percentile 25th–1st percentile

24 | In fo rmat ion Techno logy and Innovat ion Foundat ion | The 2012 S ta te New economy Index
the Index Knowledge Jobs
manufacturing value addedManufacturing value added per production hour worked as a percentage of the national average, adjusted for industrial composition
Why Is This Important? Value added is the difference in value between inputs into the production process (such as materials and energy) and the value of final products or services sold. Within manufacturing, high-value-added firms tend to be those that are capital intensive, producing more technologically complex products and organizing their work to take better advantage of worker skills. Because their workers are more productive, generating greater value for each hour worked, these workers typically earn higher wages. And within sectors, firms with higher-value-added levels, all else being equal, are better equipped to meet competitive challenges, both at home and abroad.
The Rankings: Even after controlling for a state’s industry mix, states that have a high share of high-tech jobs and a high proportion of scientists and engineers in their workforce also have more productive manufacturers.49 Of the top 10 states in this indicator, eight rank in the top half in both High-Tech Jobs and Scientists and Engineers. The two states that buck this trend—Nevada and Louisiana—have
manufacturing sectors that are dominated by one industry—petroleum products for Louisiana, and miscellaneous manufacturing for Nevada. One explanation for this might be state specialization; another may be that states with homogeneous high-skilled firms develop knowledge-based clusters that increase production efficiency. In other words, specialization and clustering may cause these industries in Louisiana and Nevada be much more productive than they are on the national scale.
“States that have a high share of high-tech jobs and a high proportion of scientists and engineers in their workforce also have more productive manufacturers.”
100th–76th percentile 75th–51st percentile 50th–26th percentile 25th–1st percentile
The Top Five*adjusted value added as a
percentage of u.S. average
1 Utah 125.5%
2 Nevada 125.4%
3 Oregon 116.4%
4 New Mexico 115.0%
5 Virginia 112.6%
u.S. average 100.0%
*Top Five Mover table excluded due to methodology changeSource: Census Bureau, 2010
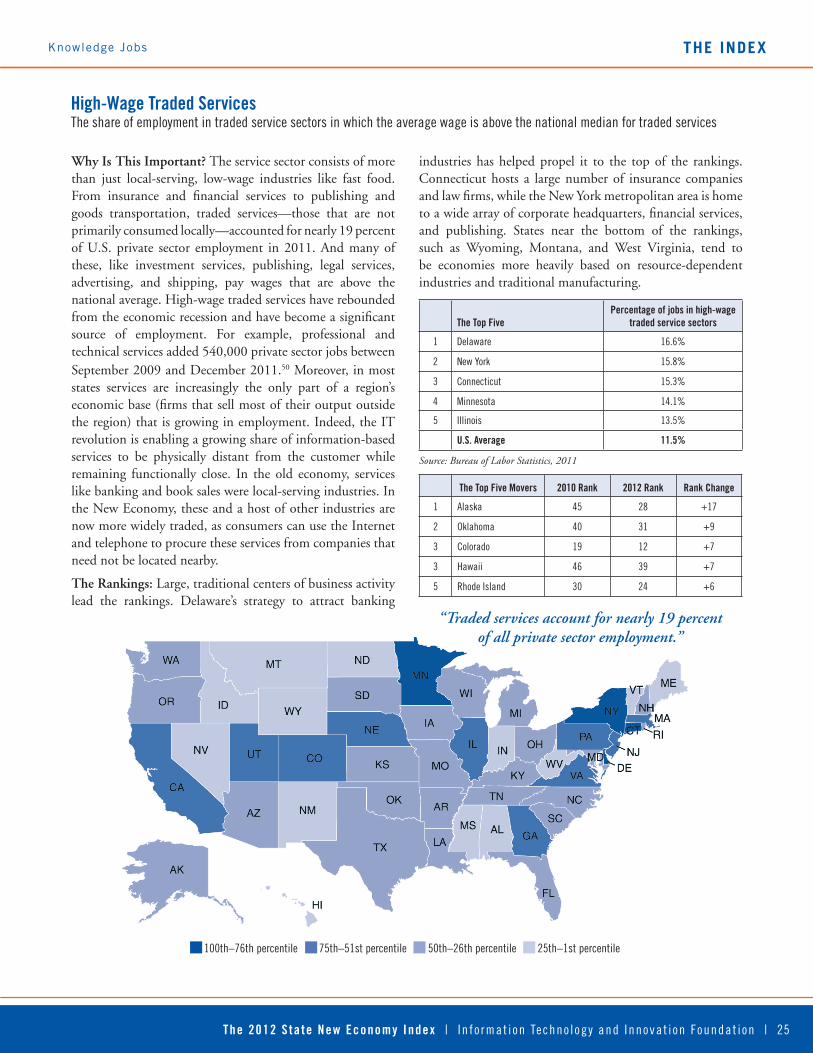
The 2012 S ta te New economy Index | I n fo rmat ion Techno logy and Innovat ion Foundat ion | 25
the IndexKnowledge Jobs
high-wage Traded ServicesThe share of employment in traded service sectors in which the average wage is above the national median for traded services
Why Is This Important? The service sector consists of more than just local-serving, low-wage industries like fast food. From insurance and financial services to publishing and goods transportation, traded services—those that are not primarily consumed locally—accounted for nearly 19 percent of U.S. private sector employment in 2011. And many of these, like investment services, publishing, legal services, advertising, and shipping, pay wages that are above the national average. High-wage traded services have rebounded from the economic recession and have become a significant source of employment. For example, professional and technical services added 540,000 private sector jobs between September 2009 and December 2011.50 Moreover, in most states services are increasingly the only part of a region’s economic base (firms that sell most of their output outside the region) that is growing in employment. Indeed, the IT revolution is enabling a growing share of information-based services to be physically distant from the customer while remaining functionally close. In the old economy, services like banking and book sales were local-serving industries. In the New Economy, these and a host of other industries are now more widely traded, as consumers can use the Internet and telephone to procure these services from companies that need not be located nearby.
The Rankings: Large, traditional centers of business activity lead the rankings. Delaware’s strategy to attract banking
industries has helped propel it to the top of the rankings. Connecticut hosts a large number of insurance companies and law firms, while the New York metropolitan area is home to a wide array of corporate headquarters, financial services, and publishing. States near the bottom of the rankings, such as Wyoming, Montana, and West Virginia, tend to be economies more heavily based on resource-dependent industries and traditional manufacturing.
“Traded services account for nearly 19 percent of all private sector employment.”
The Top Fivepercentage of jobs in high-wage
traded service sectors
1 Delaware 16.6%
2 New York 15.8%
3 Connecticut 15.3%
4 Minnesota 14.1%
5 Illinois 13.5%
u.S. average 11.5%
Source: Bureau of Labor Statistics, 2011
The Top Five movers 2010 rank 2012 rank rank Change
1 Alaska 45 28 +17
2 Oklahoma 40 31 +9
3 Colorado 19 12 +7
3 Hawaii 46 39 +7
5 Rhode Island 30 24 +6
100th–76th percentile 75th–51st percentile 50th–26th percentile 25th–1st percentile

the Index
26 | In fo rmat ion Techno logy and Innovat ion Foundat ion | The 2012 S ta te New economy Index
Globalization
globAlIZAtIonWhile the old economy was national in scope, the New Economy is global. While in 1988 there were 3.8 million workers employed in multinational companies in the United States, in 2010 there were 5.3 million.51 Likewise, the capital expenditures from majority-owned foreign affiliates in the United States increased from 1.1 percent of GDP in 1997 to over 1.4 percent of GDP in 2007, before the recession.52 However, this has fallen to 1.0 percent of GDP in 2010, in part due to the recession and the failure of the U.S. to maintain global competiveness.53
When the old economy emerged after World War II, the winners were states whose businesses sold to national markets, as opposed to local or regional ones. In the New Economy, the winners are the states whose businesses are well integrated into the world economy, as a global orientation ensures expanding markets for a state’s industries. Since workers at globally oriented firms also earn higher wages than those at domestically oriented firms, global integration provides a state’s workforce with a higher standard of living.
The globalization indicators in this section measure two aspects of globalization: 1) the share of the workforce employed by foreign-owned companies; and 2) the extent to which the manufacturing and service workforce is employed producing goods and services for export.
2012 2012 2010 rank State Score rank* 1 Delaware 14.64 1
2 Texas 13.45 2
3 New Jersey 12.04 4
4 Massachusetts 11.87 6
5 South Carolina 11.87 3
6 Nevada 11.72 19
7 New York 11.70 8
8 Connecticut 11.66 5
9 New Hampshire 11.46 14
10 Washington 11.34 9
11 Kentucky 11.26 7
12 Vermont 11.19 31
13 Florida 11.04 20
14 Georgia 11.04 12
15 Illinois 10.61 13
16 Tennessee 10.43 11
17 California 10.35 17
18 Rhode Island 10.34 29
19 Maine 10.32 26
20 Indiana 10.32 23
21 North Carolina 10.26 10
22 Louisiana 10.19 15
23 Pennsylvania 10.07 25
24 Michigan 10.06 28
25 Ohio 9.87 24
26 Maryland 9.85 21
27 Alabama 9.75 27
28 Virginia 9.71 22
29 Utah 9.69 18
30 Hawaii 9.60 30
31 North Dakota 9.51 34
32 Alaska 9.49 36
33 Kansas 9.43 32
34 Oregon 9.36 33
35 West Virginia 9.35 39
36 Arizona 9.34 37
37 Minnesota 9.25 35
38 Idaho 9.09 46
39 Colorado 8.78 38
40 Missouri 8.57 44
41 Iowa 8.56 40
42 Wisconsin 8.49 41
43 Nebraska 8.48 42
44 Wyoming 8.41 16
45 Mississippi 8.26 45
46 Arkansas 8.15 43
47 Montana 7.65 48
48 Oklahoma 7.63 47
49 New Mexico 7.34 49
50 South Dakota 7.13 50
u.S. average 10.00
*Due to methodological changes, ranking comparisons are not exact.
Aggregated globalization Scores
100th–76th percentile 75th–51st percentile 50th–26th percentile 25th–1st percentile

The 2012 S ta te New economy Index | I n fo rmat ion Techno logy and Innovat ion Foundat ion | 27
the IndexGlobalization
Foreign Direct InvestmentThe share of workers employed by foreign-controlled companies
Why Is This Important? Incoming foreign direct investment (FDI) refers to significant investments by foreign entities in facilities in the United States. FDI grew rapidly in the late 1990s, reaching an apex in 2000 of $314 billion, before dropping precipitously to $53 billion in 2003. Since then, FDI has rebounded to $227 billion in 2011.54 However, it is important to note that the vast majority of this investment is in the form of foreign investors acquiring existing U.S. companies, rather than the establishment of new companies (so-called “Greenfield” investment) that brings much larger economic and jobs benefits. In fact, on average from 1992 to 2008 (the latest available data), Greenfield investment constituted just 14 percent of foreign investor outlays in the United States. Over the same period, foreign acquisitions grew by 2.9 percent per year, while Greenfield investment declined by 6.1 percent per year.55 In 2010, majority-owned foreign-owned companies employed 3.9 percent of American workers and accounted for 4.5 percent of U.S. GDP, both figures down from 2007.56
Rankings: States on the East Coast have the highest percentage of their workforce employed by foreign firms.
This is primarily due to the impact of investment by European firms. For example, firms in five European countries—France, Germany, the Netherlands, Switzerland, and the United Kingdom—accounted for 51 percent of U.S. employment in foreign firms in 2010. European firms are more concentrated in the north Atlantic states (excluding Maine, where FDI is dominated by Canada), where the share of employment in firms controlled by entities from these five countries is 59 percent.
“In 2010, majority-owned foreign-owned companies employed 3.9 percent of American workers and accounted for 4.5 percent of U.S. GDP.”
The Top Five*percentage of jobs in
foreign-controlled companies
1 New Hampshire 4.9%
2 Delaware 4.8%
3 Connecticut 4.6%
4 New Jersey 4.5%
5 Rhode Island 4.4%
u.S. average 3.0%
*Top Five Mover table excluded due to methodology changeSource: Bureau of Economic Analysis, 2010 (2009 data for Montana)
100th–76th percentile 75th–51st percentile 50th–26th percentile 25th–1st percentile

28 | In fo rmat ion Techno logy and Innovat ion Foundat ion | The 2012 S ta te New economy Index
the Index Globalization
export Focus of manufacturing and ServicesThe value of exports per manufacturing and service worker, adjusted for industrial composition
Why Is This Important? Trade has become an integral part of the U.S. and world economies. The combined total of U.S. exports and imports has increased from just 11 percent of GDP in 1970 to 20 percent in 1990, reaching 32 percent in 2011. Services exports have been growing in importance over past three decades, having increased from 18 percent of exports in 1980 to 29 percent today.57 Moreover, service exports were impacted less by the economic recession than goods exports. From 2007 to 2009, goods exports declined by 0.6 percentage points as a share of GDP, while service exports increased by 0.1 percentage points. Since then, goods exports have recovered, increasing by 2.3 percentage points as a share of GDP from 2009 to 2011, while service exports increased by 0.4 percentage points.58 Research also finds that the more stable service-sector exports, the less unemployment rises during an economic downturn. During the current recession, the unemployment rate was 1 percent higher for every 5 percentage points lost in the service-exports growth rate.59 Additionally, export industries are a source of higher incomes. On average, exports contribute an additional 18 percent to workers’ earnings in U.S. manufacturing.60 In business services, workers at exporting firms earn almost 20 percent more than their counterparts at comparable non-exporting business services firms.61 As a result, states lacking companies that export globally risk being left behind.
The Rankings: The leading states are generally those that have high-value-added, technologically advanced manufacturing sectors, such as Texas, Delaware, and New York. This is particularly true for service exports, 75 percent of which come from the 100 largest metropolitan areas. (These same metropolitan areas provide just 62 percent of goods exports.)62 Texas’s top rank is owed to trade with Mexico, which accounts for one-third of Texan exports as well as the state’s robust oil and petroleum industry exports. Even after holding constant oil and petroleum industry sectors’ propensities to export, Texan exports per employee are more than twice the national average. Delaware’s service exports, particularly professional, scientific and technical and administrative exports, account for over 60 percent of the state’s manufacturing and service sector exports. Washington’s rank demonstrates the importance of software publishing (a service industry), as Microsoft’s software exports, together with Boeing’s aerospace manufacturing, are largely responsible for its strong performance. States with low rankings (such as Arkansas and Mississippi), tend to have a greater focus in lower-value-added industries that compete directly with lower-wage nations, making it more difficult to export, or they have a greater focus in branch-plant domestic supplier firms that do not export directly (such as Indiana and Wisconsin), or they have a concentration of smaller firms that tend to export less than larger firms (such as Rhode Island).
“On average, exports contribute an additional 18 percent to workers’ earnings in U.S. manufacturing.”

The 2012 S ta te New economy Index | I n fo rmat ion Techno logy and Innovat ion Foundat ion | 29
The Top Five
adjusted export value per manufacturing and
service worker
1 Texas $134,040
2 Delaware $117,608
3 Nevada $103,904
4 Washington $97,445
5 Florida $94,440
u.S. average $62,611
The Top Five movers 2010 rank 2012 rank rank Change
1 Idaho 37 10 +27
2 Vermont 20 6 +14
3 Hawaii 49 40 +9
3 Montana 35 26 +9
3 New Hampshire 45 36 +9
Source: International Trade Administration, 2010; Census Bureau, 2007
100th–76th percentile 75th–51st percentile 50th–26th percentile 25th–1st percentile
export Focus of manufacturing and Services
Globalization the Index

the Index
30 | In fo rmat ion Techno logy and Innovat ion Foundat ion | The 2012 S ta te New economy Index
Economic Dynamism
economIc dynAmISmThe old economy was driven by large companies facing limited competition in stable markets with high barriers to entry. The New Economy is driven by economic dynamism and competition, exemplified by fast growing entrepreneurial companies and rapidly changing fortunes in many industries. Given this new economic paradigm, the ability of state economies to rejuvenate themselves through the formation of new, innovative companies is critical to economic vitality.
The dynamism and competition indicators in this section measure five aspects of economic dynamism: 1) the degree of job churning; 2) the number fast growing firms; 3) he number and value of IPOs; 4) the number of entrepreneurs starting new businesses; and 5) the number of individual inventor patents granted.
2012 2012 2010 rank State Score rank* 1 Utah 16.20 1
2 Colorado 14.59 3
3 Florida 12.82 5
4 Georgia 12.75 2
5 Massachusetts 12.74 4
6 Arizona 12.65 6
7 California 12.60 8
8 Maryland 12.05 15
9 Nevada 11.94 7
10 Idaho 11.94 9
11 Montana 11.78 11
12 New York 11.67 12
13 Texas 11.59 13
14 Alaska 11.54 19
15 Virginia 11.51 14
16 Vermont 11.38 24
17 New Hampshire 10.42 18
18 Delaware 10.31 39
19 New Jersey 10.23 16
20 North Carolina 10.21 30
21 Connecticut 10.13 26
22 Oregon 10.04 10
23 Wyoming 9.87 17
24 Michigan 9.73 21
25 Oklahoma 9.66 20
26 Washington 9.53 29
27 Maine 9.47 25
28 Tennessee 9.35 35
29 Minnesota 9.29 27
30 Arkansas 9.17 37
31 Rhode Island 9.12 22
32 Kansas 9.11 40
33 South Dakota 9.07 41
34 Illinois 9.04 28
35 North Dakota 8.97 32
36 Pennsylvania 8.84 34
37 New Mexico 8.80 23
38 Louisiana 8.69 42
39 Indiana 8.24 31
40 Kentucky 8.20 43
41 Nebraska 8.07 44
42 Ohio 8.02 38
43 Missouri 7.84 50
44 Mississippi 7.81 47
45 Wisconsin 7.71 36
46 South Carolina 7.65 33
47 Iowa 7.63 48
48 Hawaii 7.09 46
49 Alabama 7.06 49
50 West Virginia 5.91 45
u.S. average 10.00
*Due to methodological changes, ranking comparisons are not exact.
Aggregated economic dynamism Scores
100th–76th percentile 75th–51st percentile 50th–26th percentile 25th–1st percentile

The 2012 S ta te New economy Index | I n fo rmat ion Techno logy and Innovat ion Foundat ion | 31
the IndexEconomic Dynamism
Job ChurningThe number of business establishment startups and failures as a percentage of total establishments
Why Is This Important? Steady growth in employment masks the constant churning of job creation and destruction, as less innovative and efficient companies downsize or go out of business and more innovative and efficient companies grow or take their place. While startups have a higher failure rate than older, more established businesses, the ones that survive have very high rates of growth and job creation.63 Indeed, according to the Census Bureau, surviving firms less than five years of age had a job creation rate of 17 percent in 2010, versus just 10 percent for older firms.64 Along with jobs and income, it is frequently these entrepreneurial businesses—including new manufacturers—that bring fresh new ideas and innovations to the marketplace, replacing those of less innovative incumbents, and thus raising living standards. While such turbulence increases the economic risk faced by workers, companies, and even regions, in the New Economy it is a fundamental driver of innovation and economic growth.
Rankings: Job churning can result, in part, from high rates of long-term job growth.65 This is because fast growing economies produce more startups, especially in local-serving industries (including businesses such as restaurants, dry cleaners, or accountants). As a result, some states experience
a great deal of churning. Yet, interestingly, there is virtually no correlation between state unemployment and churn rates, indicating that much of the recent job loss has been predominately in large firms that have not gone under, while most new jobs come from new startups.
“Surviving firms under five years of age had a job creation rate of 17 percent
in 2010, versus just 10 percent for older firms.”
The Top Fivepercentage of establishment
startups and failures
1 Alaska 46.1%
2 Utah 44.8%
3 Florida 44.6%
4 Idaho 44.0%
5 Colorado 44.0%
u.S. average 33.0%
The Top Five movers 2010 rank 2012 rank rank Change
1 Delaware 36 12 +24
2 Arkansas 30 14 +16
3 North Dakota 34 22 +12
4 South Dakota 35 26 +9
5 Kentucky 38 34 +4
5 Utah 6 2 +4
Source: Bureau of Labor Statistics, 2010-2011
100th–76th percentile 75th–51st percentile 50th–26th percentile 25th–1st percentile

32 | In fo rmat ion Techno logy and Innovat ion Foundat ion | The 2012 S ta te New economy Index
the Index Economic Dynamism
Fast growing FirmsThe number of firms on the “Inc. 500” and “Technology Fast 500” lists as a share of total firms
Why Is This Important? The “Technology Fast 500” and “Inc. 500” lists are composed of the fastest growing U.S. firms. Every firm to make the “2011 Technology Fast 500” list experienced revenue growth of at least 130 percent over a four-year period. For the “2011 Inc. 500,” it was 680 percent in three years. While firms attaining such growth rates are generally quite small, with fewer than 100 employees, they represent a state’s most successful entrepreneurial efforts and hold strong promise for continued growth. In fact, there are a number of well-known companies (including Microsoft and Paul Mitchell) that were listed on the “Inc. 500” before they became household names. A state’s performance in this measure is one indication of the vitality of its entrepreneurial network.
Rankings: Not surprisingly, states that perform well are generally known for their entrepreneurial technology sectors. Indeed, the majority of “Inc. 500” firms in the top states, especially Virginia, Maryland and California, are IT or telecommunications firms, while Massachusetts has a large number of medical technology firms. Many states that perform well have developed clusters of well-organized fast-growing firms and support systems to help firms grow. For example, local university partnerships have helped rank Provo, Utah, first among metropolitan areas in “Inc. 500” firms per capita.66 However, fast growing firms
are not limited to specific geographic areas; between 2010 and 2011 the median number of fast growing firms in the states increased by 8 percent while the average declined by 3 percent, indicating that fast growing firms are becoming less concentrated and spreading beyond a few states.
“Fast growing firms are becoming less concentrated and
spreading beyond a few states.”
The Top Fivepercentage of firms that
are fast growing
1 Virginia 0.032%
2 Massachusetts 0.028%
3 Maryland 0.026%
4 Utah 0.023%
5 California 0.019%
u.S. average 0.017%
The Top Five movers 2010 rank 2012 rank rank Change
1 Delaware 35 7 +28
2 Idaho 42 27 +15
3 Rhode Island 48 38 +10
4 Kentucky 45 36 +9
5 Alabama 33 26 +7
5 Kansas 26 19 +7
5 Oklahoma 31 24 +7
5 South Dakota 49 42 +7
Source: Deloitte, 2010-2011; Inc. 2010-2011
100th–76th percentile 75th–51st percentile 50th–26th percentile 25th–1st percentile
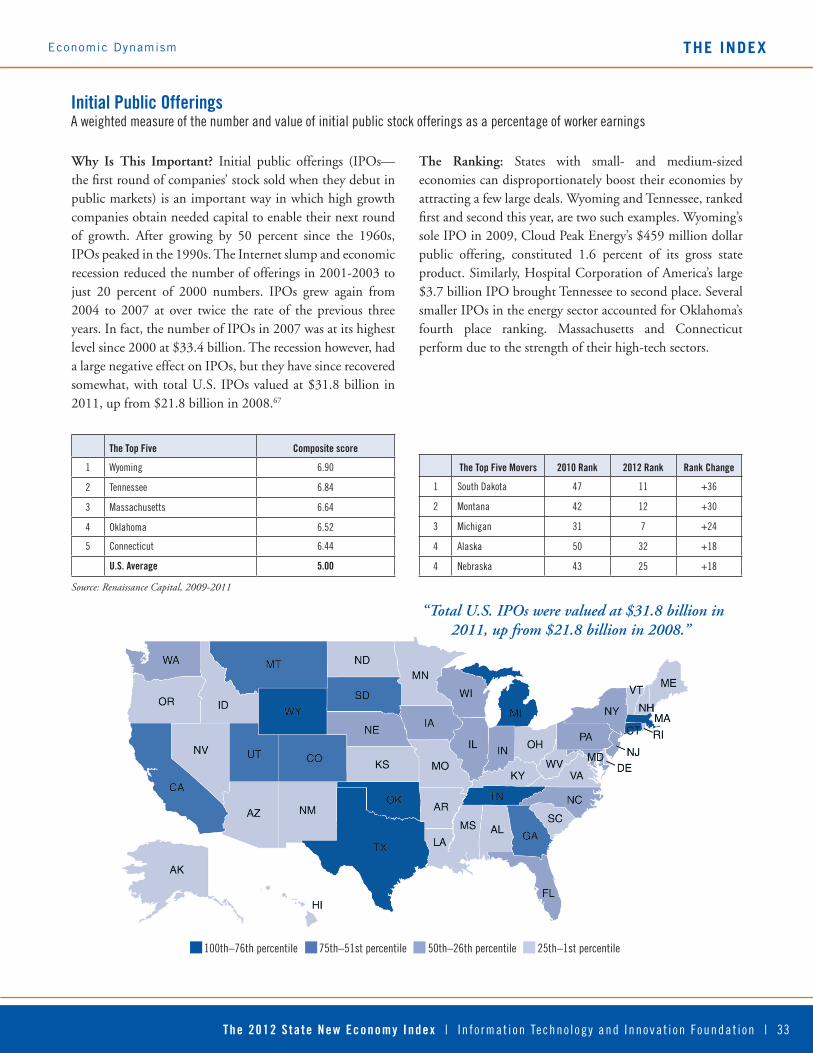
The 2012 S ta te New economy Index | I n fo rmat ion Techno logy and Innovat ion Foundat ion | 33
the IndexEconomic Dynamism
Initial public offeringsA weighted measure of the number and value of initial public stock offerings as a percentage of worker earnings
Why Is This Important? Initial public offerings (IPOs—the first round of companies’ stock sold when they debut in public markets) is an important way in which high growth companies obtain needed capital to enable their next round of growth. After growing by 50 percent since the 1960s, IPOs peaked in the 1990s. The Internet slump and economic recession reduced the number of offerings in 2001-2003 to just 20 percent of 2000 numbers. IPOs grew again from 2004 to 2007 at over twice the rate of the previous three years. In fact, the number of IPOs in 2007 was at its highest level since 2000 at $33.4 billion. The recession however, had a large negative effect on IPOs, but they have since recovered somewhat, with total U.S. IPOs valued at $31.8 billion in 2011, up from $21.8 billion in 2008.67
The Ranking: States with small- and medium-sized economies can disproportionately boost their economies by attracting a few large deals. Wyoming and Tennessee, ranked first and second this year, are two such examples. Wyoming’s sole IPO in 2009, Cloud Peak Energy’s $459 million dollar public offering, constituted 1.6 percent of its gross state product. Similarly, Hospital Corporation of America’s large $3.7 billion IPO brought Tennessee to second place. Several smaller IPOs in the energy sector accounted for Oklahoma’s fourth place ranking. Massachusetts and Connecticut perform due to the strength of their high-tech sectors.
“Total U.S. IPOs were valued at $31.8 billion in 2011, up from $21.8 billion in 2008.”
The Top Five Composite score
1 Wyoming 6.90
2 Tennessee 6.84
3 Massachusetts 6.64
4 Oklahoma 6.52
5 Connecticut 6.44
u.S. average 5.00
The Top Five movers 2010 rank 2012 rank rank Change
1 South Dakota 47 11 +36
2 Montana 42 12 +30
3 Michigan 31 7 +24
4 Alaska 50 32 +18
4 Nebraska 43 25 +18
Source: Renaissance Capital, 2009-2011
100th–76th percentile 75th–51st percentile 50th–26th percentile 25th–1st percentile

34 | In fo rmat ion Techno logy and Innovat ion Foundat ion | The 2012 S ta te New economy Index
the Index Economic Dynamism
entrepreneurial activityThe number of individuals starting new businesses as a percentage of the population
Why Is This Important? In the New Economy, competitive advantage is increasingly based on innovation and the generation of new business models. Moreover, in a global economy with low-wage developing nations serving as an attractive option for U.S. multinationals, fewer U.S. companies are building Greenfield plants domestically. For both reasons, entrepreneurial activity is now more important to a state’s economic health than ever before. Although only 1 in 20 new firms are high growth in terms of job creation, firms that survive the first few years have high rates of job growth and also often produce innovative goods, services and processes.68
Rankings: Myriad factors affect states’ rates of entrepreneurship—from industry and firm size mix, to education, to culture—and thus it is difficult to pinpoint one primary factor driving the different scores. Western states continue to have the highest concentration of entrepreneurs, while Midwest states generally have the
lowest rates. Unsurprisingly, entrepreneurship is positively correlated with level of venture capital investment, which may explain the high scores of states like California and Colorado.69 Perhaps surprising is that the other states in the top five—Nevada, Georgia, and Arizona—experienced some of the highest rates of job loss during the Great Recession. This may explain their scores on the indicator, as a portion of the unemployed turn to entrepreneurship for income.70
“Firms that survive the first few years have high rates of job growth and also often produce innovative goods, services and processes.”
The Top Five*percentage of people starting
a business
1 California 0.46%
2 Nevada 0.45%
3 Colorado 0.44%
4 Georgia 0.43%
5 Arizona 0.42%
u.S. average 0.33%
*Top Five Mover table excluded due to methodology changeSource: Kauffman Foundation, 2010-2011
100th–76th percentile 75th–51st percentile 50th–26th percentile 25th–1st percentile

The 2012 S ta te New economy Index | I n fo rmat ion Techno logy and Innovat ion Foundat ion | 35
the IndexEconomic Dynamism
Inventor patentsThe number of independent inventor patents per 1,000 working-age people
Why Is This Important? From Benjamin Franklin to Thomas Edison to Steve Jobs, the independent inventor is an established American icon. Today, many owners of individual patents—those patents not assigned to any organization—are not mere tinkerers, but rather are trained scientists, engineers or students pursuing independent research. Because the New Economy places a premium on innovation, this wellspring of innovative activity has become an important foundation for many entrepreneurial ventures. Although inventor patents fell during the recession from 14,000 in 2006, they have
since recovered and now surpass pre-recession levels, rising to 15,980 in 2011 from a 2009 low of 12,562.
Rankings: Not surprisingly, states with a large number of inventor patents are also likely to have a large number of scientists and engineers.71 Many of these states also have strong higher education science and engineering programs. States that are typically strong in tech-based entrepreneurial activity, including Utah, California and Massachusetts, perform well. The states generating the fewest inventor patents per capita tend to be Southeastern states, with workforces rooted in agriculture and more traditional industries with lower levels of entrepreneurial activity.
“Inventor patents have recovered and now surpass pre-recession levels, rising to 15,980 in 2011 from a 2009 low of 12,562.”
The Top Fivepatents per 1,000 people of
workforce age
1 Utah 0.216
2 California 0.135
3 Oregon 0.125
4 New Hampshire 0.123
5 Massachusetts 0.117
u.S. average 0.076
The Top Five movers 2010 rank 2012 rank rank Change
1 Vermont 35 16 +19
2 South Dakota 31 24 +7
3 Kansas 38 32 +6
3 Maryland 17 11 +6
5 Colorado 14 9 +5
5 New Jersey 13 8 +5Source: U.S. Patent and Trademark Office, 2009-2010
100th–76th percentile 75th–51st percentile 50th–26th percentile 25th–1st percentile
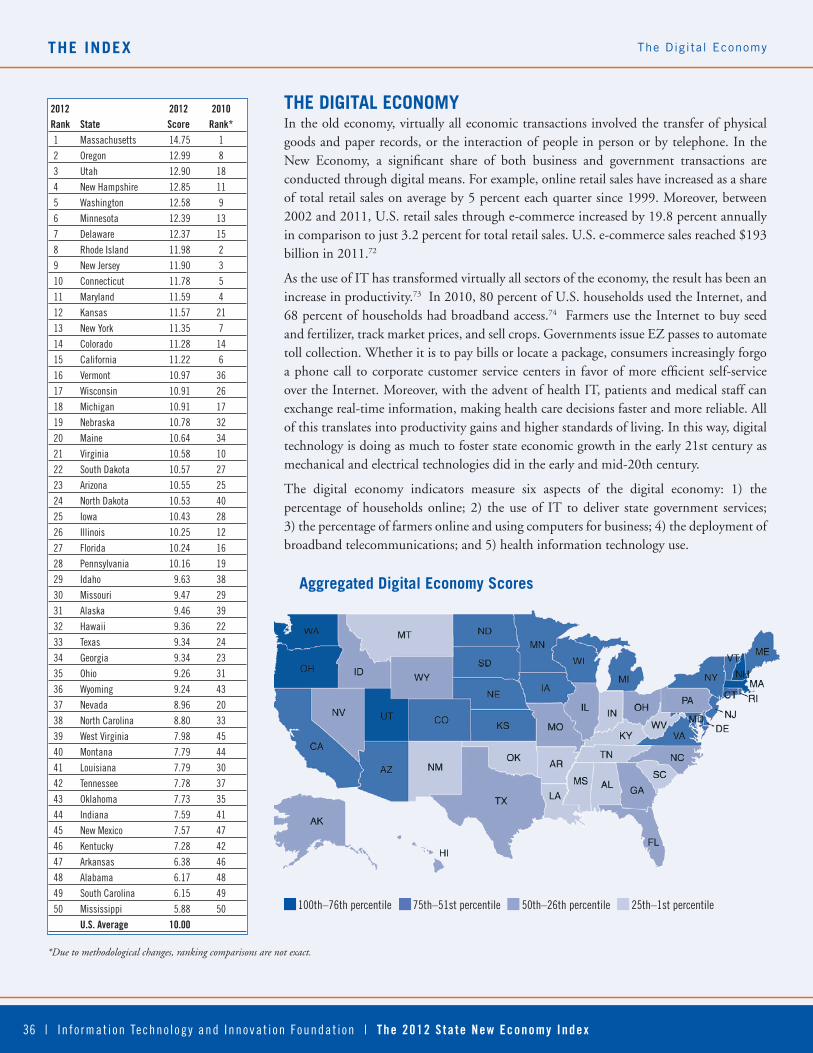
the Index
36 | In fo rmat ion Techno logy and Innovat ion Foundat ion | The 2012 S ta te New economy Index
The Digital Economy
the dIgItAl economyIn the old economy, virtually all economic transactions involved the transfer of physical goods and paper records, or the interaction of people in person or by telephone. In the New Economy, a significant share of both business and government transactions are conducted through digital means. For example, online retail sales have increased as a share of total retail sales on average by 5 percent each quarter since 1999. Moreover, between 2002 and 2011, U.S. retail sales through e-commerce increased by 19.8 percent annually in comparison to just 3.2 percent for total retail sales. U.S. e-commerce sales reached $193 billion in 2011.72
As the use of IT has transformed virtually all sectors of the economy, the result has been an increase in productivity.73 In 2010, 80 percent of U.S. households used the Internet, and 68 percent of households had broadband access.74 Farmers use the Internet to buy seed and fertilizer, track market prices, and sell crops. Governments issue EZ passes to automate toll collection. Whether it is to pay bills or locate a package, consumers increasingly forgo a phone call to corporate customer service centers in favor of more efficient self-service over the Internet. Moreover, with the advent of health IT, patients and medical staff can exchange real-time information, making health care decisions faster and more reliable. All of this translates into productivity gains and higher standards of living. In this way, digital technology is doing as much to foster state economic growth in the early 21st century as mechanical and electrical technologies did in the early and mid-20th century.
The digital economy indicators measure six aspects of the digital economy: 1) the percentage of households online; 2) the use of IT to deliver state government services; 3) the percentage of farmers online and using computers for business; 4) the deployment of broadband telecommunications; and 5) health information technology use.
2012 2012 2010 rank State Score rank* 1 Massachusetts 14.75 1
2 Oregon 12.99 8
3 Utah 12.90 18
4 New Hampshire 12.85 11
5 Washington 12.58 9
6 Minnesota 12.39 13
7 Delaware 12.37 15
8 Rhode Island 11.98 2
9 New Jersey 11.90 3
10 Connecticut 11.78 5
11 Maryland 11.59 4
12 Kansas 11.57 21
13 New York 11.35 7
14 Colorado 11.28 14
15 California 11.22 6
16 Vermont 10.97 36
17 Wisconsin 10.91 26
18 Michigan 10.91 17
19 Nebraska 10.78 32
20 Maine 10.64 34
21 Virginia 10.58 10
22 South Dakota 10.57 27
23 Arizona 10.55 25
24 North Dakota 10.53 40
25 Iowa 10.43 28
26 Illinois 10.25 12
27 Florida 10.24 16
28 Pennsylvania 10.16 19
29 Idaho 9.63 38
30 Missouri 9.47 29
31 Alaska 9.46 39
32 Hawaii 9.36 22
33 Texas 9.34 24
34 Georgia 9.34 23
35 Ohio 9.26 31
36 Wyoming 9.24 43
37 Nevada 8.96 20
38 North Carolina 8.80 33
39 West Virginia 7.98 45
40 Montana 7.79 44
41 Louisiana 7.79 30
42 Tennessee 7.78 37
43 Oklahoma 7.73 35
44 Indiana 7.59 41
45 New Mexico 7.57 47
46 Kentucky 7.28 42
47 Arkansas 6.38 46
48 Alabama 6.17 48
49 South Carolina 6.15 49
50 Mississippi 5.88 50
u.S. average 10.00
*Due to methodological changes, ranking comparisons are not exact.
Aggregated digital economy Scores
100th–76th percentile 75th–51st percentile 50th–26th percentile 25th–1st percentile

The 2012 S ta te New economy Index | I n fo rmat ion Techno logy and Innovat ion Foundat ion | 37
the IndexThe Digital Economy
online populationThe percentage of households online
Why Is This Important? The number of households online is a basic indicator of a state’s progress toward a digital economy. While in 2000, 46 percent of households were online, by 2010 this number had grown to 80 percent and the number of rural households with Internet access has increased by over 50 percent since 2000.75 Moreover, the average income and education levels of Internet users continue to drop so that the online population is looking more and more like the American population in general, with the exception of seniors, who are lagging significantly behind in Internet use.76
The Rankings: While Internet use by states differs, all states are moving ahead. Despite top-ranked Utah having 19 percent more of its households online than bottom-ranked Arkansas, the national average is up 23 percentage points from 2003. States with more highly educated workforces tend to score well (including Utah, Washington and New Hampshire).77 To some extent, state policies affect the level of Internet access; these range from taxation of Internet access to policies that promote rural Internet penetration. Yet the percent of a state’s urban population matters as well because connectivity is faster and cheaper in cities. For example, Utah has a majority of its population living within the Salt Lake City metropolitan area and, while coverage in the rural areas of this state is low, only a small percentage of
the population lives in more remote areas. States that rank lower generally are those that have lower incomes and less educated residents, as both income and education drive Internet use nationally. That said, the largest movers in the ranks have been in Midwestern and mountain states, where Federal and private sector efforts to promote rural Internet and broadband access seem to be having an impact.
The Top Five percentage of households online
1 Utah 90.1%
2 Alaska 88.6%
3 Washington 88.4%
4 New Hampshire 86.4%
5 Oregon 86.2%
u.S. average 80.2%
The Top Five movers 2010 rank 2012 rank rank Change
1 Texas 40 24 +16
2 Kansas 19 6 +13
2 South Dakota 35 22 +13
4 Nevada 20 8 +12
5 Wyoming 16 7 +9
Source: Census Bureau, 2010
100th–76th percentile 75th–51st percentile 50th–26th percentile 25th–1st percentile
“The number of rural households with Internet access has increased by over
50 percent since 2000.”

38 | In fo rmat ion Techno logy and Innovat ion Foundat ion | The 2012 S ta te New economy Index
the Index The Digital Economy
e-governmentA measure of the utilization of digital technologies in state governments
Why Is This Important? State governments that fully embrace the potential of networked information technologies will not only increase the quality and cut the costs of government services, but will also help to foster broader use of information technologies among residents and businesses. State governments have made considerable progress in using the Internet to allow individuals to interact with government—from paying taxes to renewing drivers’ licenses. But the next phase of e-government—breaking down bureaucratic barriers to create functionally-oriented, citizen-centered government Web presences designed to give citizens a self-service government, as well as to drive IT adoption beyond just the Web and into areas such as smart transportation—has only just begun.78 In particular, most states need to go much further in helping businesses interact with local and state governments online. While some states like Wisconsin and Oregon have online wizards to navigate users through the process of creating a business, most states continue to see online business portals only as places to house government documents. Yet on the whole, states are moving in the right direction. For example, the number of government sites offering fully executable services online increased from just 44 percent in 2003 to 89 percent in 2008.79
The Rankings: States with a tradition of “good government,” such as Virginia, Michigan, and Utah appear to have gone farther along the path toward digital government than states without it. But this relationship is not completely predictive. In part, this may be because the move to digital government appears to be driven by the efforts of particular individuals, including governors, secretaries of state, and legislative committee chairpersons. Strong gubernatorial leadership is surely at play in explaining some states’ higher scores. In addition, because making the transformation to a digital government is expensive, more populous states with bigger budgets also tend to score higher.
“The number of government sites offering fully executable services online increased from just 44 percent in 2003 to 89 percent in 2008.”
The Top Five* Composite score
1 Michigan 100.0
1 Utah 100.0
3 Pennsylvania 96.7
3 Virginia 96.7
5 California 93.3
u.S. average 87.7
*Top Five Mover table excluded due to methodology changeSource: Government Technology, 2010
100th–76th percentile 75th–51st percentile 50th–26th percentile 25th–1st percentile

The 2012 S ta te New economy Index | I n fo rmat ion Techno logy and Innovat ion Foundat ion | 39
the IndexThe Digital Economy
online agricultureA weighted measure of the percentage of farmers with Internet access and using computers for business
Why Is This Important? While agriculture accounts for less than 5 percent of national employment, in many states it remains an important component of the economy. As in other sectors, the New Economy is transforming agriculture. Farmers and ranchers increasingly use the Internet to buy feed and seed, check on weather conditions, obtain the latest technical information, and to sell their livestock or crops. In 2011, 62 percent of farms had access to the Internet, compared to 51 percent in 2005 and 29 percent in 1999, and 87 percent of those farms with Internet access used a broadband connection.80
The degree to which farmers take advantage of the New Economy will increasingly determine their competitive success. Two measures of this are the percentage of farmers with Internet access, and the percentage that use computers to run their farms.
The Rankings: Farmers in Northeastern and Western states lead the nation in use of computers and access to the Internet. Between 2008 and 2011, states in the Northeast have moved ahead, particularly Connecticut, Maine and New Jersey. Southern states generally fall near the bottom.
“In 2011, 62 percent of farms had Internet access, compared to 29 percent in 1999.”
The Top Five Composite score
1 New Jersey 8.04
2 Oregon 7.86
3 Connecticut 7.63
3 Maine 7.63
3 Massachusetts 7.63
3 New Hampshire 7.63
3 Rhode Island 7.63
3 Vermont 7.63
u.S. average 5.00
The Top Five movers 2010 rank 2012 rank rank Change
1 Utah 27 9 +18
2 Georgia 45 32 +13
3 Pennsylvania 43 33 +10
4 Oregon 11 2 +9
5 New Jersey 9 1 +8
Source: U.S. Department of Agriculture, 2011; USDA combines some states into single geographic areas: Arizona and Nevada; Delaware and Maryland; Connecti-cut, Maine, Massachusetts, New Hampshire, Rhode Island, and Vermont; Alaska and Hawaii are estimated using the national median.
100th–76th percentile 75th–51st percentile 50th–26th percentile 25th–1st percentile

40 | In fo rmat ion Techno logy and Innovat ion Foundat ion | The 2012 S ta te New economy Index
the Index The Digital Economy
Broadband TelecommunicationsA weighted measure of the deployment of residential broadband lines and average download speed
Why Is This Important? Over computer networks, bandwidth measures the “size of the pipes” between the sender and receiver of the data. Greater bandwidth allows faster transmission of larger amounts of data, which is critical for the increasing number of businesses that use the Internet to communicate with customers, suppliers, and other parts of the company. Broadband access for households is also important, not only because it allows a state’s residents to more easily engage in e-commerce, but also because it enables telecommuting, distance education, tele-medicine, and a host of other applications that can boost productivity and quality of life.81 It is no surprise, then, that broadband deployment and adoption is proceeding at a robust pace. Broadband adoption rose from 11 percent of households in 2000 to 68 percent in 2000 to 68 percent in 2010.82 And, in just one year, between 2009 and 2010, U.S. median download speed rose by 20 percent.83
The Rankings: Broadband adoption and speeds tend to be highest in high-tech, high-income states, including the top-five-ranked states of Delaware, Massachusetts, New Jersey and Maryland. The fact that these states, and New Hampshire, are served by Verizon, which has widely deployed fiber-to-the-home technology—prompting competitive response from cable providers—also helps. Also important is population density. Because it is less costly to invest in broadband in metropolitan areas, states that are
predominately urban are much more likely to have extensive broadband networks. Indeed, there is a strong correlation (0.58) between the score on broadband telecommunications and state population density.84 Therefore, it comes with little surprise that for the most part, the states making up the bottom five —Mississippi, Arkansas, Montana, New Mexico, and Kentucky —are those with more rural and lower-income populations.
“In just one year, between 2009 and 2010, U.S.
median download speed rose by 20 percent.”
The Top Five Composite score
1 Delaware 9.36
2 Massachusetts 8.57
3 New Jersey 7.84
4 Maryland 7.50
5 New Hampshire 7.09
u.S. average 5.00
The Top Five movers 2010 rank 2012 rank rank Change
1 Utah 34 12 +22
2 Idaho 43 25 +18
3 West Virginia 48 31 +17
4 Kansas 24 9 +15
4 North Dakota 39 24 +15
4 Wyoming 47 32 +15
Source: U.S. Department of Commerce, 2011; Communications Workers of America, 2010
100th–76th percentile 75th–51st percentile 50th–26th percentile 25th–1st percentile

The 2012 S ta te New economy Index | I n fo rmat ion Techno logy and Innovat ion Foundat ion | 41
the IndexThe Digital Economy
health ITThe share of eligible prescriptions routed electronically
Why Is This Important? Significant improvements in health care in the future will come from increased use of information technology. Robust adoption of health IT could reduce America’s health bill by $80 billion annually.85 And with health care costs rising annually, the need for innovative cost-saving strategies has never been greater. The cost of health care has increased from $256 billion in 1980 to $2.6 trillion in 2010.86 To date, adoption of health IT has been relatively slow, but in one area, electronic prescribing, adoption has been faster and as such can serve as a proxy for overall health IT adoption. In 2011, 570 million prescriptions were routed electronically, or 36 percent of all eligible prescriptions. This is up from 326 million in 2010 and just 79 million in 2008.87 E-prescribing cuts medical transaction costs by eliminating the need for confirmation phone calls and faxes, and reduces health risks associated with prescription delays.
The Rankings: In 2004 over half of states had legislation banning e-prescribing. Today, all 50 states allow it, and many have begun to actively promote e-prescribing. Moreover, in 2011, 23 states had over a third of prescriptions filled electronically. State ranks appear to be determined, in part, by the extent to which leadership in the health care industry and state government makes this a priority. Minnesota’s and Massachusetts’s top positions reflect leadership from state government, as well as the fact that the both states’ research hospitals are some of the most advanced in the nation.88 Likewise, New Hampshire’s and Ohio’s rises to third place and
fourth place, respectively, reflect collaborative efforts between their state governments and private healthcare providers.89 Iowa’s high score results in part from the state’s e-Health program that encourages implementation of health IT.90 Vermont has benefitted from Federal investment to expand e-prescribing in the state.91 Wisconsin was an early adopter of e-prescribing and has recently expanded e-prescriptions to cover Schedule II controlled substances.92
“In 2011, 23 states had over a third of prescriptions filled
electronically.”
The Top Fivepercentage of prescriptions
routed electronically
1 Minnesota 61%
2 Massachusetts 57%
3 New Hampshire 50%
4 Iowa 47%
4 Ohio 47%
4 Vermont 47%
4 Wisconsin 47%
u.S. average 36%
The Top Five movers 2010 rank 2012 rank rank Change
1 Wisconsin 43 4 +39
2 New Hampshire 38 3 +35
3 North Dakota 50 20 +30
4 New Mexico 49 25 +24
5 Ohio 26 4 +22
Source: Surescripts, 2011
100th–76th percentile 75th–51st percentile 50th–26th percentile 25th–1st percentile

42 | In fo rmat ion Techno logy and Innovat ion Foundat ion | The 2012 S ta te New economy Index
the Index Innovation Capacity
InnovAtIon cAPAcItyMost growth in the New Economy, especially growth in per-capita incomes, stems from increases in knowledge and innovation. Studies show that it is not the amount of capital, but the effectiveness with which it is used that accounts for as much as 90 percent of the variation in growth of income per worker.93
Technological innovation is a fundamental driver of growth because it makes existing amounts of capital more productive.
The innovation capacity indicators in this section measure seven aspects of innovation capacity: 1) share of jobs in high-tech industries; 2) the share of workers that are scientists and engineers; 3) the number of patents issued to companies and individuals; 4) industry R&D performance; 5) non-industrial R&D performance; 6) energy consumption; and 7) venture capital investment.
2012 2012 2010 rank State Score rank 1 Massachusetts 18.29 1
2 California 17.71 3
3 Washington 17.46 2
4 Delaware 16.81 5
5 Maryland 14.60 4
6 Virginia 14.55 9
7 New Jersey 13.94 8
8 New Mexico 13.26 10
9 Connecticut 13.23 11
10 New Hampshire 13.16 7
11 Colorado 13.10 6
12 Michigan 12.50 13
13 Minnesota 11.95 15
14 Oregon 11.88 14
15 Idaho 11.81 12
16 Arizona 11.17 18
17 New York 10.78 21
18 Vermont 10.74 16
19 Utah 10.63 20
20 Pennsylvania 10.40 17
21 Illinois 10.09 19
22 Texas 9.69 23
23 Hawaii 9.48 41
24 North Carolina 9.31 22
25 Georgia 9.22 26
26 Ohio 8.98 25
27 Rhode Island 8.95 24
28 Nevada 8.80 43
29 Montana 8.78 31
30 Wisconsin 8.67 28
31 Maine 8.64 34
32 Missouri 8.49 29
33 Alabama 8.26 27
34 Alaska 8.24 40
35 Florida 8.09 32
36 Indiana 7.99 36
37 Kansas 7.90 30
38 South Carolina 7.88 33
39 Iowa 7.84 35
40 Tennessee 7.42 38
41 Nebraska 7.35 37
42 North Dakota 6.62 39
43 Wyoming 6.34 50
44 South Dakota 5.96 45
45 Kentucky 5.91 44
46 Oklahoma 5.86 46
47 Arkansas 5.85 42
48 West Virginia 5.59 47
49 Louisiana 5.14 48
50 Mississippi 4.70 49
u.S. average 10.00
Aggregated Innovation capacity Scores
100th–76th percentile 75th–51st percentile 50th–26th percentile 25th–1st percentile

The 2012 S ta te New economy Index | I n fo rmat ion Techno logy and Innovat ion Foundat ion | 43
the IndexInnovation Capacity
high-Tech JobsThe share of employment in the electronics manufacturing, software and computer-related services, telecommunications, and biomedical industries
Why Is This Important? The high-tech sector remains a key engine of innovation and a source of high-paying jobs. The 2000 meltdown, growth of IT offshoring, and faster productivity growth in the IT sector all caused a decline in high-tech employment, which began to rebound in 2004 and 2005. Between 2005 and 2006, 60 percent more high-tech jobs were created than between 2004 and 2005. Yet high-tech jobs were not immune from the recession. In 2009 the high-tech industry lost 245,600 jobs—a 4 percent decline—followed by a loss of 115,800 jobs in 2010—a smaller, 2 percent decline, but a decline nonetheless. In fact, only eight states added jobs in the high-tech sector in 2010, with Michigan, West Virginia, Utah, and South Carolina showing the largest gains. Despite these losses, the high-tech sector remains a stronghold of high-wage jobs: in 2010, the average high-tech industry wage was 93 percent higher than the average private sector wage.94
The Rankings: High-tech specialization of states varies significantly, from a high of 7.8 percent of the workforce in Massachusetts to 1.4 percent in Wyoming. While all states have high-tech jobs, the leaders tend to be in the Northeast, the Mountain states, and the Pacific region. High-tech industry jobs are often concentrated in particular regions of a state: information technology in southern New Hampshire, software around Provo, Utah and Seattle; semiconductors in Boise, Idaho, and Albuquerque, New Mexico;
biotechnology in the Washington, D.C., and Philadelphia areas; telecommunications in Denver; and a broad mix of technologies in Silicon Valley and Los Angeles. States with lower rankings tend to be natural resource-dependent states (such as Alaska, Montana, and Wyoming,) or Southern states with more branch-plant traditional industries (such as Mississippi, Louisiana, and Kentucky).
“In 2010, the average high-tech industry wage was 93 percent higher than the
average private sector wage.”
The Top Fivepercentage of jobs in high-tech
industries
1 Massachusetts 7.8%
2 New Mexico 7.1%
3 Virginia 6.7%
4 Maryland 6.4%
5 California 6.0%
u.S. average 4.1%
The Top Five movers 2010 rank 2012 rank rank Change
1 Rhode Island 23 16 +7
2 Tennessee 39 34 +5
3 Alabama 28 25 +3
3 Indiana 30 27 +3
5 Montana 45 43 +2
5 South Carolina 38 36 +2
Source: TechAmerica Foundation, 2011; Bureau of Labor Statistics, 2011
100th–76th percentile 75th–51st percentile 50th–26th percentile 25th–1st percentile
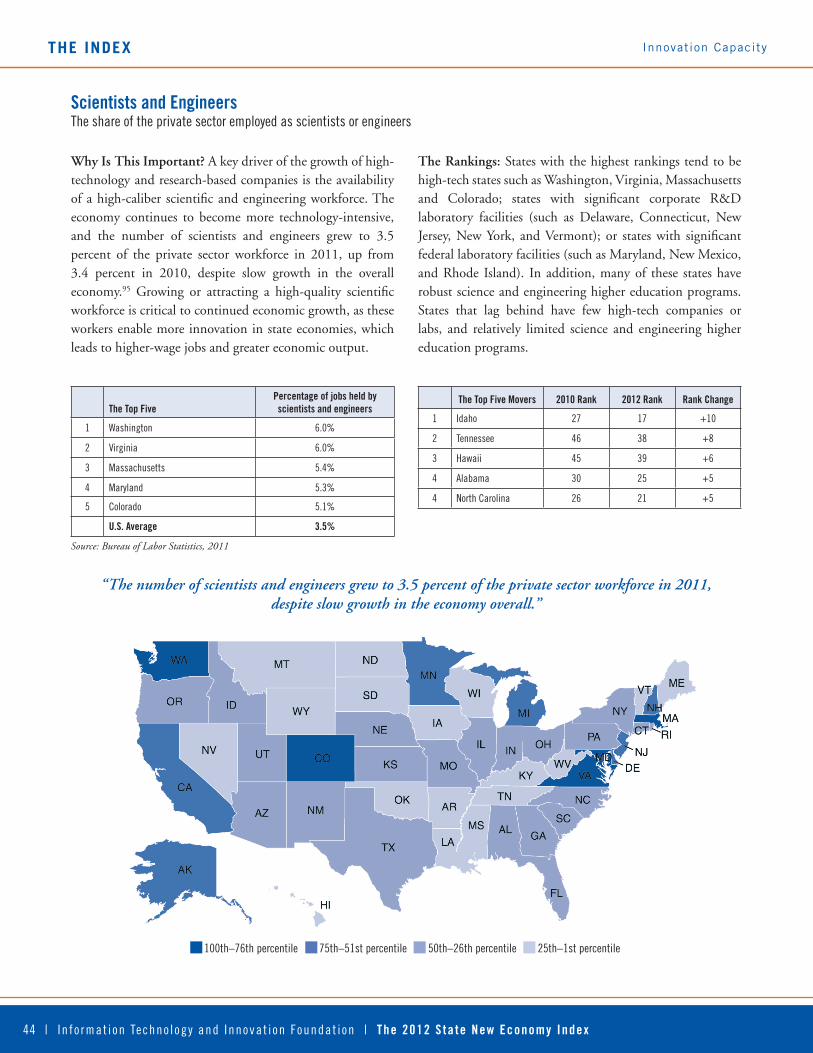
44 | In fo rmat ion Techno logy and Innovat ion Foundat ion | The 2012 S ta te New economy Index
the Index Innovation Capacity
Scientists and engineersThe share of the private sector employed as scientists or engineers
Why Is This Important? A key driver of the growth of high- technology and research-based companies is the availability of a high-caliber scientific and engineering workforce. The economy continues to become more technology-intensive, and the number of scientists and engineers grew to 3.5 percent of the private sector workforce in 2011, up from 3.4 percent in 2010, despite slow growth in the overall economy.95 Growing or attracting a high-quality scientific workforce is critical to continued economic growth, as these workers enable more innovation in state economies, which leads to higher-wage jobs and greater economic output.
The Rankings: States with the highest rankings tend to be high-tech states such as Washington, Virginia, Massachusetts and Colorado; states with significant corporate R&D laboratory facilities (such as Delaware, Connecticut, New Jersey, New York, and Vermont); or states with significant federal laboratory facilities (such as Maryland, New Mexico, and Rhode Island). In addition, many of these states have robust science and engineering higher education programs. States that lag behind have few high-tech companies or labs, and relatively limited science and engineering higher education programs.
“The number of scientists and engineers grew to 3.5 percent of the private sector workforce in 2011, despite slow growth in the economy overall.”
The Top Fivepercentage of jobs held by scientists and engineers
1 Washington 6.0%
2 Virginia 6.0%
3 Massachusetts 5.4%
4 Maryland 5.3%
5 Colorado 5.1%
u.S. average 3.5%
The Top Five movers 2010 rank 2012 rank rank Change
1 Idaho 27 17 +10
2 Tennessee 46 38 +8
3 Hawaii 45 39 +6
4 Alabama 30 25 +5
4 North Carolina 26 21 +5
Source: Bureau of Labor Statistics, 2011
100th–76th percentile 75th–51st percentile 50th–26th percentile 25th–1st percentile
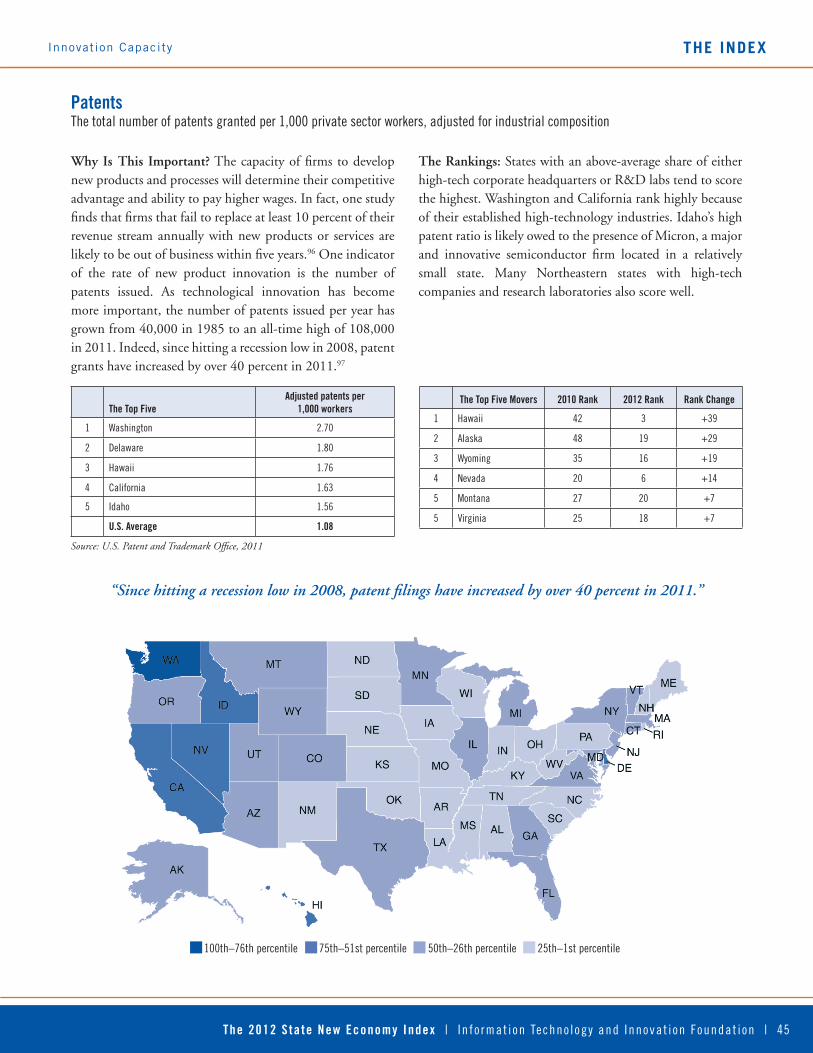
The 2012 S ta te New economy Index | I n fo rmat ion Techno logy and Innovat ion Foundat ion | 45
the IndexInnovation Capacity
patentsThe total number of patents granted per 1,000 private sector workers, adjusted for industrial composition
Why Is This Important? The capacity of firms to develop new products and processes will determine their competitive advantage and ability to pay higher wages. In fact, one study finds that firms that fail to replace at least 10 percent of their revenue stream annually with new products or services are likely to be out of business within five years.96 One indicator of the rate of new product innovation is the number of patents issued. As technological innovation has become more important, the number of patents issued per year has grown from 40,000 in 1985 to an all-time high of 108,000 in 2011. Indeed, since hitting a recession low in 2008, patent grants have increased by over 40 percent in 2011.97
The Rankings: States with an above-average share of either high-tech corporate headquarters or R&D labs tend to score the highest. Washington and California rank highly because of their established high-technology industries. Idaho’s high patent ratio is likely owed to the presence of Micron, a major and innovative semiconductor firm located in a relatively small state. Many Northeastern states with high-tech companies and research laboratories also score well.
“Since hitting a recession low in 2008, patent filings have increased by over 40 percent in 2011.”
The Top Fiveadjusted patents per
1,000 workers
1 Washington 2.70
2 Delaware 1.80
3 Hawaii 1.76
4 California 1.63
5 Idaho 1.56
u.S. average 1.08
The Top Five movers 2010 rank 2012 rank rank Change
1 Hawaii 42 3 +39
2 Alaska 48 19 +29
3 Wyoming 35 16 +19
4 Nevada 20 6 +14
5 Montana 27 20 +7
5 Virginia 25 18 +7
Source: U.S. Patent and Trademark Office, 2011
100th–76th percentile 75th–51st percentile 50th–26th percentile 25th–1st percentile

46 | In fo rmat ion Techno logy and Innovat ion Foundat ion | The 2012 S ta te New economy Index
the Index Innovation Capacity
Industry Investment in r&DThe amount of industry-performed research and development as a percentage of worker earnings, adjusted for industrial composition
Why Is This Important? Research and development yields product and process innovations, adds to the knowledge base of industry, and is a key driver of economic growth. On average, business performs 74 percent of all U.S. R&D. After steadily rising in the 1980s and falling in the early 1990s, industry R&D as a share of GDP climbed to a peak in 2000 at nearly 2.03 percent of GDP, and then declined through 2004. Since 2004, industry R&D spending has again picked up, reaching an all-time high of over 2.03 percent of GDP in 2008. In 2009, industry R&D was only slightly lower, at 2.02 percent of GDP.
The Rankings: Delaware far surpasses other states in R&D as a share of worker earnings in part because its R&D performance is dominated by a few firms—such as DuPont—with extremely high R&D investment. Much of Michigan’s success is due to its auto industry which hosts much of the North American auto industry R&D. Connecticut, New Jersey and California each have established high-technology industries with high R&D expenditure. In general, states with significant corporate R&D laboratory facilities, or a large number of high-tech firms, score well.
“Since 2004, industry R&D spending has picked up, reaching an all-time high of 2.03 percent of GDP in 2008.”
The Top Fiveadjusted industry r&D as a
percentage of worker earnings
1 Delaware 11.7%
2 Michigan 5.9%
3 Connecticut 5.7%
4 New Jersey 5.4%
5 California 4.7%
u.S. average 3.6%
The Top Five movers 2010 rank 2012 rank rank Change
1 Nevada 37 17 +20
2 Hawaii 44 27 +17
3 Iowa 29 13 +16
4 Arkansas 46 34 +12
4 Maine 38 26 +12
Source: National Science Foundation, 2009; Missouri and New Hampshire are estimated using prior year data.
100th–76th percentile 75th–51st percentile 50th–26th percentile 25th–1st percentile

The 2012 S ta te New economy Index | I n fo rmat ion Techno logy and Innovat ion Foundat ion | 47
the IndexInnovation Capacity
Non-Industry Investment in r&DThe amount of research and development performed outside of industry as a share of gross state product
Why Is This Important? While R&D performed outside of business constitutes only 26 percent of total R&D, federal, state, university, and nonprofit R&D has had a substantial impact on innovation. For example, in 2006, 77 of the 88 U.S. entities that produced award-winning innovations were beneficiaries of federal funding.98 Moreover, non-industry R&D helps lay the foundation for profitable future private sector research.
The Rankings: With Los Alamos and Sandia National Laboratory accounting for over 80 percent of New Mexico’s non-industry R&D, the state far exceeds any other state in non-industry R&D as a share of gross state product, at
nearly three times the national average. Maryland ranks
second, at over two times the national average, building on
Department of Defense laboratories and NASA’s Goddard
Space Flight Center.99 In fact, among the top five, only in
Massachusetts does a minority of non-industrial R&D come
from sources other than federal labs—university R&D
constitutes the majority of R&D preformed there. Other
states with large federal facilities, such as Alabama, Rhode
Island, and Virginia also score well. The challenge for all
states, but especially these leaders, is to continue to find ways
to translate these inputs into commercial outputs within
their borders.
“In 2006, 77 of the 88 U.S. entities that produced award-winning innovations were beneficiaries of federal funding.”
The Top FiveNon-industry r&D as a
percentage of gSp
1 New Mexico 6.6%
2 Maryland 4.4%
3 Rhode Island 1.5%
4 Massachusetts 1.4%
5 Virginia 1.3%
u.S. average 0.7%
The Top Five movers 2010 rank 2012 rank rank Change
1 Arizona 29 14 +15
2 Georgia 35 29 +6
2 Louisiana 43 37 +6
2 Michigan 34 28 +6
5 Kansas 44 41 +3
5 Pennsylvania 19 16 +3
Source: National Science Foundation, 2008, 2009
100th–76th percentile 75th–51st percentile 50th–26th percentile 25th–1st percentile
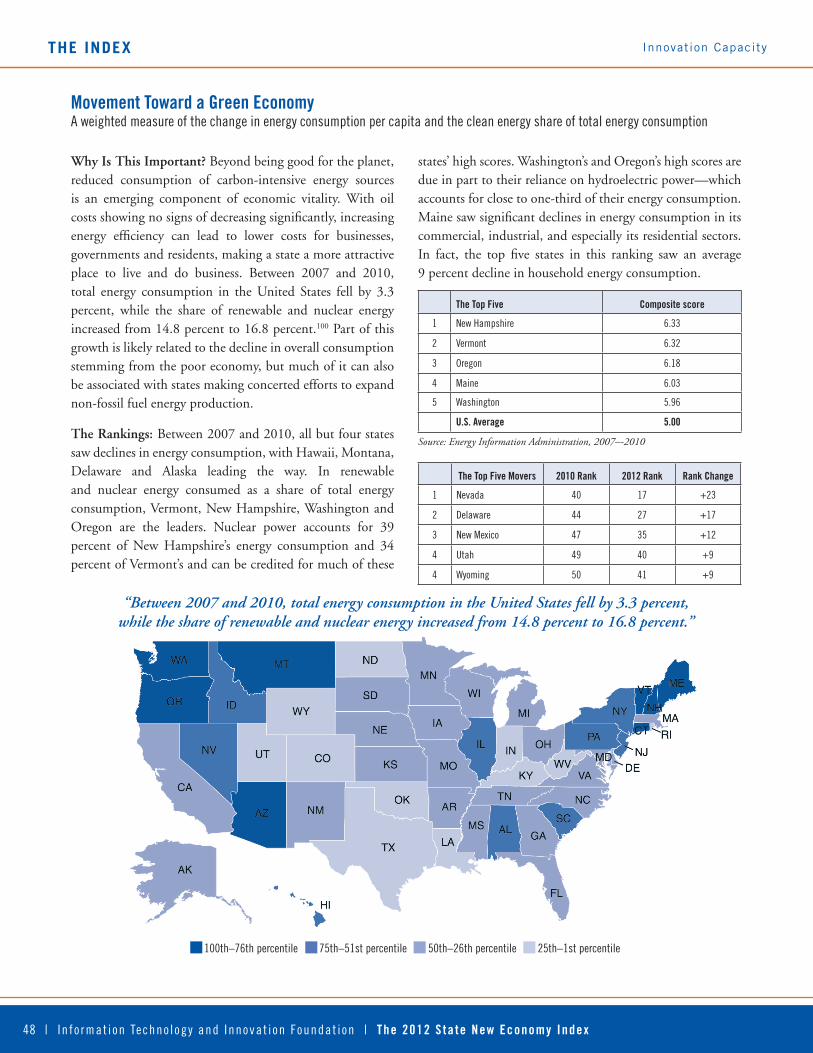
48 | In fo rmat ion Techno logy and Innovat ion Foundat ion | The 2012 S ta te New economy Index
the Index Innovation Capacity
movement Toward a green economyA weighted measure of the change in energy consumption per capita and the clean energy share of total energy consumption
Why Is This Important? Beyond being good for the planet, reduced consumption of carbon-intensive energy sources is an emerging component of economic vitality. With oil costs showing no signs of decreasing significantly, increasing energy efficiency can lead to lower costs for businesses, governments and residents, making a state a more attractive place to live and do business. Between 2007 and 2010, total energy consumption in the United States fell by 3.3 percent, while the share of renewable and nuclear energy increased from 14.8 percent to 16.8 percent.100 Part of this growth is likely related to the decline in overall consumption stemming from the poor economy, but much of it can also be associated with states making concerted efforts to expand non-fossil fuel energy production.
The Rankings: Between 2007 and 2010, all but four states saw declines in energy consumption, with Hawaii, Montana, Delaware and Alaska leading the way. In renewable and nuclear energy consumed as a share of total energy consumption, Vermont, New Hampshire, Washington and Oregon are the leaders. Nuclear power accounts for 39 percent of New Hampshire’s energy consumption and 34 percent of Vermont’s and can be credited for much of these
states’ high scores. Washington’s and Oregon’s high scores are due in part to their reliance on hydroelectric power—which accounts for close to one-third of their energy consumption. Maine saw significant declines in energy consumption in its commercial, industrial, and especially its residential sectors. In fact, the top five states in this ranking saw an average 9 percent decline in household energy consumption.
“Between 2007 and 2010, total energy consumption in the United States fell by 3.3 percent, while the share of renewable and nuclear energy increased from 14.8 percent to 16.8 percent.”
The Top Five Composite score
1 New Hampshire 6.33
2 Vermont 6.32
3 Oregon 6.18
4 Maine 6.03
5 Washington 5.96
u.S. average 5.00
The Top Five movers 2010 rank 2012 rank rank Change
1 Nevada 40 17 +23
2 Delaware 44 27 +17
3 New Mexico 47 35 +12
4 Utah 49 40 +9
4 Wyoming 50 41 +9
Source: Energy Information Administration, 2007–-2010
100th–76th percentile 75th–51st percentile 50th–26th percentile 25th–1st percentile

The 2012 S ta te New economy Index | I n fo rmat ion Techno logy and Innovat ion Foundat ion | 49
the IndexInnovation Capacity
venture CapitalThe amount of venture capital invested as a percentage of worker earnings
Why Is This Important? Venture capital is an important source of funding for new, fast-growing entrepreneurial companies. In effect, venture capitalists identify promising innovations and help bring them to the marketplace. Venture capital funding peaked in 2000 at $105 billion, in the midst of the high-tech boom, and then dropped precipitously after the tech bubble burst, falling to just $20 billion in 2003. Since then, it increased slowly until falling again during the Great Recession. However, since the recession venture capital investment has recovered to its pre-recession levels, and between 2009 and 2011, venture capital investment increased by nearly 45 percent to $29 billion.101
The Rankings: In 2011, 60 percent of venture capital was located in California and Massachusetts. Each receives nearly four times more venture capital as a share of worker earnings than the average state. Both states not only have a robust venture capital industry, but also strong university engineering and science programs and an existing base of high-tech companies, both of which can be the source of entrepreneurial startups or spinoffs that receive venture capital funding.
“Between 2009 and 2011, venture capital investment increased by nearly 45 percent.”
The Top Fiveventure capital investment as a percentage of worker earnings
1 California 0.89%
2 Massachusetts 0.86%
3 Colorado 0.28%
4 Utah 0.26%
5 New York 0.23%
u.S. average 0.23%
The Top Five movers 2010 rank 2012 rank rank Change
1 Kansas 41 26 +15
1 New Mexico 34 19 +15
3 Maine 37 24 +13
4 Illinois 23 11 +12
5 Missouri 38 27 +11
Source: PriceWaterHouseCoopers, 2011
100th–76th percentile 75th–51st percentile 50th–26th percentile 25th–1st percentile
StAte economIc develoPment
50 | In fo rmat ion Techno logy and Innovat ion Foundat ion | The 2012 S ta te New economy Index
StAte economIc develoPment In An erA of relAtIve u.S. economIc declIne
It has been over 70 years since Mississippi initiated one of the first state economic development programs: “Balance Agriculture with Industry.” For most of
that time, the United States led the world economy and produced a vast array of new companies, many of which grew to become global leaders, bestowing the United States with new factories, offices, and job growth. At the same time, the competition from other countries was either relatively slight or non-existent. Most other nations were too small to attain the economies of scale firms needed to succeed. Many were effectively isolated from the global economy, behind the Iron Curtain or similar policy barriers. Others mistakenly put in place a host of anti-growth policies that kept them on the global economic sidelines. Metaphorically, the U.S. was fielding a “dream team” while playing in the minor leagues.
In this environment, it didn’t really matter that most U.S. states collectively spent tens of billions of dollars a year to move companies from one location in the United States to another. If, for example, one state or city wanted to waste $100 million to subsidize football or baseball fans with a better stadium, the only loss was to the taxpayers of the state or community. In other words, if a significant portion of what states and cities did contributed little or nothing to boosting overall U.S. economic competitiveness and innovation, it didn’t really matter; the U.S. economic engine was still going at 60 miles per hour and we were number one.
No more. As discussed in the introduction, the United States has fallen from its number one perch and is making glacial progress compared to many of our competitors. Our natural advantages have become less vital, while
many of our competitors’ weaknesses have ebbed. Firms in small nations can now acquire economies of scale by accessing global markets. China, India, Russia and Eastern Europe have joined the global economy and have been substantially improving their competitive position relative to the United States. Nation after nation has now implemented or is in the process of implementing far-reaching policies that enhance their economic competitiveness—including aggressive innovation policies that range from government support for R&D and workforce education to strategic support for key innovation-based industries such as life sciences, IT, and clean energy.
In this new, more competitive environment, the United States simply does not have the luxury of having 50 separate economic development policies that serve to redistribute the U.S. economic pie, instead of growing it. It is time for states to work together and with the federal government to reorient their economic development policies toward driving innovation and competitiveness both within their own borders and nationally. Indeed, old-economy economic development policies must now be adapted to the hyper-competitive New Economy; to stay ahead, states must develop comprehensive and cooperative “innovation strategies.”
This is not to say that competition between states (or between communities within states) is unhealthy. To return to a basketball metaphor, if all basketball teams do to compete is bid increasing amounts of money to recruit the next Derrick Rose, then the overall level of basketball play will not improve. But if they intensely compete by practicing, designing better plays, and improving athlete conditioning, then competition improves all teams and thus the overall level of play. Likewise, if states focus on boosting their infrastructure, education levels, business support systems, and technology development and transfer systems because they desire to win, then

StAte economIc develoPment
The 2012 S ta te New economy Index | I n fo rmat ion Techno logy and Innovat ion Foundat ion | 51
this improves not just the state, but also the nation as a whole. If every state engages in this sort of “win-win” competition, then the entire U.S. economy will grow stronger and become more internationally competitive.
Although the same reasoning applies on the local level, too many communities within states still see economic competitors next door as opposed to halfway around the globe. They use a host of incentives that do little more than change where a company locates or expands within the state. Imagine if these resources were used to expand the quality of the educational system, co-invest with broadband companies to expand broadband, support entrepreneurial assistance programs targeted at traded sector firms, or invest in research and technology transfer. If every community within a state implemented these sorts of policies, then the state would grow more nationally and globally competitive and, on average, individual communities would be better off.
Additionally, for state economies to thrive in the New Economy, they need to have vibrant and healthy traded sector firms. Because these industries face market competition that is national and increasingly global in nature, while nontraded, local-serving industries (like retail trade and personal services) do not, their success is by no means assured. On the one hand, while we may not know whether Safeway, Kroger or Walmart is going to gain market share in a particular state grocery store industry, we do know that the industry’s health is dependent only on the income and purchasing habits of the state’s consumers. On the other hand, while we may not know whether Boeing or Airbus is going to gain market share in the global aircraft industry, we also do not know whether there will be aviation industry jobs in Washington, Illinois, South Carolina or other Boeing locations, since this depends on the United States winning in global competition in this industry. Put differently, if a grocery store goes out of business
another will emerge (or expand) to take its place to serve local demand, but if a traded sector enterprise such as a manufacturer or software company closes, the one that takes its place may well be located in another state or increasingly another country. The result will be fewer state jobs and relatively lower wages.
This is not to say that some state economies are not more dependent on some services for traded sector health (such as insurance, finance, logistics, and headquarters functions), but rather that manufacturing is still the key enabler of most states’ traded-sector strength. Indeed, as Box 1 explains, in terms of scale, there is no traded sector more important to the vitality of the 50 state economies than manufacturing—in particular, advanced, technology-based manufacturing. Furthermore, manufacturing remains a key source of jobs that both pay well and have large employment multiplier effects.102 For this reason, manufacturing policy is a crucial component of a state’s innovation strategy.
To address these concerns, state innovation strategies should focus on three key policy areas: 1) policies to reduce zero-sum competition; 2) policies to spur win-win economic results; and 3) policies to support the traded sector—manufacturing in particular. Each is outlined in the following sections.
Policies to reduce Zero-Sum competition
States should start by taking steps to limit local communities’ within-state zero-sum strategies. There are several ways to do this. States could develop tax-base-sharing proposals. These would require a portion of any increase in commercial and industrial property tax revenues to be shared, giving all communities an incentive to cooperate in the economic development of the region. If shared tax-base revenue collected from industrial and commercial property goes to schools or
Policies to Reduce ZeRo-sum comPetition
52 | In fo rmat ion Techno logy and Innovat ion Foundat ion | The 2012 S ta te New economy Index
training, for example, it can lead to an increase in overall welfare. States could also make receipt of various state funds contingent on signing no-compete agreements stipulating that they will not provide incentives to in-state firms to relocate within the state. States can also make sure that any state programs (like state-owned industrial parks) are not used to support movement of firms from one community in the state to another.
States should also work to reduce interstate zero-sum competition. Over the last several decades, states have occasionally considered interstate compacts or other agreements to collaborate more on economic development and engage in less zero-sum-based competition. But, generally, these efforts fail to make it through states’ legislative processes. Yet, given the critical need for such collaboration in these desperate economic times, there is hope that the field for these policies is now more fertile. Toward that end, ITIF encourages regional state groups, such as the New England Governors’ Conference, and national organizations like the National Governors Association (NGA) to actively work on developing shared principals that states can sign onto to move more of their economic development efforts toward positive-sum efforts. They could start by agreeing to a one-year moratorium on financial incentives for firm relocation, except for U.S. firms that would otherwise moves jobs outside of the United States, or for foreign multinationals that require incentives to move jobs to the United States.
While groups like the NGA need to facilitate this collaboration, the federal government needs to play a key role in enabling and supporting it. In other words, the federal government needs to do much more to help states invest more in the kind of win-win strategies described below. Toward that end, we encourage Congress and the Administration to support a new $2 billion annual Winning Through Regional Innovation (WTRI) fund
that would provide matching grants to states to support their innovation-based, win-win economic development policies and programs. States that provide financial incentives to firms that simply move a job from one state to another would receive relatively less money from the WTRI fund.
Policies to Spur Win-Win economic growth
While states and communities can reduce incentives on zero-sum competition, they can also expand incentives and programs to spur win-win results that benefit both the state and the nation. For details, readers can refer to the 2008 State New Economy Index, which lists a wide array of innovative win-win policies that many states have already adopted in areas such as education and workforce development, entrepreneurial development, research support, technology transfer and commercialization, and manufacturing modernization.103
In an environment of fiscal constraint, however, many states face tough budget choices and many of these initiatives are not likely to be on the table until fiscal situations improve. But states can and should also work creatively to identify policies that can spur innovation on a budget, essentially embracing a “poor man’s innovation policy.” In order to establish a new innovation agenda within a fiscally constrained environment, states need to do three things. First, they need to refocus on the fundamentals of economic development (see the 2010 State New Economy Index, Box 1, for details).104
Second, states need to reprogram funding going to zero-sum incentives (such as those targeted at moving firms from one state to another), cut areas that can afford to be cut, and invest in the areas that promise long-term growth and innovation. While this can be difficult, it can be done. A case in point is Finland. With the breakup of the Finland’s largest trading partner, the Soviet Union, in the early 1990s, the Finish
StAte economIc develoPment Policies to sPuR win-win economic gRowth

The 2012 S ta te New economy Index | I n fo rmat ion Techno logy and Innovat ion Foundat ion | 53
economy went into a tailspin, contracting by 10 percent in just three years. The fiscal pressures on the central government were severe. But rather than succumb to the “everything should be on the table” view of budget cutting (a view that is all too popular in some states and Washington, D.C.), Finland took the long view. While it cut government spending, it also reduced business taxes and increased investments, particularly investments to help transform the Finish economy from one dependent on natural resources to one dependent on knowledge and innovation. The results are clear. Finland today stands as a one of the leading innovation economies of the globe. Hence, it is incumbent upon state governments to use the current fiscal environment as an opportunity to focus and force a re-examination of the role of state government in supporting innovation. Indeed, the current fiscal situation could help increase both political and economic slack, enabling tough cuts in programs that are not performing but that have large or powerful supporting constituencies.
Third, states need to identify ways to drive innovation by using existing resources much more effectively. Whenever possible, they should use existing budgets to incentivize innovation. There is a wide variety of options available for tying resources to innovation, from explicitly making innovation priorities a requirement for state dollars, to “nudging” citizens, industries and governments to think and act innovatively. For example, state dollars can go further when they leverage non-state dollars and assets. Too many programs fail to take advantage of this opportunity. Of course, federal government dollars are often the first leverage source, whether it is federal grants that capitalize state-run revolving loan funds to increase access to low-cost capital, or other federal matching funds. Another approach is to ensure that more state programs seek to leverage private sector and industry funding to augment support for government-funded activities. States can stimulate action and cultivate
innovation and knowledge networks with the use of these outside funds. Cluster initiatives are particularly well suited to tough budget times because they are designed to spark local initiatives, rather than provide full funding. They are also an effective way of ensuring that federal dollars are well spent—that is, in a manner that supports business-led strategies, rather than as a series of stove-piped federal initiatives unconnected to other federal efforts or to the regional economy in which they will function.
An even less expensive option is to convene private and public sector leaders to facilitate knowledge networks, and further seeding of these initiatives can be an even lower cost strategy with the leveraging of existing funds. States can bring together leaders and assets to devise state and regional innovation strategies, from conducting assessments like gap analyses and “strength, weaknesses, opportunities and threats” (SWOT analysis), to the planning and development of regional innovation clusters. Such plans and strategies increase broad-scale understanding of the importance of innovation and entrepreneurship and serve to guide and align long-term investment. Although some individuals and organizations often resist change that threatens established economic positions, planned regional innovation strategies can empower innovators over old-economy stakeholders, whether the former are in business and government or consumers and workers. States should utilize their educational institutions to assist in the process. State governments routinely provide monies to other organizations (such as local governments, educational institutions, nonprofit organizations, health care providers, etc.) to achieve some public purpose. But all too often, accountability is process-based rather than outcome-based. Focusing on process-based accountability or whether the funds were spent according the organizations’ budgets often stifles creativity and innovation in the organizations receiving
StAte economIc develoPmentPolicies to sPuR win-win economic gRowth

54 | In fo rmat ion Techno logy and Innovat ion Foundat ion | The 2012 S ta te New economy Index
support. States should push organizations that receive funding to achieve outcomes.
State governments could be a major engine of innovation if funding focused on performance and organizational innovation. Indeed, state governments should explicitly use the power of purse strings to drive innovation among the recipients of those funds and allocate money on the basis of having recipient agencies, departments, or benefactors implement innovative policies or approaches. The idea is to take the same amount of money, but allocate it on the basis of incentives to drive performance improvements and innovation. In this case, state government has a role to play in developing policies that use performance-based funding and incentives to push back against institutional inertia. For example, states that are unwilling to leverage data and accountability systems to improve measurable performance outcomes, that have legislation preventing the development or expansion of innovative school approaches, or that cannot demonstrate effective alliances with local teachers’ unions on performance accountability, are not eligible to apply for innovation-based education funds. States could employ a similar model and reward universities that drive innovation, allocating state funds on the basis of how successful universities are at securing outside research funds, especially from industry, at commercializing technology in-state, and at producing faculty startups.
Policies to Support manufacturing competitiveness
Without a competitive manufacturing sector, it will be difficult for state economies to achieve the kinds of robust growth rates they enjoyed in decades like the 1990s. ITIF has argued that both states and the federal government need to implement what we call the “4Ts” of manufacturing policy: tax, trade, technology and
talent. While trade is mostly in the realm of the federal government, there are many policies available in the other three areas that can help restore manufacturing competitiveness.
In tax policy, states should create tax incentives for innovation, while ending shortsighted tax incentives that do little to spur economic growth. For example, approximately 22 states have job-creation tax credits, but evaluations of these programs suggest that they do little to induce firms to hire more workers. When the state of North Carolina evaluated its William S. Lee Act job-creation tax credits, it found that only about 4 percent of jobs claimed under the act were actually induced by the tax credits. Firms hire more workers if they believe that the demand for their products or services is going to increase sufficiently to create work for the added worker, not if the government temporarily offsets the cost of a new employee by a small percentage.105 States would do better to allocate these “tax expenditures” toward investment tax credits for companies’ expenditures on capital equipment. Doing so will make it more likely that firms will invest in productivity-enhancing technologies.
States can also utilize tax policies to spur R&D investment. First, they should align state R&D tax credits with the federal Alternative Simplified R&D Tax Credit (ASC). Studies show that the research and development tax credit is an effective way of stimulating private sector R&D.106 Moreover, state R&D tax credits appear to be even more effective than the federal credit.107 For example, a recent study of the California R&D tax credit found that it stimulated considerably more R&D than the federal credit.108 Approximately 38 states have R&D tax credits, and approximately half of these states link to the federal R&D credit, which allows firms to take a credit of 20 percent on increases in R&D over a fixed-base period. However, because of limitations
StAte economIc develoPment Policies to suPPoRt manufactuRing comPetitiveness
The 2012 S ta te New economy Index | I n fo rmat ion Techno logy and Innovat ion Foundat ion | 55
with the regular credit, in 2006 Congress created the ASC, which lets companies receive a credit of 14 percent of the amount of qualified expenses that exceed 50 percent of the average qualified research expenses for the preceding three years. States should follow the model of Washington State, which recently passed legislation allowing firms there who take the federal ASC to also take the state credit.109
Perhaps the best technology policy states can implement is to fully fund their Manufacturing Extension Partnership (MEP) centers that work with small manufacturers to become more productive and innovative. MEP centers have had a considerable impact on boosting the productivity, competitiveness, and innovation potential of America’s small- and medium-sized enterprise (SME) manufacturers, and states should fully avail themselves of the opportunity to help their SMEs engage MEP services. Beyond funding, states should connect the innovation and delivery aspects of the MEP program to the state’s broader strategic objectives, plans, and key partners and stakeholders helping to achieve their economic development vision.
Another effective technology policy is to create a statewide commercialization and entrepreneurship organization. Indeed, states should have at least one organization committed to maximizing both commercialization and entrepreneurship as part of its mission. One model is Oklahoma’s nonprofit i2E organization. Through its various programs, i2E helps Oklahoman companies with strategic planning assistance, networking opportunities, and access to capital. i2E’s Oklahoma Technology Commercialization Center assists researchers, inventors, entrepreneurs, and companies in turning advanced technologies and high-tech startups into growing companies. It also runs an annual entrepreneurship competition open to all faculty and students at Oklahoma universities.110 Likewise,
Pennsylvania’s Ben Franklin Technology Partners have, over their 25-year history, evolved to serve as a statewide resource for technology commercialization for entrepreneurs.
In talent policy, states would be wise to focus on improving science, technology, engineering, and mathematics (STEM) education at both the high school and junior college levels. Relative to other countries, the United States does better in its production of high-level technical workers; however, when it comes to mid-level technical workers—those necessary to manage the sophisticated production lines of advanced manufacturers—the United States falls flat. Steve Jobs testified as much when asked by President Obama what it would take to move Apple’s manufacturing facilities back to the United States: “Apple had 700,000 factory workers employed in China,” he said, and that was because it needed 30,000 engineers on-site to support those workers. “You can’t find that many in America to hire,” he said. These factory engineers did not have to be PhDs or geniuses; they simply needed to have basic engineering skills for manufacturing.”111 One remedy for this problem is for states to create more STEM high schools. A number of states—including Illinois, North Carolina, Texas and Virginia—have already done so. For example, Texas’s T-STEM initiative seeks to create specialty STEM high school academies throughout the state. These schools are a powerful tool for producing high school graduates with a strong passion for science and math that translates into much higher rates of college attendance and graduation in scientific fields.112 Further, all states should adopt the new standards laid out by the National Governors Association that recommend engineering curriculum in both middle schools and high schools.113 Another remedy is for states to expand manufacturing technology programs at community colleges. For example, in 2011, Connecticut’s legislature provided $20 million in bonds to establish
Policies to suPPoRt manufactuRing comPetitiveness StAte economIc develoPment

56 | In fo rmat ion Techno logy and Innovat ion Foundat ion | The 2012 S ta te New economy Index
or enhance manufacturing technology programs at three community colleges.114
Finally, instead of reflexively focusing on spurring more enrollment in higher education, states should instead focus more resources on the types of programs that better prepare individuals with skills in demand by traded sector employers, and that facilitate individuals getting more on-the-job work experience. A number of states have moved in this direction by expanding apprenticeship and co-op programs, school-to-work programs, industry-skills alliances, tax credits for employer-based training, and employer-community college partnerships. Wisconsin and Georgia have strong youth apprenticeship programs. A number of states and local school districts have established career academies within high schools. Several states have established regional skills alliances—industry-led partnerships that address workforce needs in a specific region and industry sector.115 Michigan has provided competitively- awarded startup grants and technical assistance to 25 industry-led regional skills alliances. Pennsylvania’s $15 million Industry Partnerships program brings together multiple employers, and workers or worker representatives when appropriate, in the same industry cluster to address overlapping human capital needs. In addition, Pennsylvania has supported a number of specialized industry-led training institutes, such as the Precision Manufacturing Institute,116 the Advanced Skill Center,117 and New Century Careers.118 Other states, such as California and Rhode Island, have established tax credits for company investments in workforce development.119
StAte economIc develoPment Policies to suPPoRt manufactuRing comPetitiveness

The 2012 S ta te New economy Index | I n fo rmat ion Techno logy and Innovat ion Foundat ion | 57
concluSIonThe U.S. economy has faced competitiveness challenges before, and each time policymakers have responded accordingly. However, the current challenge of competitiveness and manufacturing decline is more severe than ever before, and on the federal level, our political system seems less able to respond with the kinds of comprehensive solutions that take the best from “both sides of the aisle” than it has been for at least a century. Until federal action is forthcoming, states will be the level of government best positioned to spur on the process of economic revitalization, but only if they stake out new ground and new approaches.
States that score highly on the State New Economy Index are best able to face the challenges brought on by the New Economy transformation, while lower-scoring states have significant ground to make up. While low-scoring states would perhaps benefit most from
concluSIon
implementing comprehensive and cogent innovation strategies, even the high-scoring states have room for improvement. Indeed, all of the states, and perhaps most importantly, the federal government, need to implement innovation strategies in order to compete in the New Economy. Successful strategies will incentivize, among other things, having a workforce and jobs based on higher skills; strong global connections; dynamic firms, including strong, high-growth entrepreneurial startups; industries and individuals embracing digital technologies; and strong capabilities in technological innovation. Without these, virtually every U.S. state will find itself perpetually stuck in the economic doldrums, unable to reap the job growth and quality of life improvements that the New Economy enables.

58 | In fo rmat ion Techno logy and Innovat ion Foundat ion | The 2012 S ta te New economy Index
APPendIx: Index methodology
APPendIx: Index methodologyAs with previous editions, the 2012 State New Economy Index controls for a state’s industrial composition when considering variables that measure company behavior: R&D, exports, patents, and manufacturing value added. Holding industrial composition constant is important, because some industries inherently invest more in R&D, export more, produce more patents, or are more productive than other industries. For example, without controlling for industrial composition, the state of Washington would score very high in manufacturing exports because its aviation sector is so large relative to the rest of its economy, and exports are a large share of an aviation industry’s output. Accounting for a state’s industrial composition presents a more accurate measure of the degree to which companies in a state, irrespective of the industry they are in, export, invest in R&D, or generate patents. Similarly, manufacturing value added is measured on a sector-by-sector basis, ensuring that a state’s companies are compared to the nationwide performance of firms in the same industry. Industrial composition is controlled for on the following indicators: Manufacturing Value Added, Export Focus of Manufacturing and Services, Patents, and Industry Investment in R&D.
Because each State New Economy Index since 1999 has used slightly different indicators and methodologies, the total scores are not directly comparable. Therefore, a state’s movement to a higher or lower overall rank between editions may not positively reflect actual changes in its economic structure. In all cases, the report relies on the most recently published statistics available; however, because of delays in the publishing of government statistics, some data may be several years old. Where applicable and appropriate, raw data is normalized to control for factors such as state population and GDP.
Raw scores for each indicator are standardized. Weights for each indicator are determined according to their relative importance and adjusted such that closely
correlated indicators do not bias the final results. To produce the section scores, the standardized indicators scores under each section are multiplied by their respective weights, summed, and then this sum is translated by +10. The overall score is calculated by first summing the maximum score of each section to determine a “maximum potential overall score.” The overall score for each state is then the sum of the state’s score on each section, which is then expressed as a percentage of the maximum potential overall score. The maps were coded by partitioning the score distributions into quartiles. The quartiles do not necessarily contain an equal number of states, but rather indicate whether a state’s score falls into a particular quartile range.

The 2012 S ta te New economy Index | I n fo rmat ion Techno logy and Innovat ion Foundat ion | 59
Indicator Weights
Indicator Weight
Knowledge Jobs ............................................................. 5.00 Information Technology Jobs ..................................................0.75 Managerial, Professional, and Technical Jobs ...........................0.75 Workforce Education ..............................................................1.00 Immigration of Knowledge Workers .......................................0.50 Migration of U.S. Knowledge Workers ...................................0.50 Manufacturing Value Added ...................................................0.75 High-Wage Traded Services .....................................................0.75
Globalization ................................................................. 2.00 Foreign Direct Investment ......................................................1.00 Export Focus of Manufacturing and Services...........................1.00
Economic Dynamism .................................................... 3.50 Job Churning ..........................................................................1.00 Fast Growing Firms .................................................................0.75 Initial Public Offerings ............................................................0.50 Entrepreneurial Activity ..........................................................0.75 Inventor Patents ......................................................................0.50
The Digital Economy .................................................... 3.00 Online Population ..................................................................0.50 E-government .........................................................................0.50 Online Agriculture ..................................................................0.50 Broadband Telecommunications .............................................1.00 Health IT ................................................................................0.50
Innovation Capacity ...................................................... 5.00 High-Tech Jobs .......................................................................0.75 Scientists and Engineers ..........................................................0.75 Patents ....................................................................................0.75 Industry Investment in R&D ..................................................1.00 Non-Industry Investment in R&D .........................................0.50 Movement Toward a Green Economy .....................................0.50 Venture Capital .......................................................................0.75
Overall (sum) ............................................................... 18.50
APPendIx: Index methodologyindicatoR weights

60 | In fo rmat ion Techno logy and Innovat ion Foundat ion | The 2012 S ta te New economy Index
APPendIx: Index methodology
Indicator methodologies and data Sources
page 19 Information Technology Jobs Methodology: Because the High-Tech Jobs indicator captures the number of IT workers employed
in the IT sector, this indicator estimates the number of IT workers in non-IT sectors. All figures include only private sector jobs. The shares of IT worker employment in IT industries (NAICS 334, 5112, and 5415) are first estimated on the national level. These shares are then applied to the same IT industries on the state level, which provides a proxy for number of IT jobs in the IT sector for each state. The total number of IT workers in each state is determined by summing BLS occupation codes (2010 SOC 15-0000 and 11-3021). The estimated number of IT workers in the IT sectors of each state is then subtracted from total number of IT workers in each state to get the number of IT workers in non-IT sectors for the final score, expressed as a share of total private sector employment.
Data sources: Bureau of Labor Statistics, Occupational Employment Statistics (national 3-digit NAICS industry-specific estimates, 2011; national 4-digit NAICS industry specific estimates, 2011; state cross-industry estimates, 2011; accessed August 7, 2012), http://www.bls.gov/oes/oes_dl.htm;
Bureau of Labor Statistics, Quarterly Census of Employment and Wages (special requests, beta files, 2011 annual by industry; accessed August 7, 2012), ftp://ftp.bls.gov/pub/special.requests/cew/beta/2011/.
page 20 managerial, professional and Technical Jobs Methodology: Managerial, professional and technical jobs are defined as the following federal SOC
(2010) codes in the private sector: 11-0000, 13-0000, 15-0000, 17-0000, 21-0000, 23-0000, 19-0000, 25-0000 (excluding 25-2011, 25-9031, 25-9041), 27-0000 (excluding 27-1023, 27-1025, 27-1026, 27-2022, 27-2023, 27-2031, 27-2032, 27-2041, 27-2042, 27-3011, 27-3012, 27-3091, 27-4021), 29-0000, 41-3031, 41-4011, 49-1011, 49-2011, 49-2022, 49-2091, 49-2094, 49-2095, 49-3011, 49-3041, 49-3052, 49-9041, 49-9052, 51-4012, 53-2021. Total managerial professional and technical jobs are expressed as a percentage of total private sector employment for the final score.
Data source: Bureau of Labor Statistics, Occupational Employment Statistics (national cross-industry estimates, 2011; state cross-industry estimates, 2011; accessed August 8, 2012), http://www.bls.gov/oes/oes_dl.htm.
page 21 workforce education Methodology: The shares of each states population aged 25 years and over with no high school
diploma, some college (1 or more years, no degree), associate’s degree, bachelor’s degree, master’s or professional school degree, and doctorate degree are calculated. Each degree class is assigned a weight: -0.05 for no high school diploma, 0.25 for some college, 0.5 for associates degree, 1 for bachelor’s degree, 1.5 for master’s or professional degree, and 2 for doctorate degree. Each share is multiplied by its respective weight for the final score.
indicatoR methodologies and data souRces

The 2012 S ta te New economy Index | I n fo rmat ion Techno logy and Innovat ion Foundat ion | 61
APPendIx: Index methodology
Data source: Census Bureau, 2010 American Community Survey 1-year Estimates (B15003: educational attainment for the population 25 years and over; accessed July 31, 2012), http://factfinder2.census.gov/.
page 22 Immigration of Knowledge workers Methodology: The educational attainment of recent (last year) immigrants from abroad, aged 25
years and older, is classified as either less than high school graduate, high school graduate (includes equivalency), some college or associate’s degree, bachelor’s degree, or graduate or professional degree. Each degree class is assigned a weight based on the equivalent average years of schooling the U.S. education system would require for the level of education attainment: 0 for less than high school graduate, 12 for high school graduate, 14 for some college or associate’s degree, 16 for bachelor’s degree, and 18.95 for graduate or professional degree (the average number of years of schooling of the U.S. population of graduate, professional, and doctorate holders). The number of recent immigrants in each education class is multiplied by its respective weight, and then divided by the total number of recent immigrants aged 25 years and older for the final score.
Data source: Census Bureau, 2010 American Community Survey 1-year Estimates (B07009: geographical mobility in the past year by educational attainment for current residence in the United States; accessed July 31, 2012), http://factfinder2.census.gov/.
page 23 migration of u.S. Knowledge workers Methodology: The educational attainment of recent (last year) immigrants from other states within
the United States, aged 25 years and older, is classified as either less than high school graduate, high school graduate (includes equivalency), some college or associate’s degree, bachelor’s degree, or graduate or professional degree. Each degree class is assigned a weight based on the average years of schooling the U.S. education system would require for the level of education attainment: 0 for less than high school graduate, 12 for high school graduate, 14 for some college or associate’s degree, 16 for bachelor’s degree, and 18.95 for graduate or professional degree (the average number of years of schooling of the U.S. population of graduate, professional, and doctorate holders). The number of recent immigrants in each education class is multiplied by its respective weight, and then divided by the total number of recent immigrants aged 25 years and older for the final score.
Data source: Census Bureau, 2010 American Community Survey 1-year Estimates (B07009: geographical mobility in the past year by educational attainment for current residence in the United States; accessed July 31, 2012), http://factfinder2.census.gov/.
page 24 manufacturing value added Methodology: Value added per hour is calculated for each 4-digit NAICS industry within the
manufacturing sector (NAICS 31-33) for each state. Where current year data is unavailable, previous year data is used as a proxy. Where neither current year nor previous year data is available, unavailable data is calculated as an aggregate “remainder” by subtracting available data from the total of the parent industry (one digit up—for example, the parent industry of NAICS 3329 is NAICS 332). Value added per hour for each 4-digit industry with available data in each state is then
indicatoR methodologies and data souRces

62 | In fo rmat ion Techno logy and Innovat ion Foundat ion | The 2012 S ta te New economy Index
expressed as a ratio to value added per hour for the same industry on the national level. Each ratio is then multiplied by employment (either current year or previous year, depending on the ratio’s year) in its respective 4-digit industry for each state, which is then summed across industries in each state to determine the level of manufacturing employment the state would be expected to have in order to produce the same level of value added but with manufacturing labor productivity (value added per hour) equal to the national baseline (“expected available employment”).
The aggregate “remainders” for each state are used to determine equivalent remainders on the national level where the United States missing the same industry data as each state. Value added per hour for each state remainder is then expressed as a ratio to value added per hour for the equivalent remainder on the national level. Each ratio is then multiplied by employment in the remainder for each state, which is then summed across the remainders for each state (“expected remainder employment”). The share of each state’s manufacturing employment contained within its remainders is calculated (“remainder share”). Because the accuracy of the remainder estimates decrease as the size of the remainders increase, both expected remainder employment and actual remainder employment are multiplied by unity minus the remainder share, such that the influence of the remainders on each state’s final score decreases as uncertainty about remainder precision increases (“adjusted expected remainder employment” and “adjusted actual remainder employment”). Adjusted expected remainder employment is summed with expected available employment for each state. Adjusted actual remainder employment is likewise summed with actual available employment. The final score is then the ratio of the summed expected employment to summed actual employment, such that states that outperform national baseline manufacturing productivity score greater than unity, and states that underperform score less than unity.
Data source: Census Bureau, 2010 Annual Survey of Manufactures (AM1031AS101: geographic area statistics: statistics for all manufacturing by state: 2010 and 2009; AM1031GS101: general statistics: statistics for industry groups and industries: 2010 and 2009; accessed August 1, 2012), http://factfinder2.census.gov/.
page 25 high-wage Traded Services Methodology: The median of the average weekly wages of 73 traded service industries is calculated
on the national level. All data is for the private sector only. The following is a list of the NAICS (2012) codes for the 73 industries, with bolded industries having an average weekly wage higher than the median: 4251, 4811, 4812, 4821 (excluding 482112), 4831, 4841 (excluding 48411), 4842 (excluding 48422), 4852, 4855, 4861, 4862, 4869, 4871, 4872, 4879, 4881, 4882, 4883, 4884, 4885, 4889, 4931, 51112, 51113, 51114, 51119, 5121 (excluding 51213), 5122, 5152, 5191 (excluding 51912), 5221, 5222, 5223, 5231, 5232, 5239, 5241, 5251, 5259, 5321, 5331, 5411, 5412, 54131, 54136, 54132, 54134, 54137, 5414 (excluding 54141), 5416, 5418, 54199, 54191, 5511, 5614, 6113, 61143, 6117, 7111, 7113, 7114, 7115, 7121, 71311, 7132, 7211, 7212, 8132, 8133, 81391, 81392, 81393, and 81394. Employment in each industry with a national average weekly wage higher than the median is calculated for each state and summed to get total high-wage traded service sector employment for each state. Unavailable data is estimated using prior years data. Total high-wage traded service sector employment express as a share of total service sector employment in each state for the final score. Total service sector employment is the sum of employment in the following NAICS codes: 42, 44-45, 48-49, 51, 52, 53, 54, 55, 56, 61, 62, 71, 72, and 81.
APPendIx: Index methodology indicatoR methodologies and data souRces

The 2012 S ta te New economy Index | I n fo rmat ion Techno logy and Innovat ion Foundat ion | 63
APPendIx: Index methodology
Data source: Bureau of Labor Statistics, Quarterly Census of Employment and Wages (various series IDs, private sector, 2011; accessed August 10, 2012), http://www.bls.gov/cew/.
page 27 Foreign Direct Investment Methodology: Employment in majority-owned U.S. affiliates of foreign multinational corporations
is expressed as a percentage of total employment for a final score for each state.
Data sources: Bureau of Economic Analysis, Direct Investment and Multinational Companies (employment in majority-owned U.S. affiliates, state by country of UBO, 2010; accessed August 22, 2012), http://www.bea.gov/iTable/index_MNC.cfm;
Bureau of Economic Analysis, Regional Data (total full-time and part-time employment by NAICS industry, 2010; accessed August 22, 2012), http://www.bea.gov/iTable/index_regional.cfm.
page 28 export Focus of manufacturing and Services Methodology: Gross export value per employee is calculated for 26 manufacturing- and service-
sector industries on the national level. Service industries are determined by data availability. The NAICS (2012) codes for the 26 industries are as follows: 311, 312, 313, 314, 315, 316, 321, 322, 323, 324, 325, 326, 327, 331, 332, 333, 334, 335, 336, 337, 339, 511, 541 (excluding 5412, 5414, 5418, and 5419), 5615, 7111, 7115. Gross export value per employee for each industry is expressed as a ratio to the average gross export value per employee across these industries on the national level. Each ratio is multiplied by employment in its respective industry on the state level to obtain each state’s expected employment were its industrial mix the same as that of the national level. Actual employment in these industries in each state is then divided by the expected employment to obtain the industry mix adjustor. Current year service-sector exports is estimated using available year state data and national growth rates. Exports in the 26 industries are then summed for each state to obtain total exports. Total exports is multiplied by the industry mix adjustor to obtain adjusted exports. Adjusted exports is expressed as a ratio to actual employment for the final score.
Data sources: International Trade Administration, TradeStats Express (national trade data, product profiles of U.S. merchandise trade; state export data, export product profiles, 2010; accessed August 23, 2012), http://tse.export.gov/TSE/TSEhome.aspx;
Census Bureau, 2007 Economic Census (EC0751SXSB1; EC0754SXSB01; EC0756SXSB1; EC0771SXSB1; EC0781SXSB1; accessed August 23, 2012), http://factfinder2.census.gov/;
Bureau of Labor Statistics, Quarterly Census of Employment and Wages (various series IDs, private sector; accessed August 24, 2012), http://www.bls.gov/cew/.
page 31 Job Churning Methodology: Private establishment opening and closings are summed for each state for both the
current year and the prior year. Each value is divided by the total number of establishments for each state for its respective year. These values are averaged for the final score.
Data sources: Bureau of Labor Statistics, Business Employment Dynamics (openings, closings, establishments, total private, 2010, 2011; accessed August 15, 2012), http://www.bls.gov/bdm/;
indicatoR methodologies and data souRces

64 | In fo rmat ion Techno logy and Innovat ion Foundat ion | The 2012 S ta te New economy Index
Bureau of Labor Statistics, Quarterly Census of Employment and Wages (number of establishments, private, 2010, 2011; accessed August 15, 2012), http://www.bls.gov/cew/.
page 32 Fast growing Firms Methodology: The state locations of firms on the Deloitte Technology Fast 500 and Inc. 500 lists
are counted and summed for both the current year and the prior year. The sums for both years are averaged. A count of total firms in each state is averaged over the current year and the prior year. The average list count is then expressed as a share of average total firms for each state for the final score.
Data sources: “Technology Fast 500: Historical Winners,” Deloitte, 2012, http://www.deloitte.com/view/en_US/us/Industries/technology/technology-fast500c75a1ec6f6001210VgnVCM100000ba42f00aRCRD.htm;
“2011 Inc. 5000,” Inc., 2011, http://www.inc.com/inc5000/list/2011;
“2010 Inc. 5000,” Inc., 2010, http://www.inc.com/inc5000/list/2010;
Small Business Administration, Small Business Economy, 2011 Small Business Data Tables (table A.1 business counts, 1985-2010; accessed July 25, 2012), http://www.sba.gov/advocacy/849/6282.
page 33 Initial public offerings Methodology: IPO values are expressed as ratio to personal income for current year and two prior
years, and then the ratio is averaged across the three years. Likewise, IPO counts are expressed as a ratio to personal income for current year and two prior years, and then the ratio is averaged across the three years. Both the IPO value scores and the IPO count scores are standardized. Standardized IPO value scores are multiplied by a weight of 0.3 and standardized IPO count scores are multiplied by a weight of 0.7, and then the weighted scores are summed to obtain a final score for each state.
Data sources: Renaissance Capital, IPO Home, U.S. IPO Stats (U.S. market, IPOs near you, 2011, 2010, 2009; accessed August 8, 2012), http://www.renaissancecapital.com/IPOHome/Press/MediaRoom.aspx?market=us;
Bureau of Economic Analysis, Regional Data (state personal income, 2011; accessed August 8, 2012), http://www.bea.gov/regional/index.htm.
page 34 entrepreneurial activity Methodology: Kauffman Entrepreneurial Index values are averaged across the current year and the
prior year.
Data source: Kauffman Foundation, Kauffman Index of Entrepreneurial Activity (KIEA State Microdata, 2011, 2010; accessed August 1, 2012), http://www.kauffman.org/research-and-policy/kauffman-index-of-entrepreneurial-activity.aspx.
APPendIx: Index methodology indicatoR methodologies and data souRces

The 2012 S ta te New economy Index | I n fo rmat ion Techno logy and Innovat ion Foundat ion | 65
APPendIx: Index methodology
page 35 Inventor patents Methodology: Patent counts for current year and prior year are averaged and expressed as a ratio to
the state population aged between 18 and 64 years of age.
Data sources: U.S. Patent and Trademark Office, Patent Technology Monitoring Team (independent inventors by state by year: utility patents report, 2010, 2009; accessed August 1, 2012), http://www.uspto.gov/web/offices/ac/ido/oeip/taf/inv_utl.htm;
Census Bureau, State Characteristics: Vintage 2011 (population by selected age groups: estimates of the resident population by selected age groups for the United States, states, and Puerto Rico: July 1, 2011; accessed August 1, 2012), http://www.census.gov/popest/data/state/asrh/2011/index.html.
page 37 online population Data source: Census Bureau, 2010 Statistical Abstract (information and communications: internet
publishing and broadcasting and internet usage: 1156 – household internet usage in and outside the home by state: 2010, anywhere; accessed July 26, 2012), http://www.census.gov/compendia/statab/cats/information_communications/internet_publishing_and_broadcasting_and_internet_usage.html.
page 38 e-government Data source: “2010 Digital States Survey,” Government Technology, September 28, 2010, http://
www.govtech.com/enterprise-technology/50-state-report.html.
page 39 online agriculture Methodology: The share of farms that use computers for business and the share of farms with
Internet access are both standardized. Both standardized scores are then summed to obtain the final score.
Data source: U.S. Department of Agriculture, Economics, Statistics, and Market Information System (farm computer usage and ownership, 2011; accessed July 26, 2012), http://usda.mannlib.cornell.edu/MannUsda/viewDocumentInfo.do?documentID=1062.
page 40 Broadband Telecommunications Methodology: The broadband adoption percentage and the median download speed for each state
are both standardized and then summed for the final score.
Data sources: Economics and Statistics Administration and National Telecommunications and Information Administration, Exploring the Digital Nation: Computer and Internet Use at Home (Washington, DC: U.S. Department of Commerce, 2011), http://www.ntia.doc.gov/files/ntia/publications/exploring_the_digital_nation_computer_and_internet_use_at_home_11092011.pdf;
Communications Workers of America, Speed Matters 2010 (Washington, DC: Communications Workers of America, 2010), http://cwa.3cdn.net/299ed94e144d5adeb1_mlblqoxe9.pdf.
indicatoR methodologies and data souRces

66 | In fo rmat ion Techno logy and Innovat ion Foundat ion | The 2012 S ta te New economy Index
page 41 health IT Data sources: Surescripts, The National Progress Report on E-Prescribing and Interoperable Health
Care: Year 2011 (Arlington, VA: Surescripts, 2012), http://www.surescripts.com/downloads/npr/National%20Progress%20Report%20on%20E%20Prescribing%20Year%202011.pdf;
“State Progress Reports,” Surescripts, 2012, http://www.surescripts.com/about-e-prescribing/progress-reports/state-progress-reports.aspx.
page 43 high-Tech Jobs Methodology: High-tech jobs data from Cyberstates 2011 is summed with biomedical employment
from the Bureau of Labor Statistics, and then expressed as a percentage of total employment for the final score. The biomedical NAICS (2012) codes are 32541, 333314, 33911, 5417, and 62151. Missing data is estimated using prior years data.
Data sources: Josh James and Patrick Leary, Cyberstates 2011 (Washington, DC: TechAmerica Foundation, 2011), http://www.techamericafoundation.org/cyberstates;
Bureau of Labor Statistics, Quarterly Census of Employment and Wages (various series IDs, private sector, 2011; accessed August 29, 2012), http://www.bls.gov/cew/;
Bureau of Economic Analysis, Regional Data (total full-time and part-time employment by NAICS industry, 2011; accessed August 29, 2012), http://www.bea.gov/iTable/index_regional.cfm.
page 44 Scientists and engineers Methodology: Private sector scientist and engineer employment is calculated for each state in 50
SOC (2010) occupation codes: 15-1111, 15-1121, 15-1131, 15-1132, 15-1133, 15-1142, 15-1179, 15-2021, 15-2031, 15-2041, 15-2091, 15-2099, 17-2011, 17-2021, 17-2031, 17-2041, 17-2051, 17-2061, 17-2071, 17-2072, 17-2081, 17-2111, 17-2112, 17-2121, 17-2131, 17-2141, 17-2151, 17-2161, 17-2171, 17-2199, 19-1011, 19-1012, 19-1013, 19-1021, 19-1022, 19-1023, 19-1029, 19-1031, 19-1041, 19-1042, 19-1099, 19-2011, 19-2012, 19-2021, 19-2031, 19-2032, 19-2041, 19-2042, 19-2043, and 19-2099. Missing data is estimated using prior year data. Employment in these occupations is then expressed as a percentage of total occupation employment for the final score.
Data source: Bureau of Labor Statistics, Occupational Employment Statistics (national cross-industry estimates, 2011; state cross-industry estimates, 2011; accessed July 31, 2012), http://www.bls.gov/oes/oes_dl.htm.
page 45 patents Methodology: Patents per employee is calculated for 17 industries on the national level as
determined by data availability. The NAICS (2012) codes for the 17 industries are 311, 312, 313-316, 321, 322 and 323 combined, 325, 326, 327, 331, 332, 333, 334, 335, 336, 337, 339, and all industries minus manufacturing (31-33). Patents per employee for each industry is expressed as a ratio to the average patents per employee across these industries on the national level. Each ratio is
APPendIx: Index methodology indicatoR methodologies and data souRces

The 2012 S ta te New economy Index | I n fo rmat ion Techno logy and Innovat ion Foundat ion | 67
APPendIx: Index methodology
multiplied by employment in its respective industry on the state level to obtain each state’s expected employment were its industrial mix the same as that on the national level. Actual employment in these industries is then divided by the expected employment to obtain the industrial mix adjustor. Total state patents are then multiplied by the industrial mix adjustor to obtain adjusted state patents. Adjusted state patents is expressed as a ratio to employment (thousands) for the final score. Note that patents by industry (used to create the adjustors) are not “end-use” counts; rather they are a proxy for end-use: USPTO classifies them by technology and then assigns the technology to a particular manufacturing NAICS code, regardless of end-use.
Data sources: United States Patent and Trademark Office, Calendar Year Patent Statistics (patent counts by country/state and year, utility patents report, 2011; patent trends in the U.S. by industry category, 2008; accessed August 17, 2012), http://www.uspto.gov/web/offices/ac/ido/oeip/taf/reports.htm;
Bureau of Labor Statistics, Quarterly Census of Employment and Wages (various series IDs, private sector; accessed August 17, 2012), http://www.bls.gov/cew/.
page 46 Industry Investment in r&D Methodology: Industry R&D investment per employee is calculated for 15 industries on the
national level as determined by data availability. The NAICS (2012) codes for the 15 industries are 3254, 325 (excluding 3254), 333, 334, 335, 3364, 336 (excluding 3364), 31-33 (excluding 325, 333, 334, 335, and 336), 5112, 51 (excluding 5112), 52, 5415, 5417, 54 (excluding 5415, and 5417), and 21-23 plus 42-81 (excluding 51, 52, and 54). R&D per employee for each industry is expressed as a ratio to the average R&D per employee across these industries on the national level. Each ratio is multiplied by employment in its respective industry on the state level to obtain each state’s expected employment were its industrial mix the same as that on the national level. Actual employment in these industries is then divided by the expected employment to obtain the industrial mix adjustor. Total state industry R&D is then multiplied by the industrial mix adjustor to obtain adjusted state industry R&D. Adjusted state industry R&D is expressed as a ratio to total employee compensation for the final score.
Data sources: National Science Foundation, Business and Industrial R&D (table 2. funds spent for business R&D performed in the United States, by source of funds and selected industry, 2009; table 5. funds spent for business R&D performed in the United States, by source of funds and state, 2009; accessed August 15, 2012), http://www.nsf.gov/statistics/infbrief/nsf12309/;
Bureau of Economic Analysis, Regional Data (compensation of employees by NAICS industry, 2009; accessed August 15, 2012), http://www.bea.gov/iTable/index_regional.cfm.
page 47 Non-Industry Investment in r&D Methodology: State agency R&D data and other non-industry data are summed and then expressed
as a ratio to gross state product for the final score.
Data sources: National Science Foundation, Science and Engineering Indicators 2012 (appendix table 4-11. U.S. research and development expenditures, by state, performing sector, and source of funding, 2008; accessed August 22, 2012), http://www.nsf.gov/statistics/seind12/appendix.htm;
indicatoR methodologies and data souRces

68 | In fo rmat ion Techno logy and Innovat ion Foundat ion | The 2012 S ta te New economy Index
APPendIx: Index methodology
National Science Foundation, State Government Research and Development: Fiscal Year 2009 (table 2. state agency expenditures for R&D, by state and performer, 2009; accessed August 22, 2012), http://www.nsf.gov/statistics/nsf12331/.
page 48 movement Toward a green economy Methodology: The changes in energy consumption per capita in the industrial, residential and
commercial sectors from three years prior to the current year is calculated for each state and then standardized and multiplied by -1. The total energy share of nuclear and renewable energy in the current year is calculated and standardized. The standardized changes in energy consumption per capita for the commercial, residential and industrial sectors are multiplied a weight of 0.1, the standardized change for the industrial sector is multiplied by a weight of 0.2, and the standardized share of nuclear and renewable energy is multiplied by a weight of 0.5. Each component is summed for the final score.
Data source: Energy Information Administration, State Energy Data System (consumption in BTU, 2007, 2010; accessed August 27, 2012), http://www.eia.gov/state/seds/seds-data-complete.cfm.
page 49 venture Capital Methodology: Venture capital investment for the current year is expressed as a ratio to total personal
income for the final score.
Data sources: PriceWaterHouseCoopers, MoneyTree (historical trend data, 2011; accessed July 23, 2012), https://www.pwcmoneytree.com/MTPublic/ns/nav.jsp?page=historical;
Bureau of Economic Analysis, Regional Data (personal income, 2011; accessed July 23, 2012), http://www.bea.gov/iTable/index_regional.cfm;
Bureau of Economic Analysis, National Income and Product Accounts (personal income and its disposition, 2011; accessed July 23, 2012), http://www.bea.gov/iTable/index_nipa.cfm.
indicatoR methodologies and data souRces
The 2012 S ta te New economy Index | I n fo rmat ion Techno logy and Innovat ion Foundat ion | 69
1. Bureau of Labor Statistics, Current Employment Statistics (total nonfarm employment, seasonally adjusted, November 2007, August 2012; accessed October 10, 2012), http://www.bls.gov/sae/. States that now have employment higher than pre-recession levels are Alaska, Louisiana, New York, North Dakota, Oklahoma, and Texas.
2. Robert D. Atkinson and Stephen J. Ezell, Innovation Economics: The Race for Global Advantage (New Haven, CT: Yale University Press, 2012).
3. Jesús De Juan et al., Global Sourcing in the Postdownturn Era (Boston: Boston Consulting Group, 2010), https://www.bcgperspectives.com/content/articles/sourcing_procurement_supply_chain_management_global_sourcing_in_the_postdownturn_era/.
4. Robert D. Atkinson and Scott M. Andes, The Atlantic Century II: Benchmarking EU and U.S. Innovation and Competitiveness (Washington, DC: Information Technology and Innovation Foundation, 2011), http://www.itif.org/files/2011-atlantic-century.pdf.
5. Klaus Schwab and Xavier Sala-i-Martín, The Global Competitiveness Report 2012-2013 (Geneva: World Economic Forum, 2012), http://www3.weforum.org/docs/WEF_GlobalCompetitivenessReport_2012-13.pdf.
6. Ibid.
7. Atkinson and Andes, Atlantic Century II (see n. 4).
8. Bureau of Labor Statistics, Current Employment Statistics (manufacturing employment, seasonally adjusted; accessed March 14, 2012), http://www.bls.gov/ces/; Census Bureau, Statistical Abstract of the United States: 1941(Washington, D.C.: 1942), http://www.census.gov/prod/www/abs/statab1901-1950.htm. Jobs figures are for January 2000 to December 2010, and 1929 to 1933. From 1929 to 1933, U.S manufacturing employment fell by 31 percent.
9. Joel S. Yudken, Executive Summary: Manufacturing Insecurity: America’s Manufacturing Crisis and the Erosion of the U.S. Defense Industrial Base (Washington, DC: AFL-CIO, 2010), http://www.ndia.org/Divisions/Divisions/Manufacturing/Documents/119A/1%20Manufacturing%20Insecurity%20ES%20V2.pdf.
10. Tom Abate, “Why Silicon Valley Faces Fresh Threats,” San Francisco Chronicle, February 11, 2010, http://www.sfgate.com/business/article/Why-Silicon-Valley-faces-fresh-threats-3273642.php.
11. Bureau of Economic Analysis, National Income and Product Accounts (real gross domestic product; accessed October 10, 2012), http://www.bea.gov/iTable/index_nipa.cfm.
12. Federal Reserve Bank of St. Louis, FRED Economic Data (real personal income; accessed October 10, 2012), http://research.stlouisfed.org/fred2/series/RPI.
13. Bureau of Economic Analysis, Current Employment Statistics (total nonfarm employment; accessed October 10, 2012), http://www.bls.gov/ces/.
14. Robert D. Atkinson et al., Worse Than the Great Depression: What Experts Are Missing About American Manufacturing Decline (Washington, DC: Information Technology and Innovation Foundation, 2012), http://www2.itif.org/2012-american-manufacturing-decline.pdf.
endnoteS
endnoteS

70 | In fo rmat ion Techno logy and Innovat ion Foundat ion | The 2012 S ta te New economy Index
endnoteS
15. Bureau of Economic Analysis, Regional Data (full-time and part-time wage and salary employment, manufacturing; accessed October 1, 2012), http://www.bea.gov/iTable/index_regional.cfm.
16. Ibid.
17. Gene Sperling, “Remarks at the Conference on the Renaissance of American Manufacturing” (speech, National Press Club, Washington, DC, March 27, 2012), http://www.whitehouse.gov/sites/default/files/administration-official/sperling_-_renaissance_of_american_manufacturing_-_03_27_12.pdf.
18. Executive Office of the President, National Science and Technology Council, A National Strategic Plan for Advanced Manufacturing (Washington, DC: Executive Office of the President, 2012), 4, http://www.whitehouse.gov/sites/default/files/microsites/ostp/iam_advancedmanufacturing_strategicplan_2012.pdf. For a discussion of employment multipliers from manufacturing jobs, see Stephen J. Ezell and Robert D. Atkinson, The Case for a National Manufacturing Strategy (Washington, DC: Information Technology and Innovation Foundation, 2011), http://www2.itif.org/2011-national-manufacturing-strategy.pdf.
19. Josh James and Patrick Leary, Cyberstates 2011 (Washington, DC: TechAmerica Foundation, 2011), http://www.techamericafoundation.org/cyberstates.
20. See Robert D. Atkinson et al., Worse Than the Great Depression: What Experts Are Missing About American Manufacturing Decline (Washington, DC: Information Technology and Innovation Foundation, 2012), http://www2.itif.org/2012-american-manufacturing-decline.pdf.
21. Ibid.
22. Ibid.
23. Bureau of Labor Statistics, Business Employment Dynamics (national manufacturing jobs gains, losses, seasonally adjusted; accessed October 1, 2012), http://www.bls.gov/bdm/.
24. Atkinson et al., Worse than the Great Depression (see n. 20).
25. “Editorial Archive,” Site Selection, March issues, 1999-2012, accessed September 26, 2012, http://www.siteselection.com/pastissu.cfm; Robert D. Atkinson and Daniel K. Correa, The 2007 State New Economy Index (Washington, DC: Information Technology and Innovation Foundation, 2007), http://www.itif.org/files/2007_State_New_Economy_Index.pdf.
26. Bureau of Economic Analysis, Regional Data (manufacturing employment, income per capita; accessed September 19, 2012), http://www.bea.gov/iTable/index_regional.cfm; Bureau of Labor Statistics, Current Employment Statistics (total nonfarm employment; accessed September 20, 2012), http://www.bls.gov/sae/. Author’s analysis.
27. Robert D. Atkinson et al., “Innovation Policy on a Budget: Driving Innovation in a Time of Fiscal Constraint” (technical report, Information Technology and Innovation Foundation, September 24, 2010), http://www.itif.org/files/2010-innovation-budget.pdf.
28. Lori G. Kletzer, Imports, Exports and Jobs: What Does Trade Mean for Employment and Job Loss (Kalamazoo, MI: W.E. Upjohn Institute, 2002).
29. For a review of the literature on jobs and innovation-based productivity growth, see Daniel Castro, Robert Atkinson and Stephen Ezell, Embracing the Self-Service Economy (Washington, DC: Information Technology and Innovation Foundation, 2010), http://www.itif.org/files/2010-self-service-economy.pdf.

The 2012 S ta te New economy Index | I n fo rmat ion Techno logy and Innovat ion Foundat ion | 71
endnoteS
30. Organisation for Economic Co-operation and Development, The OECD Jobs Study: Facts, Analysis, Strategies (1994) (Paris: OECD, 1994), http://www.oecd.org/employment/employmentpoliciesanddata/1941679.pdf.
31. Rebecca Keller, “How Shifting Occupational Composition Has Affected the Real Average Wage,” Monthly Labor Review 132, no. 6 (2009): 26-38.
32. Robert D. Atkinson and Andrew S. McKay, Digital Prosperity: Understanding the Economic Benefits of the Information Technology Revolution (Washington, DC: Information Technology and Innovation Foundation, 2007), http://www.itif.org/files/digital_prosperity.pdf.
33. The first two State New Economy Index reports were published by one of the authors when he was with the Progressive Policy Institute. See Robert D. Atkinson and Randall Court, The 1999 State New Economy Index (Washington, DC: Progressive Policy Institute, 1999) and Robert D. Atkinson, The 2002 State New Economy Index (Washington, DC: Progressive Policy Institute, 2002).
34. “Historical Trend Data,” MoneyTree, PriceWaterHouseCoopers, 2012, https://www.pwcmoneytree.com/MTPublic/ns/nav.jsp?page=historical.
35. Bureau of Labor Statistics, Regional Data (real GDP, real GDP per capita; accessed September 26, 2012), http://www.bea.gov/iTable/index_regional.cfm.
36. Luke A. Stewart and Robert D. Atkinson, “Looking for Jobs? Look to IT in 2012 and Beyond” (technical report, Information Technology and Innovation Foundation, August 2012), http://www2.itif.org/2012-jobs-it.pdf.
37. Bureau of Labor Statistics, Occupation Employment Statistics (state cross-industry estimates; national sector NAICS industry-specific estimates; accessed August 7, 2012), http://www.bls.gov/oes/home.htm.
38. Stewart and Atkinson, “Looking for Jobs?” (see n. 36).
39. Census Bureau, 2010 American Community Survey 1-year Estimates (B15003: educational attainment for the population 25 years and over; accessed July 31, 2012), http://factfinder2.census.gov/; Robert D. Atkinson and Scott Andes, The 2010 State New Economy Index (Washington, DC: Information Technology and Innovation Foundation, 2010), http://www.itif.org/files/2010-state-new-economy-index.pdf.
40. Robert D. Atkinson, “The Failure of American Higher Education,” Huffington Post (blog), July 1, 2010, http://www.huffingtonpost.com/robert-d-atkinson-phd/the-failure-of-american-h_b_626289.html.
41. Richard Arum and Josipa Roksa, “Your So-Called Education,” New York Times, May 14, 2011, http://www.nytimes.com/2011/05/15/opinion/15arum.html.
42. Census Bureau, “Residence One Year Ago by Educational Attainment in the United States,” 2009 American Community Survey, http://www.census.gov/acs.
43. David M. Hart, “Global Flows of Talent: Benchmarking the United States” (technical report, Information Technology and Innovation Foundation, November 17, 2006), http://www.itif.org/files/Hart-GlobalFlowsofTalent.pdf.
44. Paula E. Stephan and Sharon G. Levin, “Exceptional Contributions to U.S. Science by Foreign-Born and Foreign-Educated,” Population Research and Policy Review 20, nos. 1-2 (2001): 59-79.

72 | In fo rmat ion Techno logy and Innovat ion Foundat ion | The 2012 S ta te New economy Index
endnoteS
45. Partnership for a New American Economy, Patent Pending: How Immigrants Are Reinventing the American Economy (Washington, DC: Partnership for a New American Economy, 2012), http://www.renewoureconomy.org/sites/all/themes/pnae/patent-pending.pdf; Partnership for a New American Economy, The “New American” Fortune 500 (Washington, DC: Partnership for a New American Economy, 2012), http://www.renewoureconomy.org/sites/all/themes/pnae/img/new-american-fortune-500-june-2011.pdf; Cameron Cushman, “Immigrant Entrepreneurs are People Too,” Policy Forum Blog, July 11, 2012, http://www.entrepreneurship.org/en/Blogs/Policy-Forum-Blog/2012/July/Immigrant-Entrepreneurs-Are-People-Too.aspx.
46. David M. Hart, Zoltan J. Acs and Spender L. Tracy, Jr., High-tech Immigrant Entrepreneurship in the United States (Washington, D.C.: Small Business Administration, 2009), http://archive.sba.gov/advo/research/rs349tot.pdf.
47. See Paul D. Gottlieb and Michael Fogarty, “Educational Attainment and Metropolitan Growth,” Economic Development Quarterly 17, no. 4 (2003): 325-336; Enrico Moretti, “Esimating the Social Return to Higher Education: Evidence from Longitudinal and Repeated Cross-Sectional Data,” Journal of Econometrics 121, nos. 1-2 (2004): 175-212.
48. There is a 0.82 correlation between Managerial, Professional and Technical Jobs and Immigration of Knowledge Workers.
49. The correlation between Manufacturing Value Added and the High-Tech Jobs indicator is 0.37, and with the Scientists and Engineers indicator it is 0.32.
50. Bureau of Labor Statistics, Quarterly Census of Employment and Wages (professional and technical services, private, all employees; accessed September 20, 2012), http://www.bls.gov/cew/.
51. Bureau of Economic Analysis, Direct Investment and Multinational Companies (comprehensive data, financial and operating data for U.S. affiliates of foreign multinational companies, employment, 1988, 2010; accessed September 20, 2012), http://www.bea.gov/international/di1fdiop.htm.
52. Bureau of Economic Analysis, Direct Investment and Multinational Companies (comprehensive data, financial and operating data for U.S. affiliates of foreign multinational companies, capital expenditure, 1988, 2010; accessed September 20, 2012), http://www.bea.gov/international/di1fdiop.htm.
53. Bureau of Economic Analysis, Direct Investment and MNCs (foreign direct investment in the U.S., investment in plants, property and equipment: majority-owned bank and nonbank U.S. affiliates, 2007-2010; majority-owned nonbank U.S. affiliates, 1997-2006; accessed September 29, 2012), http://www.bea.gov/iTable/index_MNC.cfm; Bureau of Economic Analysis, National Income and Product Accounts (gross domestic product; accessed September 29, 2012), http://www.bea.gov/iTable/index_nipa.cfm. There is a break in the series between 2006 and 2007, because data prior to 2007 excludes bank expenditures; however, this means that the decline in investment since 2007 is likely even more severe.
54. Bureau of Economic Analysis, Direct Investment and Multinational Companies (foreign direct investment in the U.S., financial inflows without current cost adjustment; accessed September 20, 2012), http://www.bea.gov/iTable/index_MNC.cfm.
55. Luke Stewart, “The Sad Reality Behind Foreign Direct Investment in the United States,” Innovation Files (blog), October 23, 2012, http://www.innovationfiles.org/the-sad-reality-behind-foreign-direct-investment-in-the-united-states/.

The 2012 S ta te New economy Index | I n fo rmat ion Techno logy and Innovat ion Foundat ion | 73
endnoteS
56. Bureau of Economic Analysis, Direct Investment and Multinational Companies (foreign direct investment in the U.S., majority-owned bank and non-bank affiliates, employment, value added; accessed September 21, 2012), http://www.bea.gov/iTable/index_MNC.cfm; Bureau of Economic Analysis, National Income and Product Accounts (gross domestic product; full- and part-time employees by industry; accessed September 21, 2012), http://www.bea.gov/iTable/index_nipa.cfm.
57. Bureau of Economic Analysis, International Data (U.S. international transactions; accessed September 20, 2012), http://www.bea.gov/iTable/index_ita.cfm; Bureau of Economic Analysis, National Income and Product Accounts (gross domestic product; accessed September 20, 2012), http://www.bea.gov/iTable/index_nipa.cfm.
58. Bureau of Economic Analysis, International Data (U.S. international transactions; accessed September 20, 2012), http://www.bea.gov/iTable/index_ita.cfm; Bureau of Economic Analysis, National Income and Product Accounts (gross domestic product; accessed September 20, 2012), http://www.bea.gov/iTable/index_nipa.cfm.
59. Jonathan Rothwell, “Are Service Exports Leading the Recovery?,” The New Republic, April 22, 2010, http://www.tnr.com/blog/the-avenue/are-service-exports-leading-the-recovery.
60. David Riker, Do Jobs in Export Industries Still Pay More? And Why? (Washington, DC: International Trade Administration, 2010), http://trade.gov/mas/ian/build/groups/public/@tg_ian/documents/webcontent/tg_ian_003208.pdf.
61. J. Bradford Jensen, “Measuring the Impact of Trade in Services: Prospects and Challenges” (conference paper, Measuring Issues Arising from the Growth of Globalization,” November 6-7, 2009, Washington, DC), http://upjohninstitute.org/measurement/jensen-final.pdf.
62. Emilia Estrate, Jonathan Rothwell and Bruce Katz, “Export Nation: How U.S. Metros Lead National Export Growth and Boost Competitiveness” (technical report, Brookings Insitution, July 2010), http://www.brookings.edu/~/media/research/files/reports/2010/7/26%20exports%20istrate%20rothwell%20katz/0726_exports_istrate_rothwell_katz.pdf.
63. Steven J. Davis, John Haltiwanger and Ron Jarmin, Turmoil and Growth: Young Businesses, Economic Churning, and Productivity Gains (Kansas City, MO: Kauffman Foundation, 2008), http://www.kauffman.org/uploadedFiles/TurmoilandGrowth060208.pdf.
64. Census Bureau, Business Dynamics Statistics (firm age; accessed September 21, 2012), http://www.census.gov/ces/dataproducts/bds/data_firm.html. The job creation rate includes only firms that survive (i.e. do not go out of business).
65. There is a correlation of 0.37 between Job Churning and job growth from 2001 to 2011.
66. Yasuyuki Motoyama and Brian Danley, The Ascent of America’s High-Growth Companies: An Analysis of the Geography of Entrepreneurship (Kansas City, MO: Kauffman Foundation, 2012), http://www.kauffman.org/uploadedFiles/inc_geography.pdf.
67. Renaissance Capital, IPO Home, U.S. IPO Stats (U.S. market, IPOs near you, 2011, 2010, 2009; accessed August 8, 2012), http://www.renaissancecapital.com/IPOHome/Press/MediaRoom.aspx?market=us; Atkinson and Andes, 2010 State New Economy Index (see n. 39).
68. Steven J. Davis, John Haltiwanger and Ron Jarmin, Turmoil and Growth: Young Businesses, Economic Churning, and Productivity Gains (Kansas City, MO: Kauffman Foundation, 2008), http://www.kauffman.org/uploadedFiles/TurmoilandGrowth060208.pdf.

74 | In fo rmat ion Techno logy and Innovat ion Foundat ion | The 2012 S ta te New economy Index
endnoteS
69. The correlation between Entrepreneurial Activity and Venture Capital is 0.21.
70. Between 2007 and 2009, Nevada experienced the highest rate of job loss at -10.8 percent, Arizona was third at -9.2 percent, and Georgia was tenth at -6.3 percent.
71. The correlation between Inventor Patents and Scientists and Engineers is 0.47.
72. Census Bureau, Quarterly E-Commerce Report (time series, adjusted; accessed September 22, 2012), http://www.census.gov/retail/index.html.
73. Economists estimate that much of the increase in productivity growth rates of the last decade was a result of the IT revolution. For example, see Dale W. Jorgenson, Mun S. Ho and Kevin J. Stiroh, “A Retrospective Look at the U.S. Productivity Growth Resurgence” (working paper, Federal Reserve Bank of New York, February 2007), http://papers.ssrn.com/sol3/papers.cfm?abstract_id=970660; Tobias Kretschmer, Information and Communication Technologies and Productivity Growth: A Survey of the Literature (Paris: OECD, 2012), http://dx.doi.org/10.1787/5k9bh3jllgs7-en; and Robert D. Atkinson and Andrew S. McKay, Digital Prosperity: Understanding the Benefits of the Information Technology Revolution (Washington, DC: Information Technology and Innovation Foundation, 2007), http://www.itif.org/files/digital_prosperity.pdf.
74. Census Bureau, 2012 Statistical Abstract, Information and Communications: Internet Publishing and Broadcasting and Internet Usage (household internet access in and outside of the home by state: 2010; accessed August 8, 2012), http://www.census.gov/compendia/statab/cats/information_communications/internet_publishing_and_broadcasting_and_internet_usage.html.
75. Ibid.; Atkinson and Andes, 2010 State New Economy Index (see n. 39).
76. Kathryn Zickuhr, Generations 2010 (Washington, DC: Pew Research Center, 2010), http://pewinternet.org/~/media//Files/Reports/2010/PIP_Generations_and_Tech10.pdf.
77. The correlation between Online Population and Workforce Education is 0.65.
78. Robert D. Atkinson, “Turbo Government: A Bold New Vision for E-government,” (technical report, Information Technology and Innovation Foundation, September 27, 2006), www.itif.org/files/turbogov.pdf.
79. Darrel M. West, State and Federal Electronic Government in the United States, 2008 (Washington, DC: Brookings Institution, 2008), http://www.brookings.edu/~/media/research/files/reports/2008/8/26%20egovernment%20west/0826_egovernment_west.
80. U.S. Department of Agriculture, Economics, Statistics, and Market Information System (farm computer usage and ownership, 2011; accessed July 26, 2012), http://usda.mannlib.cornell.edu/MannUsda/viewDocumentInfo.do?documentID=1062; Atkinson and Andes, 2010 State New Economy Index (see n. 39).
81. Stephen Ezell et al., “The Need for Speed: The Importance of Next-Generation Broadband Networks” (technical report, Information Technology and Innovation Foundation, March 2009), http://www.itif.org/files/2009-needforspeed.pdf.
82. Economics and Statistics Administration and National Telecommunications and Information Administration, Falling Through the Net: Toward Digital Inclusion (Washington, DC: Department of Commerce, 2000), http://www.ntia.doc.gov/files/ntia/publications/fttn00.pdf; National Telecommunications and Information Administration, Digital Nation: Expanding Internet Usage (Washington, DC: Department of Commerce, 2011), http://www.ntia.doc.gov/files/ntia/publications/ntia_internet_use_report_february_2011.pdf.

The 2012 S ta te New economy Index | I n fo rmat ion Techno logy and Innovat ion Foundat ion | 75
endnoteS
83. Communications Workers of America, Speed Matters 2010 (Washington, DC: Communications Workers of America, 2010), http://cwa.3cdn.net/299ed94e144d5adeb1_mlblqoxe9.pdf.
84. Census Bureau, 2012 Statistical Abstract, Population (state population; accessed September 22, 2012), http://www.census.gov/compendia/statab/cats/population.html; correlation based on author’s calculations.
85. See Federico Girosi, Robin Meili and Richard Scoville, Extrapolating Evidience of Health Information Technology Savings and Costs (Santa Monica, CA: RAND Corporation, 2005), http://www.rand.org/pubs/monographs/2005/RAND_MG410.pdf; Jan Walker et al., “The Value of Health Care Exchange and Interoperability,” Health Affairs 24 (19 January 2005): 10-18.
86. “U.S. Healthcare Costs,” Kaiser Family Foundation, 2012, http://www.kaiseredu.org/en/Issue-Modules/US-Health-Care-Costs/Background-Brief.aspx.
87. Surescripts, The National Progress Report on E-prescribing and Interoperable Healthcare: Year 2011 (Arlington, VA: Surescripts, 2012), http://www.surescripts.com/downloads/npr/National%20Progress%20Report%20on%20E%20Prescribing%20Year%202011.pdf.
88. Minnesota Department of Public Health, “Minnesota Named Top State for E-prescribing,” news release, July 31, 2012, http://www.health.state.mn.us/news/pressrel/2012/eprescrib073112.html; John Halamka et al., “E-Prescribing in Massachusetts: Collaboration Leads to Success,” Patient Safety and Quality Healthcare (PSQH) e-Newsletter, September 2006, www.psqh.com/sepoct06/e-prescribing.html.
89. “N.H. Ranked Fifth for Use of Electronic Prescriptions,” New Hampshire Union Leader, July 31, 2012, http://www.unionleader.com/article/20120731/NEWS02/707319892; Ohio e-Prescribe Task Force, Research and Recommendations for Improving e-Prescribing in Ohio (Hilliard, OH: Ohio Health Information Partnership, 2012), http://www.clinisync.org/public/images/stories/e-Prescribe_White_Paper_Final_8_15_12.pdf.
90. Bill Brewer, “Iowa Honored for Adopting E-prescribing,” Iowa e-Health Connection (blog), January 5, 2012, http://www.iowaehealth.org/blog/?p=235.
91. Vermont Information Technology Leaders, “Vermont Is Among the Top 10 States for e-Prescribing,” news release, August 3, 2012, http://vtdigger.org/2012/08/03/vermont-is-among-the-top-10-states-for-e-prescribing/.
92. Peter Kilbridge and Katy Gladysheva, E-Prescribing (Oakland, CA: California Healthcare Foundation, 2001), http://www.ahqa.org/pub/uploads/EPrescribing.pdf; Laura Rose, “2011 Wisconsin Act 159 [2011 Senate Bill 317]: Electronic Prescriptions for Schedule II Controlled Substances” (legislative memo, Wisconsin State Legislature, April 10, 2012), http://legis.wisconsin.gov/lc/publications/act/2011/act159-sb317.pdf.
93. Peter J. Klenow and Andres Rodriguez, “The Neoclassical Revival in Growth Economics: Has It Gone Too Far?,” NBER Macroeconomics Journal 12 (1997): 73-103.
94. James and Leary, Cyberstates 2011 (see n. 19).
95. Bureau of Labor Statistics, Occupational Employment Statistics (all occupations, national, 2010, 2011; accessed September 24, 2012), http://www.bls.gov/oes/.
96. Larry Keeley, “The Taming of the New: Larry Keeley Workshop on Innovation,” (presentation, Puget Sound SIGCHI, Seattle, September 18, 2007); Carl Franklin, Why Innovation Fails: Hard Won Lessons for Business (London: Spiro Press, 2003).

76 | In fo rmat ion Techno logy and Innovat ion Foundat ion | The 2012 S ta te New economy Index
endnoteS
97. U.S. Patent and Trademark Office (number of patents granted as distributed by year of patent grant, breakout by U.S. state and country of origin; accessed August 17, 2012), http://www.uspto.gov/web/offices/ac/ido/oeip/taf/reports.htm.
98. Fred Block and Matthew R. Keller, “Where Do Innovations Come From? Transformations in the U.S. National Innovation System, 1970-2006” (technical report, Information Technology and Innovation Foundation, July 2008), http://www.itif.org/files/Where_do_innovations_come_from.pdf.
99. Donna Fossum et al., “Federal Research and Development in Maryland,” in Discovery and Innovation (Santa Monica, CA: RAND Corporation, 2000), http://www.rand.org/pubs/monograph_reports/MR1194.html.
100. Energy Information Administration, Annual Energy Review 2010 (Washington, DC: U.S. Department of Energy, 2011), 5, http://www.eia.gov/totalenergy/data/annual/pdf/aer.pdf.
101. “Historical Trend Data” (see n. 34).
102. Executive Office of the President, National Science and Technology Council, A National Strategic Plan for Advanced Manufacturing (Washington, DC: Executive Office of the President, 2012), 4, http://www.whitehouse.gov/sites/default/files/microsites/ostp/iam_advancedmanufacturing_strategicplan_2012.pdf. For a discussion of employment multipliers from manufacturing jobs, see Stephen J. Ezell and Robert D. Atkinson, The Case for a National Manufacturing Strategy (Washington, DC: Information Technology and Innovation Foundation, 2011), http://www2.itif.org/2011-national-manufacturing-strategy.pdf.
103. See Robert D. Atkinson and Scott Andes, The 2008 State New Economy Index (Washington, DC: Information Technology and Innovation Foundation, 2008), http://www.itif.org/files/2008_State_New_Economy_Index.pdf.
104. See Atkinson and Andes, 2010 State New Economy Index (see n. 39).
105. William Schweke, “‘You Want Employment? We Will Give You Employment!’ or Do Better Job Creation Subsidies Hold Real Promise for Business Incentive Reformers?” (conference paper, Corporation for Enterprise Development, February 2004), http://www.hhh.umn.edu/img/assets/6158/schweke_paper.pdf.
106. Robert D. Atkinson, “The Research and Experimentation Tax Credit: A Critical Policy Tool for Boosting Research and Enhancing U.S. Economic Competitiveness” (technical report, Information Technology and Innovation Foundation, September 4, 2006), www.itif.org/files/R&DTaxCredit.pdf.
107. Yonghong Wu, “State R&D Tax Credits and High-Technology Establishments,” Economic Development Quarterly 22, no. 2 (2008): 136-148.
108. Lolita A. Paff, “State-Level R&D Tax Credits: A Firm-Level Analysis,” B.E. Journal of Economic Analysis and Policy 5, no. 1 (2005): 1272.
109. For a list of states with credits, see Angela Gullickson, Amy Rehder Harris and Zhong Jin, Iowa’s Research Activities Tax Credit: Tax Credits Program Evaluation Study (Des Moines, IA: Iowa Department of Revenue, 2011), http://www.iowa.gov/tax/taxlaw/RAC2011.pdf; Hearing on Tax Policy and the High-tech Sector, Before the California Assembly Committee on Revenue and Taxation (December 5, 2011) (statement of Robert D. Atkinson, President and Founder, Information Technology and Innovation Foundation), http://www.itif.org/files/2011-tax-policy-high-tech-testimony.pdf.
The 2012 S ta te New economy Index | I n fo rmat ion Techno logy and Innovat ion Foundat ion | 77
endnoteS
110. The Great Lakes Entrepreneur’s Quest, a program in Michigan, is similar. Its organizers represent Michigan’s entrepreneurial community: academics, investors, lawyers, CPAs, corporate executives, and other entrepreneurs. Competitors have a chance to win seed capital or valuable services (such as legal, accounting, and consulting services).
111. Walter Isaacson, Steve Jobs (New York: Simon and Schuster, 2011).
112. Robert D. Atkinson et al., “Addressing the STEM Challenge by Expanding Specialty Math and Science High Schools” (technical report, Information Technology and Innovation Foundation, March 2007), http://www.itif.org/files/STEM.pdf.
113. See Common Core Standards Initiative, http://www.corestandards.org/.
114. SSTI, Tech-based Economic Development and the States: Legislative Action in 2011 (Westerville, OH: SSTI, 2011), 12, http://www.ssti.org/Publications/tbedandstates2011.pdf.
115. Sarah Oldmixon, “State Sector Strategies: Regional Solutions to Worker and Employer Needs” (technical report, National Governors Association, November 9, 2006), http://www.nga.org/files/live/sites/NGA/files/pdf/06STATESECREG.PDF.
116. See Precision Manufacturing Institute, www.pmionline.edu/.
117. See Advanced Skill Center, http://www.advskills.org/index.html.
118. See New Century Careers, http://www.ncsquared.com/.
119. See “Workforce Development,” Rhode Island Economic Development Corporation, www.riedc.com/riedc/business_services/6/.

78 | In fo rmat ion Techno logy and Innovat ion Foundat ion | The 2012 S ta te New economy Index
About the AuthorS
About the AuthorSDr. Robert Atkinson is the president of the Information Technology and Innovation Foundation. He is also the author of the books Innovation Economics: The Race for Global Advantage (Yale University Press, 2012) and The Past and Future of America’s Economy: Long Waves of Innovation that Power Cycles of Growth (Edward Elgar, 2005). Dr. Atkinson received his Ph.D. in City and Regional Planning from the University of North Carolina at Chapel Hill in 1989.
Luke Stewart is an economic analyst at the Information Technology and Innovation Foundation. Prior to joining ITIF, he worked in business property appraisal, banking, and computer manufacturing. Luke earned a B.A. with highest honors in economics from the University of California, Berkeley, in 2009.
AcKnoWledgementSWe would like to thank our colleagues Scott Andes, Kathryn Angstadt, Daniel Castro and Alexis Fearon at the Information Technology and Innovation Foundation and Elizabeth Stewart at PointPolish for their editorial support.
We would also like to thank those who provided data and background information for the index, including Stephanie Craig, TechAmerica Foundation, and Paul Taylor, Center for Digital Government.

The 2012 S ta te New economy Index | I n fo rmat ion Techno logy and Innovat ion Foundat ion | 79
“It is not the strongest of the species that survive, nor the most intelligent,
but the ones most responsive to change.”
— Charles Darwin

www.itif.org
information technology and innovation foundation
1101 K Street NW • Suite 610 • Washington, DC 20005
[email protected] • Phone: (202) 449-1351 • Fax: (202) 638-4922