
The 2011 Missouri Soybean Resource Guide. - Missouri Soybeans
123
Missouri Soybean Resource Guide Commissioned by the Missouri Soybean Merchandising Council 2011 Edition
Transcript of The 2011 Missouri Soybean Resource Guide. - Missouri Soybeans

Missouri Soybean Resource Guide
Commissioned by the Missouri Soybean Merchandising Council
2011 Edition

TABLE OF CONTENTS
Chapter 1 – Soybean Production ..................................................................................................... 1
1.1 – Acreage .......................................................................................................................................... 1 1.2 – Production and Yield ................................................................................................................ 7 1.3 – Soybean Quality ....................................................................................................................... 14 1.4 – Soybean Farms and Soybean Farm Characteristics .................................................. 17 1.5 – Cost of Production .................................................................................................................. 20 1.6 – Farm Revenue and Profits ................................................................................................... 31
Chapter 2 – Beyond the Farm ........................................................................................................ 34 2.1 – Storage ........................................................................................................................................ 34 2.2 – Commercial Storage ............................................................................................................... 37 2.3 – Transportation ......................................................................................................................... 39 Chapter 3 – Soybean Processing and Use .................................................................................. 47 3.1 – Soybean Industry .................................................................................................................... 47 3.2 – Whole Soybeans ...................................................................................................................... 48 3.3 – Soybean Meal ............................................................................................................................ 61 3.4 – Soybean Oil ................................................................................................................................ 73 3.5 – Glycerol ....................................................................................................................................... 81 3.6 – Soybean Hulls ........................................................................................................................... 85 Chapter 4 – International Soybean Production and Trade ................................................. 92 4.1 – Worldwide Soybean Production ....................................................................................... 92 4.2 – Agricultural Trade .................................................................................................................. 95 4.3 – Missouri Agricultural Trade .............................................................................................. 111
EXHIBITS
Chapter 1 – Soybean Production ..................................................................................................... 1
Exhibit 1.1.1 – Missouri Planted and Harvested Soybean Acreage, 1970 to 2011 ............................. 1 Exhibit 1.1.2 – Missouri Soybean Acres as a Percent of Total Missouri Crop Production Acreage,
1990 to 2011 ............................................................................................................................................................ 2 Exhibit 1.1.3 – Missouri Share of U.S. Soybean Production, 1970 to 2011 ............................................. 3
Exhibit 1.1.4 – Double-Cropped Missouri Soybean Acreage Harvested as a Percent of Total Missouri Soybean Acreage Harvested, 1985 to 2011 .............................................................................. 4
Exhibit 1.1.5 – Soybeans Irrigated and Nonirrigated in Missouri, 1992 to 2007 ................................ 5 Exhibit 1.1.6 – Soybean Acreage and All Biotech Variety Adoption in Missouri, 2000 to 2011 .... 6 Exhibit 1.2.1 – Missouri Soybean Production Yield ........................................................................................... 7 Exhibit 1.2.2 – Missouri Soybean Yield, Pod Count and Row Width .......................................................... 8 Exhibit 1.2.3 – Missouri Actual Soybean Yield and Predicted Yield to 2022 .......................................... 9 Exhibit 1.2.4 – Missouri Average Soybean Production by County, 2008 to 2010 .............................. 10 Exhibit 1.2.5 – Missouri Average Soybean Yields by County, 2008 to 2010 ........................................ 11 Exhibit 1.2.6 – Missouri Soybean Production Risk, 2008 to 2010 ........................................................... 12
Exhibit 1.2.7 – Missouri Soybean Production Relative to Other States’ Production, 2008 to 2010 Average .................................................................................................................................................................... 13
Exhibit 1.3.1 – U.S. Soybean Production Quality ............................................................................................. 14 Exhibit 1.3.2 – Trends in Missouri Soybean Quality ..................................................................................... 15 Exhibit 1.3.3 – Changes in Missouri Soybean Quality ................................................................................... 16 Exhibit 1.4.3 – Missouri Percent Market Value of Soybeans Sold, by Farm Size, 2007 .................. 16 Exhibit 1.4.1 – Soybean Farms and Soybean Farm Characteristics ........................................................ 17 Exhibit 1.4.2 – Missouri Soybean Farm, 1959 to 2007 ................................................................................ 17 Exhibit 1.4.3 – Missouri Percent Market Value of Soybeans Sold, By Farm Size, 2007 .................. 18 Exhibit 1.4.4 – Missouri Soybean Farms by Typology, 2007 ..................................................................... 18 Exhibit 1.4.5 – Missouri Soybean Farm Operator Classification, 2007 ................................................. 19 Exhibit 1.5.1 – Missouri Soybean Cost of Production ................................................................................... 20 Exhibit 1.5.2 – Soybean Seed Cost Incurred by Missouri Farmers .......................................................... 21
Exhibit 1.5.3 – Soybean Chemical Cost Incurred by Missouri Farmers ................................................. 21 Exhibit 1.5.4 – Missouri Soybean Herbicide Application and Rates, 1990 to 2006 ......................... 22 Exhibit 1.5.5 – Missouri Soybean Production Budgets, Revenues and Costs ...................................... 23 Exhibit 1.5.6 – Missouri Soybean Production Total Budgets, Revenues and Costs, Inflation-
Adjusted to 2011 Dollars .................................................................................................................................. 25 Exhibit 1.5.7 – Missouri Farmland Prices Appreciation, 1918 to 2011 ................................................. 28 Exhibit 1.5.8 – Missouri Cropland Cash Rents, Per Acre .............................................................................. 28 Exhibit 1.5.9 – Cash Rent Land value of Acreage Used for Missouri Soybeans ................................... 29 Exhibit 1.5.10 – Missouri Total State Herbicide Costs Paid Out by Soybean Farmers ..................... 29 Exhibit 1.5.11 – Soybean Production Dollars Spent, 2008 to 2010 Average, Millions .................. 30 Exhibit 1.6.1 – Missouri Season Average Farm Price and Production, 1970 to 2011……………… 31 Exhibit 1.6.2 – Missouri Leading Commodities for Cash Receipts, 2008 to 2010…………………… 32 Exhibit 1.6.3 – Missouri Cash Receipts for Soybeans, 1975 to 2010 …………………………………… .. 32 Exhibit 1.6.4 – Top Crops’ Share of Missouri Total Farm Receipts, 2008 to 2010 .......................... 33 Exhibit 1.6.5 – Missouri Top Crops’ Share of U.S. Total Cash Receipts, Per Crop, 2008 to 2010. 33
Chapter 2 – Beyond the Farm ........................................................................................................ 34 Exhibit 2.1.1 – Missouri Soybean Stocks on Dec. 1, 1949 to Dec. 1, 2011 ........................................... 34 Exhibit 2.1.2 – Percent of Missouri Soybean Crop Relative to Given Categories of Storage
Capacity ................................................................................................................................................................... 35 Exhibit 2.1.3 – Missouri On-Farm, Off-Farm and Total Storage Capacity and Predicted Capacity through 2022 ...................................................................................................................................... 36 Exhibit 2.2.1 – Locations of Missouri Grain Elevators .................................................................................. 37 Exhibit 2.2.2 – One-Time Capacity (Bushels) of Missouri Grain Elevators .......................................... 38 Exhibit 2.3.1 – Assumed Share of Soybean Shipments from Farms by Vehicle Size ........................ 39 Exhibit 2.3.2 – Modes of Missouri Transportation from Elevators, Shipment Value, Millions of Dollars ...................................................................................................................................................................... 39 Exhibit 2.3.2 – Modes of Missouri Transportation from Elevators, Shipment Volume, Millions of Dollars ...................................................................................................................................................................... 40 Exhibit 2.3.4 – Grain Rates and Train Type ...................................................................................................... 41 Exhibit 2.3.5 – Grain Rates and Shipment Distance ...................................................................................... 42 Exhibit 2.3.6 – Grain Rates and Car Ownership .............................................................................................. 43 Exhibit 2.3.7 – Historical Average Freight Revenue Per Grains and Oilseeds Carload ................... 44 Exhibit 2.3.8 – Freight Revenue for Commodity Rail Shipments ............................................................. 45 Exhibit 2.3.9 – Railroad Fuel Surcharges ........................................................................................................... 46
Chapter 3 – Soybean Processing and Use .................................................................................. 47 Exhibit 3.1.1 – Missouri and U.S. Soybean Processing Industry, 2007 .................................................. 47 Exhibit 3.2.1 – Soybeans Crushed or Used at Missouri Oil Mills .............................................................. 48 Exhibit 3.2.2 – 2008-to-2010 Average Crushed or Used Soybeans at Missouri Oil Mills ............. 49 Exhibit 3.2.3 – St. Louis USDA AMS Soybean Prices ...................................................................................... 50 Exhibit 3.2.4 – St. Louis CHS Soybean Prices .................................................................................................... 51 Exhibit 3.2.5 – St. Louis ADM Soybean Prices .................................................................................................. 52 Exhibit 3.2.6 – Kansas City USDA AMS Soybean Prices ................................................................................ 53 Exhibit 3.2.7 – Kansas City Cargill, Chouteau Location, Soybean Prices ............................................... 54 Exhibit 3.2.8 – Kansas City Cargill, Katy Location, Soybean Prices ......................................................... 55
Exhibit 3.2.9 – Kansas City Cargill, GOS Location< Soybean Prices ........................................................ 56 Exhibit 3.2.10 – Lamar MFA Soybean Prices .................................................................................................... 57 Exhibit 3.2.11 – Mexico, Mo., MFA Soybean Prices ........................................................................................ 58 Exhibit 3.2.12 – Mexico, Mo., ADM Soybean Prices ....................................................................................... 59 Exhibit 3.2.13 – Higginsville MFA Soybean Prices ......................................................................................... 60 Exhibit 3.3.1 – Missouri Soybean Meal Consumption by Animal Agriculture .................................... 61 Exhibit 3.3.2 – Kansas City High-Protein Soybean Meal Prices ................................................................ 62 Exhibit 3.3.3 – Price of 48% Soybean Meal, Mexico, Mo., ADM ................................................................ 63 Exhibit 3.3.4 – Prices of 48% Soybean Meal, Versailles, NutraAg, LLC ................................................. 64 Exhibit 3.3.5 – Kansas City Soybean Meal Price as a Percentage of Central Illinois Truck Soybean
Meal Price ................................................................................................................................................................. 65 Exhibit 3.3.6 – Mexico, Mo., ADM Soybean Prices as a Percentage of Central Illinois Truck
Soybean Meal Price ............................................................................................................................................. 66 Exhibit 3.3.7 – Kansas City Soybean Meal Price as a Percentage of Central Illinois DDG Price ... 67 Exhibit 3.3.8 – Mexico, Mo., ADM Soybean Meal Price as a Percentage of Central Illinois DDG
Prices ...................................................................................................................................................................... 68 Exhibit 3.3.9 – Kansas City Soybean Meal Price and U.S. Ethanol Production ................................... 69 Exhibit 3.3.10 – Kansas City Soybean Meal Price and U.S. Methyl Ester Disappearance ............... 70 Exhibit 3.3.11 – Cake and Meal Production at Missouri Oil Mills ............................................................ 71 Exhibit 3.3.12 – 2008-to-2010 Average Cake or Meal Production at Missouri Oil Mills ................ 72 Exhibit 3.4.1 – Crude Soybean Oil Production at Missouri Oil Mills ....................................................... 73 Exhibit 3.4.2 – 2008-to-2010 Average Crude Soybean Oil Production in Missouri ......................... 74 Exhibit 3.4.3 – Crude Oil WTI Spot Price, FOB, at Cushing, Okla. .............................................................. 74

Exhibit 3.4.4 – Crude Oil Spot Price, FOB, at Europe Brent ........................................................................ 75 Exhibit 3.4.5 – Central Illinois Crude Soybean Oil and RBD Soybean Oil Price……………………….. 76 Exhibit 3.4.6 Spread between Central Illinois Crude Soybean Oil Prices and Central Illinois RBD
Soybean Oil Price………………………………………………………………………………………………………….. 77 Exhibit 3.4.7 – Lower Midwest B100 Biodiesel Price to Central Illinois Crude Soybean Oil Price ........................................................................................................................................................................... 78 Exhibit 3.4.8 – Yellow Grease (Missouri River) as a Percent of Central Illinois Crude Soybean Oil
Price ........................................................................................................................................................................... 79 Exhibit 3.4.9 – Central Illinois Crude Soybean Oil Price and U.S. Methyl Ester Disappearance .. 80 Exhibit 3.5.1 – Crude and Refine Glycerol Prices ........................................................................................... 81 Exhibit 3.5.2 – Spread between Crude Prices and Refined Glycerol Prices ......................................... 82 Exhibit 3.5.3 – Crude Glycerol Price as a Percentage of Refined Glycerol ............................................ 83 Exhibit 3.5.4 – Glycerol Price vs. Methyl Ester Disappearance ................................................................. 84 Exhibit 3.6.1 – Estimated Soybean Hulls Produced at Missouri Mills .................................................... 85 Exhibit 3.6.2 – 2008-to-2010 Average Estimated Soybean Hulls Produced in Missouri ............... 86 Exhibit 3.6.3 – Kansas City Soybean Hull Price ............................................................................................... 86 Exhibit 3.6.4 – Kansas City Hull Price Relative to Central Illinois Hull Price ...................................... 87 Exhibit 3.6.5 – Soy Hull Price, Mexico, Mo., ADM ............................................................................................. 88 Exhibit 3.6.6 – Pelleted Soy Hull Prices, North Kansas City, Cyber Ag ................................................... 89 Exhibit 3.6.7 – Pelleted Soy Hull Prices, Cairo, Ill., Bunge ........................................................................... 90 Exhibit 3.6.8 – Kansas City Hull Price and U.S. Methyl Ester Disappearance ..................................... 91
Chapter 4 – International Soybean Production and Trade ................................................. 92 Exhibit 4.1.1 – Worldwide Area Dedicated to Soybean Production ...................................................... 92 Exhibit 4.1.2 – Worldwide Soybean Yields ........................................................................................................ 93 Exhibit 4.1.3 – Worldwide Soybean Production ............................................................................................. 94 Exhibit 4.2.1 – U.S. Grain Hopper Fleet Capacity, 1980 to 2007 .............................................................. 95 Exhibit 4.2.2 – Total Waterborne Agricultural Container Trade (Imports and Exports) .............. 96 Exhibit 4.2.3 – Top 10 U.S. Ports Moving Agricultural Imports, 2007 ................................................... 97 Exhibit 4.2.4 – Top 10 U.S. Ports Moving Agricultural Exports, 2007 ................................................... 98 Exhibit 4.2.5 – Container Rates for Trans-Pacific Trade Lanes ................................................................ 99 Exhibit 4.2.6 – U.S. Intermodal Facilities, 2002 ............................................................................................ 100 Exhibit 4.2.7 – Total Value and Volume of U.S. Soybean and Soybean Product Exports ............. 101 Exhibit 4.2.8 – Value and Volume of U.S. Soybean Exports ..................................................................... 102 Exhibit 4.2.9 – Value and Volume of U.S. Soybean Meal Exports .......................................................... 103 Exhibit 4.2.10 – Value and Volume of U.S. Soybean Oil Exports ............................................................ 104 Exhibit 4.2.11 – Top 10 U.S. Soybean Export Markets by Value, 2011 ............................................... 105 Exhibit 4.2.12 – 2011 Top U.S. Soybean Export Market’s Change in Export Value ....................... 106 Exhibit 4.2.13 – Top 10 U.S. Soybean Meal Export Markets by Value, 2011 .................................... 107
Exhibit 4.2.14 – Top U.S. Soybean Meal Export Markets’ Change in Export Value ....................... 108 Exhibit 4.2.15 – Top U.S. Soybean Oil Export Markets by Value, 2011 .............................................. 109 Exhibit 4.2.16 – 2011 Top U.S. Soybean Oil Export Markets’ Change in Export Value ................ 110 Exhibit 4.3.1 – Value of Missouri Soybean Exports .................................................................................... 111 Exhibit 4.3.2 – Missouri Soybean Export Trading Partners, Thousand Dollars ............................. 112 Exhibit 4.3.3 – Missouri Soybean Meal Export Trading Partners, Thousand Dollars .................. 113 Exhibit 4.3.4 – Missouri Soybean Oil Export Trading Partners, Thousand Dollars ....................... 114 Exhibit 4.3.5 – State-by-State Value of Soybean Exports, Ranked by 2011 Value, Thousand
Dollars ................................................................................................................................................................... 115 Exhibit 4.3.6 – State-by-State Value of Soybean Meal Exports, Ranked by 2011 Value, Thousand
Dollars ................................................................................................................................................................... 116
Exhibit 4.3.7 – State-by-State Value of Soybean Oil Exports, Ranked by 2011 Value, Thousand Dollars ................................................................................................................................................................... 117

1
Chapter 1: Soybean Production
1.1 Acreage
Exhibit 1.1.1 – Missouri Planted and Harvested Soybean Acreage, 1970 to 2011
Source: USDA National Agricultural Statistics Service
0
1,000,000
2,000,000
3,000,000
4,000,000
5,000,000
6,000,000
7,000,000
19
70
19
72
19
74
19
76
19
78
19
80
19
82
19
84
19
86
19
88
19
90
19
92
19
94
19
96
19
98
20
00
20
02
20
04
20
06
20
08
20
10
Acr
es
Planted Acres Harvested Acres
2
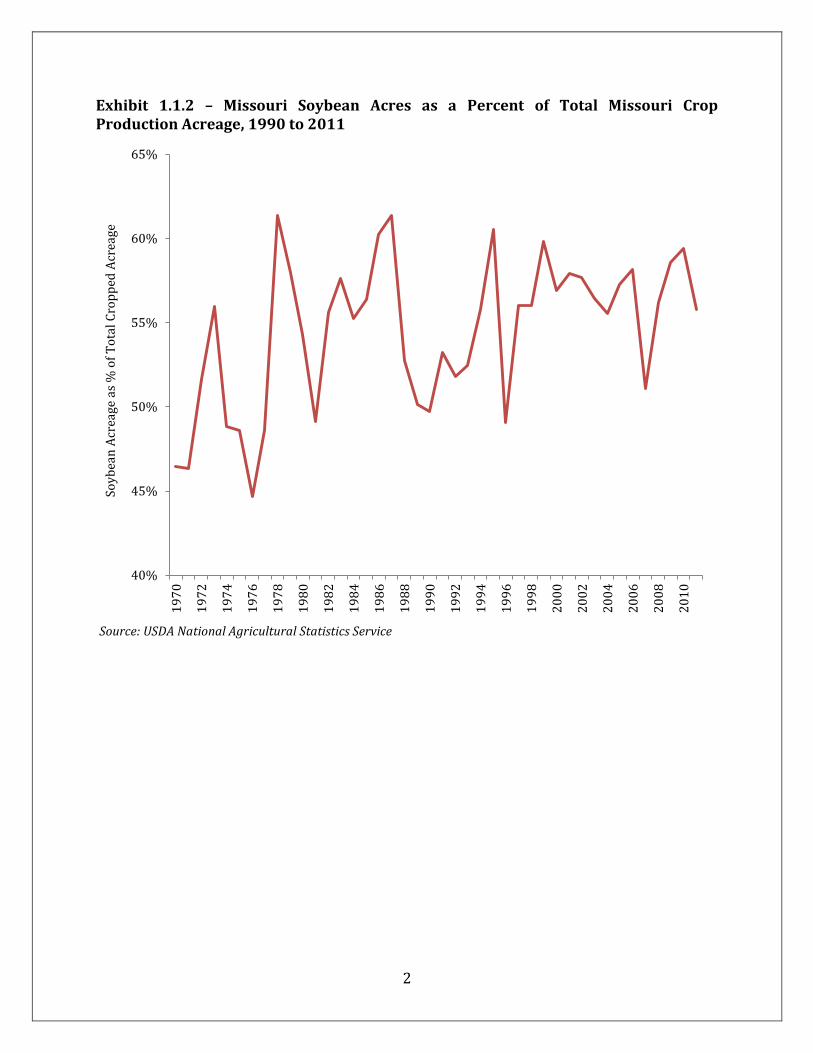
Exhibit 1.1.2 – Missouri Soybean Acres as a Percent of Total Missouri Crop Production Acreage, 1990 to 2011
Source: USDA National Agricultural Statistics Service
40%
45%
50%
55%
60%
65%
19
70
19
72
19
74
19
76
19
78
19
80
19
82
19
84
19
86
19
88
19
90
19
92
19
94
19
96
19
98
20
00
20
02
20
04
20
06
20
08
20
10
Soy
bea
n A
crea
ge a
s %
of
To
tal
Cro
pp
ed A
crea
ge

3
Exhibit 1.1.3 – Missouri’s Share of U.S. Soybean Production, 1970 to 2011
Source: USDA National Agricultural Statistics Service
0%
1%
2%
3%
4%
5%
6%
7%
8%
9%
10%
19
70
19
72
19
74
19
76
19
78
19
80
19
82
19
84
19
86
19
88
19
90
19
92
19
94
19
96
19
98
20
00
20
02
20
04
20
06
20
08
20
10
Shar
e
Share of Acres Harvested Share of Acres Planted Share of Production (Bushels)

4
Exhibit 1.1.4 – Double Cropped Missouri Soybean Acreage Harvested as a Percent of Total Missouri Soybean Acreage Harvested, 1985 to 2011
Source: USDA National Agricultural Statistics Service
0
100,000
200,000
300,000
400,000
500,000
600,000
700,000
800,000
900,000
0%
2%
4%
6%
8%
10%
12%
14%
16%
18%
19
85
19
86
19
87
19
88
19
89
19
90
19
91
19
92
19
93
19
94
19
95
19
96
19
97
19
98
19
99
20
00
20
01
20
02
20
03
20
04
20
05
20
06
20
07
20
08
20
09
20
10
20
11
Acr
es
Per
cen
t D
ou
ble
Cro
p o
f M
isso
uri
So
yb
ean
Acr
eage
Double-Crop Soybeans as Percent of Missouri Acres Harvested
Acres Harvested of Double-Crop Soybeans
5
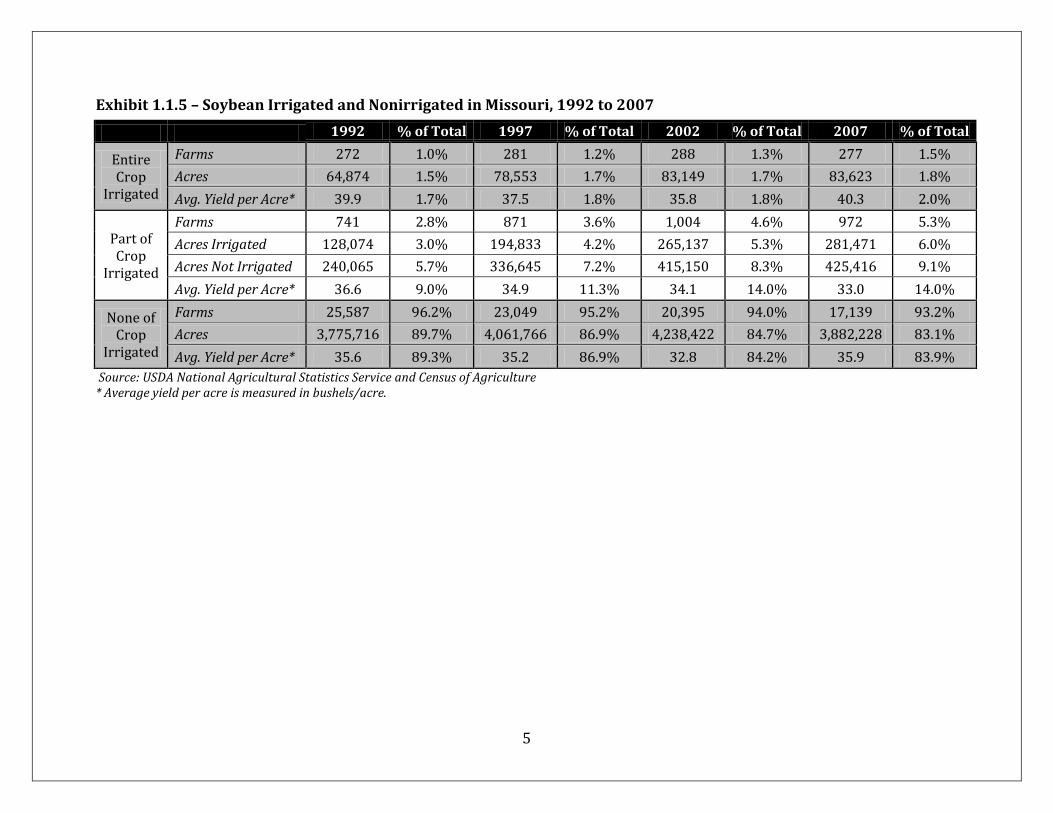
Exhibit 1.1.5 – Soybean Irrigated and Nonirrigated in Missouri, 1992 to 2007
1992 % of Total 1997 % of Total 2002 % of Total 2007 % of Total
Entire Crop
Irrigated
Farms 272 1.0% 281 1.2% 288 1.3% 277 1.5%
Acres 64,874 1.5% 78,553 1.7% 83,149 1.7% 83,623 1.8%
Avg. Yield per Acre* 39.9 1.7% 37.5 1.8% 35.8 1.8% 40.3 2.0%
Part of Crop
Irrigated
Farms 741 2.8% 871 3.6% 1,004 4.6% 972 5.3%
Acres Irrigated 128,074 3.0% 194,833 4.2% 265,137 5.3% 281,471 6.0%
Acres Not Irrigated 240,065 5.7% 336,645 7.2% 415,150 8.3% 425,416 9.1%
Avg. Yield per Acre* 36.6 9.0% 34.9 11.3% 34.1 14.0% 33.0 14.0%
None of Crop
Irrigated
Farms 25,587 96.2% 23,049 95.2% 20,395 94.0% 17,139 93.2%
Acres 3,775,716 89.7% 4,061,766 86.9% 4,238,422 84.7% 3,882,228 83.1%
Avg. Yield per Acre* 35.6 89.3% 35.2 86.9% 32.8 84.2% 35.9 83.9%
Source: USDA National Agricultural Statistics Service and Census of Agriculture * Average yield per acre is measured in bushels/acre.

6
Exhibit 1.1.6 – Soybean Acreage and All Biotech Variety Adoption in Missouri, 2000 to 2011
Source: USDA National Agricultural Statistics Service
0%
10%
20%
30%
40%
50%
60%
70%
80%
90%
100%
4,200,000
4,400,000
4,600,000
4,800,000
5,000,000
5,200,000
5,400,000
20
00
20
01
20
02
20
03
20
04
20
05
20
06
20
07
20
08
20
09
20
10
20
11
Per
cen
t o
f B
iote
ch A
do
pti
on
of
All
So
yb
ean
s P
lan
ted
Acr
es
Missouri Planted Acreage All Biotech Varieties

7
1.2 Production and Yield Exhibit 1.2.1 – Missouri Soybean Production Yield
Source: USDA National Agricultural Statistics Service Acreage Report
0
50
100
150
200
250
0
5
10
15
20
25
30
35
40
45
501
97
0
19
72
19
74
19
76
19
78
19
80
19
82
19
84
19
86
19
88
19
90
19
92
19
94
19
96
19
98
20
00
20
02
20
04
20
06
20
08
20
10
Mil
lio
ns
of
Bu
shel
s
Bu
shel
s/A
cre
Production Yield
8
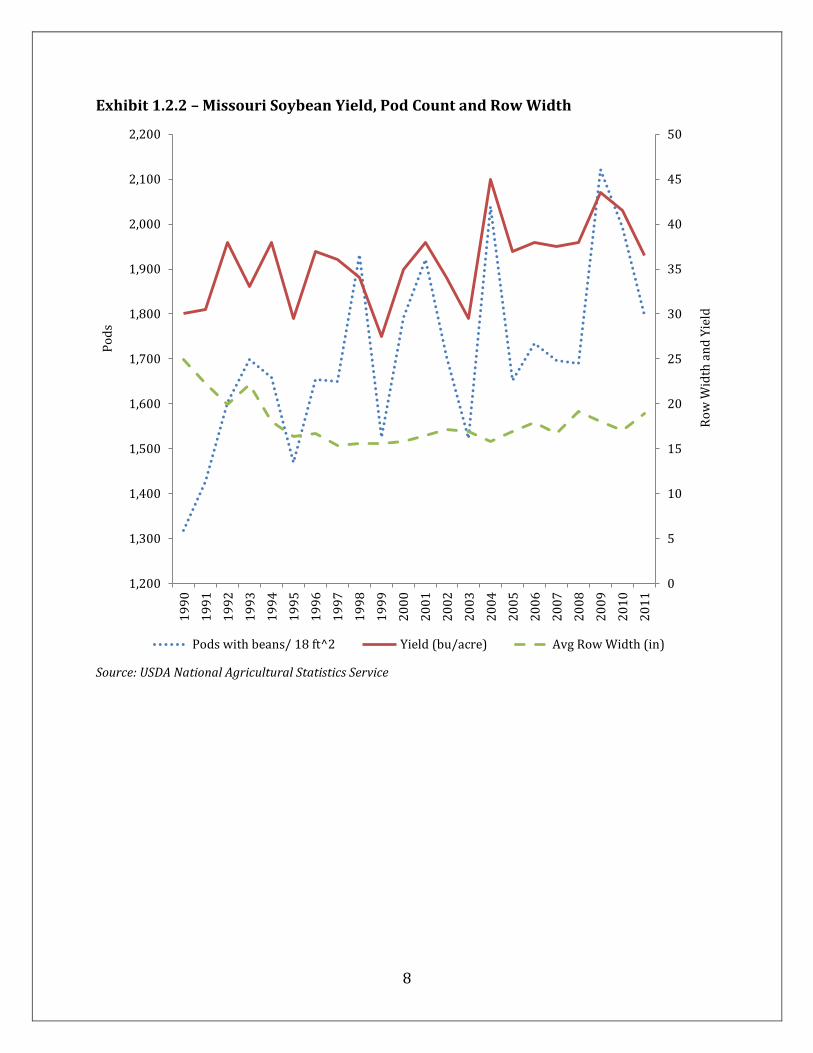
Exhibit 1.2.2 – Missouri Soybean Yield, Pod Count and Row Width
Source: USDA National Agricultural Statistics Service
0
5
10
15
20
25
30
35
40
45
50
1,200
1,300
1,400
1,500
1,600
1,700
1,800
1,900
2,000
2,100
2,200
19
90
19
91
19
92
19
93
19
94
19
95
19
96
19
97
19
98
19
99
20
00
20
01
20
02
20
03
20
04
20
05
20
06
20
07
20
08
20
09
20
10
20
11
Ro
w W
idth
an
d Y
ield
Po
ds
Pods with beans/ 18 ft^2 Yield (bu/acre) Avg Row Width (in)

9
Exhibit 1.2.3 – Missouri Actual Soybean Yield and Predicted Yield to 2022
Source: USDA National Agricultural Statistics Service and Value Ag, LLC
0
5
10
15
20
25
30
35
40
45
50
19
90
19
91
19
92
19
93
19
94
19
95
19
96
19
97
19
98
19
99
20
00
20
01
20
02
20
03
20
04
20
05
20
06
20
07
20
08
20
09
20
10
20
11
20
12
20
13
20
14
20
15
20
16
20
17
20
18
20
19
20
20
20
21
20
22
Bu
shel
s/A
cre
Predicted Actual

10
Exhibit 1.2.4 – Missouri Average Soybean Production by County, 2008 to 2010
Source: USDA National Agricultural Statistics Service
Production in bushels
15,000 - 298,000
298,000 - 985,667
985,667 - 2,055,333
2,055,333 - 2,720,867
2,720,867 - 4,079,067
4,079,067 - 7,987,067
No Data

11
Exhibit 1.2.5 – Missouri Average Soybean Yields, by County, 2008 to 2010
Source: USDA National Agricultural Statistics Service
Yield (bushels/acre)
30.000 - 36.467
36.467 - 38.567
38.567 - 41.300
41.300 - 43.167
43.167 - 49.400
No Data
12
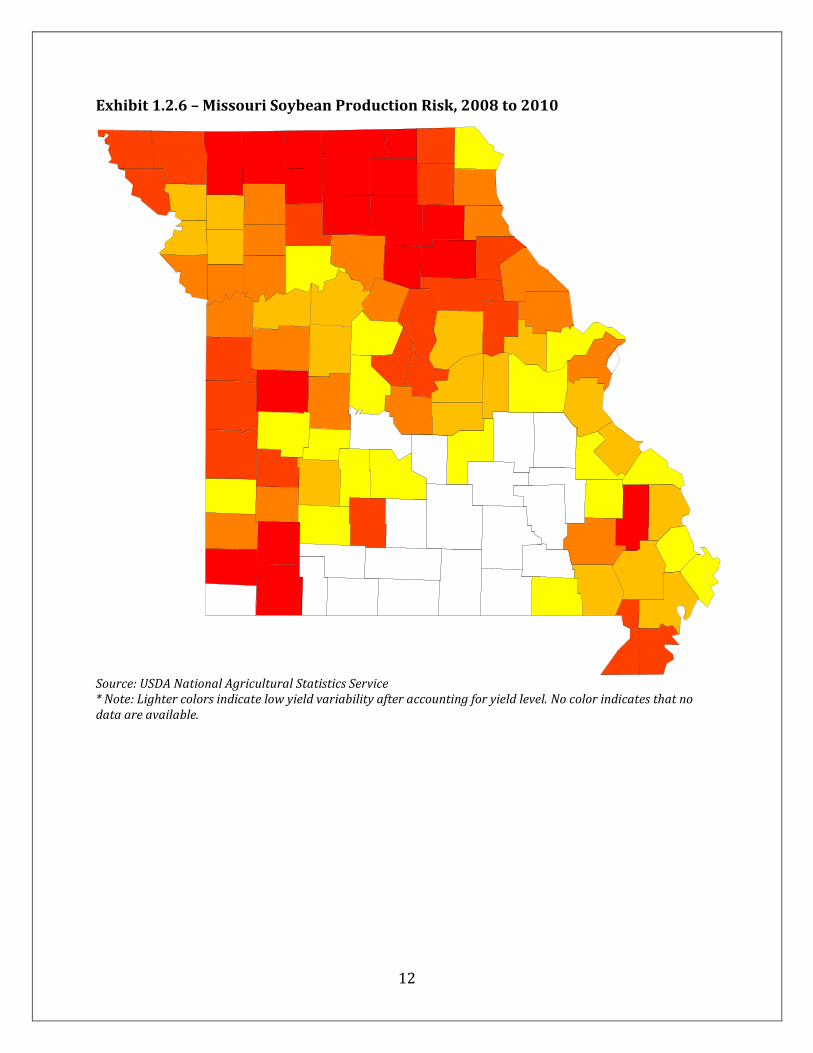
Exhibit 1.2.6 – Missouri Soybean Production Risk, 2008 to 2010
Source: USDA National Agricultural Statistics Service * Note: Lighter colors indicate low yield variability after accounting for yield level. No color indicates that no data are available.

13
Exhibit 1.2.7 – Missouri Soybean Production Relative to Other States’ Production, 2008-to-2010 Average
State Yield
(Bushels/Acre) Area Harvested
(1,000 Acres)
Nebraska 51.5 4,907
Iowa 49.7 9,643
Illinois 48.2 9,487
Indiana 47.5 5,400
New York 45.7 253
Ohio 44.3 4,533
Pennsylvania 42.7 457
Wisconsin 41.8 1,613
Missouri 41.2 5,133
Minnesota 41.0 7,133
Kentucky 39.0 1,393
Michigan 39.0 1,973
Mississippi 38.8 1,990
South Dakota 38.0 4,130
Kansas 37.8 3,717
Louisiana 37.7 970
Arkansas 37.0 3,223
Tennessee 36.7 1,467
Maryland 35.3 475
Delaware 34.0 183
Alabama 33.7 375
New Jersey 32.0 90
Virginia 31.7 560
Georgia 31.0 370
North Carolina 31.0 1,657
North Dakota 30.7 3,900
Oklahoma 30.3 408
Texas 26.7 193
South Carolina 26.7 517 Source: American Soybean Association * Note: Yield and area harvested data are simple averages of data from 2008 to 2010.
14
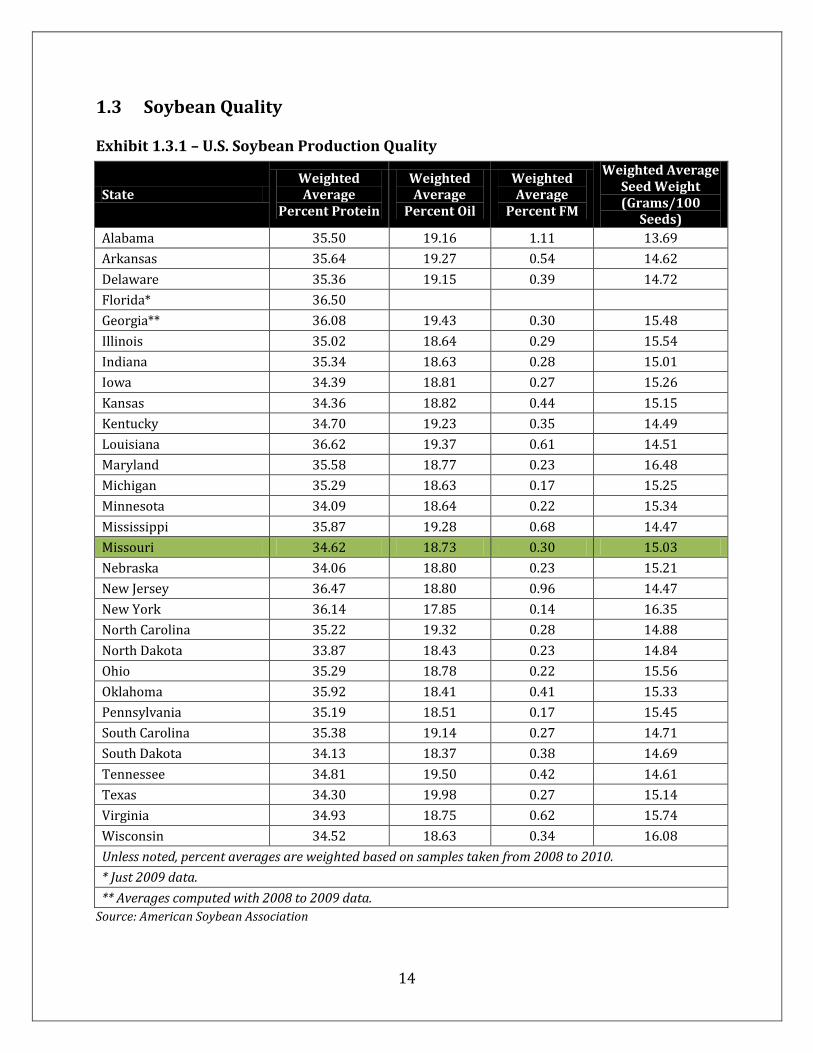
1.3 Soybean Quality Exhibit 1.3.1 – U.S. Soybean Production Quality
State Weighted Average
Percent Protein
Weighted Average
Percent Oil
Weighted Average
Percent FM
Weighted Average Seed Weight (Grams/100
Seeds)
Alabama 35.50 19.16 1.11 13.69
Arkansas 35.64 19.27 0.54 14.62
Delaware 35.36 19.15 0.39 14.72
Florida* 36.50
Georgia** 36.08 19.43 0.30 15.48
Illinois 35.02 18.64 0.29 15.54
Indiana 35.34 18.63 0.28 15.01
Iowa 34.39 18.81 0.27 15.26
Kansas 34.36 18.82 0.44 15.15
Kentucky 34.70 19.23 0.35 14.49
Louisiana 36.62 19.37 0.61 14.51
Maryland 35.58 18.77 0.23 16.48
Michigan 35.29 18.63 0.17 15.25
Minnesota 34.09 18.64 0.22 15.34
Mississippi 35.87 19.28 0.68 14.47
Missouri 34.62 18.73 0.30 15.03
Nebraska 34.06 18.80 0.23 15.21
New Jersey 36.47 18.80 0.96 14.47
New York 36.14 17.85 0.14 16.35
North Carolina 35.22 19.32 0.28 14.88
North Dakota 33.87 18.43 0.23 14.84
Ohio 35.29 18.78 0.22 15.56
Oklahoma 35.92 18.41 0.41 15.33
Pennsylvania 35.19 18.51 0.17 15.45
South Carolina 35.38 19.14 0.27 14.71
South Dakota 34.13 18.37 0.38 14.69
Tennessee 34.81 19.50 0.42 14.61
Texas 34.30 19.98 0.27 15.14
Virginia 34.93 18.75 0.62 15.74
Wisconsin 34.52 18.63 0.34 16.08
Unless noted, percent averages are weighted based on samples taken from 2008 to 2010.
* Just 2009 data.
** Averages computed with 2008 to 2009 data.
Source: American Soybean Association
15
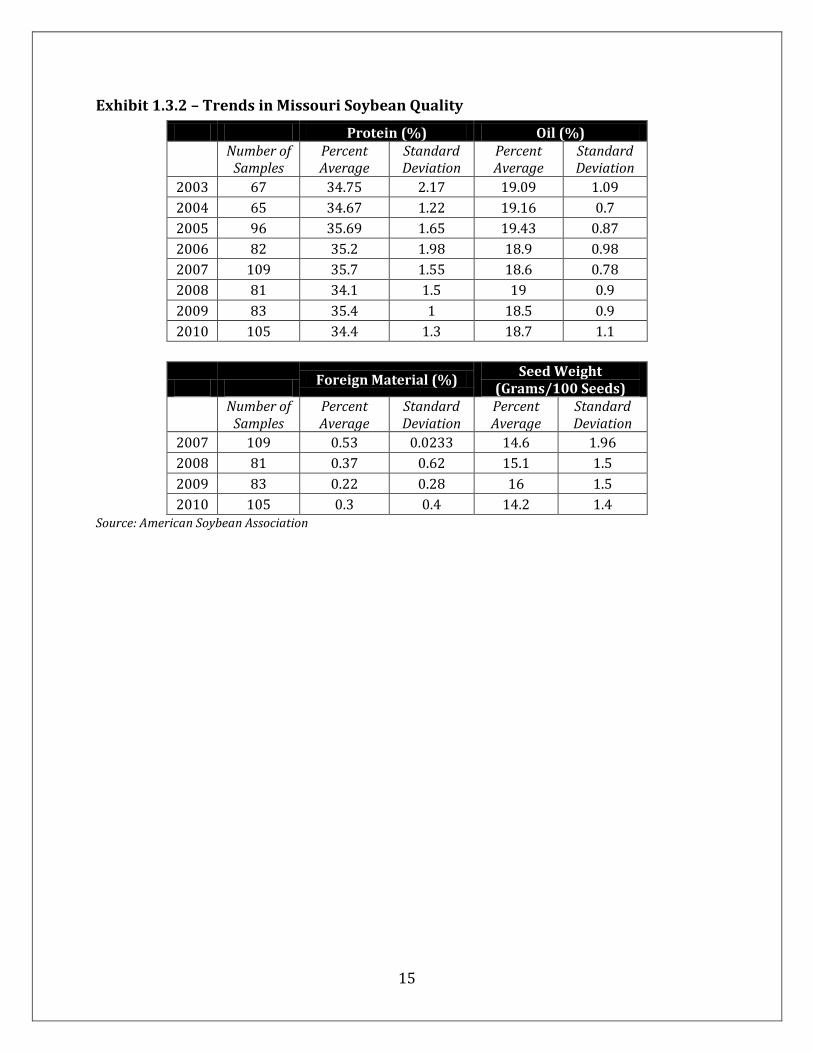
Exhibit 1.3.2 – Trends in Missouri Soybean Quality
Protein (%) Oil (%)
Number of
Samples Percent Average
Standard Deviation
Percent Average
Standard Deviation
2003 67 34.75 2.17 19.09 1.09
2004 65 34.67 1.22 19.16 0.7
2005 96 35.69 1.65 19.43 0.87
2006 82 35.2 1.98 18.9 0.98
2007 109 35.7 1.55 18.6 0.78
2008 81 34.1 1.5 19 0.9
2009 83 35.4 1 18.5 0.9
2010 105 34.4 1.3 18.7 1.1
Foreign Material (%)
Seed Weight (Grams/100 Seeds)
Number of
Samples Percent Average
Standard Deviation
Percent Average
Standard Deviation
2007 109 0.53 0.0233 14.6 1.96
2008 81 0.37 0.62 15.1 1.5
2009 83 0.22 0.28 16 1.5
2010 105 0.3 0.4 14.2 1.4 Source: American Soybean Association
16
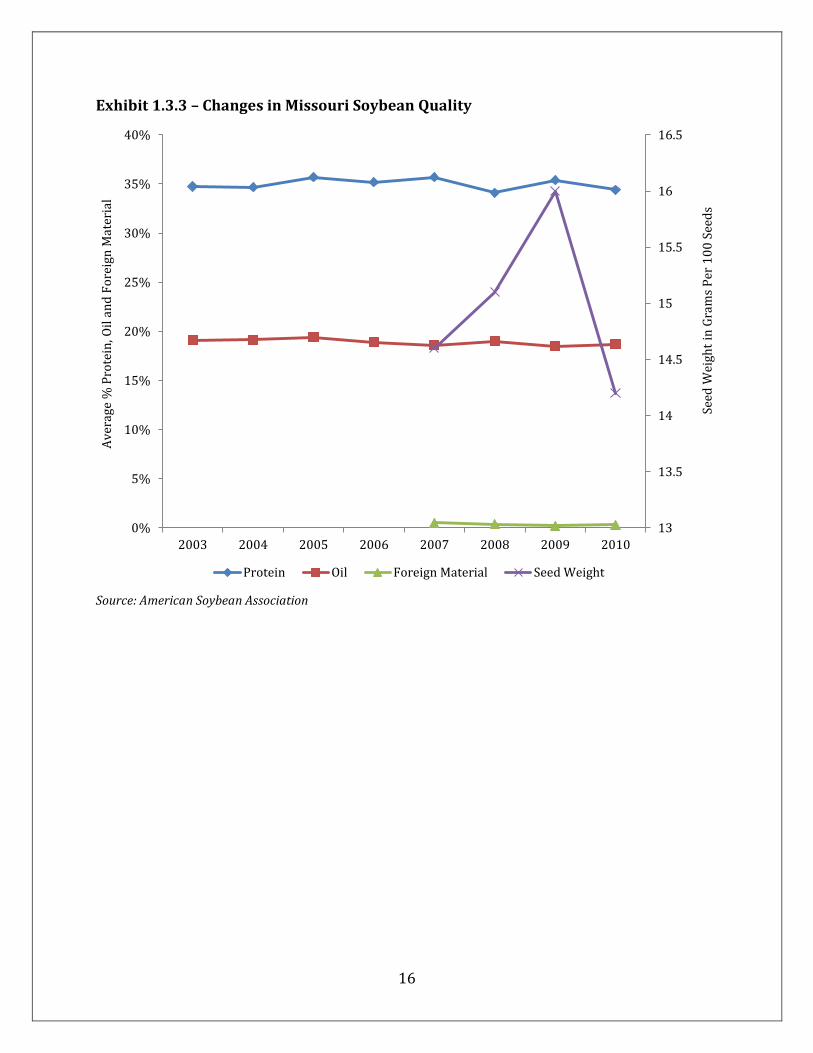
Exhibit 1.3.3 – Changes in Missouri Soybean Quality
Source: American Soybean Association
13
13.5
14
14.5
15
15.5
16
16.5
0%
5%
10%
15%
20%
25%
30%
35%
40%
2003 2004 2005 2006 2007 2008 2009 2010
Seed
Wei
ght
in G
ram
s P
er 1
00
See
ds
Av
erag
e %
Pro
tein
, Oil
an
d F
ore
ign
Mat
eria
l
Protein Oil Foreign Material Seed Weight

17
1.4 Soybean Farms and Soybean Farm Characteristics Exhibit 1.4.1 – Missouri Farms with Soybeans, Acreage and Bushels Produced, 2007
Farm Size Number of
Soybean Farms
% of Total
Farms
Number of Acres
% of Total Acres
Bushels Produced
% of Total Bushels
Produced
1 to 99 acres 2,356 13% 67,161 1% 2,117,299 1%
100 to 259 acres 4,268 23% 261,755 6% 8,754,809 5%
260 to 499 acres 3,781 21% 420,120 9% 13,895,880 8%
500 to 999 acres 3,756 20% 882,319 19% 30,562,191 18%
1,000 to 1,999 acres 2,740 15% 1,358,117 29% 48,034,385 29%
2,000 or more acres 1,487 8% 1,683,266 36% 62,582,759 38%
Total 18,388 100% 4,672,738 100% 165,947,323 100%
Source: USDA – National Agricultural Statistics Service, Census of Agriculture, 2007
Exhibit 1.4.2 – Missouri Soybean Farms, 1959 to 2007
Source: USDA – National Agricultural Statistics Service, Census of Agriculture
0%
5%
10%
15%
20%
25%
30%
35%
40%
0
5,000
10,000
15,000
20,000
25,000
30,000
35,000
40,000
45,000
50,000
1959 1964 1969 1974 1978 1982 1987 1992 1997 2002 2007
Mis
sou
ri S
oy
bea
n F
arm
s as
a P
erce
nt
of
All
Mis
sou
ri F
arm
s
Nu
mb
er o
f F
arm
s
Soybean Farms % of Total Farms
18
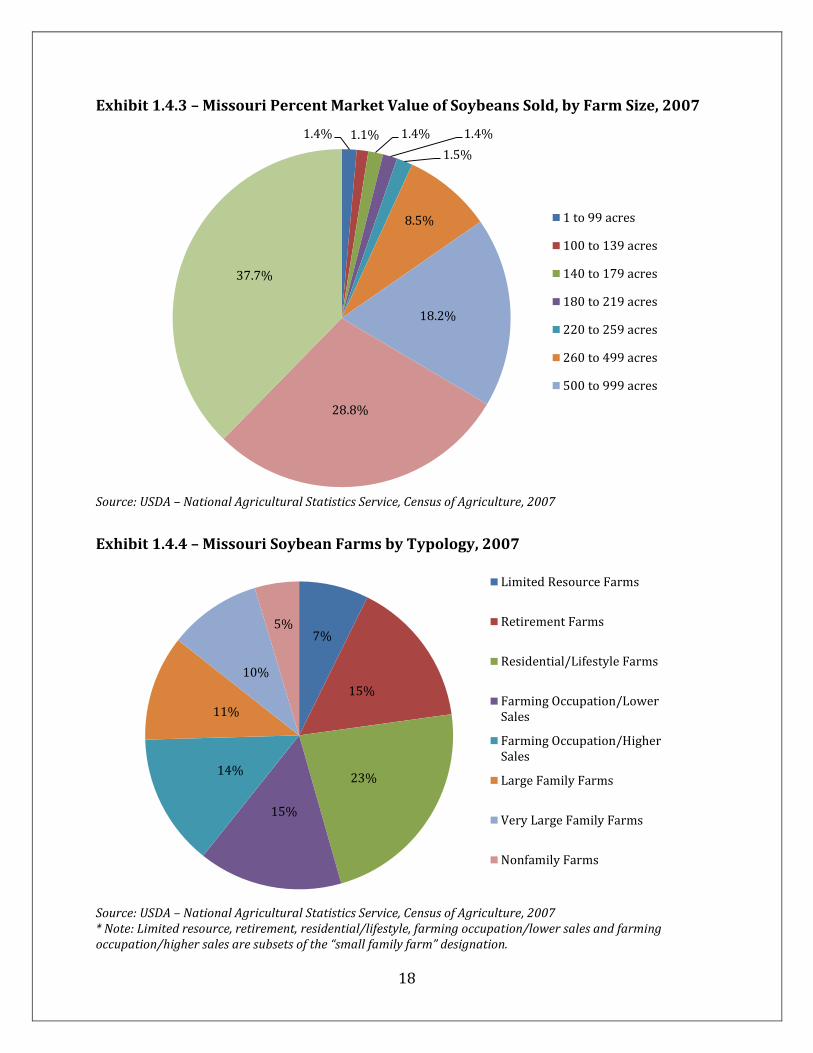
Exhibit 1.4.3 – Missouri Percent Market Value of Soybeans Sold, by Farm Size, 2007
Source: USDA – National Agricultural Statistics Service, Census of Agriculture, 2007
Exhibit 1.4.4 – Missouri Soybean Farms by Typology, 2007
Source: USDA – National Agricultural Statistics Service, Census of Agriculture, 2007 * Note: Limited resource, retirement, residential/lifestyle, farming occupation/lower sales and farming occupation/higher sales are subsets of the “small family farm” designation.
1.4% 1.1% 1.4% 1.4%
1.5%
8.5%
18.2%
28.8%
37.7%
1 to 99 acres
100 to 139 acres
140 to 179 acres
180 to 219 acres
220 to 259 acres
260 to 499 acres
500 to 999 acres
7%
15%
23%
15%
14%
11%
10%
5%
Limited Resource Farms
Retirement Farms
Residential/Lifestyle Farms
Farming Occupation/LowerSales
Farming Occupation/HigherSales
Large Family Farms
Very Large Family Farms
Nonfamily Farms

19
Exhibit 1.4.5 – Missouri Soybean Farm Operator Classification, 2007
Source: USDA – National Agricultural Statistics Service, Census of Agriculture, 2007
42%
49%
9%
Full Owners
Part Owners
Tenants

20
1.5 Cost of Production Exhibit 1.5.1 – Missouri Soybean Cost of Production
2008 ($ Per Acre)
2009 ($ Per Acre)
2010 ($ Per Acre)
Three-Year Average
($ Per Acre)
Operating Costs
Seed $42.98 $53.50 $57.49 $51.32
Fertilizer * $23.42 $22.01 $16.88 $20.77
Chemicals $15.29 $16.87 $16.64 $16.27
Custom operations $5.54 $6.03 $6.10 $5.89
Fuel, lube and electricity $15.82 $10.48 $13.06 $13.12
Repairs $11.25 $11.47 $11.69 $11.47
Interest on operating capital $2.56 $0.17 $0.12 $0.95
Total, nonland labor and management operating costs
$116.86 $120.53 $121.98 $119.79
Allocated Overhead Costs
Hired labor $1.23 $1.26 $1.27 $1.25
Opportunity cost of unpaid labor $15.34 $15.67 $15.84 $15.62
Capital recovery of machinery and equipment
$67.16 $71.33 $73.90 $70.80
Opportunity cost of land (rental rate)
$96.91 $101.29 $105.67 $101.29
Taxes and insurance $9.51 $10.68 $9.29 $9.83
General farm overhead $14.34 $14.62 $14.90 $14.62
Total, allocated overhead $218.25 $241.48 $263.53 $241.09
TOTAL $321.35 $362.01 $385.51 $356.29 * Represents commercial fertilizer, soil conditioners and manure. Source: USDA Economic Research Service and University of Missouri Extension
21
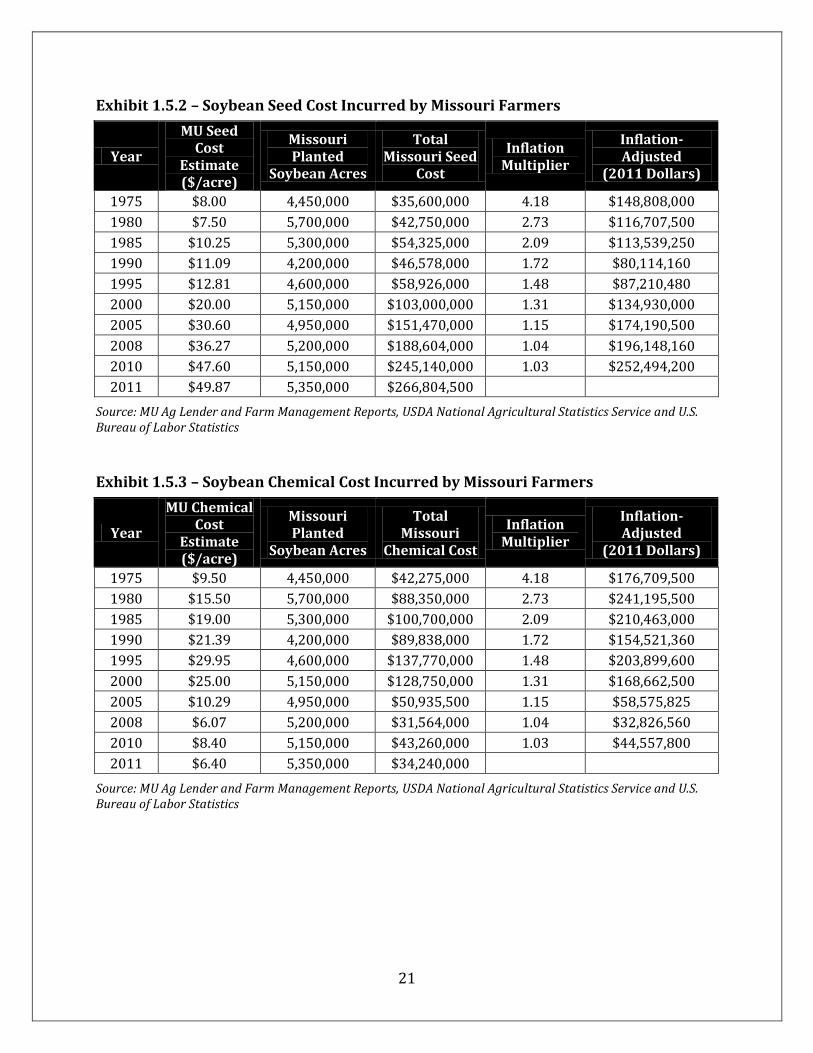
Exhibit 1.5.2 – Soybean Seed Cost Incurred by Missouri Farmers
Year
MU Seed Cost
Estimate ($/acre)
Missouri Planted
Soybean Acres
Total Missouri Seed
Cost
Inflation Multiplier
Inflation-Adjusted
(2011 Dollars)
1975 $8.00 4,450,000 $35,600,000 4.18 $148,808,000
1980 $7.50 5,700,000 $42,750,000 2.73 $116,707,500
1985 $10.25 5,300,000 $54,325,000 2.09 $113,539,250
1990 $11.09 4,200,000 $46,578,000 1.72 $80,114,160
1995 $12.81 4,600,000 $58,926,000 1.48 $87,210,480
2000 $20.00 5,150,000 $103,000,000 1.31 $134,930,000
2005 $30.60 4,950,000 $151,470,000 1.15 $174,190,500
2008 $36.27 5,200,000 $188,604,000 1.04 $196,148,160
2010 $47.60 5,150,000 $245,140,000 1.03 $252,494,200
2011 $49.87 5,350,000 $266,804,500
Source: MU Ag Lender and Farm Management Reports, USDA National Agricultural Statistics Service and U.S. Bureau of Labor Statistics Exhibit 1.5.3 – Soybean Chemical Cost Incurred by Missouri Farmers
Year
MU Chemical Cost
Estimate ($/acre)
Missouri Planted
Soybean Acres
Total Missouri
Chemical Cost
Inflation Multiplier
Inflation-Adjusted
(2011 Dollars)
1975 $9.50 4,450,000 $42,275,000 4.18 $176,709,500
1980 $15.50 5,700,000 $88,350,000 2.73 $241,195,500
1985 $19.00 5,300,000 $100,700,000 2.09 $210,463,000
1990 $21.39 4,200,000 $89,838,000 1.72 $154,521,360
1995 $29.95 4,600,000 $137,770,000 1.48 $203,899,600
2000 $25.00 5,150,000 $128,750,000 1.31 $168,662,500
2005 $10.29 4,950,000 $50,935,500 1.15 $58,575,825
2008 $6.07 5,200,000 $31,564,000 1.04 $32,826,560
2010 $8.40 5,150,000 $43,260,000 1.03 $44,557,800
2011 $6.40 5,350,000 $34,240,000
Source: MU Ag Lender and Farm Management Reports, USDA National Agricultural Statistics Service and U.S. Bureau of Labor Statistics

Exhibit 1.5.4 – Missouri Soybean Herbicide Application and Rates, 1990 to 2006
2,4-D Chlorimuron-ethyl Glyphosate Trifluralin Pendimethalin
Planted Acres
(1,000)
Area Applied
(%) Rate
(lb/acre)
Total Applied
(1,000 lbs)
Area Applied
(%) Rate
(lb/acre)
Total Applied
(1,000 lbs)
Area Applied
(%) Rate
(lb/acre)
Total Applied
(1,000 lbs)
Area Applied
(%) Rate
(lb/acre)
Total Applied
(1,000 lbs)
Area Applied
(%) Rate
(lb/acre)
Total Applied
(1,000 lbs)
1990 4,200
17 0.03 21
26 0.75 819
1991 4,500
22 0.02 25
27 0.85 1,050 27 0.78 955
1992 4,300
21 0.03 23 8 0.72 252 34 0.83 1,193 27 0.77 877
1993 4,200 6 0.41 104 21 0.03 24 15 0.69 446 19 0.69 552 35 0.78 1,152
1994 4,600 7 0.40 123 15 0.02 18 16 0.59 438 17 0.82 637 37 0.79 1,349
1995 4,600 8 0.48 178 16 0.02 13 31 0.86 1,218 16 0.69 514 30 0.82 1,131
1996 4,100
16 0.02 15 24 0.81 803 32 1.09 1,450 17 0.77 541
1997 4,900 13 0.33 206 13 0.03 16 22 0.91 999 26 0.94 1,176 32 1.12 1,772
1998 5,100 3 0.41 71 7 0.02 7 41 1.02 2,163 22 0.94 1,043 18 0.92 844
1999 5,400
17 0.03 29 63 0.96 3,234 14 1.00 751 12 0.90 608
2000 5,150
25 0.02 32 66 0.97 3,309 6 1.01 299 15 0.97 718
2001 4,950
11 0.02 8 73 0.85 3,080 11 0.78 411 5 1.10 280
2002 5,050 6 0.52 160 8 0.02 9 84 1.03 4,328
2004 5,000 4 1.08 238 7 0.02 8 90 1.05 4,717 2 1.26 130 2 0.92 81
2006 5,150 3 1.15 155 7 0.02 7 93 1.27 6,061
Source: USDA – National Agricultural Statistics Service * Note: Data have not been published since 2006.

23
Exhibit 1.5.5 – Missouri Soybean Production Budgets, Revenues and Costs
1975 1980 1985 1990 1995 2000 2005 2008 2009 2010 2011
Yield/acre 29.50 36.30 31.30 30.95 35.00 35.00 45.00 50.00 50.00 50.00 50.00
Market price/bushel - - - - - - 5.36 7.90 8.00 9.00 10.00
Estimated Income/acre
Crop income (yield x price) - - - - - - 241.20 395.00 400.00 450.00 500.00
Net payments (fixed) - - - - - - 14.15 14.15 14.15 14.15 14.15
Estimated Total Income/Acre - - - - - - 255.35 409.15 414.15 464.15 514.15
Estimated Operating Costs/Acre
Seed 8.00 7.50 10.25 11.09 12.81 20.00 30.60 36.27 43.07 47.60 49.87
Fertilizer and soil amendments 3.50 10.00 4.25 5.45 5.12 7.75 28.55 37.80 95.20 47.70 52.90
Crop protection chemicals 9.50 15.50 19.00 21.39 29.95 25.00 10.29 6.07 12.90 8.40 6.40
Crop supplies, storage, marketing - - - - - - - 1.00 1.00 1.00 1.00
Crop insurance and consulting - - 2.25 1.62 1.99 - - 9.35 18.00 16.00 18.00
Custom hire and rental 2.50 3.50 5.50 4.71
4.50 6.75 - - - -
Machinery fuel, drying and irrigation energy
- - - - 4.14 20.00 18.53 12.87 13.71 11.60 10.69
Machinery repairs and maintenance 12.50 22.58 22.25 26.09 22.99 - - 11.25 10.96 11.79 10.61
Operator and hired labor 14.00 18.00 19.00 22.69 20.12 23.50 20.44 10.58 11.02 11.32 10.50
Operating interest @ 7% x 1/2 year 5.50 9.00 6.50 9.50 9.16 5.12 3.92 5.01 8.75 5.44 5.20
Miscellaneous* 4.00 6.50 6.50 7.52 8.29 13.00 15.36 - - - -
Total Operating Costs/Acre 59.50 92.58 95.50 110.06 114.57 118.87 134.44 130.20 214.61 160.85 165.17
Estimated Ownership Costs/Acre
Farm business overhead - - - - - - - 4.20 4.32 4.32 4.50
Machinery overhead - - - - - - - 17.48 18.69 19.08 17.31
Machinery depreciation 15.50 26.50 27.00 17.35 21.69 28.00 31.36 22.09 24.65 23.98 21.05
Real estate charge 43.00 79.50 78.00 68.71 76.93 83.00 89.76 107.50 121.50 112.60 133.50
Total Ownership Costs/Acre 58.50 106.00 105.00 86.06 98.62 111.00 121.12 151.27 169.16 159.98 176.36

24
Estimated Total Costs/Acre 118.00 198.58 200.50 196.12 213.19 229.87 255.56 281.47 383.77 320.83 341.53
Income over Operating Costs/Acre - - - - - -
118.87 120.91 278.95 199.54 303.30 348.98
Income over Total Costs/Acre - - - - - - -0.21 127.68 30.38 143.32 172.62
Operating Costs/bushel 2.02 1.79 2.31 2.42 3.25 3.40 2.99 2.60 4.29 3.22 3.30
Total Costs/Bushel 4.00 6.97 5.52 6.27 6.89 6.57 5.68 5.63 7.68 6.42 6.83
Source: University of Missouri Extension Ag Lender & Farm Management Reports
* Note: Information before 2000 is based on estimates of actual costs. From 2000 onward, the statistics represent projections made based on prior year data. Miscellaneous category contains information on operating costs for categories for which a dash (-) is reported prior to 2008.

25
Exhibit 1.5.6 – Missouri Soybean Production Total Budgets, Revenues and Costs, Inflation-Adjusted to 2011 Dollars
1975
1975- Adjusted
1980 1980-
Adjusted 1985
1985- Adjusted
1990 1990-
Adjusted
Estimated Operating Costs
Seed $35,600,000 $150,232,000 $42,750,000 $117,563,000 $52,480,000 $110,733,000 $46,578,000 $81,046,000
Fertilizer and soil amendments $15,575,000 $65,727,000 $57,000,000 $156,750,000 $21,760,000 $45,914,000 $22,890,000 $39,829,000
Crop protection chemicals $42,275,000 $178,401,000 $88,350,000 $242,963,000 $97,280,000 $205,261,000 $89,838,000 $156,318,000
Crop supplies, storage, marketing
- - - - - - - -
Crop insurance and consulting - - - - $11,520,000 $24,307,000 $6,804,000 $11,839,000
Custom hire and rental $11,125,000 $46,948,000 $19,950,000 $54,863,000 $28,160,000 $59,418,000 $19,782,000 $34,421,000
Machinery fuel, drying and irrigation energy
- - - - - - - -
Machinery repairs and maintenance
$55,625,000 $234,738,000 $128,706,000 $353,942,000 $133,920,000 $240,371,000 $109,578,000 $190,666,000
Operator and hired labor $62,300,000 $262,906,000 $102,600,000 $282,150,000 $97,280,000 $205,261,000 $95,298,000 $165,819,000
Operating interest @ 7% x 1/2 year
$24,475,000 $103,285,000 $51,300,000 $141,075,000 $33,280,000 $70,221,000 $39,900,000 $69,426,000
Miscellaneous* $17,800,000 $75,116,000 $37,050,000 $101,888,000 $33,280,000 $70,221,000 $31,584,000 $54,956,000
Total Operating Costs $264,775,000 $1,117,351,000 $527,706,000 $1,451,192,000 $488,960,000 $1,031,706,000 $462,252,000 $804,318,000
Estimated Ownership Costs
Farm business overhead - - - - - - - -
Machinery overhead - - - - - - - -
Machinery depreciation $68,975,000 $291,075,000 $151,050,000 $415,388,000 $138,240,000 $291,686,000 $72,870,000 $126,794,000
Real estate charge $191,350,000 $807,497,000 $453,150,000 $1,246,163,000 $399,360,000 $842,650,000 $288,582,000 $502,133,000
Total Ownership Costs $260,325,000 $1,098,572,000 $604,200,000 $1,661,550,000 $537,600,000 $1,134,336,000 $361,452,000 $628,926,000
Estimated Total Costs $525,100,000 $2,215,922,000 $1,131,906,000 $3,112,742,000 $1,026,560,000 $2,166,042,000 $823,704,000 $1,433,245,000

26
1995
1995- Adjusted 2000
2000- Adjusted 2005
2005- Adjusted
2007 2007-
Adjusted
Estimated Operating Costs
Seed $58,926,000 $87,800,000 $103,000,000 $135,960,000 $151,470,000 $175,705,200 $159,800,000 $174,182,000 Fertilizer and soil amendments $23,552,000 $35,092,000 $39,912,500 $52,684,500 $141,322,500 $163,934,100 $131,600,000 $143,444,000
Crop protection chemicals $137,770,000 $205,277,000 $128,750,000 $169,950,000 $50,935,500 $59,085,180 $28,529,000 $31,096,610 Crop supplies, storage, marketing - - - - - - $4,700,000 $5,123,000
Crop insurance and consulting $9,154,000 $13,639,000 - - - - $24,769,000 $26,998,210
Custom hire and rental - - $23,175,000 $30,591,000 $33,412,500 $38,758,500 - - Machinery fuel, drying and irrigation energy $19,044,000 $28,376,000 $103,000,000 $135,960,000 $91,723,500 $106,399,260 $46,906,000 $51,127,540 Machinery repairs and maintenance $105,754,000 $151,573,000 - - - - $48,269,000 $52,613,210
Operator and hired labor $92,552,000 $137,902,000 $121,025,000 $159,753,000 $101,178,000 $117,366,480 $45,637,000 $49,744,330 Operating interest @ 7% x 1/2 year $42,136,000 $62,783,000 $26,368,000 $34,805,760 $19,404,000 $22,508,640 $21,432,000 $23,360,880
Miscellaneous* $38,134,000 $56,820,000 $66,950,000 $88,374,000 $76,032,000 $88,197,120 - -
Total Operating Costs $527,022,000 $785,263,000 $612,180,500 $808,078,260 $665,478,000 $771,954,480 $511,642,000 $557,689,780
Estimated Ownership Costs
Farm business overhead - - - - - - $19,176,000 $20,901,840
Machinery overhead - - - - - - $78,114,000 $85,144,260
Machinery depreciation $99,774,000 $148,663,000 $144,200,000 $190,344,000 $155,232,000 $180,069,120 $98,465,000 $107,326,850
Real estate charge $353,878,000 $527,278,000 $427,450,000 $564,234,000 $444,312,000 $515,401,920 $437,100,000 $476,439,000
Total Ownership Costs $453,652,000 $675,941,000 $571,650,000 $754,578,000 $599,544,000 $695,471,040 $632,855,000 $689,811,950
Estimated Total Costs $980,674,000 $1,461,204,000 $1,183,830,500 $1,562,656,260 $1,265,022,000 $1,467,425,520 $1,144,497,000 $1,247,501,730

27
2008
2008- Adjusted 2009
2009- Adjusted 2010
2010-Adjusted 2011
Estimated Operating Costs
Seed $188,604,000 $198,034,200 $230,424,500 $244,249,970 $245,140,000 $252,494,200 $266,804,500
Fertilizer and soil amendments
$196,560,000 $206,338,000 $509,320,000 $539,879,000 $245,655,000 $253,024,650 $283,015,000
Crop protection chemicals $31,564,000 $33,142,200 $69,015,000 $73,155,900 $43,260,000 $44,557,800 $34,240,000
Crop supplies, storage, marketing
$5,200,000 $5,460,000 $5,350,000 $5,671,000 $5,150,000 $5,304,500 $5,350,000
Crop insurance and consulting
$48,620,000 $51,051,000 $96,300,000 $102,078,000 $82,400,000 $84,872,000 $96,300,000
Custom hire and rental - - - - - - -
Machinery fuel, drying and irrigation energy
$66,924,000 $70,270,200 $73,348,500 $77,749,410 $59,740,000 $61,532,200 $57,191,500
Machinery repairs and maintenance
$58,500,000 $61,425,000 $58,636,000 $62,154,160 $60,718,500 $62,540,055 $56,763,500
Operator and hired labor $55,016,000 $57,766,700 $58,957,000 $62,494,420 $58,298,000 $60,046,940 $56,175,000
Operating interest @ 7% x 1/2 year
$26,052,000 $27,354,600 $46,812,500 $49,621,250 $28,016,000 $28,856,480 $27,820,000
Miscellaneous* - - - - - - -
Total Operating Costs $677,040,000 $710,892,000 $1,148,163,500 $1,217,053,310 $828,377,500 $853,228,825 $883,659,500
Estimated Ownership Costs
Farm business overhead $21,840,000 $22,932,000 $23,112,000 $24,498,720 $22,248,000 $22,915,440 $24,075,000
Machinery overhead $90,896,000 $95,440,800 $99,991,500 $105,990,990 $98,262,000 $101,209,860 $92,608,500
Machinery depreciation $114,868,000 $120,611,400 $131,877,500 $139,790,150 $123,497,000 $127,201,910 $112,617,500
Real estate charge $559,000,000 $586,950,000 $650,025,000 $689,026,500 $579,890,000 $597,286,700 $714,225,000
Total Ownership Costs $786,604,000 $825,934,200 $905,006,000 $959,306,360 $823,897,000 $848,613,910 $943,526,000
Estimated Total Costs
$1,463,644,000 $1,536,826,200 $2,053,169,500 $2,176,359,670 $1,652,274,500 $1,701,842,735 $1,827,185,500
Source: USDA – National Agricultural Statistics Service

28
Exhibit 1.5.7 – Missouri Farmland Prices and Appreciation, 1918 to 2011
Look-Back Period
Time Period Starting Value Land
Price: $/Acre Ending Value Land
Price: $/Acre Compound Annual
% Appreciation
13 years 1998 to 2011 $1,130 $2,530 6.95%
23 years 1988 to 2011 $684 $2,530 6.13%
33 years 1978 to 2011 $628 $2,530 4.45%
43 years 1968 to 2011 $217 $2,530 6.02%
53 years 1958 to 2011 $110 $2,530 6.22%
63 years 1948 to 2011 $64 $2,530 6.11%
73 years 1938 to 2011 $31 $2,530 6.30%
83 years 1928 to 2011 $54 $2,530 4.80%
93 years 1918 to 2011 $72 $2,530 3.94%
Source: USDA National Agricultural Statistics Service Exhibit 1.5.8 – Missouri Cropland Cash Rents, Per Acre, 1997 to 2011
Source: USDA National Agricultural Statistics Service
$50
$60
$70
$80
$90
$100
$110
19
97
19
98
19
99
20
00
20
01
20
02
20
03
20
04
20
05
20
06
20
07
20
08
20
09
20
10
20
11
Per
Acr
e C
ash
Ren
t
29
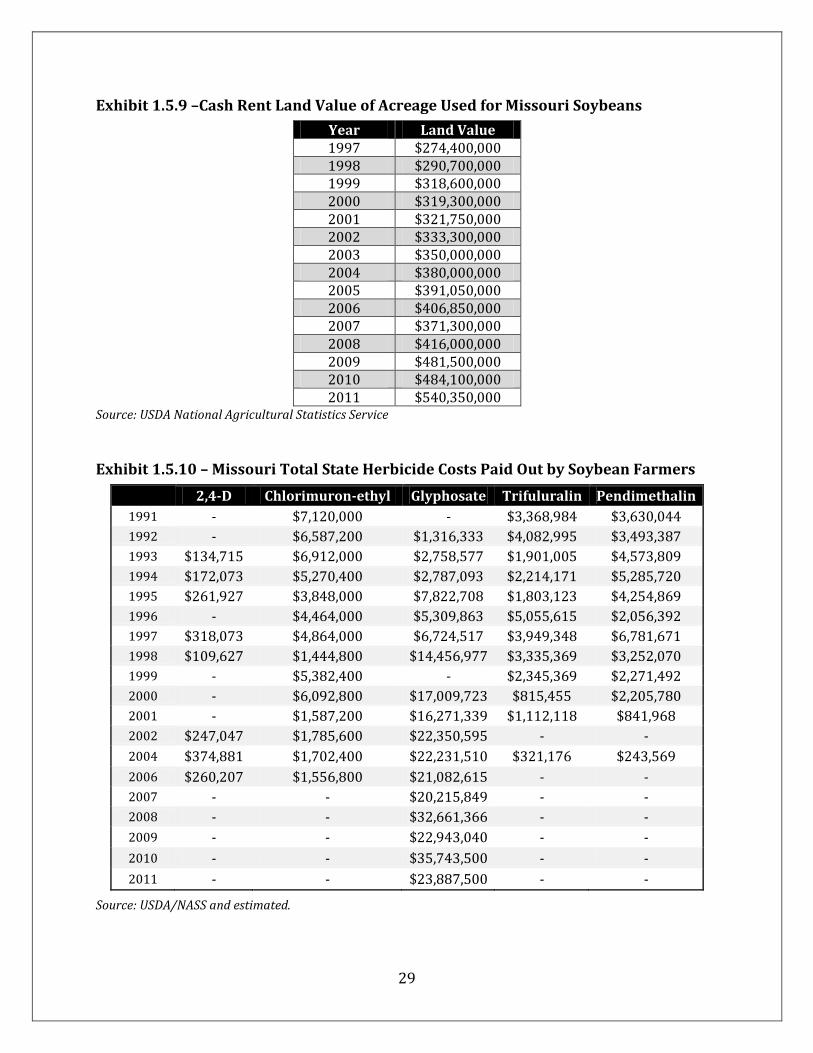
Exhibit 1.5.9 –Cash Rent Land Value of Acreage Used for Missouri Soybeans
Year Land Value 1997 $274,400,000 1998 $290,700,000 1999 $318,600,000 2000 $319,300,000 2001 $321,750,000 2002 $333,300,000 2003 $350,000,000 2004 $380,000,000 2005 $391,050,000 2006 $406,850,000 2007 $371,300,000 2008 $416,000,000 2009 $481,500,000 2010 $484,100,000 2011 $540,350,000
Source: USDA National Agricultural Statistics Service
Exhibit 1.5.10 – Missouri Total State Herbicide Costs Paid Out by Soybean Farmers
2,4-D Chlorimuron-ethyl Glyphosate Trifuluralin Pendimethalin
1991 - $7,120,000 - $3,368,984 $3,630,044
1992 - $6,587,200 $1,316,333 $4,082,995 $3,493,387
1993 $134,715 $6,912,000 $2,758,577 $1,901,005 $4,573,809
1994 $172,073 $5,270,400 $2,787,093 $2,214,171 $5,285,720
1995 $261,927 $3,848,000 $7,822,708 $1,803,123 $4,254,869
1996 - $4,464,000 $5,309,863 $5,055,615 $2,056,392
1997 $318,073 $4,864,000 $6,724,517 $3,949,348 $6,781,671
1998 $109,627 $1,444,800 $14,456,977 $3,335,369 $3,252,070
1999 - $5,382,400 - $2,345,369 $2,271,492
2000 - $6,092,800 $17,009,723 $815,455 $2,205,780
2001 - $1,587,200 $16,271,339 $1,112,118 $841,968
2002 $247,047 $1,785,600 $22,350,595 - -
2004 $374,881 $1,702,400 $22,231,510 $321,176 $243,569
2006 $260,207 $1,556,800 $21,082,615 - -
2007 - - $20,215,849 - -
2008 - - $32,661,366 - -
2009 - - $22,943,040 - -
2010 - - $35,743,500 - -
2011 - - $23,887,500 - -
Source: USDA/NASS and estimated.
30
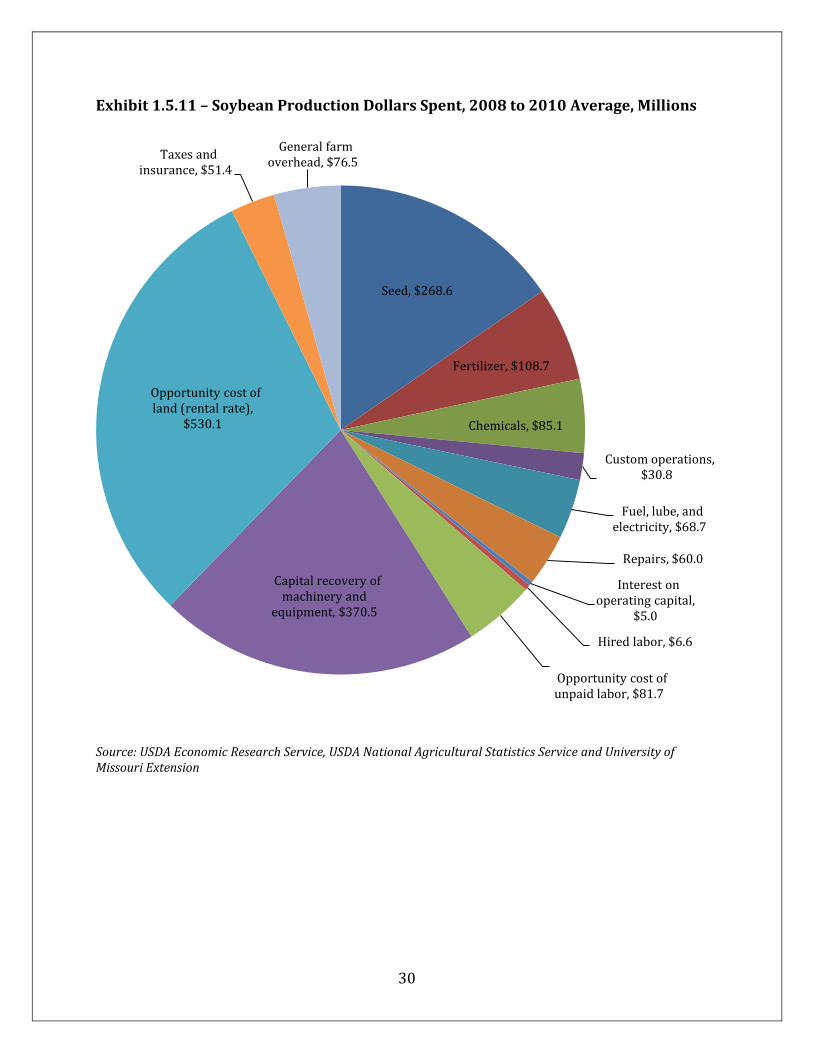
Exhibit 1.5.11 – Soybean Production Dollars Spent, 2008 to 2010 Average, Millions
Source: USDA Economic Research Service, USDA National Agricultural Statistics Service and University of Missouri Extension
Seed, $268.6
Fertilizer, $108.7
Chemicals, $85.1
Custom operations, $30.8
Fuel, lube, and electricity, $68.7
Repairs, $60.0
Interest on operating capital,
$5.0
Hired labor, $6.6
Opportunity cost of unpaid labor, $81.7
Capital recovery of machinery and
equipment, $370.5
Opportunity cost of land (rental rate),
$530.1
Taxes and insurance, $51.4
General farm overhead, $76.5
31
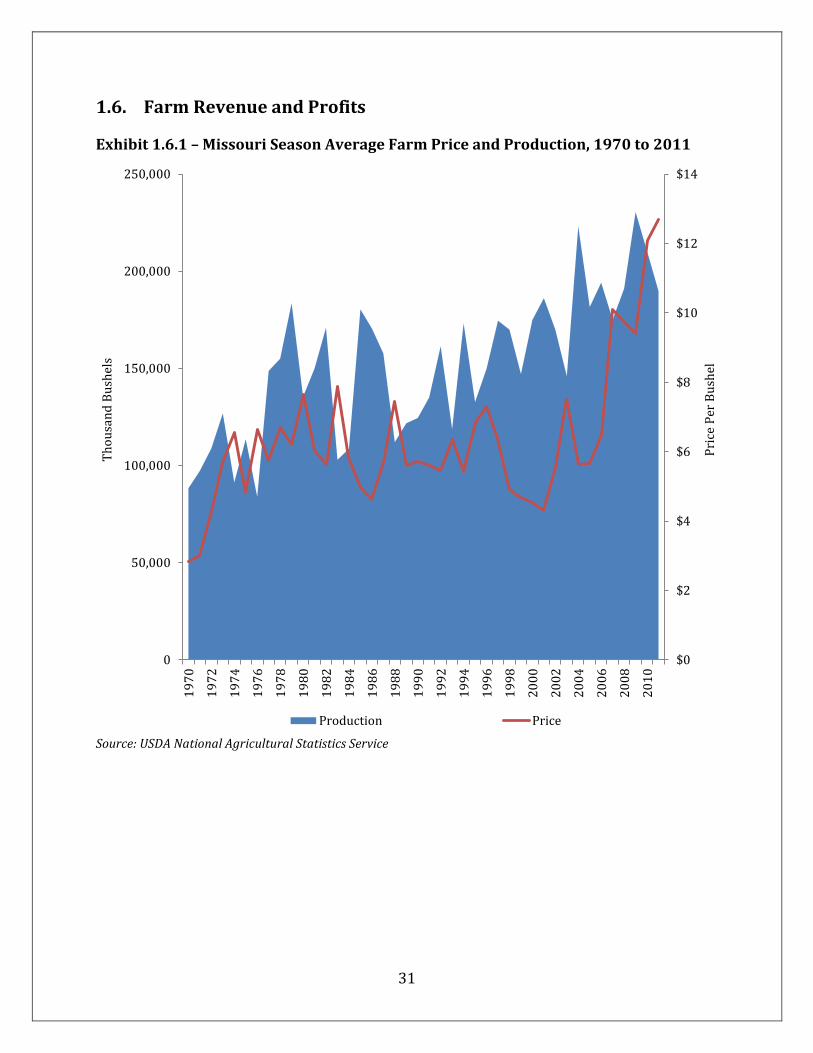
1.6. Farm Revenue and Profits Exhibit 1.6.1 – Missouri Season Average Farm Price and Production, 1970 to 2011
Source: USDA National Agricultural Statistics Service
$0
$2
$4
$6
$8
$10
$12
$14
0
50,000
100,000
150,000
200,000
250,0001
97
0
19
72
19
74
19
76
19
78
19
80
19
82
19
84
19
86
19
88
19
90
19
92
19
94
19
96
19
98
20
00
20
02
20
04
20
06
20
08
20
10
Pri
ce P
er B
ush
el
Th
ou
san
d B
ush
els
Production Price
32
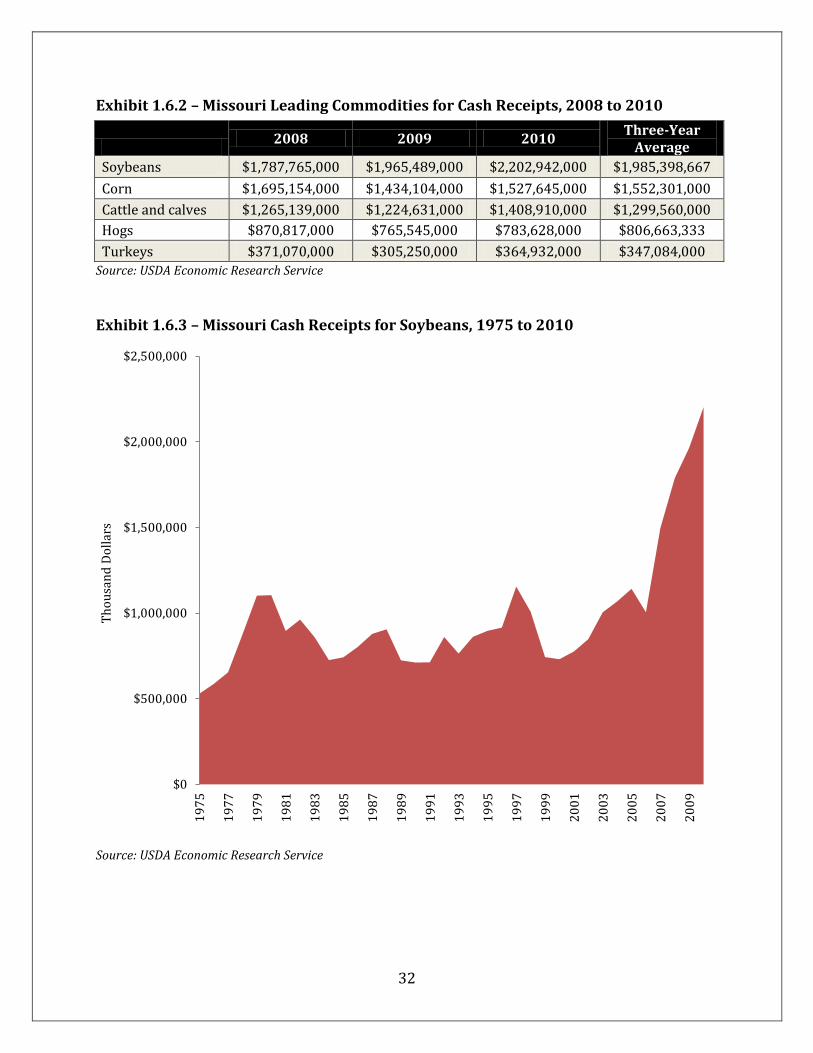
Exhibit 1.6.2 – Missouri Leading Commodities for Cash Receipts, 2008 to 2010
2008 2009 2010
Three-Year Average
Soybeans $1,787,765,000 $1,965,489,000 $2,202,942,000 $1,985,398,667
Corn $1,695,154,000 $1,434,104,000 $1,527,645,000 $1,552,301,000
Cattle and calves $1,265,139,000 $1,224,631,000 $1,408,910,000 $1,299,560,000
Hogs $870,817,000 $765,545,000 $783,628,000 $806,663,333
Turkeys $371,070,000 $305,250,000 $364,932,000 $347,084,000
Source: USDA Economic Research Service
Exhibit 1.6.3 – Missouri Cash Receipts for Soybeans, 1975 to 2010
Source: USDA Economic Research Service
$0
$500,000
$1,000,000
$1,500,000
$2,000,000
$2,500,000
19
75
19
77
19
79
19
81
19
83
19
85
19
87
19
89
19
91
19
93
19
95
19
97
19
99
20
01
20
03
20
05
20
07
20
09
Th
ou
san
d D
oll
ars

33
Exhibit 1.6.4 – Top Crops’ Share of Missouri Total Farm Receipts, 2008 to 2010
2008 2009 2010
Three-Year Average
Soybeans 21.5% 25.7% 26.5% 24.6%
Corn 20.4% 18.8% 18.4% 19.2%
Cattle and calves 15.2% 16.0% 17.0% 16.1%
Hogs 10.5% 10.0% 9.4% 10.0%
Turkeys 4.5% 4.0% 4.4% 4.3%
Source: USDA Economic Research Service
Exhibit 1.6.5 – Missouri Top Crops’ Share of U.S. Total Cash Receipts, Per Crop, 2008 to 2010
2008 2009 2010
Three-Year Average
Soybeans 6.8% 5.8% 6.6% 6.4%
Corn 3.5% 3.4% 3.4% 3.4%
Cattle and calves 2.6% 2.8% 2.7% 2.7%
Hogs 5.4% 5.2% 4.4% 5.0%
Turkeys 8.3% 8.5% 8.3% 8.4% Source: USDA Economic Research Service

34
Chapter 2: Beyond the Farm
2.1 Storage Exhibit 2.1.1 – Missouri Soybean Stocks on Dec. 1, 1949, to Dec. 1, 2011
Source: USDA National Agricultural Statistics Service
0
20,000
40,000
60,000
80,000
100,000
120,000
140,000
160,000
180,000
19
49
19
51
19
53
19
55
19
57
19
59
19
61
19
63
19
65
19
67
19
69
19
71
19
73
19
75
19
77
19
79
19
81
19
83
19
85
19
87
19
89
19
91
19
93
19
95
19
97
19
99
20
01
20
03
20
05
20
07
20
09
20
11
Th
ou
san
d B
ush
els
On-farm stocks Off-farm stocks

35
Exhibit 2.1.2 – Percent of Missouri Soybean Crop Relative to Given Categories of Storage Capacity
Source: USDA National Agricultural Statistics Service
0%
20%
40%
60%
80%
100%
120%1
98
8
19
89
19
90
19
91
19
92
19
93
19
94
19
95
19
96
19
97
19
98
19
99
20
00
20
01
20
02
20
03
20
04
20
05
20
06
20
07
20
08
20
09
20
10
20
11
Total On-farm Off-farm
36
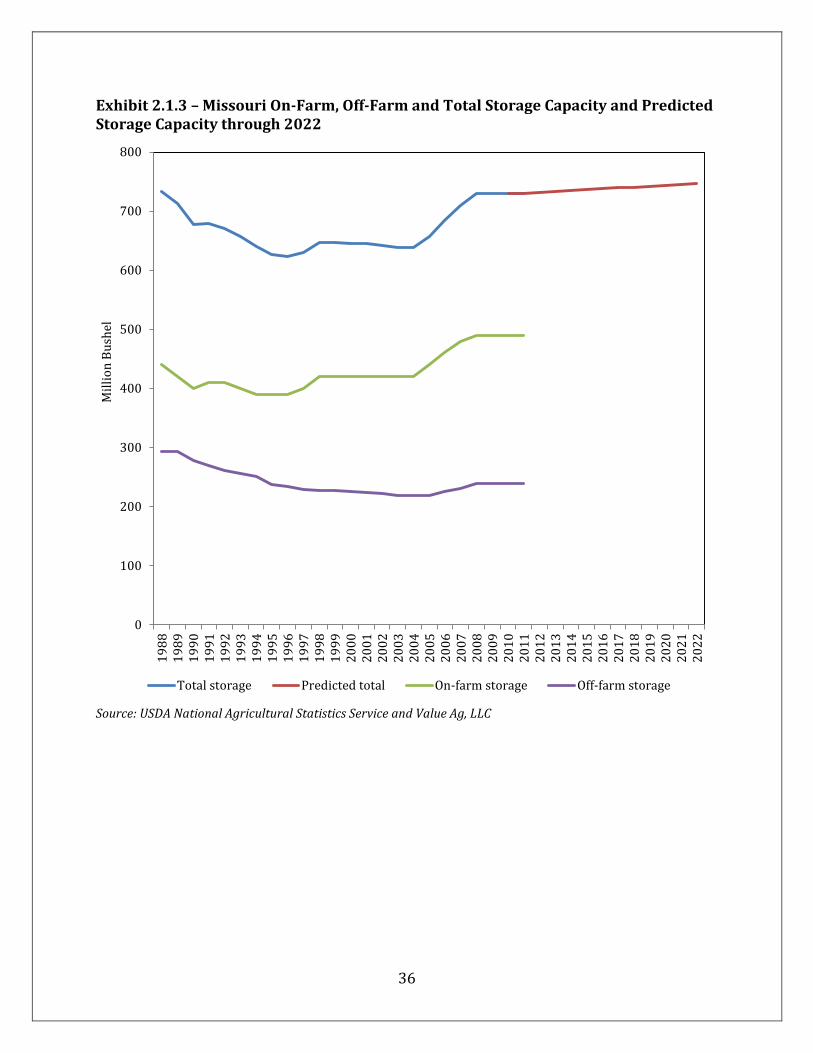
Exhibit 2.1.3 – Missouri On-Farm, Off-Farm and Total Storage Capacity and Predicted Storage Capacity through 2022
Source: USDA National Agricultural Statistics Service and Value Ag, LLC
0
100
200
300
400
500
600
700
8001
98
81
98
91
99
01
99
11
99
21
99
31
99
41
99
51
99
61
99
71
99
81
99
92
00
02
00
12
00
22
00
32
00
42
00
52
00
62
00
72
00
82
00
92
01
02
01
12
01
22
01
32
01
42
01
52
01
62
01
72
01
82
01
92
02
02
02
12
02
2
Mil
lio
n B
ush
el
Total storage Predicted total On-farm storage Off-farm storage

37
2.2 Commercial Storage Exhibit 2.2.1 – Locations of Missouri Grain Elevators
Source: MDA Grain Dealer Database
38
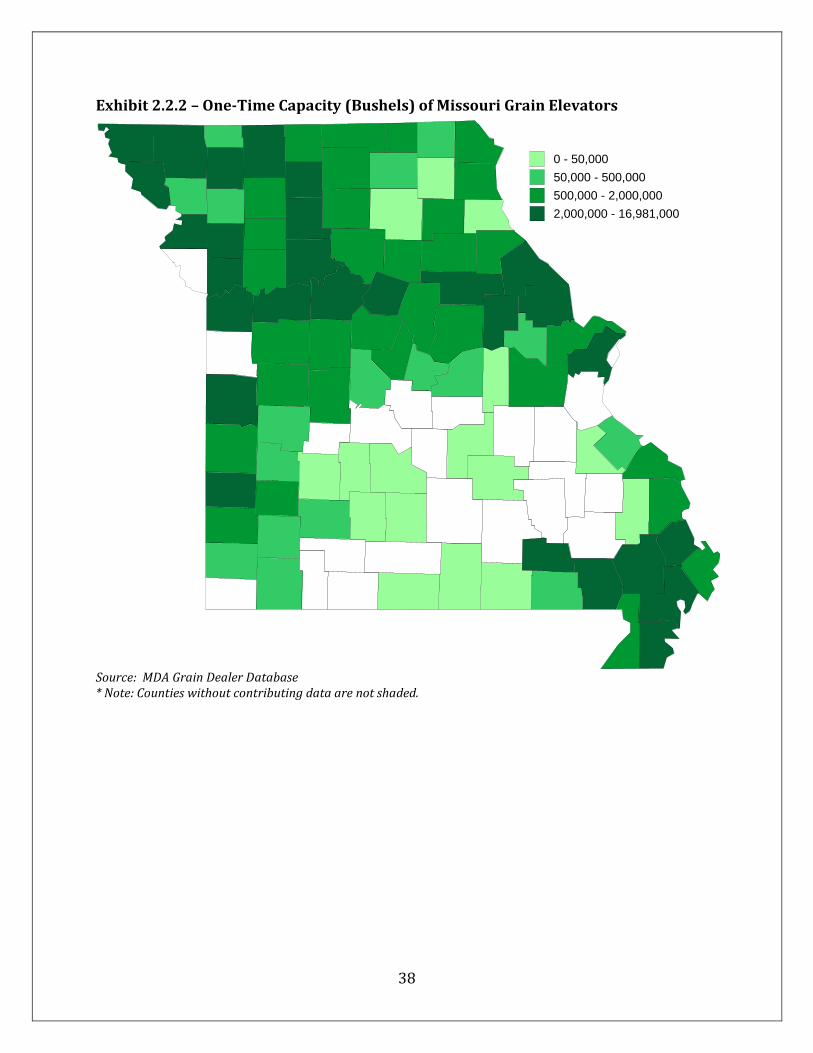
Exhibit 2.2.2 – One-Time Capacity (Bushels) of Missouri Grain Elevators
Source: MDA Grain Dealer Database * Note: Counties without contributing data are not shaded.
0 - 50,000
50,000 - 500,000
500,000 - 2,000,000
2,000,000 - 16,981,000

39
2.3 Transportation Exhibit 2.3.1 – Assumed Share of Soybean Shipments from Farms by Vehicle Size
Wagon- less than 500 bu.
Wagon- 500 bu. or more
Single Axle Truck
Tandem Axle Truck Semi
Average 9% 16% 4% 7% 65% Source: Iowa Transportation Study
Exhibit 2.3.2 – Modes of Missouri Commodity Transportation from Elevators, Shipment Value, Millions of Dollars
2002 Percent of Total
2007 Percent of Total
All Commodities $185,392 100.0% $225,954 100%
Truck, single mode $134,904 72.8% $162,243 71.8%
For-hire truck, single mode $77,930 42.0% $94,645 41.9%
Private truck, single mode $56,727 30.6% $67,598 29.9%
Rail, single mode $19,652 10.6% $7,221 3.2%
Shallow draft, single mode $1,043 0.6% $2,966 1.3%
Cereal Grains $2,150 100.0% $4,085 100.0%
Truck total $980 45.0% S S
For-hire truck $885 41.0% $73 1.8%
Rail $756 35.0% $1,098 26.0%
Water $370 17.0% $1,608 39.4%
Shallow draft $370 17.0% $11,634 39.3%
Animal Feed and Products of Animal Origin
$1,839 100.0% $2,297 100.0%
Truck total $1,675 91.0% $2,255 98.1%
For-hire truck $736 40.0% $1,508 65.6%
Private truck $747 32.5%
Rail $129 7.0% $29 1.3%
Other Prepared Foodstuffs and Fats and Oil
$8,545 100.0% $10,087 100.0%
Truck total $7,801 91.0% $9,301 92.2%
For-hire truck $4,211 49.0% $5,855 58.0%
Private truck $3,590 42.0% $3,446 34.2%
Rail $472 5.0% $552 5.5% Source: Department of Transportation Commodity Flow Survey
40
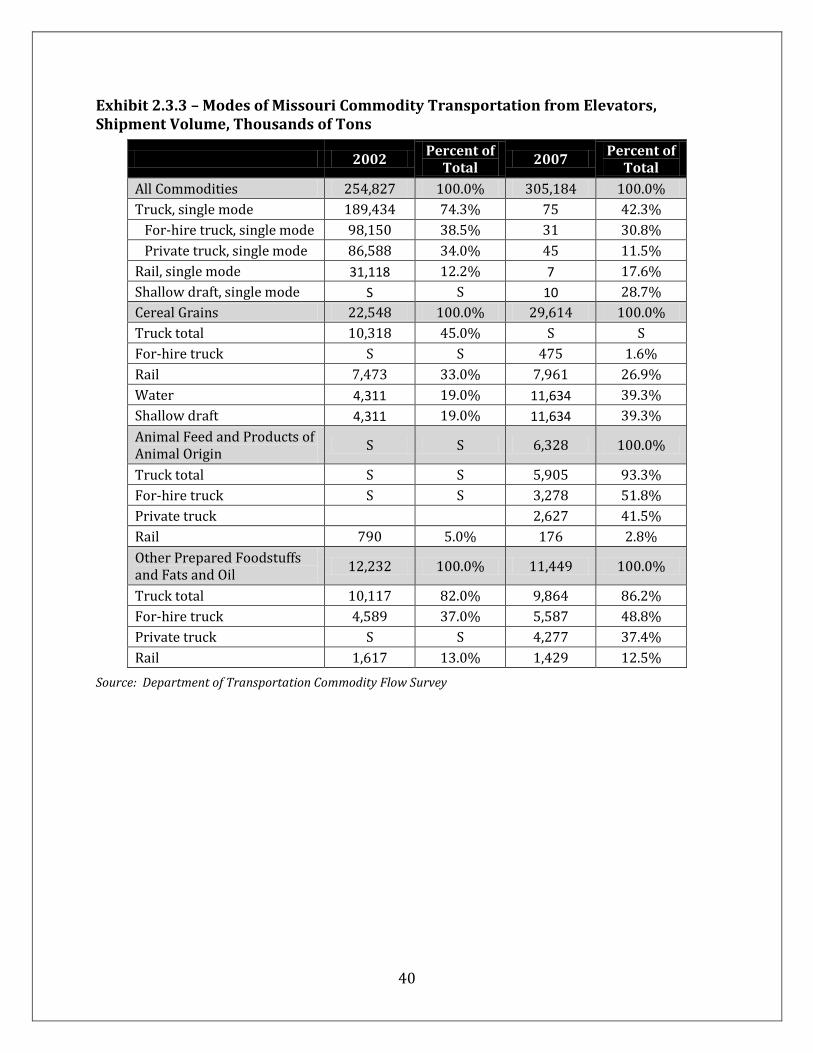
Exhibit 2.3.3 – Modes of Missouri Commodity Transportation from Elevators, Shipment Volume, Thousands of Tons
2002 Percent of
Total 2007
Percent of Total
All Commodities 254,827 100.0% 305,184 100.0%
Truck, single mode 189,434 74.3% 75 42.3%
For-hire truck, single mode 98,150 38.5% 31 30.8%
Private truck, single mode 86,588 34.0% 45 11.5%
Rail, single mode 31,118 12.2% 7 17.6%
Shallow draft, single mode S S 10 28.7%
Cereal Grains 22,548 100.0% 29,614 100.0%
Truck total 10,318 45.0% S S
For-hire truck S S 475 1.6%
Rail 7,473 33.0% 7,961 26.9%
Water 4,311 19.0% 11,634 39.3%
Shallow draft 4,311 19.0% 11,634 39.3%
Animal Feed and Products of Animal Origin
S S 6,328 100.0%
Truck total S S 5,905 93.3%
For-hire truck S S 3,278 51.8%
Private truck 2,627 41.5%
Rail 790 5.0% 176 2.8%
Other Prepared Foodstuffs and Fats and Oil
12,232 100.0% 11,449 100.0%
Truck total 10,117 82.0% 9,864 86.2%
For-hire truck 4,589 37.0% 5,587 48.8%
Private truck S S 4,277 37.4%
Rail 1,617 13.0% 1,429 12.5%
Source: Department of Transportation Commodity Flow Survey
41
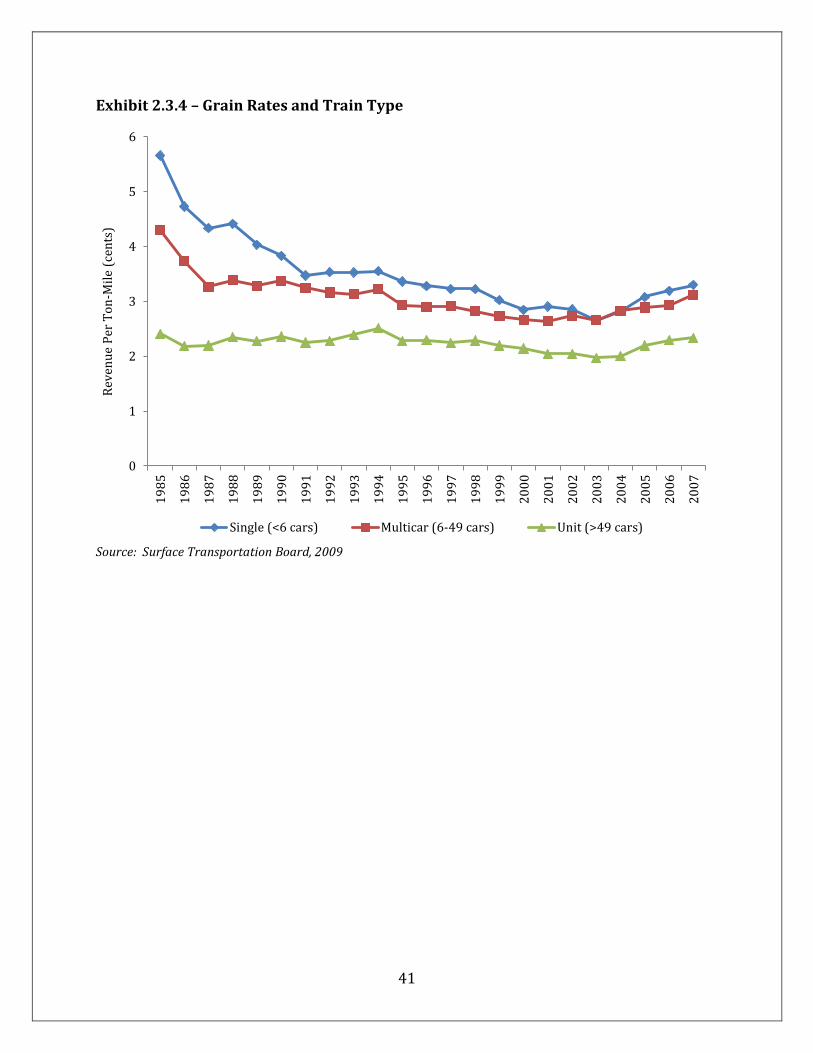
Exhibit 2.3.4 – Grain Rates and Train Type
Source: Surface Transportation Board, 2009
0
1
2
3
4
5
6
19
85
19
86
19
87
19
88
19
89
19
90
19
91
19
92
19
93
19
94
19
95
19
96
19
97
19
98
19
99
20
00
20
01
20
02
20
03
20
04
20
05
20
06
20
07
Rev
enu
e P
er T
on
-Mil
e (c
ents
)
Single (<6 cars) Multicar (6-49 cars) Unit (>49 cars)
42
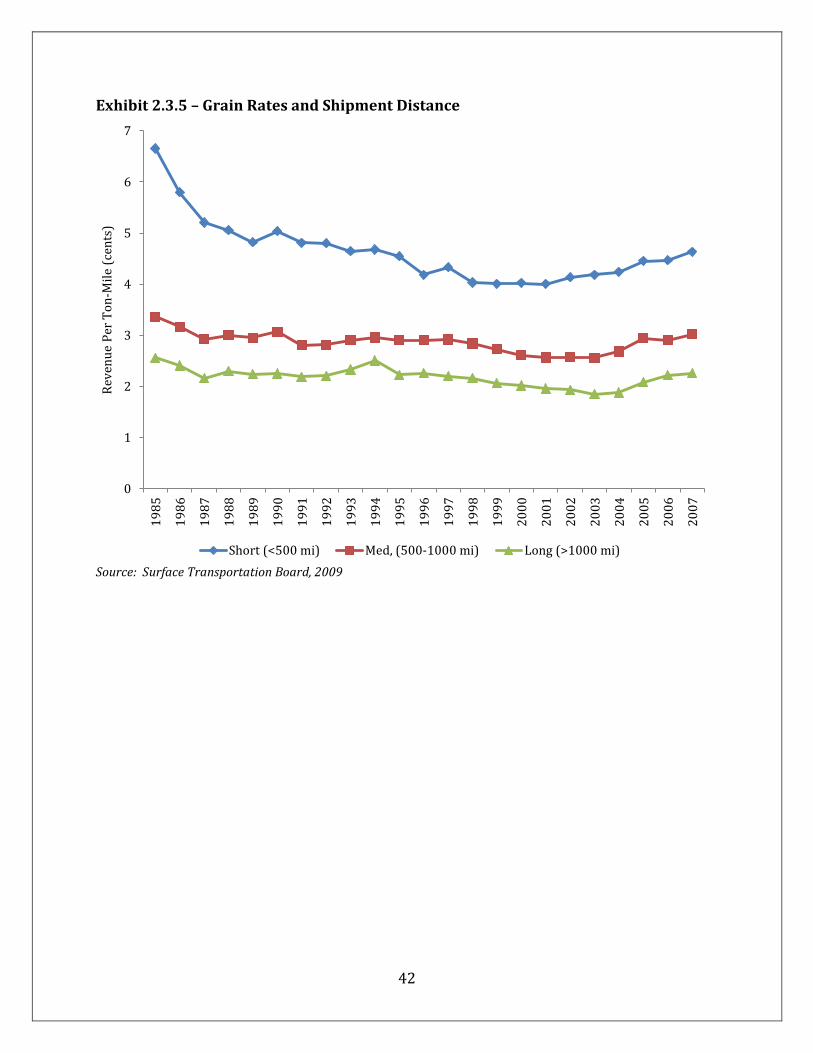
Exhibit 2.3.5 – Grain Rates and Shipment Distance
Source: Surface Transportation Board, 2009
0
1
2
3
4
5
6
7
19
85
19
86
19
87
19
88
19
89
19
90
19
91
19
92
19
93
19
94
19
95
19
96
19
97
19
98
19
99
20
00
20
01
20
02
20
03
20
04
20
05
20
06
20
07
Rev
enu
e P
er T
on
-Mil
e (c
ents
)
Short (<500 mi) Med, (500-1000 mi) Long (>1000 mi)

43
Exhibit 2.3.6 – Grain Rates and Car Ownership
0
0.5
1
1.5
2
2.5
3
3.5
4
19
85
19
86
19
87
19
88
19
89
19
90
19
91
19
92
19
93
19
94
19
95
19
96
19
97
19
98
19
99
20
00
20
01
20
02
20
03
20
04
20
05
20
06
20
07
Rev
enu
e P
er T
on
-Mil
e (c
ents
)
Privately Owned Railroad-Supplied
44
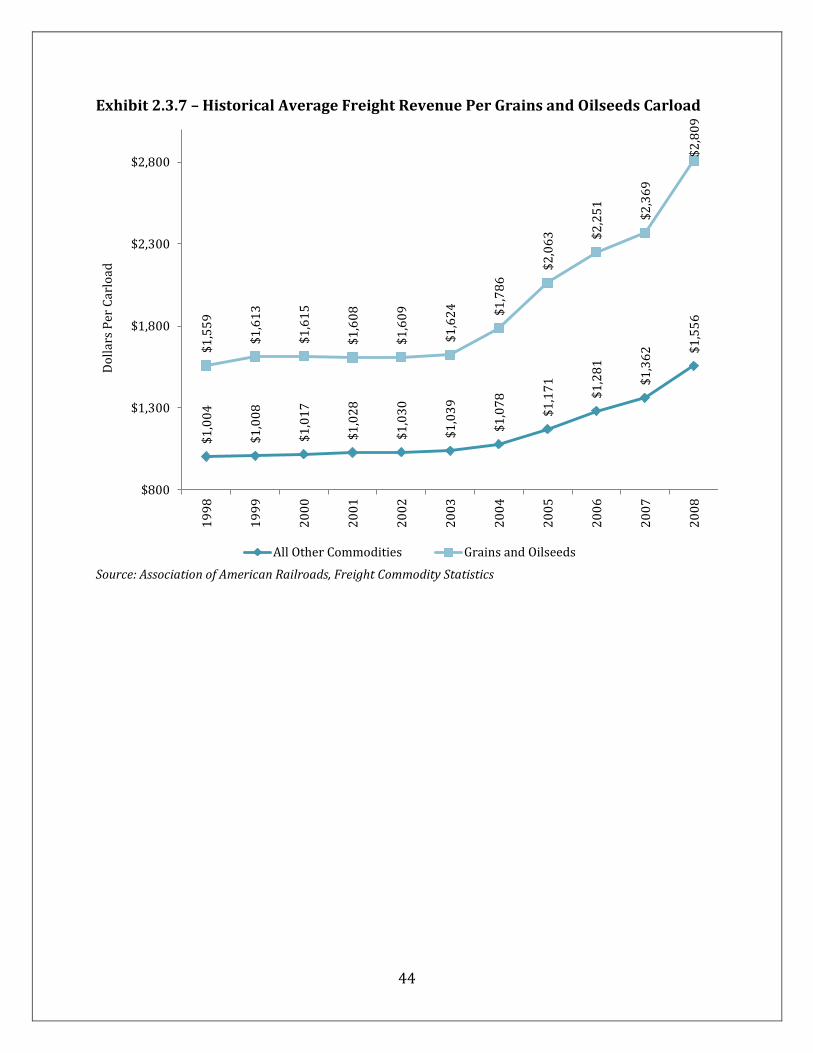
Exhibit 2.3.7 – Historical Average Freight Revenue Per Grains and Oilseeds Carload
Source: Association of American Railroads, Freight Commodity Statistics
$1
,00
4
$1
,00
8
$1
,01
7
$1
,02
8
$1
,03
0
$1
,03
9
$1
,07
8
$1
,17
1
$1
,28
1
$1
,36
2
$1
,55
6
$1
,55
9
$1
,61
3
$1
,61
5
$1
,60
8
$1
,60
9
$1
,62
4
$1
,78
6 $
2,0
63
$2
,25
1
$2
,36
9
$2
,80
9
$800
$1,300
$1,800
$2,300
$2,800
19
98
19
99
20
00
20
01
20
02
20
03
20
04
20
05
20
06
20
07
20
08
Do
llar
s P
er C
arlo
ad
All Other Commodities Grains and Oilseeds
45
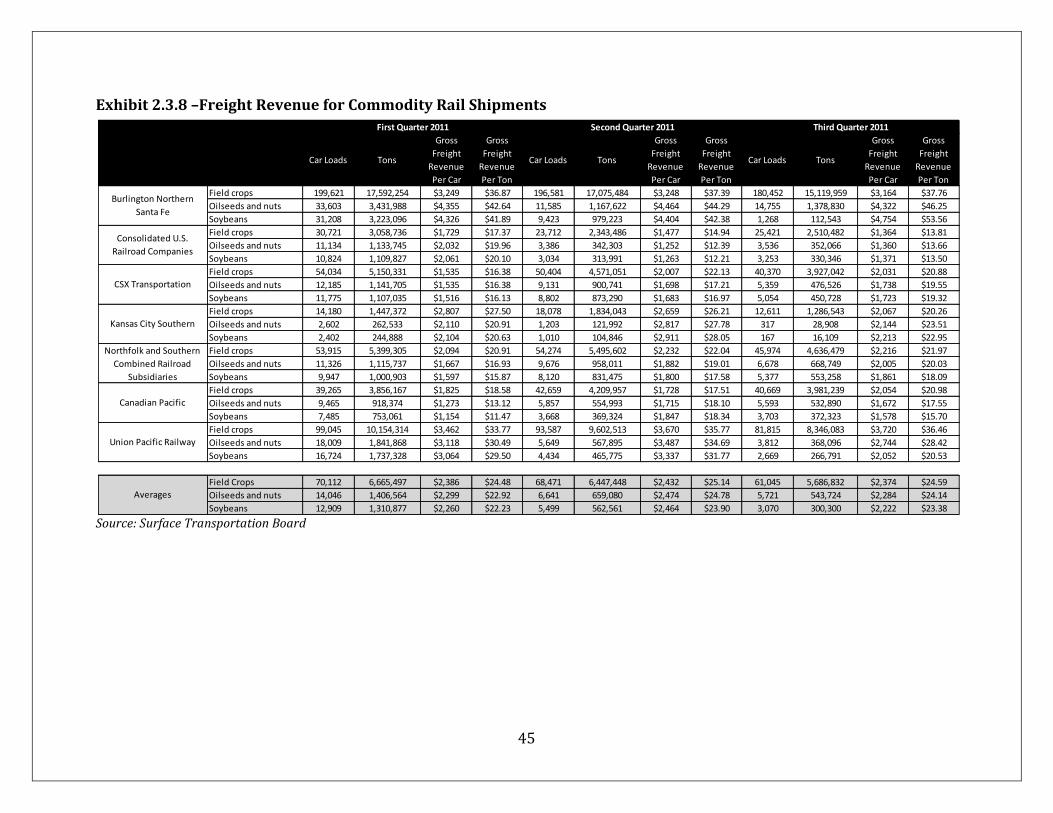
Exhibit 2.3.8 –Freight Revenue for Commodity Rail Shipments
Source: Surface Transportation Board
Car Loads Tons
Gross
Freight
Revenue
Per Car
Gross
Freight
Revenue
Per Ton
Car Loads Tons
Gross
Freight
Revenue
Per Car
Gross
Freight
Revenue
Per Ton
Car Loads Tons
Gross
Freight
Revenue
Per Car
Gross
Freight
Revenue
Per Ton
Field crops 199,621 17,592,254 $3,249 $36.87 196,581 17,075,484 $3,248 $37.39 180,452 15,119,959 $3,164 $37.76
Oilseeds and nuts 33,603 3,431,988 $4,355 $42.64 11,585 1,167,622 $4,464 $44.29 14,755 1,378,830 $4,322 $46.25
Soybeans 31,208 3,223,096 $4,326 $41.89 9,423 979,223 $4,404 $42.38 1,268 112,543 $4,754 $53.56
Field crops 30,721 3,058,736 $1,729 $17.37 23,712 2,343,486 $1,477 $14.94 25,421 2,510,482 $1,364 $13.81
Oilseeds and nuts 11,134 1,133,745 $2,032 $19.96 3,386 342,303 $1,252 $12.39 3,536 352,066 $1,360 $13.66
Soybeans 10,824 1,109,827 $2,061 $20.10 3,034 313,991 $1,263 $12.21 3,253 330,346 $1,371 $13.50
Field crops 54,034 5,150,331 $1,535 $16.38 50,404 4,571,051 $2,007 $22.13 40,370 3,927,042 $2,031 $20.88
Oilseeds and nuts 12,185 1,141,705 $1,535 $16.38 9,131 900,741 $1,698 $17.21 5,359 476,526 $1,738 $19.55
Soybeans 11,775 1,107,035 $1,516 $16.13 8,802 873,290 $1,683 $16.97 5,054 450,728 $1,723 $19.32
Field crops 14,180 1,447,372 $2,807 $27.50 18,078 1,834,043 $2,659 $26.21 12,611 1,286,543 $2,067 $20.26
Oilseeds and nuts 2,602 262,533 $2,110 $20.91 1,203 121,992 $2,817 $27.78 317 28,908 $2,144 $23.51
Soybeans 2,402 244,888 $2,104 $20.63 1,010 104,846 $2,911 $28.05 167 16,109 $2,213 $22.95
Field crops 53,915 5,399,305 $2,094 $20.91 54,274 5,495,602 $2,232 $22.04 45,974 4,636,479 $2,216 $21.97
Oilseeds and nuts 11,326 1,115,737 $1,667 $16.93 9,676 958,011 $1,882 $19.01 6,678 668,749 $2,005 $20.03
Soybeans 9,947 1,000,903 $1,597 $15.87 8,120 831,475 $1,800 $17.58 5,377 553,258 $1,861 $18.09
Field crops 39,265 3,856,167 $1,825 $18.58 42,659 4,209,957 $1,728 $17.51 40,669 3,981,239 $2,054 $20.98
Oilseeds and nuts 9,465 918,374 $1,273 $13.12 5,857 554,993 $1,715 $18.10 5,593 532,890 $1,672 $17.55
Soybeans 7,485 753,061 $1,154 $11.47 3,668 369,324 $1,847 $18.34 3,703 372,323 $1,578 $15.70
Field crops 99,045 10,154,314 $3,462 $33.77 93,587 9,602,513 $3,670 $35.77 81,815 8,346,083 $3,720 $36.46
Oilseeds and nuts 18,009 1,841,868 $3,118 $30.49 5,649 567,895 $3,487 $34.69 3,812 368,096 $2,744 $28.42
Soybeans 16,724 1,737,328 $3,064 $29.50 4,434 465,775 $3,337 $31.77 2,669 266,791 $2,052 $20.53
Field Crops 70,112 6,665,497 $2,386 $24.48 68,471 6,447,448 $2,432 $25.14 61,045 5,686,832 $2,374 $24.59
Oilseeds and nuts 14,046 1,406,564 $2,299 $22.92 6,641 659,080 $2,474 $24.78 5,721 543,724 $2,284 $24.14
Soybeans 12,909 1,310,877 $2,260 $22.23 5,499 562,561 $2,464 $23.90 3,070 300,300 $2,222 $23.38
Averages
Consolidated U.S.
Railroad Companies
CSX Transportation
Kansas City Southern
Northfolk and Southern
Combined Railroad
Subsidiaries
Canadian Pacific
Union Pacific Railway
Third Quarter 2011Second Quarter 2011First Quarter 2011
Burlington Northern
Santa Fe

Exhibit 2.3.9 – Railroad Fuel Surcharges
Source: USDA Agricultural Marketing Service Grain Transportation Datasets
$0.00
$0.10
$0.20
$0.30
$0.40
$0.50
$0.60
$0.70
$0.80
$0.90
$1.00
Jul-
00
Dec
-00
May
-01
Oct
-01
Mar
-02
Au
g-0
2
Jan
-03
Jun
-03
No
v-0
3
Ap
r-0
4
Sep
-04
Feb
-05
Jul-
05
Dec
-05
May
-06
Oct
-06
Mar
-07
Au
g-0
7
Jan
-08
Jun
-08
No
v-0
8
Ap
r-0
9
Sep
-09
Feb
-10
Jul-
10
Dec
-10
May
-11
Oct
-11
Fuel
Surc
har
ge
Per
Mil
e
Burlington Northern Santa Fe Union Pacific

47
Chapter 3: Soybean Processing and Use
3.1 Soybean Industry Exhibit 3.1.1 – Missouri and U.S. Soybean Processing Industry, 2007
Missouri U.S. MO as a % of U.S.
Establishments (#) 2 120 1.67%
Number of employees (#) 100 to 249 6,019 ~ 2.48%
Annual payroll ($) (D) $300,388,000 (D)
Value added ($) (D) $4,988,749,000 (D)
Total cost of materials ($) (D) $14,686,121,000 (D)
Total value of shipments ($) (D) $19,283,042,000 (D)
(D) = data withheld to avoid disclosing individual firm data Sources: U.S. Census Bureau, 2002 Economic Census; Minneapolis Fed; and Soybean Meal Information Center
48
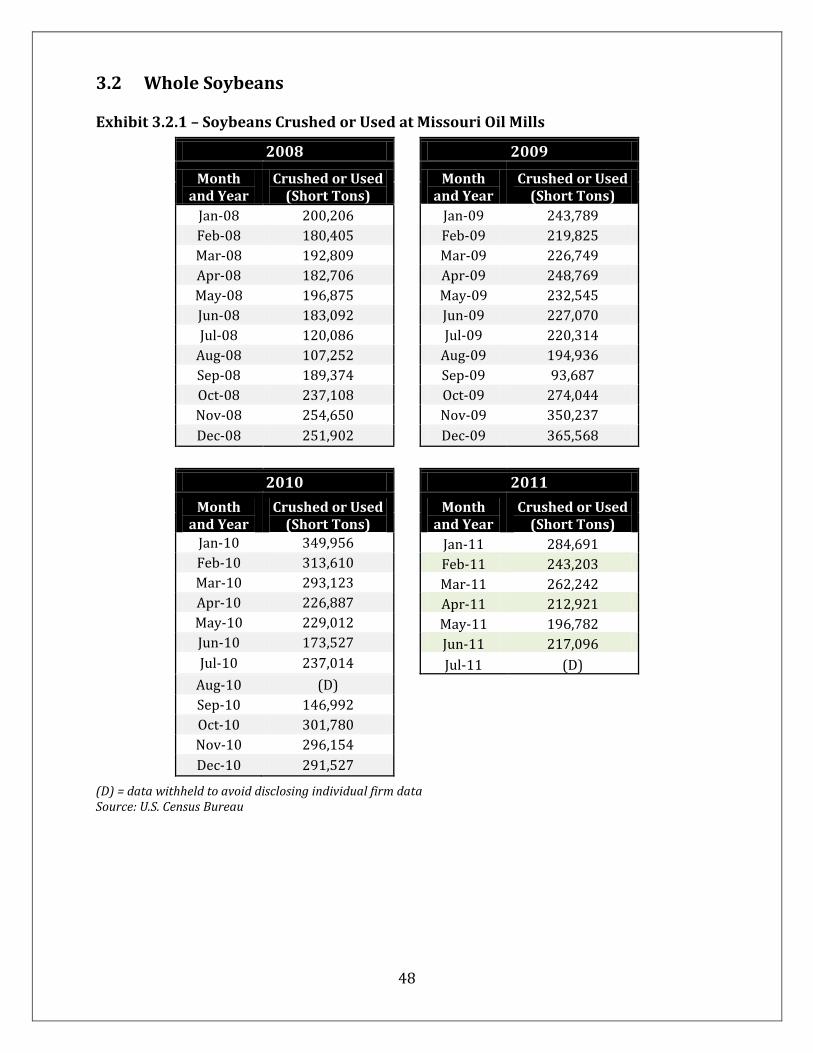
3.2 Whole Soybeans Exhibit 3.2.1 – Soybeans Crushed or Used at Missouri Oil Mills
2008
2009
Month and Year
Crushed or Used (Short Tons)
Month and Year
Crushed or Used (Short Tons)
Jan-08 200,206 Jan-09 243,789
Feb-08 180,405 Feb-09 219,825
Mar-08 192,809 Mar-09 226,749
Apr-08 182,706 Apr-09 248,769
May-08 196,875 May-09 232,545
Jun-08 183,092 Jun-09 227,070
Jul-08 120,086 Jul-09 220,314
Aug-08 107,252 Aug-09 194,936
Sep-08 189,374 Sep-09 93,687
Oct-08 237,108 Oct-09 274,044
Nov-08 254,650 Nov-09 350,237
Dec-08 251,902 Dec-09 365,568
2010 2011
Month and Year
Crushed or Used (Short Tons)
Month and Year
Crushed or Used (Short Tons)
Jan-10 349,956 Jan-11 284,691
Feb-10 313,610 Feb-11 243,203
Mar-10 293,123 Mar-11 262,242
Apr-10 226,887 Apr-11 212,921
May-10 229,012 May-11 196,782
Jun-10 173,527 Jun-11 217,096
Jul-10 237,014 Jul-11 (D)
Aug-10 (D)
Sep-10 146,992
Oct-10 301,780
Nov-10 296,154
Dec-10 291,527
(D) = data withheld to avoid disclosing individual firm data Source: U.S. Census Bureau
49
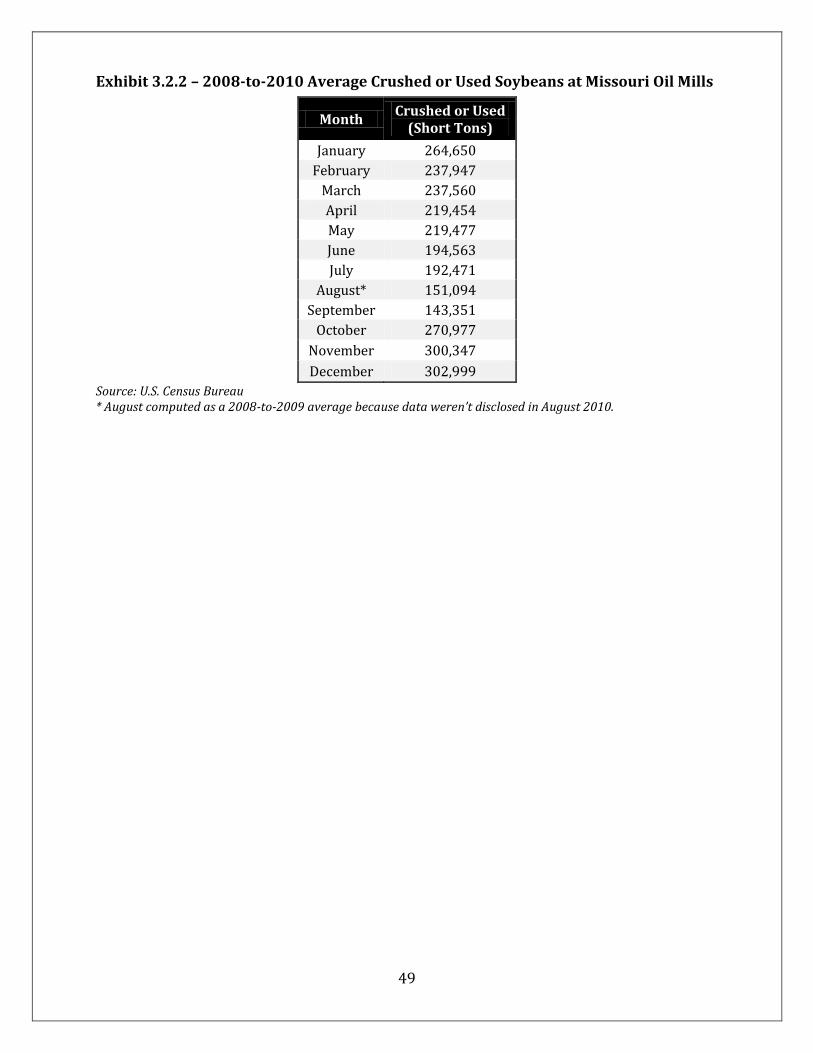
Exhibit 3.2.2 – 2008-to-2010 Average Crushed or Used Soybeans at Missouri Oil Mills
Month Crushed or Used
(Short Tons)
January 264,650
February 237,947
March 237,560
April 219,454
May 219,477
June 194,563
July 192,471
August* 151,094
September 143,351
October 270,977
November 300,347
December 302,999
Source: U.S. Census Bureau * August computed as a 2008-to-2009 average because data weren’t disclosed in August 2010.

50
Exhibit 3.2.3 –St. Louis USDA AMS Soybean Prices
Source: CashGrainBids.com
$0
$2
$4
$6
$8
$10
$12
8/2
7/1
99
8
1/2
7/1
99
9
6/2
7/1
99
9
11
/27
/19
99
4/2
7/2
00
0
9/2
7/2
00
0
2/2
7/2
00
1
7/2
7/2
00
1
12
/27
/20
01
5/2
7/2
00
2
10
/27
/20
02
3/2
7/2
00
3
8/2
7/2
00
3
1/2
7/2
00
4
6/2
7/2
00
4
11
/27
/20
04
4/2
7/2
00
5
9/2
7/2
00
5
2/2
7/2
00
6
7/2
7/2
00
6
12
/27
/20
06
5/2
7/2
00
7
10
/27
/20
07
3/2
7/2
00
8
8/2
7/2
00
8
1/2
7/2
00
9
6/2
7/2
00
9
11
/27
/20
09
4/2
7/2
01
0
Pri
ce P
er B
ush
el

51
Exhibit 3.2.4 –St. Louis CHS Soybean Prices
Source: CashGrainBids.com
$0
$2
$4
$6
$8
$10
$12
$14
$16
3/3
1/2
01
0
4/3
0/2
01
0
5/3
1/2
01
0
6/3
0/2
01
0
7/3
1/2
01
0
8/3
1/2
01
0
9/3
0/2
01
0
10
/31
/20
10
11
/30
/20
10
12
/31
/20
10
1/3
1/2
01
1
2/2
8/2
01
1
3/3
1/2
01
1
4/3
0/2
01
1
5/3
1/2
01
1
6/3
0/2
01
1
7/3
1/2
01
1
8/3
1/2
01
1
9/3
0/2
01
1
10
/31
/20
11
11
/30
/20
11
Pri
ce P
er B
ush
el

52
Exhibit 3.2.5 –St. Louis ADM Soybean Prices
Source: CashGrainBids.com
$0
$2
$4
$6
$8
$10
$12
$14
$16
$18
1/3
/20
03
5/3
/20
03
9/3
/20
03
1/3
/20
04
5/3
/20
04
9/3
/20
04
1/3
/20
05
5/3
/20
05
9/3
/20
05
1/3
/20
06
5/3
/20
06
9/3
/20
06
1/3
/20
07
5/3
/20
07
9/3
/20
07
1/3
/20
08
5/3
/20
08
9/3
/20
08
1/3
/20
09
5/3
/20
09
9/3
/20
09
1/3
/20
10
5/3
/20
10
9/3
/20
10
1/3
/20
11
5/3
/20
11
9/3
/20
11
Pri
ce P
er B
ush
el
53
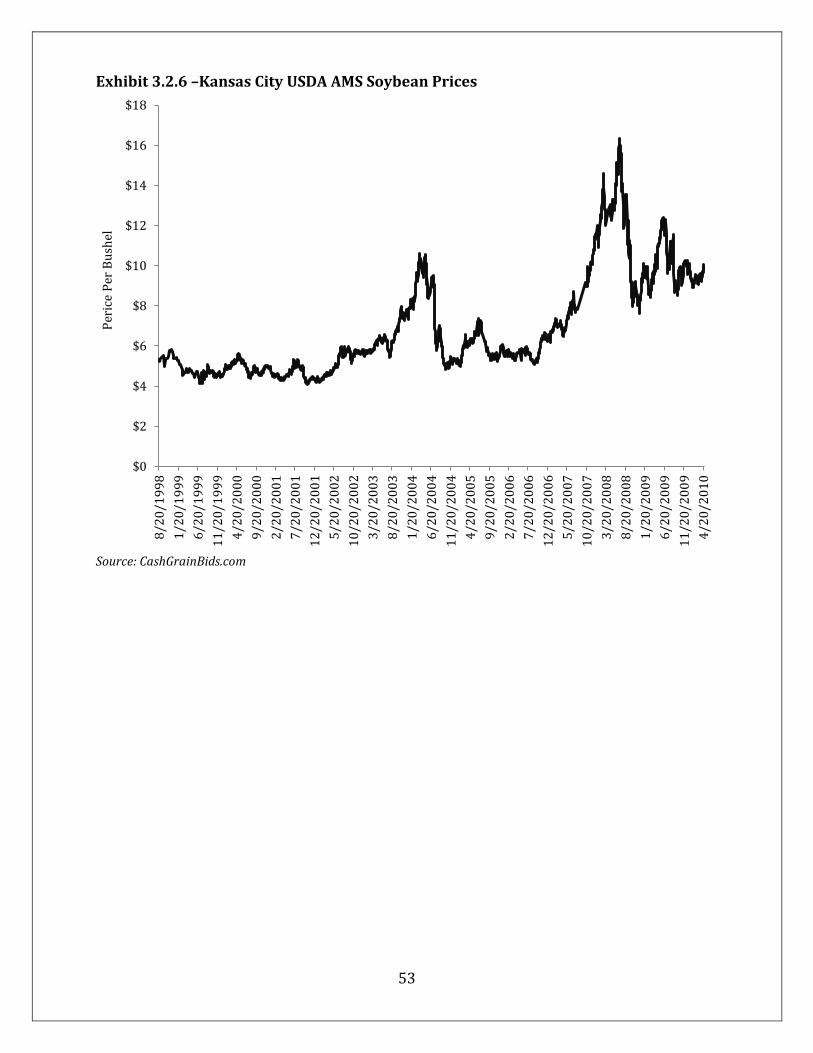
Exhibit 3.2.6 –Kansas City USDA AMS Soybean Prices
Source: CashGrainBids.com
$0
$2
$4
$6
$8
$10
$12
$14
$16
$18
8/2
0/1
99
8
1/2
0/1
99
9
6/2
0/1
99
9
11
/20
/19
99
4/2
0/2
00
0
9/2
0/2
00
0
2/2
0/2
00
1
7/2
0/2
00
1
12
/20
/20
01
5/2
0/2
00
2
10
/20
/20
02
3/2
0/2
00
3
8/2
0/2
00
3
1/2
0/2
00
4
6/2
0/2
00
4
11
/20
/20
04
4/2
0/2
00
5
9/2
0/2
00
5
2/2
0/2
00
6
7/2
0/2
00
6
12
/20
/20
06
5/2
0/2
00
7
10
/20
/20
07
3/2
0/2
00
8
8/2
0/2
00
8
1/2
0/2
00
9
6/2
0/2
00
9
11
/20
/20
09
4/2
0/2
01
0
Per
ice
Per
Bu
shel

54
Exhibit 3.2.7 –Kansas City Cargill, Chouteau Location, Soybean Prices
Source: CashGrainBids.com
$0
$2
$4
$6
$8
$10
$12
$14
$16
11
/2/2
00
9
12
/2/2
00
9
1/2
/20
10
2/2
/20
10
3/2
/20
10
4/2
/20
10
5/2
/20
10
6/2
/20
10
7/2
/20
10
8/2
/20
10
9/2
/20
10
10
/2/2
01
0
11
/2/2
01
0
12
/2/2
01
0
1/2
/20
11
2/2
/20
11
3/2
/20
11
4/2
/20
11
5/2
/20
11
6/2
/20
11
7/2
/20
11
8/2
/20
11
9/2
/20
11
10
/2/2
01
1
11
/2/2
01
1
12
/2/2
01
1
Pri
ce P
er B
ush
el
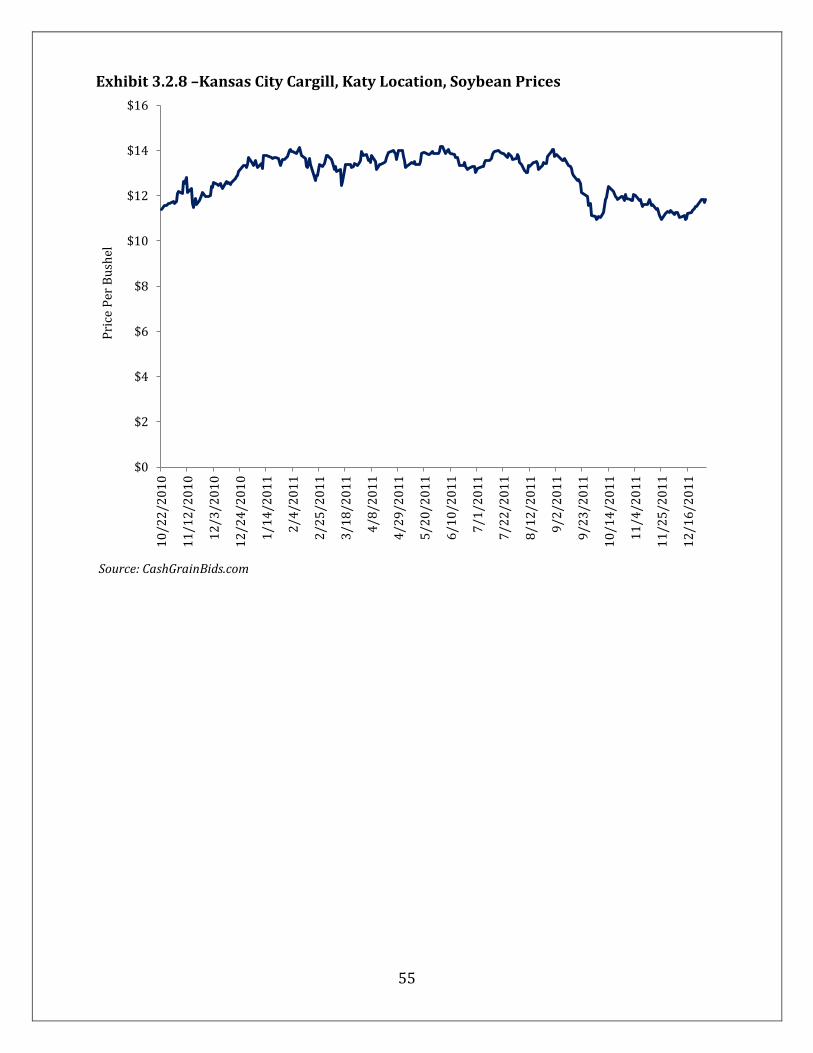
55
Exhibit 3.2.8 –Kansas City Cargill, Katy Location, Soybean Prices
Source: CashGrainBids.com
$0
$2
$4
$6
$8
$10
$12
$14
$16
10
/22
/20
10
11
/12
/20
10
12
/3/2
01
0
12
/24
/20
10
1/1
4/2
01
1
2/4
/20
11
2/2
5/2
01
1
3/1
8/2
01
1
4/8
/20
11
4/2
9/2
01
1
5/2
0/2
01
1
6/1
0/2
01
1
7/1
/20
11
7/2
2/2
01
1
8/1
2/2
01
1
9/2
/20
11
9/2
3/2
01
1
10
/14
/20
11
11
/4/2
01
1
11
/25
/20
11
12
/16
/20
11
Pri
ce P
er B
ush
el

56
Exhibit 3.2.9 –Kansas City Cargill, GOS Location, Soybean Prices
Source: CashGrainBids.com
$0
$2
$4
$6
$8
$10
$12
$14
$16
3/3
1/2
01
0
4/3
0/2
01
0
5/3
1/2
01
0
6/3
0/2
01
0
7/3
1/2
01
0
8/3
1/2
01
0
9/3
0/2
01
0
10
/31
/20
10
11
/30
/20
10
12
/31
/20
10
1/3
1/2
01
1
2/2
8/2
01
1
3/3
1/2
01
1
4/3
0/2
01
1
5/3
1/2
01
1
6/3
0/2
01
1
7/3
1/2
01
1
8/3
1/2
01
1
9/3
0/2
01
1
10
/31
/20
11
11
/30
/20
11
Pri
ce P
er B
ush
el

57
Exhibit 3.2.10 –Lamar MFA Soybean Prices
Source: CashGrainBids.com
$0
$2
$4
$6
$8
$10
$12
$14
$16
$18
8/2
0/1
99
8
2/2
0/1
99
9
8/2
0/1
99
9
2/2
0/2
00
0
8/2
0/2
00
0
2/2
0/2
00
1
8/2
0/2
00
1
2/2
0/2
00
2
8/2
0/2
00
2
2/2
0/2
00
3
8/2
0/2
00
3
2/2
0/2
00
4
8/2
0/2
00
4
2/2
0/2
00
5
8/2
0/2
00
5
2/2
0/2
00
6
8/2
0/2
00
6
2/2
0/2
00
7
8/2
0/2
00
7
2/2
0/2
00
8
8/2
0/2
00
8
2/2
0/2
00
9
8/2
0/2
00
9
2/2
0/2
01
0
8/2
0/2
01
0
2/2
0/2
01
1
8/2
0/2
01
1
Pri
ce P
er B
ush
el
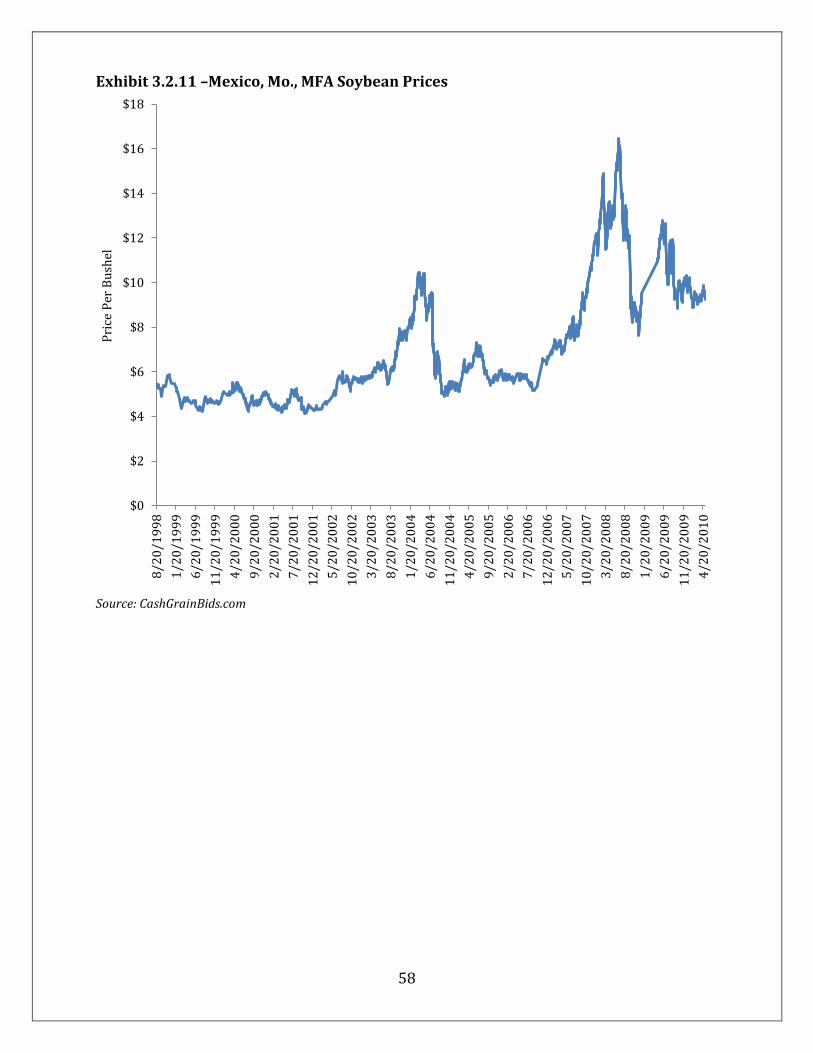
58
Exhibit 3.2.11 –Mexico, Mo., MFA Soybean Prices
Source: CashGrainBids.com
$0
$2
$4
$6
$8
$10
$12
$14
$16
$18
8/2
0/1
99
8
1/2
0/1
99
9
6/2
0/1
99
9
11
/20
/19
99
4/2
0/2
00
0
9/2
0/2
00
0
2/2
0/2
00
1
7/2
0/2
00
1
12
/20
/20
01
5/2
0/2
00
2
10
/20
/20
02
3/2
0/2
00
3
8/2
0/2
00
3
1/2
0/2
00
4
6/2
0/2
00
4
11
/20
/20
04
4/2
0/2
00
5
9/2
0/2
00
5
2/2
0/2
00
6
7/2
0/2
00
6
12
/20
/20
06
5/2
0/2
00
7
10
/20
/20
07
3/2
0/2
00
8
8/2
0/2
00
8
1/2
0/2
00
9
6/2
0/2
00
9
11
/20
/20
09
4/2
0/2
01
0
Pri
ce P
er B
ush
el

59
Exhibit 3.2.12 –Mexico, Mo., ADM Soybean Prices
Source: CashGrainBids.com
$0
$2
$4
$6
$8
$10
$12
$14
$16
$18
1/3
/20
03
5/3
/20
03
9/3
/20
03
1/3
/20
04
5/3
/20
04
9/3
/20
04
1/3
/20
05
5/3
/20
05
9/3
/20
05
1/3
/20
06
5/3
/20
06
9/3
/20
06
1/3
/20
07
5/3
/20
07
9/3
/20
07
1/3
/20
08
5/3
/20
08
9/3
/20
08
1/3
/20
09
5/3
/20
09
9/3
/20
09
1/3
/20
10
5/3
/20
10
9/3
/20
10
1/3
/20
11
5/3
/20
11
9/3
/20
11
Pri
ce P
er B
ush
el
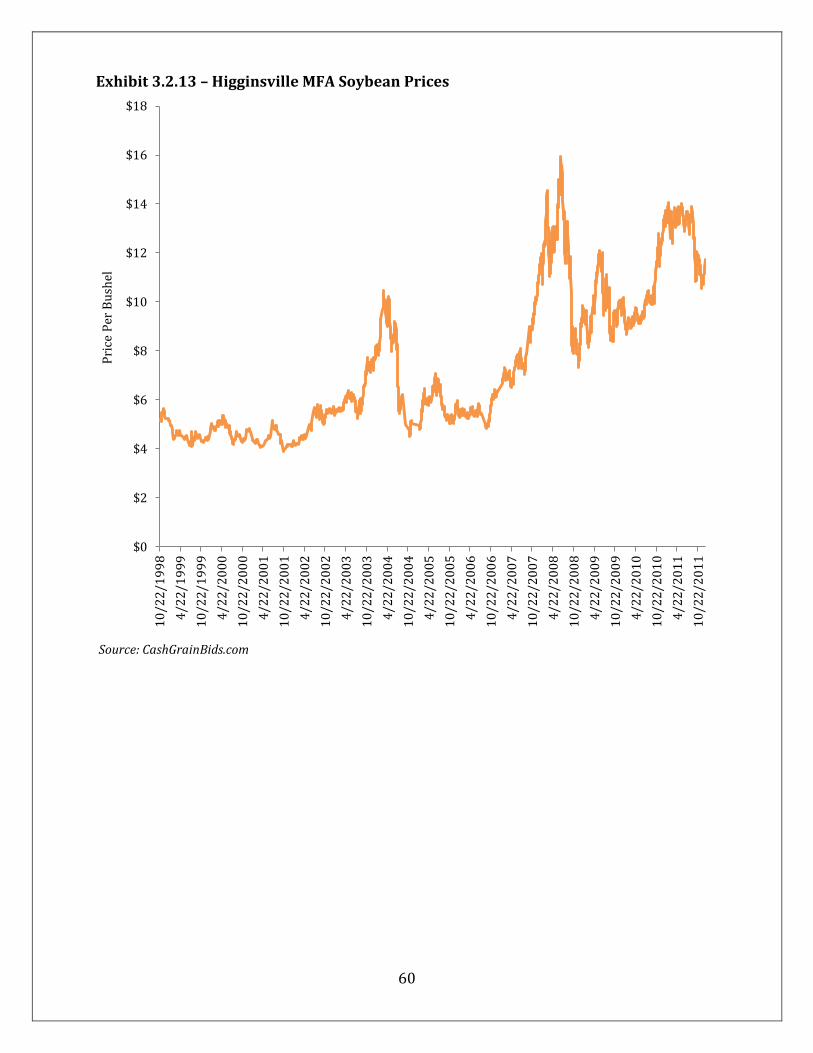
60
Exhibit 3.2.13 – Higginsville MFA Soybean Prices
Source: CashGrainBids.com
$0
$2
$4
$6
$8
$10
$12
$14
$16
$18
10
/22
/19
98
4/2
2/1
99
9
10
/22
/19
99
4/2
2/2
00
0
10
/22
/20
00
4/2
2/2
00
1
10
/22
/20
01
4/2
2/2
00
2
10
/22
/20
02
4/2
2/2
00
3
10
/22
/20
03
4/2
2/2
00
4
10
/22
/20
04
4/2
2/2
00
5
10
/22
/20
05
4/2
2/2
00
6
10
/22
/20
06
4/2
2/2
00
7
10
/22
/20
07
4/2
2/2
00
8
10
/22
/20
08
4/2
2/2
00
9
10
/22
/20
09
4/2
2/2
01
0
10
/22
/20
10
4/2
2/2
01
1
10
/22
/20
11
Pri
ce P
er B
ush
el
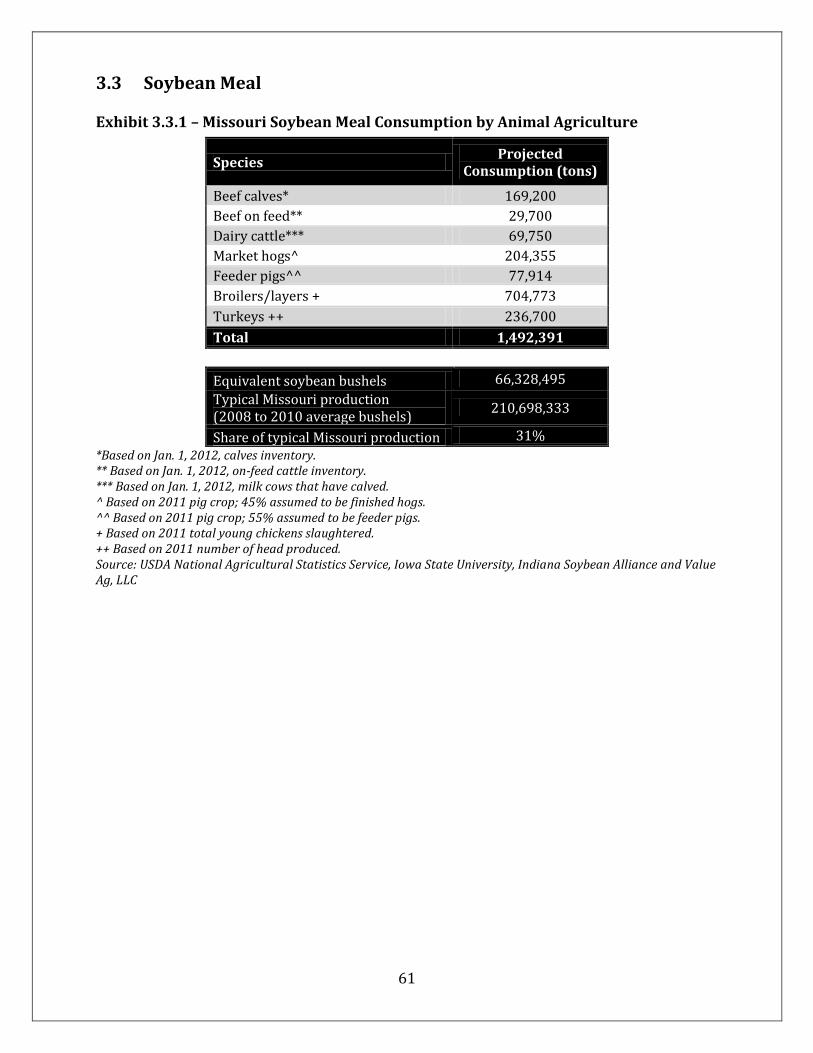
61
3.3 Soybean Meal Exhibit 3.3.1 – Missouri Soybean Meal Consumption by Animal Agriculture
Species Projected
Consumption (tons)
Beef calves* 169,200
Beef on feed** 29,700
Dairy cattle*** 69,750
Market hogs^ 204,355
Feeder pigs^^ 77,914
Broilers/layers + 704,773
Turkeys ++ 236,700
Total 1,492,391
Equivalent soybean bushels 66,328,495
Typical Missouri production (2008 to 2010 average bushels)
210,698,333
Share of typical Missouri production 31%
*Based on Jan. 1, 2012, calves inventory. ** Based on Jan. 1, 2012, on-feed cattle inventory. *** Based on Jan. 1, 2012, milk cows that have calved. ^ Based on 2011 pig crop; 45% assumed to be finished hogs. ^^ Based on 2011 pig crop; 55% assumed to be feeder pigs. + Based on 2011 total young chickens slaughtered. ++ Based on 2011 number of head produced. Source: USDA National Agricultural Statistics Service, Iowa State University, Indiana Soybean Alliance and Value Ag, LLC

62
Exhibit 3.3.2 – Kansas City High-Protein Soybean Meal Price
Source: The Jacobsen
$-
$50
$100
$150
$200
$250
$300
$350
$400
$450
May
-05
Au
g-0
5
No
v-0
5
Feb
-06
May
-06
Au
g-0
6
No
v-0
6
Feb
-07
May
-07
Au
g-0
7
No
v-0
7
Feb
-08
May
-08
Au
g-0
8
No
v-0
8
Feb
-09
May
-09
Au
g-0
9
No
v-0
9
Feb
-10
May
-10
Au
g-1
0
No
v-1
0
Feb
-11
May
-11
Au
g-1
1
No
v-1
1
Pri
ce P
er T
on
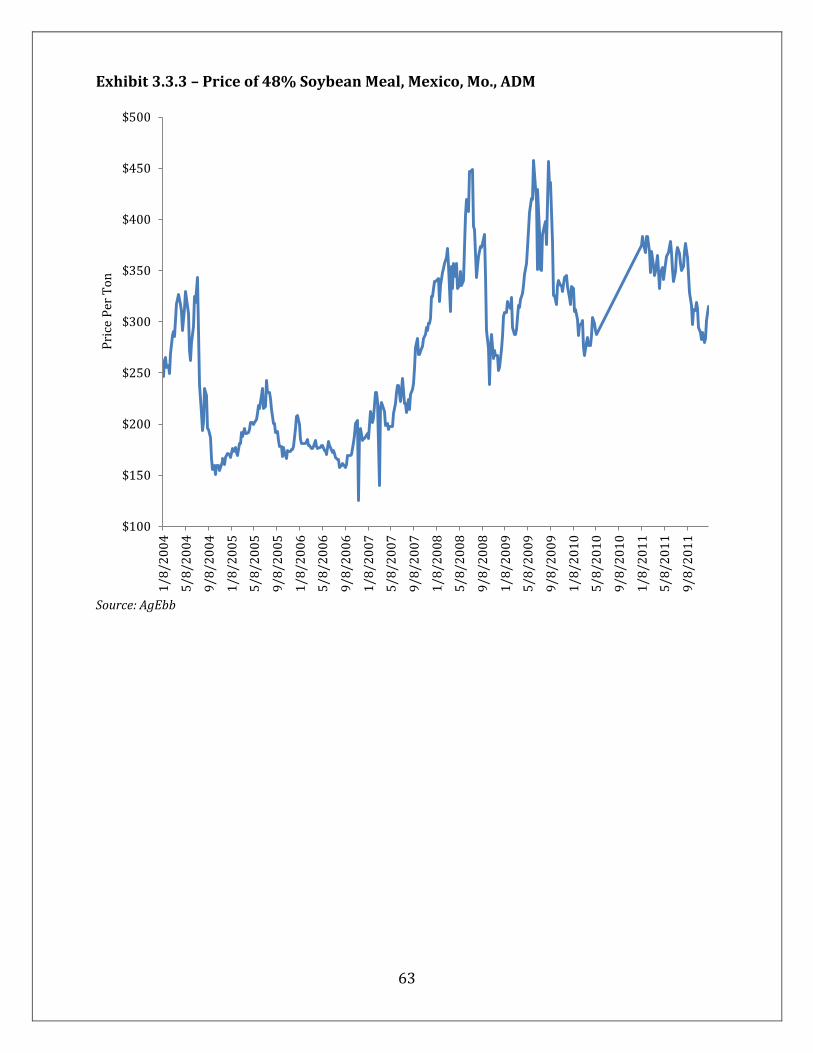
63
Exhibit 3.3.3 – Price of 48% Soybean Meal, Mexico, Mo., ADM
Source: AgEbb
$100
$150
$200
$250
$300
$350
$400
$450
$500
1/8
/20
04
5/8
/20
04
9/8
/20
04
1/8
/20
05
5/8
/20
05
9/8
/20
05
1/8
/20
06
5/8
/20
06
9/8
/20
06
1/8
/20
07
5/8
/20
07
9/8
/20
07
1/8
/20
08
5/8
/20
08
9/8
/20
08
1/8
/20
09
5/8
/20
09
9/8
/20
09
1/8
/20
10
5/8
/20
10
9/8
/20
10
1/8
/20
11
5/8
/20
11
9/8
/20
11
Pri
ce P
er T
on

64
Exhibit 3.3.4 – Price of 48% Soybean Meal, Versailles, NutraAg, LLC
Source: AgEbb
$0
$100
$200
$300
$400
$500
$600
8/2
/20
06
11
/2/2
00
6
2/2
/20
07
5/2
/20
07
8/2
/20
07
11
/2/2
00
7
2/2
/20
08
5/2
/20
08
8/2
/20
08
11
/2/2
00
8
2/2
/20
09
5/2
/20
09
8/2
/20
09
11
/2/2
00
9
2/2
/20
10
5/2
/20
10
8/2
/20
10
11
/2/2
01
0
2/2
/20
11
5/2
/20
11
8/2
/20
11
11
/2/2
01
1
Pri
ce P
er T
on

65
Exhibit 3.3.5 – Kansas City Soybean Meal Price as a Percentage of Central Illinois Truck Soybean Meal Price
Source: The Jacobsen
86%
88%
90%
92%
94%
96%
98%
100%
102%
104%
May
-05
Au
g-0
5
No
v-0
5
Feb
-06
May
-06
Au
g-0
6
No
v-0
6
Feb
-07
May
-07
Au
g-0
7
No
v-0
7
Feb
-08
May
-08
Au
g-0
8
No
v-0
8
Feb
-09
May
-09
Au
g-0
9
No
v-0
9
Feb
-10
May
-10
Au
g-1
0
No
v-1
0
Feb
-11
May
-11
Au
g-1
1
No
v-1
1
Kan
sas
Cit
y P
rice
/Cen
tral
Ill
ino
is T
ruck
Pri
ce

66
Exhibit 3.3.6 – Mexico, Mo., ADM Soybean Meal Price as a Percentage of Central Illinois Truck Soybean Meal Price
Source: AgEbb and The Jacobsen
86%
88%
90%
92%
94%
96%
98%
100%
102%
104%
106%
108%
May
-05
Au
g-0
5
No
v-0
5
Feb
-06
May
-06
Au
g-0
6
No
v-0
6
Feb
-07
May
-07
Au
g-0
7
No
v-0
7
Feb
-08
May
-08
Au
g-0
8
No
v-0
8
Feb
-09
May
-09
Au
g-0
9
No
v-0
9
Feb
-10
Mex
ico
AD
M P
rice
/Cen
tral
Ill
ino
is T
ruck
Pri
ce

67
Exhibit 3.3.7 – Kansas City Soybean Meal Price as a Percentage of Central Illinois DDG Price
Source: The Jacobsen
0%
50%
100%
150%
200%
250%
300%
350%
400%
450%
500%
May
-05
Au
g-0
5
No
v-0
5
Feb
-06
May
-06
Au
g-0
6
No
v-0
6
Feb
-07
May
-07
Au
g-0
7
No
v-0
7
Feb
-08
May
-08
Au
g-0
8
No
v-0
8
Feb
-09
May
-09
Au
g-0
9
No
v-0
9
Feb
-10
Kan
sas
Cit
y S
BM
Pri
ce/C
entr
al I
llin
ois
DD
G P
rice
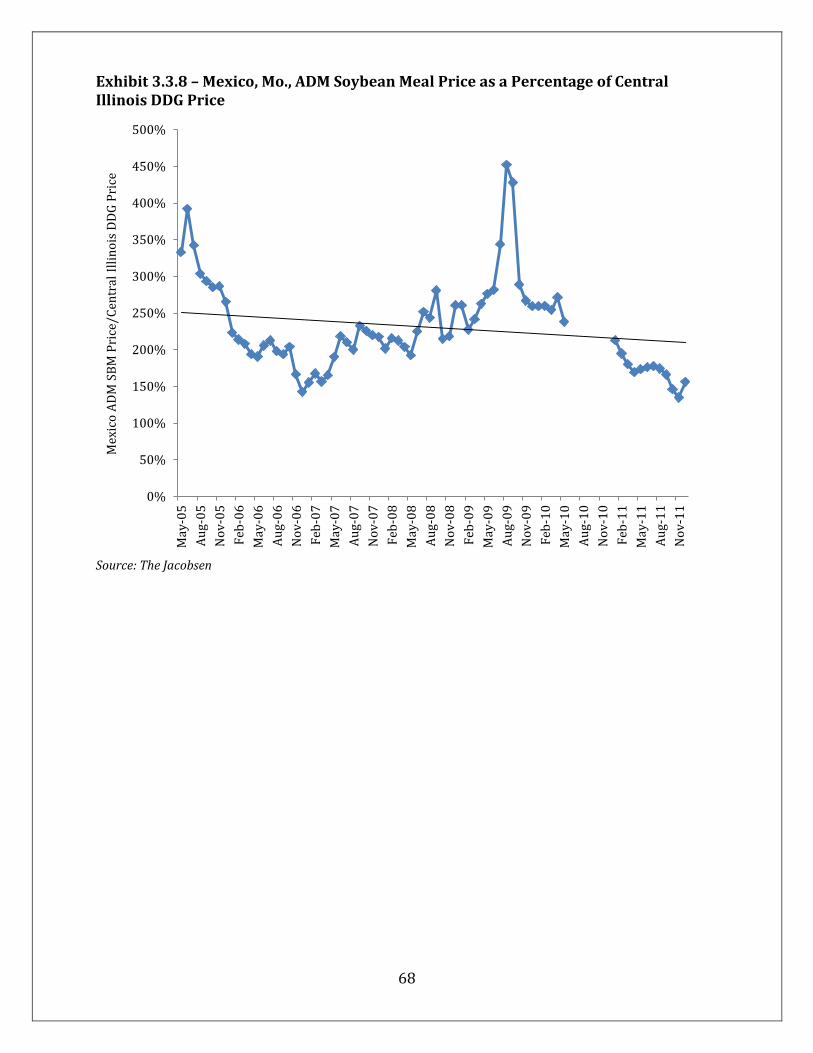
68
Exhibit 3.3.8 – Mexico, Mo., ADM Soybean Meal Price as a Percentage of Central Illinois DDG Price
Source: The Jacobsen
0%
50%
100%
150%
200%
250%
300%
350%
400%
450%
500%
May
-05
Au
g-0
5
No
v-0
5
Feb
-06
May
-06
Au
g-0
6
No
v-0
6
Feb
-07
May
-07
Au
g-0
7
No
v-0
7
Feb
-08
May
-08
Au
g-0
8
No
v-0
8
Feb
-09
May
-09
Au
g-0
9
No
v-0
9
Feb
-10
May
-10
Au
g-1
0
No
v-1
0
Feb
-11
May
-11
Au
g-1
1
No
v-1
1
Mex
ico
AD
M S
BM
Pri
ce/C
entr
al I
llin
ois
DD
G P
rice

69
Exhibit 3.3.9 –Kansas City Soybean Meal Price and U.S. Ethanol Production
Source: The Jacobsen and Renewable Fuels Association
$0
$50
$100
$150
$200
$250
$300
$350
$400
$450
0
5,000
10,000
15,000
20,000
25,000
30,000
Dec
-05
Ap
r-0
6
Au
g-0
6
Dec
-06
Ap
r-0
7
Au
g-0
7
Dec
-07
Ap
r-0
8
Au
g-0
8
Dec
-08
Ap
r-0
9
Au
g-0
9
Dec
-09
Ap
r-1
0
Au
g-1
0
Dec
-10
Ap
r-1
1
Au
g-1
1
Per
To
n
Th
ou
san
d B
arre
ls
Ethanol Production SBM Price
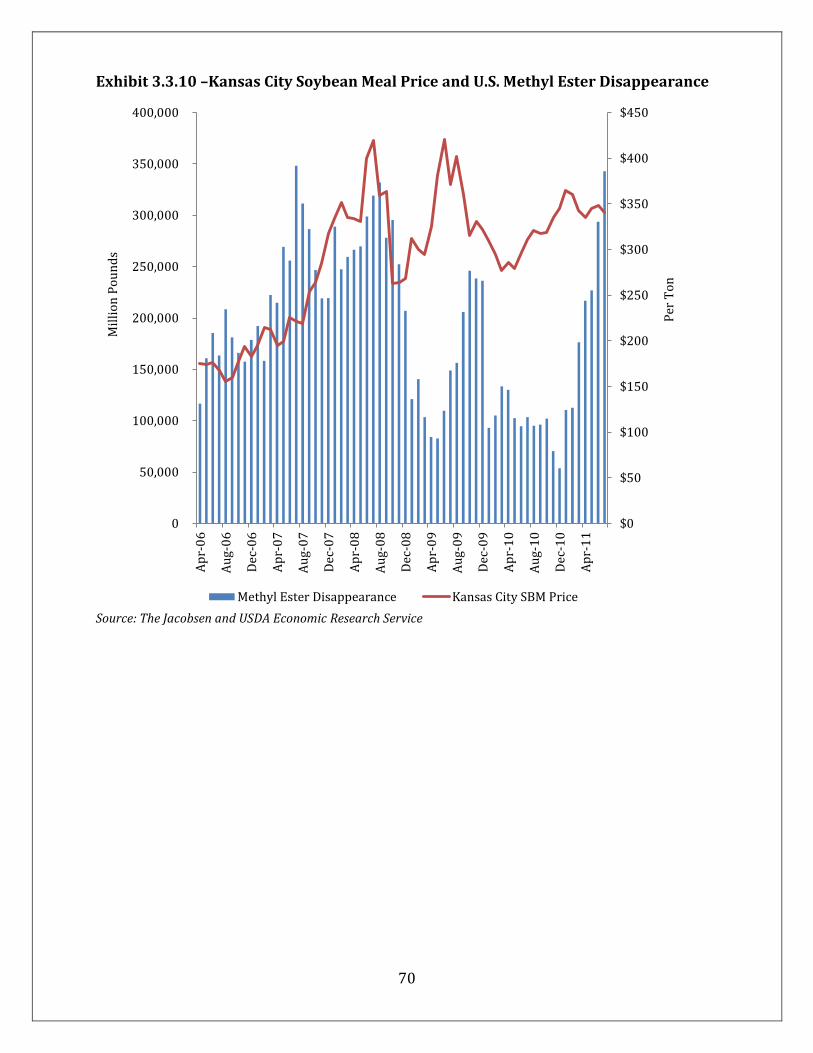
70
Exhibit 3.3.10 –Kansas City Soybean Meal Price and U.S. Methyl Ester Disappearance
Source: The Jacobsen and USDA Economic Research Service
$0
$50
$100
$150
$200
$250
$300
$350
$400
$450
0
50,000
100,000
150,000
200,000
250,000
300,000
350,000
400,000
Ap
r-0
6
Au
g-0
6
Dec
-06
Ap
r-0
7
Au
g-0
7
Dec
-07
Ap
r-0
8
Au
g-0
8
Dec
-08
Ap
r-0
9
Au
g-0
9
Dec
-09
Ap
r-1
0
Au
g-1
0
Dec
-10
Ap
r-1
1
Per
To
n
Mil
lio
n P
ou
nd
s
Methyl Ester Disappearance Kansas City SBM Price
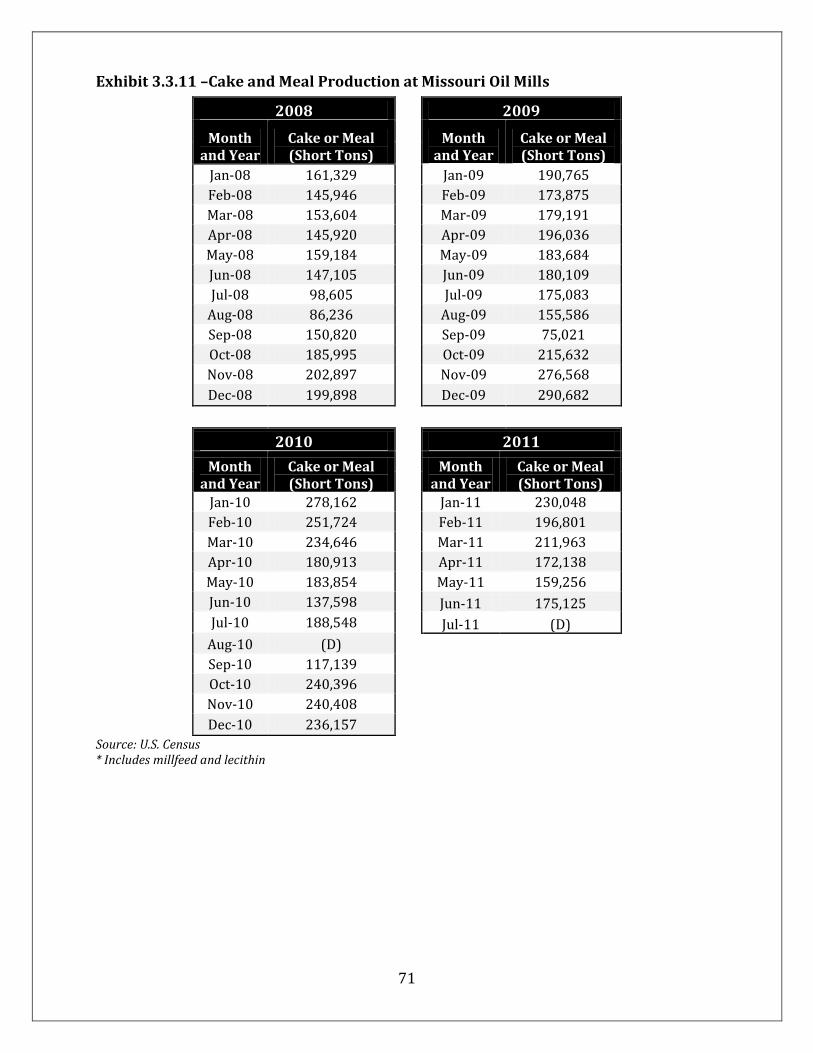
71
Exhibit 3.3.11 –Cake and Meal Production at Missouri Oil Mills
2008
2009
Month and Year
Cake or Meal (Short Tons)
Month and Year
Cake or Meal (Short Tons)
Jan-08 161,329 Jan-09 190,765
Feb-08 145,946 Feb-09 173,875
Mar-08 153,604 Mar-09 179,191
Apr-08 145,920 Apr-09 196,036
May-08 159,184 May-09 183,684
Jun-08 147,105 Jun-09 180,109
Jul-08 98,605 Jul-09 175,083
Aug-08 86,236 Aug-09 155,586
Sep-08 150,820 Sep-09 75,021
Oct-08 185,995 Oct-09 215,632
Nov-08 202,897 Nov-09 276,568
Dec-08 199,898 Dec-09 290,682
2010 2011
Month and Year
Cake or Meal (Short Tons)
Month and Year
Cake or Meal (Short Tons)
Jan-10 278,162 Jan-11 230,048
Feb-10 251,724 Feb-11 196,801
Mar-10 234,646 Mar-11 211,963
Apr-10 180,913 Apr-11 172,138
May-10 183,854 May-11 159,256
Jun-10 137,598 Jun-11 175,125
Jul-10 188,548 Jul-11 (D)
Aug-10 (D)
Sep-10 117,139
Oct-10 240,396
Nov-10 240,408
Dec-10 236,157 Source: U.S. Census * Includes millfeed and lecithin

72
Exhibit 3.3.12 –2008-to-2010 Average Cake or Meal Production at Missouri Oil Mills
Month Cake or Meal (Short Tons)
January 210,085
February 190,515
March 189,147
April 174,290
May 175,574
June 154,937
July 154,079
August* 120,911
September 114,327
October 214,008
November 239,958
December 242,246
Source: U.S. Census Bureau * August computed as a 2008-to-2009 average because data weren’t disclosed in August 2010.

73
3.4 Soybean Oil Exhibit 3.4.1 – Crude Soybean Oil Production at Missouri Oil Mills
2008
2009
Month and Year
Crude Oil (Thousand Pounds)
Month and Year
Crude Oil (Thousand Pounds)
Jan-08 75,385 Jan-09 88,201
Feb-08 65,128 Feb-09 80,582
Mar-08 73,034 Mar-09 84,359
Apr-08 68,615 Apr-09 93,240
May-08 74,283 May-09 84,847
Jun-08 68,078 Jun-09 84,085
Jul-08 45,968 Jul-09 83,193
Aug-08 40,890 Aug-09 73,466
Sep-08 72,798 Sep-09 34,776
Oct-08 89,170 Oct-09 99,557
Nov-08 92,801 Nov-09 126,205
Dec-08 90,960 Dec-09 128,401
2010 2011
Month and Year
Crude Oil (Thousand Pounds)
Month and Year
Crude Oil (Thousand Pounds)
Jan-10 126,413 Jan-11 108,637
Feb-10 111,717 Feb-11 92,930
Mar-10 105,778 Mar-11 100,304
Apr-10 83,332 Apr-11 82,458
May-10 84,885 May-11 75,293
Jun-10 63,403 Jun-11 82,705
Jul-10 86,245 Jul-11 (D)
Aug-10 (D)
Sep-10 53,074
Oct-10 115,385
Nov-10 110,796
Dec-10 110,694
Source: U.S. Census

74
Exhibit 3.4.2 –2008-to-2010 Average Crude Soybean Oil Production in Missouri
Month Crude Oil
(Thousand Pounds)
January 96,666
February 85,809
March 87,724
April 81,729
May 81,338
June 71,855
July 71,802
August* 57,178
September 53,549
October 101,371
November 109,934
December 110,018
Source: U.S. Census Bureau * August computed as a 2008-to-2009 average because data weren’t disclosed in August 2010. Exhibit 3.4.3 –Crude Oil WTI Spot Price, FOB, at Cushing, Okla.
Source: U.S. Energy Information Administration
$0
$20
$40
$60
$80
$100
$120
$140
$160
Jun
-05
Sep
-05
Dec
-05
Mar
-06
Jun
-06
Sep
-06
Dec
-06
Mar
-07
Jun
-07
Sep
-07
Dec
-07
Mar
-08
Jun
-08
Sep
-08
Dec
-08
Mar
-09
Jun
-09
Sep
-09
Dec
-09
Mar
-10
Jun
-10
Sep
-10
Dec
-10
Mar
-11
Jun
-11
Sep
-11
Dec
-11
Pri
ce P
er B
arre
l
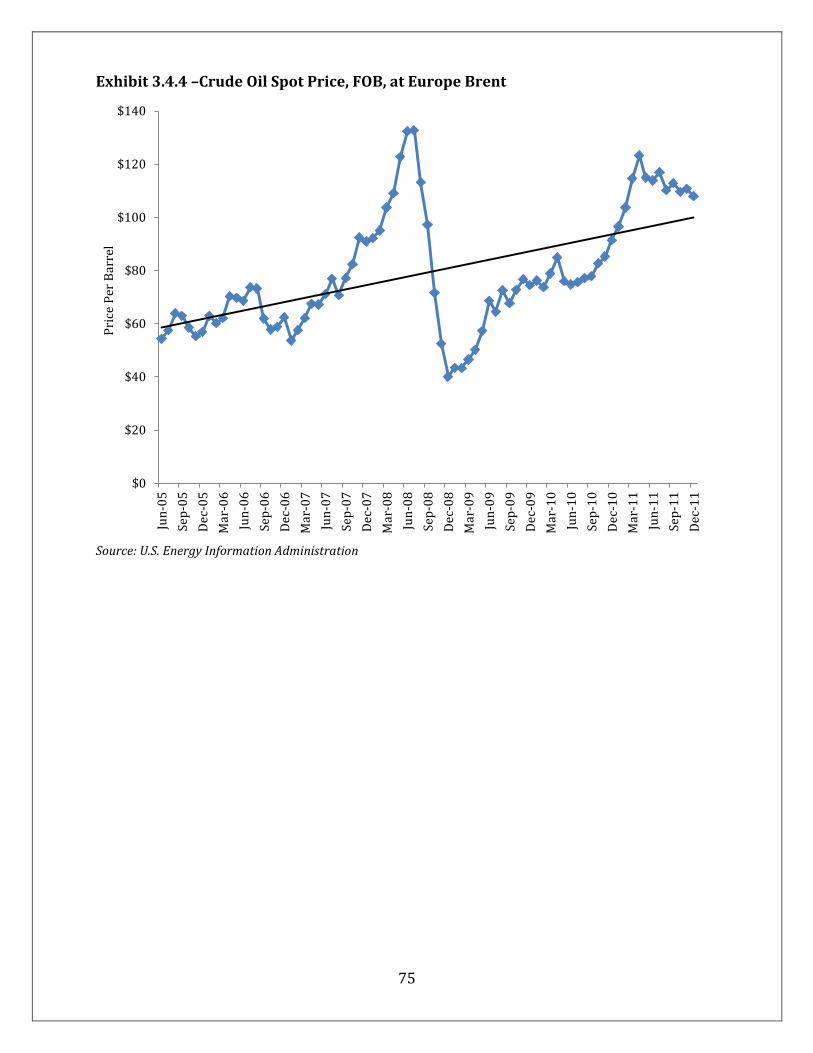
75
Exhibit 3.4.4 –Crude Oil Spot Price, FOB, at Europe Brent
Source: U.S. Energy Information Administration
$0
$20
$40
$60
$80
$100
$120
$140
Jun
-05
Sep
-05
Dec
-05
Mar
-06
Jun
-06
Sep
-06
Dec
-06
Mar
-07
Jun
-07
Sep
-07
Dec
-07
Mar
-08
Jun
-08
Sep
-08
Dec
-08
Mar
-09
Jun
-09
Sep
-09
Dec
-09
Mar
-10
Jun
-10
Sep
-10
Dec
-10
Mar
-11
Jun
-11
Sep
-11
Dec
-11
Pri
ce P
er B
arre
l
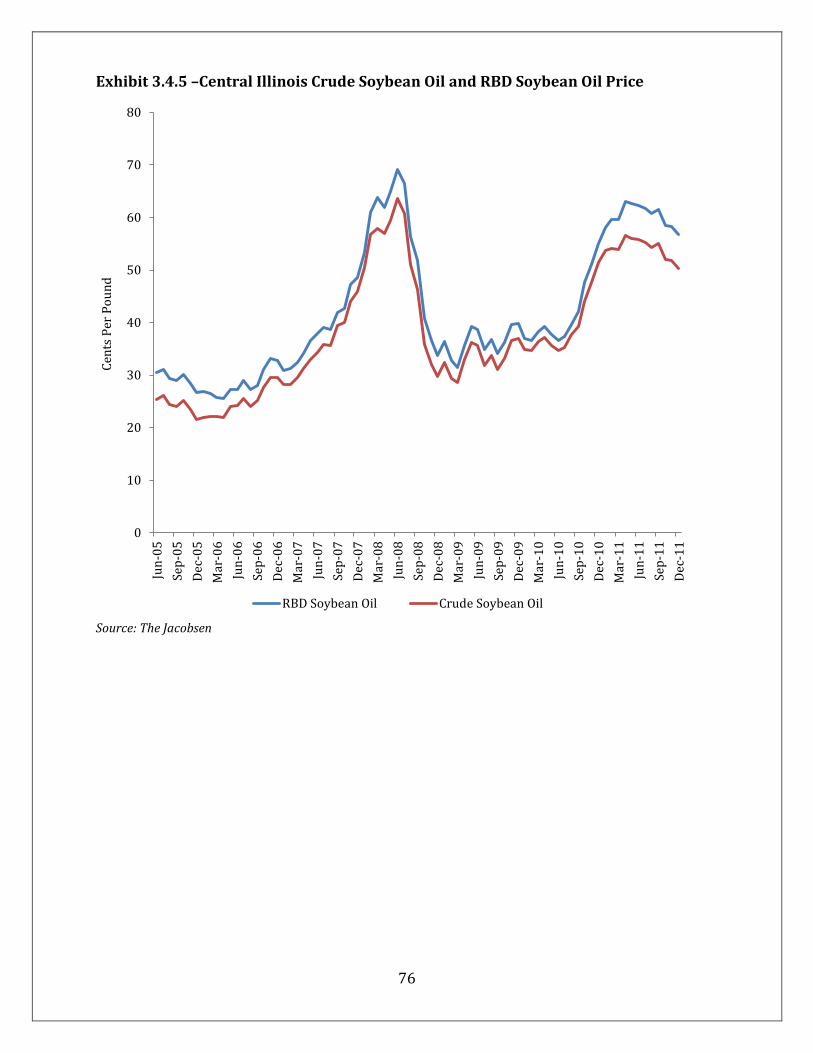
76
Exhibit 3.4.5 –Central Illinois Crude Soybean Oil and RBD Soybean Oil Price
Source: The Jacobsen
0
10
20
30
40
50
60
70
80
Jun
-05
Sep
-05
Dec
-05
Mar
-06
Jun
-06
Sep
-06
Dec
-06
Mar
-07
Jun
-07
Sep
-07
Dec
-07
Mar
-08
Jun
-08
Sep
-08
Dec
-08
Mar
-09
Jun
-09
Sep
-09
Dec
-09
Mar
-10
Jun
-10
Sep
-10
Dec
-10
Mar
-11
Jun
-11
Sep
-11
Dec
-11
Cen
ts P
er P
ou
nd
RBD Soybean Oil Crude Soybean Oil

77
Exhibit 3.4.6 –Spread between Central Illinois Crude Soybean Oil Price and Central Illinois RBD Soybean Oil Price
Source: The Jacobsen
0
1
2
3
4
5
6
7
Jun
-05
Sep
-05
Dec
-05
Mar
-06
Jun
-06
Sep
-06
Dec
-06
Mar
-07
Jun
-07
Sep
-07
Dec
-07
Mar
-08
Jun
-08
Sep
-08
Dec
-08
Mar
-09
Jun
-09
Sep
-09
Dec
-09
Mar
-10
Jun
-10
Sep
-10
Dec
-10
Mar
-11
Jun
-11
Sep
-11
Dec
-11
Cen
ts P
er P
ou
nd

78
Exhibit 3.4.7 –Lower Midwest B100 Biodiesel Price to Central Illinois Crude Soybean Oil Price
Source: The Jacobsen
0%
20%
40%
60%
80%
100%
120%
140%
160%
180%
200%
Jun
-05
Sep
-05
Dec
-05
Mar
-06
Jun
-06
Sep
-06
Dec
-06
Mar
-07
Jun
-07
Sep
-07
Dec
-07
Mar
-08
Jun
-08
Sep
-08
Dec
-08
Mar
-09
Jun
-09
Sep
-09
Dec
-09
Mar
-10
Jun
-10
Sep
-10
Dec
-10
Mar
-11
Jun
-11
Sep
-11
Dec
-11
Bio
die
sel
Pri
ce P
er G
allo
n/C
rud
e So
y O
il P
rice
Per
Gal
lon
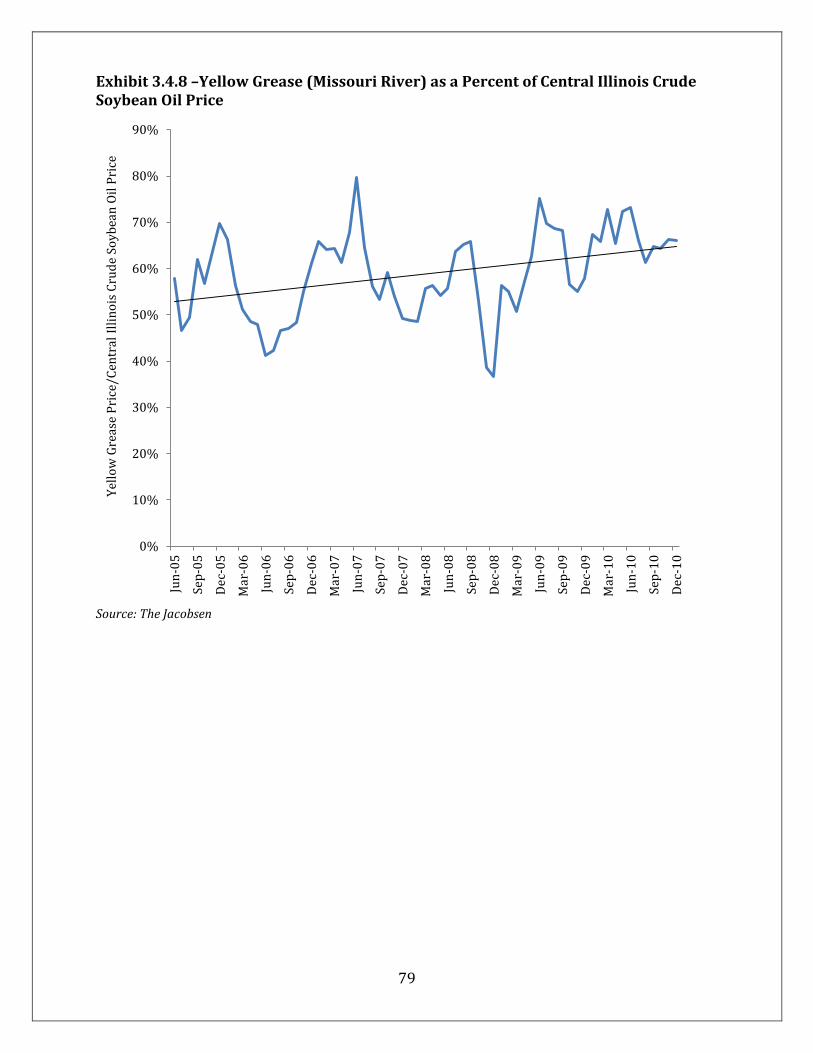
79
Exhibit 3.4.8 –Yellow Grease (Missouri River) as a Percent of Central Illinois Crude Soybean Oil Price
Source: The Jacobsen
0%
10%
20%
30%
40%
50%
60%
70%
80%
90%
Jun
-05
Sep
-05
Dec
-05
Mar
-06
Jun
-06
Sep
-06
Dec
-06
Mar
-07
Jun
-07
Sep
-07
Dec
-07
Mar
-08
Jun
-08
Sep
-08
Dec
-08
Mar
-09
Jun
-09
Sep
-09
Dec
-09
Mar
-10
Jun
-10
Sep
-10
Dec
-10
Yel
low
Gre
ase
Pri
ce/C
entr
al I
llin
ois
Cru
de
Soy
bea
n O
il P
rice
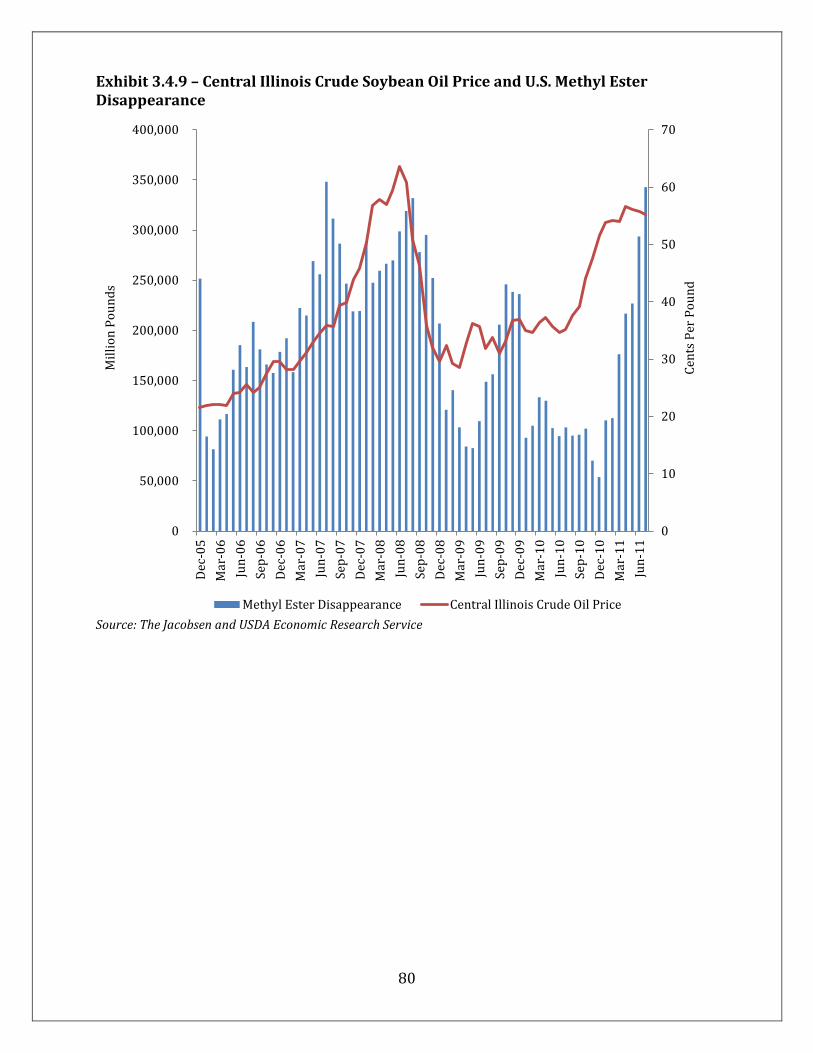
80
Exhibit 3.4.9 – Central Illinois Crude Soybean Oil Price and U.S. Methyl Ester Disappearance
Source: The Jacobsen and USDA Economic Research Service
0
10
20
30
40
50
60
70
0
50,000
100,000
150,000
200,000
250,000
300,000
350,000
400,000
Dec
-05
Mar
-06
Jun
-06
Sep
-06
Dec
-06
Mar
-07
Jun
-07
Sep
-07
Dec
-07
Mar
-08
Jun
-08
Sep
-08
Dec
-08
Mar
-09
Jun
-09
Sep
-09
Dec
-09
Mar
-10
Jun
-10
Sep
-10
Dec
-10
Mar
-11
Jun
-11
Cen
ts P
er P
ou
nd
Mil
lio
n P
ou
nd
s
Methyl Ester Disappearance Central Illinois Crude Oil Price
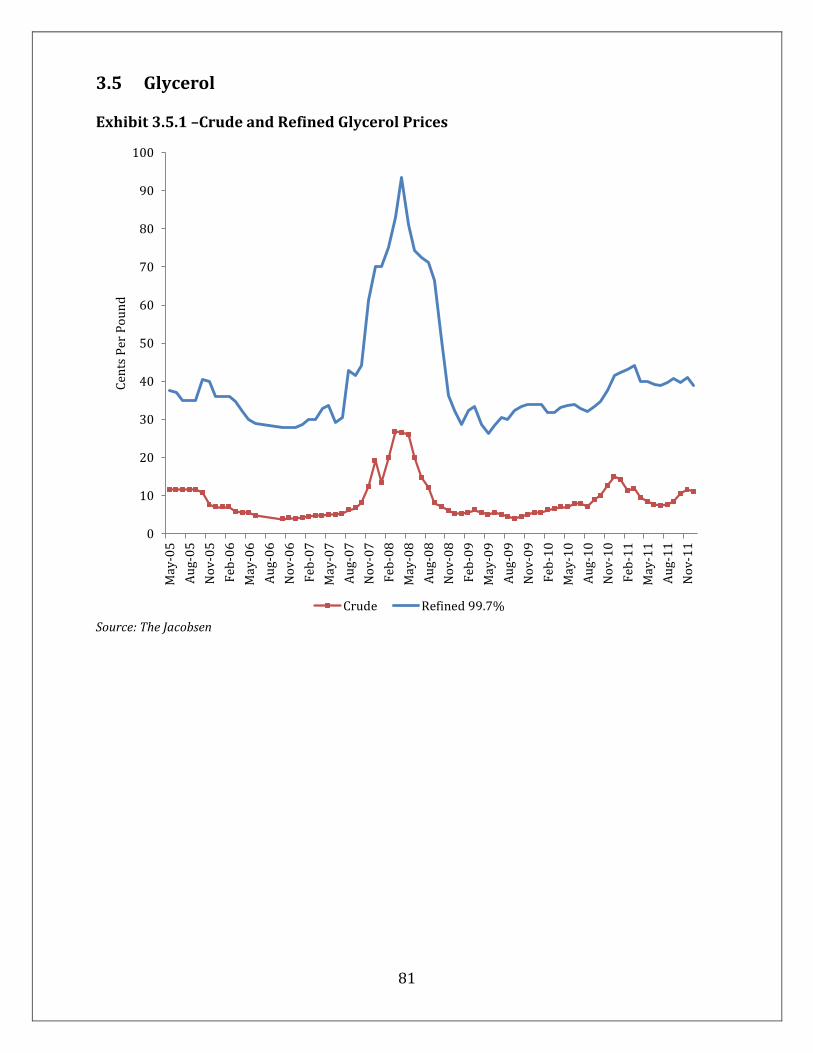
81
3.5 Glycerol Exhibit 3.5.1 –Crude and Refined Glycerol Prices
Source: The Jacobsen
0
10
20
30
40
50
60
70
80
90
100
May
-05
Au
g-0
5
No
v-0
5
Feb
-06
May
-06
Au
g-0
6
No
v-0
6
Feb
-07
May
-07
Au
g-0
7
No
v-0
7
Feb
-08
May
-08
Au
g-0
8
No
v-0
8
Feb
-09
May
-09
Au
g-0
9
No
v-0
9
Feb
-10
May
-10
Au
g-1
0
No
v-1
0
Feb
-11
May
-11
Au
g-1
1
No
v-1
1
Cen
ts P
er P
ou
nd
Crude Refined 99.7%

82
Exhibit 3.5.2 – Spread between Crude and Refined Glycerol Prices
Source: The Jacobsen
0
10
20
30
40
50
60
70
80
May
-05
Au
g-0
5
No
v-0
5
Feb
-06
May
-06
Au
g-0
6
No
v-0
6
Feb
-07
May
-07
Au
g-0
7
No
v-0
7
Feb
-08
May
-08
Au
g-0
8
No
v-0
8
Feb
-09
May
-09
Au
g-0
9
No
v-0
9
Feb
-10
May
-10
Au
g-1
0
No
v-1
0
Feb
-11
May
-11
Au
g-1
1
No
v-1
1
Cen
ts P
er P
ou
nd
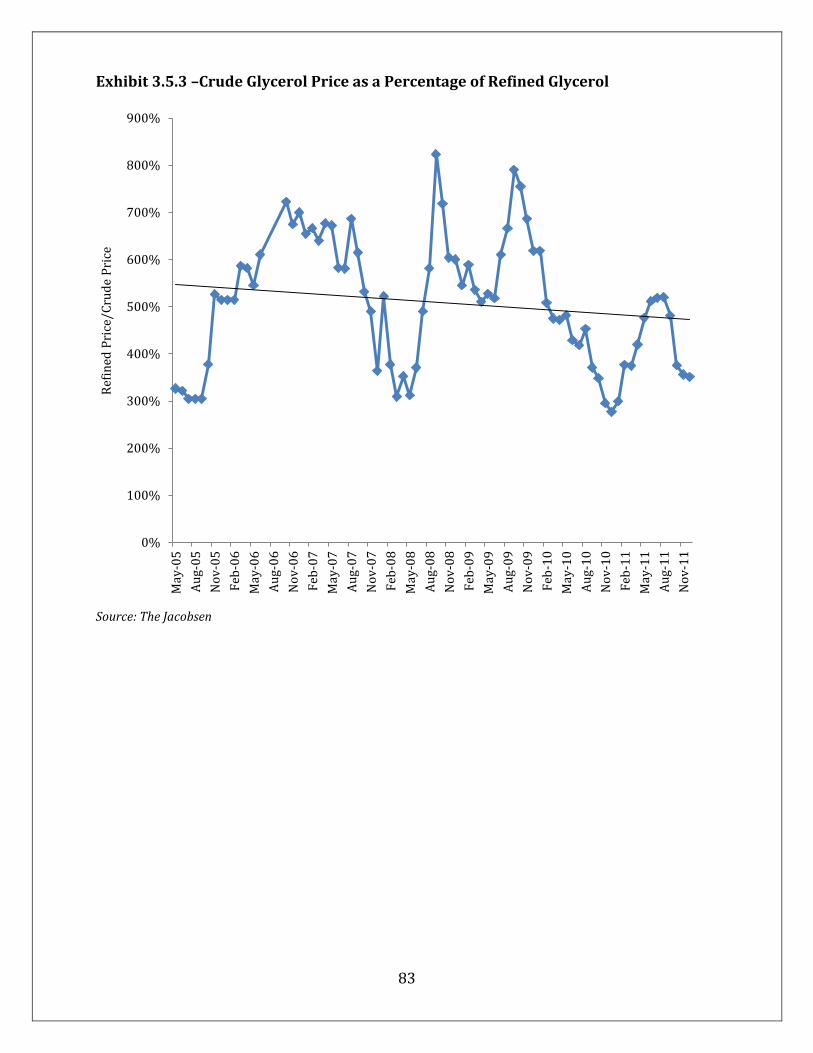
83
Exhibit 3.5.3 –Crude Glycerol Price as a Percentage of Refined Glycerol
Source: The Jacobsen
0%
100%
200%
300%
400%
500%
600%
700%
800%
900%
May
-05
Au
g-0
5
No
v-0
5
Feb
-06
May
-06
Au
g-0
6
No
v-0
6
Feb
-07
May
-07
Au
g-0
7
No
v-0
7
Feb
-08
May
-08
Au
g-0
8
No
v-0
8
Feb
-09
May
-09
Au
g-0
9
No
v-0
9
Feb
-10
May
-10
Au
g-1
0
No
v-1
0
Feb
-11
May
-11
Au
g-1
1
No
v-1
1
Ref
ined
Pri
ce/C
rud
e P
rice

84
Exhibit 3.5.4 –Glycerol Price and U.S. Methyl Ester Disappearance
Source: The Jacobsen and USDA Economic Research Service
0
5
10
15
20
25
30
0
50,000
100,000
150,000
200,000
250,000
300,000
350,000
400,000
Dec
-05
Mar
-06
Jun
-06
Sep
-06
Dec
-06
Mar
-07
Jun
-07
Sep
-07
Dec
-07
Mar
-08
Jun
-08
Sep
-08
Dec
-08
Mar
-09
Jun
-09
Sep
-09
Dec
-09
Mar
-10
Jun
-10
Sep
-10
Dec
-10
Mar
-11
Jun
-11
Cen
ts P
er P
ou
nd
Mil
lio
n P
ou
nd
s
Methyl Ester Disappearance Glycerol (Crude) Price

85
3.6 Soybean Hulls Exhibit 3.6.1 – Estimated Soybean Hulls Produced at Missouri Mills
2008
2009
Month and Year
Soybean Hulls (Tons)
Month and Year
Soybean Hulls (Tons)
Jan-08 8,066 Jan-09 9,538
Feb-08 7,297 Feb-09 8,694
Mar-08 7,680 Mar-09 8,960
Apr-08 7,296 Apr-09 9,802
May-08 7,959 May-09 9,184
Jun-08 7,355 Jun-09 9,005
Jul-08 4,930 Jul-09 8,754
Aug-08 4,312 Aug-09 7,779
Sep-08 7,541 Sep-09 3,751
Oct-08 9,300 Oct-09 10,782
Nov-08 10,145 Nov-09 13,828
Dec-08 9,995 Dec-09 14,534
2010 2011
Month and Year
Soybean Hulls (Tons)
Month and Year
Soybean Hulls (Tons)
Jan-10 13,908 Jan-11 11,502
Feb-10 12,586 Feb-11 9,840
Mar-10 11,732 Mar-11 10,598
Apr-10 9,046 Apr-11 8,607
May-10 9,193 May-11 7,963
Jun-10 6,880 Jun-11 8,756
Jul-10 9,427 Jul-11 (D)
Aug-10 (D)
Sep-10 5,857
Oct-10 12,020
Nov-10 12,020
Dec-10 11,808 Source: Estimated using U.S. Census Bureau data

86
Exhibit 3.6.2 – 2008-to-2010 Average Estimated Soybean Hulls Produced in Missouri
Month Soybean Hulls
(Tons)
January 2,432
February 2,560
March 2,432
April 2,653
May 2,452
June 1,643
July 1,437
August* 3,771
September 3,100
October 3,382
November 3,332
December 3,179
Source: Estimated using U.S. Census Bureau data * August computed as a 2008-to-2009 average because data weren’t disclosed in August 2010. Exhibit 3.6.3 – Kansas City Soybean Hull Price
Source: The Jacobsen
$0
$50
$100
$150
$200
$250
$300
May
-05
Au
g-0
5
No
v-0
5
Feb
-06
May
-06
Au
g-0
6
No
v-0
6
Feb
-07
May
-07
Au
g-0
7
No
v-0
7
Feb
-08
May
-08
Au
g-0
8
No
v-0
8
Feb
-09
May
-09
Au
g-0
9
No
v-0
9
Feb
-10
May
-10
Au
g-1
0
No
v-1
0
Feb
-11
May
-11
Au
g-1
1
No
v-1
1
Pri
ce P
er T
on

87
Exhibit 3.6.4 – Kansas City Hull Price Relative to Central Illinois Hull Price
Source: The Jacobsen
0%
20%
40%
60%
80%
100%
120%
140%
160%
May
-05
Au
g-0
5
No
v-0
5
Feb
-06
May
-06
Au
g-0
6
No
v-0
6
Feb
-07
May
-07
Au
g-0
7
No
v-0
7
Feb
-08
May
-08
Au
g-0
8
No
v-0
8
Feb
-09
May
-09
Au
g-0
9
No
v-0
9
Feb
-10
May
-10
Au
g-1
0
No
v-1
0
Feb
-11
May
-11
Au
g-1
1
No
v-1
1
Kan
sas
Cit
y P
rice
/Cen
tral
Ill
ino
is P
rice
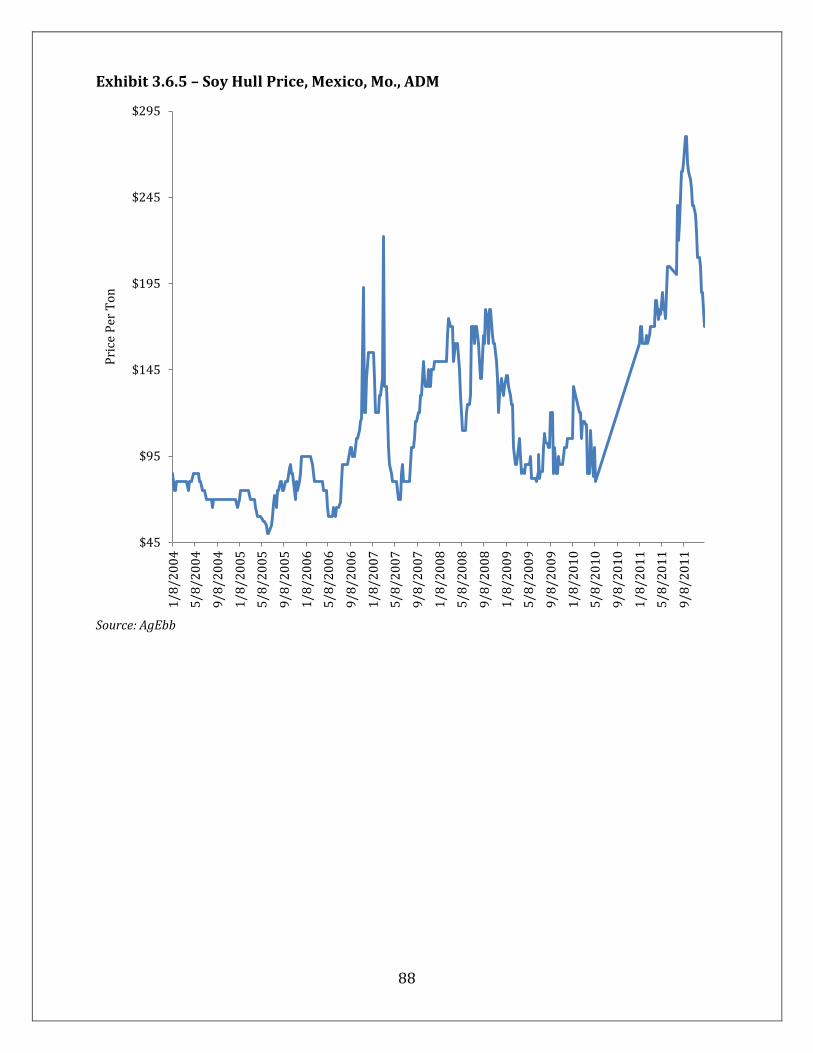
88
Exhibit 3.6.5 – Soy Hull Price, Mexico, Mo., ADM
Source: AgEbb
$45
$95
$145
$195
$245
$295
1/8
/20
04
5/8
/20
04
9/8
/20
04
1/8
/20
05
5/8
/20
05
9/8
/20
05
1/8
/20
06
5/8
/20
06
9/8
/20
06
1/8
/20
07
5/8
/20
07
9/8
/20
07
1/8
/20
08
5/8
/20
08
9/8
/20
08
1/8
/20
09
5/8
/20
09
9/8
/20
09
1/8
/20
10
5/8
/20
10
9/8
/20
10
1/8
/20
11
5/8
/20
11
9/8
/20
11
Pri
ce P
er T
on

89
Exhibit 3.6.6 –Pelleted Soy Hull Prices, North Kansas City, CyberAg
Source: AgEbb
$0
$50
$100
$150
$200
$250
$300
1/8
/20
04
5/8
/20
04
9/8
/20
04
1/8
/20
05
5/8
/20
05
9/8
/20
05
1/8
/20
06
5/8
/20
06
9/8
/20
06
1/8
/20
07
5/8
/20
07
9/8
/20
07
1/8
/20
08
5/8
/20
08
9/8
/20
08
1/8
/20
09
5/8
/20
09
9/8
/20
09
1/8
/20
10
5/8
/20
10
9/8
/20
10
1/8
/20
11
5/8
/20
11
9/8
/20
11
Pri
ce P
er T
on

90
Exhibit 3.6.7 – Pelleted Soy Hull Prices, Cairo, Ill., Bunge
Source: AgEbb
$-
$50
$100
$150
$200
$250
7/1
6/2
00
9
9/1
6/2
00
9
11
/16
/20
09
1/1
6/2
01
0
3/1
6/2
01
0
5/1
6/2
01
0
7/1
6/2
01
0
9/1
6/2
01
0
11
/16
/20
10
1/1
6/2
01
1
3/1
6/2
01
1
5/1
6/2
01
1
7/1
6/2
01
1
9/1
6/2
01
1
11
/16
/20
11
Pri
ce P
er T
on

91
Exhibit 3.6.8 – Kansas City Soybean Hull Price and U.S. Methyl Ester Disappearance
Source: The Jacobsen and USDA Economic Research Service
$0
$20
$40
$60
$80
$100
$120
$140
$160
$180
$200
0
50,000
100,000
150,000
200,000
250,000
300,000
350,000
400,000
Ap
r-0
6
Jul-
06
Oct
-06
Jan
-07
Ap
r-0
7
Jul-
07
Oct
-07
Jan
-08
Ap
r-0
8
Jul-
08
Oct
-08
Jan
-09
Ap
r-0
9
Jul-
09
Oct
-09
Jan
-10
Ap
r-1
0
Jul-
10
Oct
-10
Jan
-11
Ap
r-1
1
Jul-
11
Per
To
n
Mil
lio
n P
ou
nd
s
Methyl Ester Disappearance Kansas City Soy Hull Price

92
Chapter 4: International Soybean Production and Trade
4.1 Worldwide Soybean Production Exhibit 4.1.1 – Worldwide Area Dedicated to Soybean Production
* Annual average ** Preliminary *** Forecast Source: Soyatech and USDA Foreign Agricultural Service
0
5
10
15
20
25
30
35
United States Brazil Argentina China India Paraguay Other
Mil
lio
ns
of
Hec
tare
s
2004/2005 to 2008/2009* 2009/2010** 2010/2011***

93
Exhibit 4.1.2 – Worldwide Soybean Yields
* Annual average ** Preliminary *** Forecast Source: Soyatech and USDA Foreign Agricultural Service
0
0.5
1
1.5
2
2.5
3
3.5
United States Brazil Argentina China India Paraguay Other
Met
ric
To
ns
Per
Hec
tare
2004/2005 to 2008/2009* 2009/2010** 2010/2011***
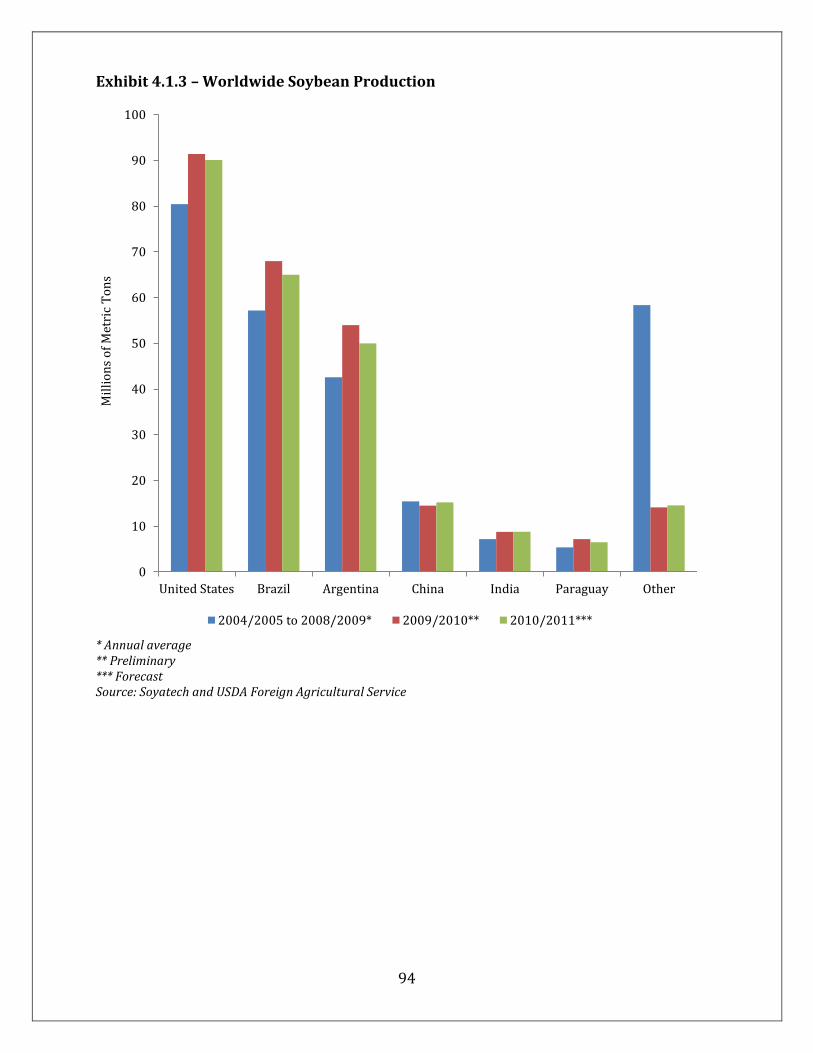
94
Exhibit 4.1.3 – Worldwide Soybean Production
* Annual average ** Preliminary *** Forecast Source: Soyatech and USDA Foreign Agricultural Service
0
10
20
30
40
50
60
70
80
90
100
United States Brazil Argentina China India Paraguay Other
Mil
lio
ns
of
Met
ric
To
ns
2004/2005 to 2008/2009* 2009/2010** 2010/2011***
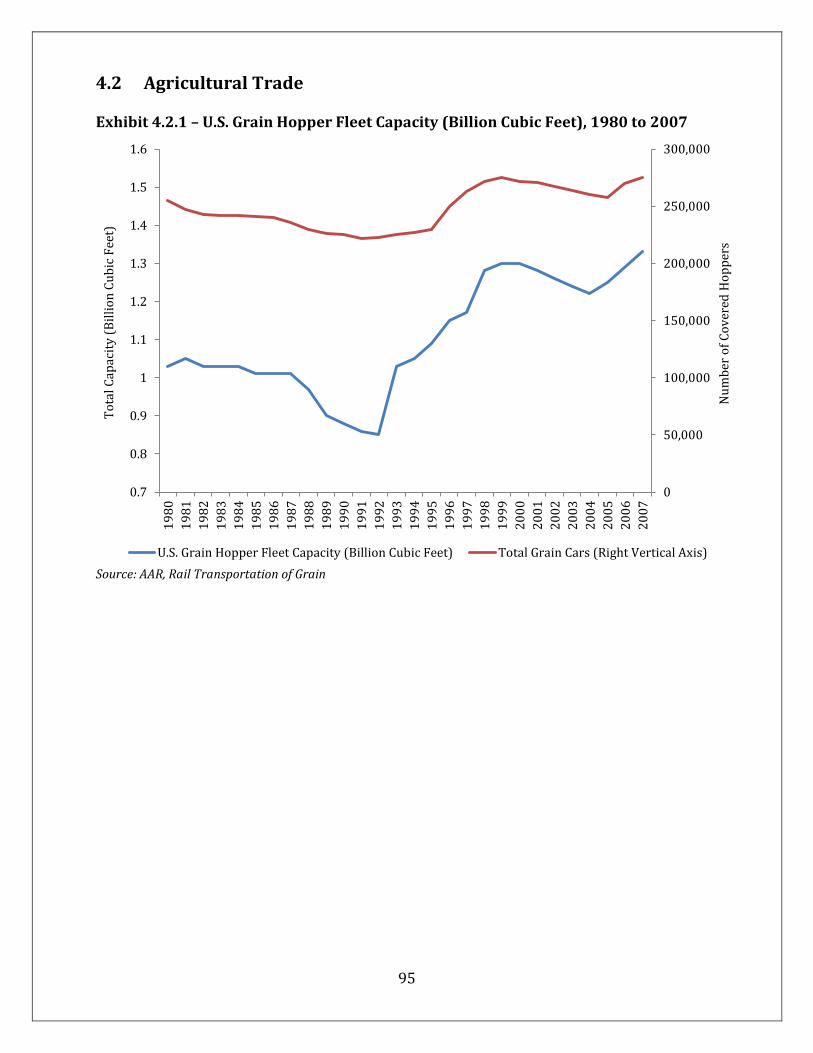
95
4.2 Agricultural Trade Exhibit 4.2.1 – U.S. Grain Hopper Fleet Capacity (Billion Cubic Feet), 1980 to 2007
Source: AAR, Rail Transportation of Grain
0
50,000
100,000
150,000
200,000
250,000
300,000
0.7
0.8
0.9
1
1.1
1.2
1.3
1.4
1.5
1.6
19
80
19
81
19
82
19
83
19
84
19
85
19
86
19
87
19
88
19
89
19
90
19
91
19
92
19
93
19
94
19
95
19
96
19
97
19
98
19
99
20
00
20
01
20
02
20
03
20
04
20
05
20
06
20
07
Nu
mb
er o
f C
ov
ered
Ho
pp
ers
To
tal
Cap
acit
y (
Bil
lio
n C
ub
ic F
eet)
U.S. Grain Hopper Fleet Capacity (Billion Cubic Feet) Total Grain Cars (Right Vertical Axis)

96
Exhibit 4.2.2 – Total Waterborne Agricultural Container Trade (Imports and Exports)
Source: Port Import Export Reporting Service (PIERS) * TEU is a 20-foot equivalent container.
0
1
2
3
4
5
6
2000 2001 2002 2003 2004 2005 2006 2007
TE
Us
( M
illi
on
s)

97
Exhibit 4.2.3 – Top 10 U.S. Ports Moving Agricultural Imports, 2007
Source: Port Import Export Reporting Service (PIERS) * Note: Chart depicts all waterborne agricultural imports, bulk and container combined, based on tonnage moved.
New York, 19%
Los Angeles, 7%
Long Beach, 6%
Philiadelphia, 5%
Wilmington DE, 5%
Houston, 5% Oakland, 4% Norfolk, 4%
Savannah, 3%
Baltimore, 3%
Other, 39%
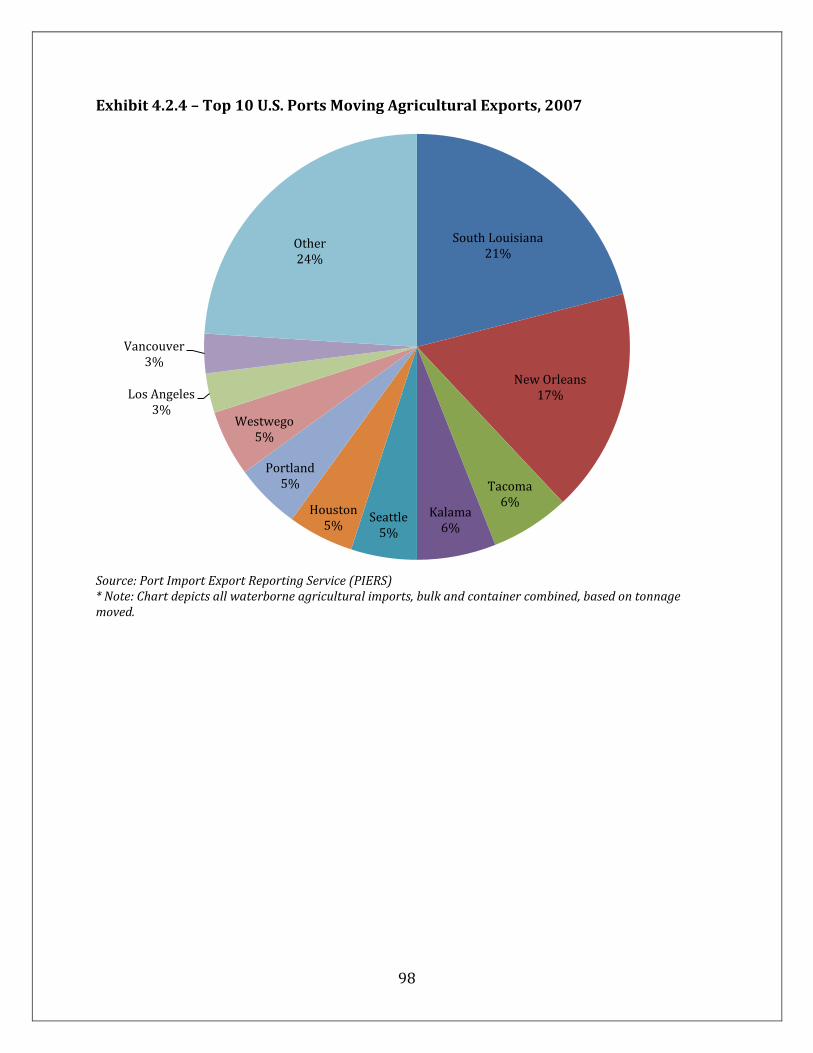
98
Exhibit 4.2.4 – Top 10 U.S. Ports Moving Agricultural Exports, 2007
Source: Port Import Export Reporting Service (PIERS) * Note: Chart depicts all waterborne agricultural imports, bulk and container combined, based on tonnage moved.
South Louisiana 21%
New Orleans 17%
Tacoma 6%
Kalama 6%
Seattle 5%
Houston 5%
Portland 5%
Westwego 5%
Los Angeles 3%
Vancouver 3%
Other 24%
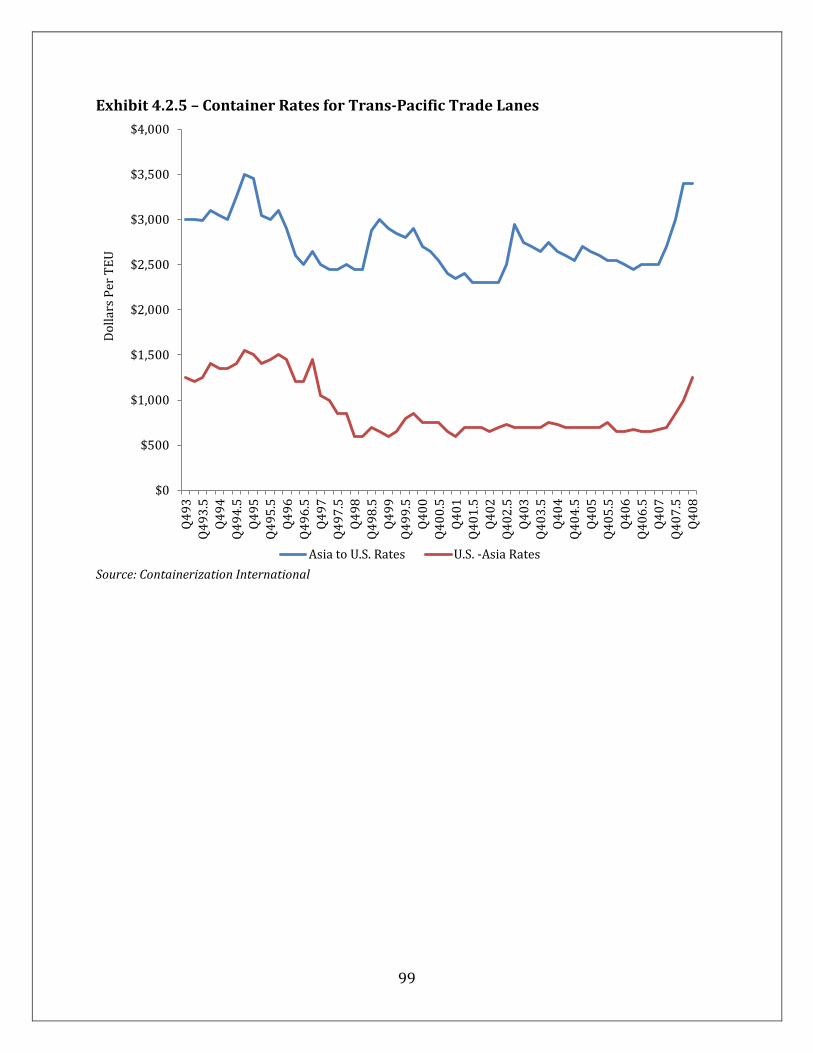
99
Exhibit 4.2.5 – Container Rates for Trans-Pacific Trade Lanes
Source: Containerization International
$0
$500
$1,000
$1,500
$2,000
$2,500
$3,000
$3,500
$4,000
Q4
93
Q4
93
.5
Q4
94
Q4
94
.5
Q4
95
Q4
95
.5
Q4
96
Q4
96
.5
Q4
97
Q4
97
.5
Q4
98
Q4
98
.5
Q4
99
Q4
99
.5
Q4
00
Q4
00
.5
Q4
01
Q4
01
.5
Q4
02
Q4
02
.5
Q4
03
Q4
03
.5
Q4
04
Q4
04
.5
Q4
05
Q4
05
.5
Q4
06
Q4
06
.5
Q4
07
Q4
07
.5
Q4
08
Do
llar
s P
er T
EU
Asia to U.S. Rates U.S. -Asia Rates

100
Exhibit 4.2.6 – U.S. Intermodal Facilities, 2002
Source: U.S. Bureau of Transportation Statistics
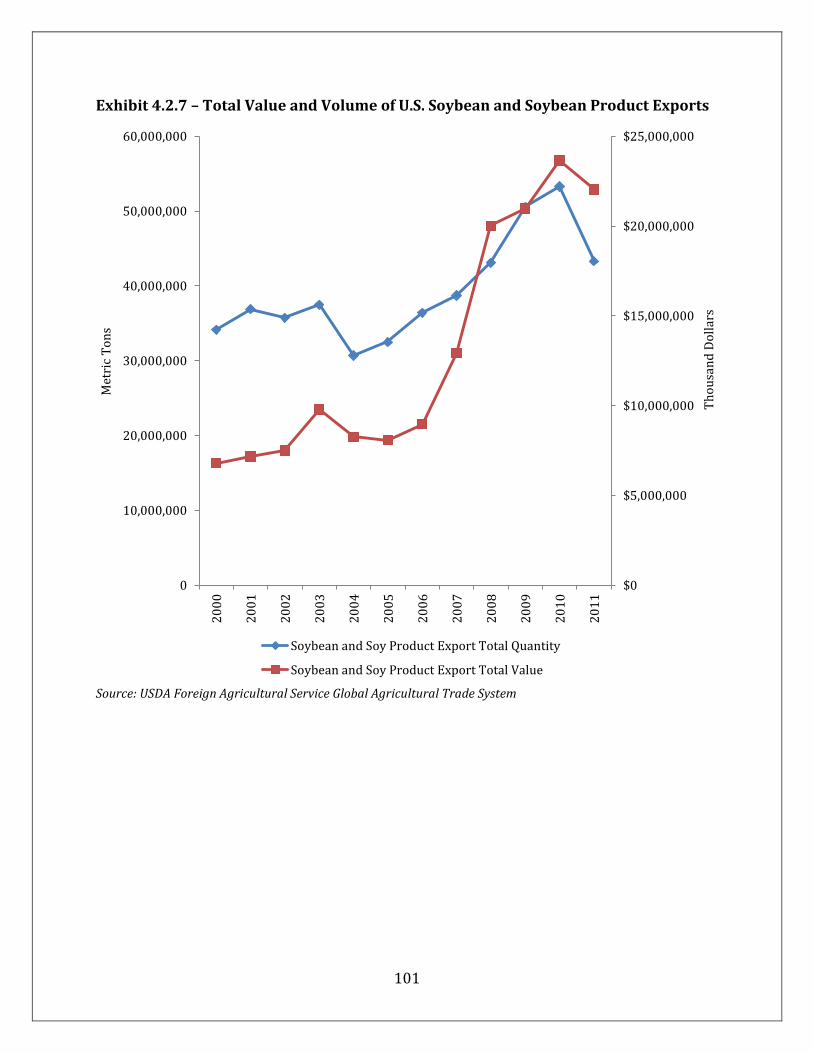
101
Exhibit 4.2.7 – Total Value and Volume of U.S. Soybean and Soybean Product Exports
Source: USDA Foreign Agricultural Service Global Agricultural Trade System
$0
$5,000,000
$10,000,000
$15,000,000
$20,000,000
$25,000,000
0
10,000,000
20,000,000
30,000,000
40,000,000
50,000,000
60,000,000
20
00
20
01
20
02
20
03
20
04
20
05
20
06
20
07
20
08
20
09
20
10
20
11
Th
ou
san
d D
oll
ars
Met
ric
To
ns
Soybean and Soy Product Export Total Quantity
Soybean and Soy Product Export Total Value

102
Exhibit 4.2.8 – Value and Volume of U.S. Soybean Exports
Source: USDA Foreign Agricultural Service Global Agricultural Trade System
$0
$2,000,000
$4,000,000
$6,000,000
$8,000,000
$10,000,000
$12,000,000
$14,000,000
$16,000,000
$18,000,000
$20,000,000
0
5,000,000
10,000,000
15,000,000
20,000,000
25,000,000
30,000,000
35,000,000
40,000,000
45,000,000
20
00
20
01
20
02
20
03
20
04
20
05
20
06
20
07
20
08
20
09
20
10
Th
ou
san
d D
oll
ars
Met
ric
To
ns
Soybean Export Quantity Soybean Export Value

103
Exhibit 4.2.9 – Value and Volume of U.S. Soybean Meal Exports
Source: USDA Foreign Agricultural Service Global Agricultural Trade System
$0
$500,000
$1,000,000
$1,500,000
$2,000,000
$2,500,000
$3,000,000
$3,500,000
$4,000,000
0
1,000,000
2,000,000
3,000,000
4,000,000
5,000,000
6,000,000
7,000,000
8,000,000
9,000,000
10,000,000
20
00
20
01
20
02
20
03
20
04
20
05
20
06
20
07
20
08
20
09
20
10
20
11
Th
ou
san
d D
oll
ars
Met
ric
To
ns
Soybean Meal Export Quantity Soybean Meal Export Value

104
Exhibit 4.2.10 – Value and Volume of U.S. Soybean Oil Exports
Source: USDA Foreign Agricultural Service Global Agricultural Trade System
$0
$200,000
$400,000
$600,000
$800,000
$1,000,000
$1,200,000
$1,400,000
$1,600,000
$1,800,000
0
200,000
400,000
600,000
800,000
1,000,000
1,200,000
1,400,000
1,600,000
1,800,000
20
00
20
01
20
02
20
03
20
04
20
05
20
06
20
07
20
08
20
09
20
10
Th
ou
san
d D
oll
ars
Met
ric
To
ns
Soybean Oil Export Quantity Soybean Oil Export Value
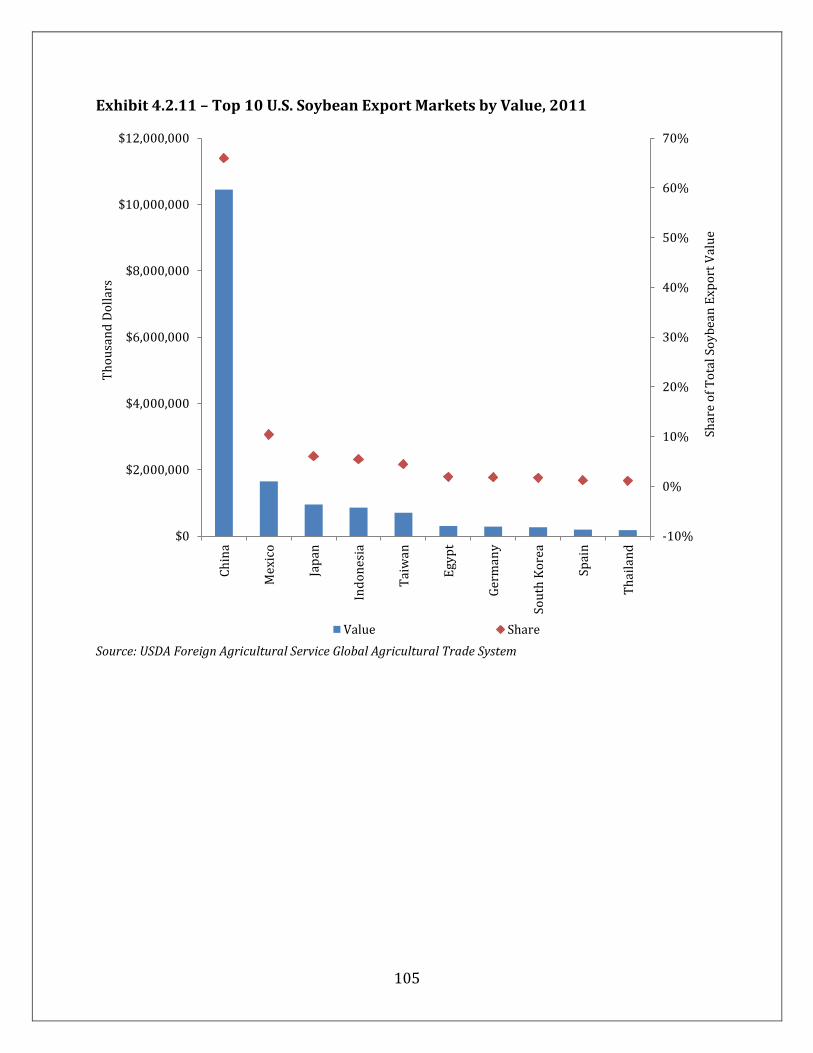
105
Exhibit 4.2.11 – Top 10 U.S. Soybean Export Markets by Value, 2011
Source: USDA Foreign Agricultural Service Global Agricultural Trade System
-10%
0%
10%
20%
30%
40%
50%
60%
70%
$0
$2,000,000
$4,000,000
$6,000,000
$8,000,000
$10,000,000
$12,000,000
Ch
ina
Mex
ico
Jap
an
Ind
on
esia
Tai
wan
Egy
pt
Ger
man
y
Sou
th K
ore
a
Spai
n
Th
aila
nd
Shar
e o
f T
ota
l So
yb
ean
Exp
ort
Val
ue
Th
ou
san
d D
oll
ars
Value Share

106
Exhibit 4.2.12 – 2011 Top U.S. Soybean Export Markets’ Change in Export Value
Source: USDA Foreign Agricultural Service Global Agricultural Trade System
$0
$2,000,000
$4,000,000
$6,000,000
$8,000,000
$10,000,000
$12,000,000
2000 2001 2002 2003 2004 2005 2006 2007 2008 2009 2010 2011
Th
ou
san
d D
oll
ars
China Mexico Japan Indonesia TaiwanEgypt Germany South Korea Spain

107
Exhibit 4.2.13 – Top 10 U.S. Soybean Meal Export Markets by Value, 2011
Source: USDA Foreign Agricultural Service Global Agricultural Trade System
0%
5%
10%
15%
20%
25%
30%
$0
$100,000
$200,000
$300,000
$400,000
$500,000
$600,000
$700,000
Mex
ico
Can
ada
Ph
ilip
pin
es
Ven
ezu
ela
Mo
rocc
o
Jap
an
Do
min
ican
Rep
ub
lic
Gu
atem
ala
Ecu
ado
r
Sou
th K
ore
a
Shar
e o
f T
ota
l So
yb
ean
Mea
l E
xpo
rt V
alu
e
Th
ou
san
d D
oll
ars
Value Share

108
Exhibit 4.2.14 – 2011 Top U.S. Soybean Meal Export Markets’ Change in Export Value
Source: USDA Foreign Agricultural Service Global Agricultural Trade System
$0
$100,000
$200,000
$300,000
$400,000
$500,000
$600,000
$700,000
2000 2001 2002 2003 2004 2005 2006 2007 2008 2009 2010 2011
Th
ou
san
d D
oll
ars
Mexico Canada PhilippinesVenezuela Morocco JapanDominican Republic Guatemala Ecuador

109
Exhibit 4.2.15 – Top 10 U.S. Soybean Oil Export Markets by Value, 2011
Source: USDA Foreign Agricultural Service Global Agricultural Trade System
0%
5%
10%
15%
20%
25%
30%
35%
$0
$50,000
$100,000
$150,000
$200,000
$250,000
$300,000
$350,000
Mo
rocc
o
Mex
ico
Ch
ina
Co
lom
bia
Alg
eria
Do
min
ican
Rep
ub
lic
Ven
ezu
ela
Gu
atem
ala
Can
ada
Per
u
Shar
e o
f T
ota
l So
yb
ean
Oil
Exp
ort
Val
ue
Th
ou
san
d D
oll
ars
Value Share

110
Exhibit 4.2.16 – 2011 Top U.S. Soybean Oil Export Markets’ Change in Export Value
Source: USDA Foreign Agricultural Service Global Agricultural Trade System
$0
$50,000
$100,000
$150,000
$200,000
$250,000
$300,000
$350,000
$400,000
$450,000
2000 2001 2002 2003 2004 2005 2006 2007 2008 2009 2010 2011
Th
ou
san
d D
oll
ars
Morocco Mexico China
Colombia Algeria Dominican Republic
Venezuela Guatemala Canada
Peru

111
4.3 Missouri Agricultural Trade Exhibit 4.3.1 – Value of Missouri Soybean Exports
Source: USDA Foreign Agricultural Service
$0
$50,000,000
$100,000,000
$150,000,000
$200,000,000
$250,000,000
$300,000,000
2004 2005 2006 2007 2008 2009 2010 2011
Soybeans Soybean Oil Soybean Meal

112
Exhibit 4.3.2 – Missouri Soybean Export Trading Partners, Thousand Dollars
2011 Rank Country 2004 2005 2006 2007 2008 2009 2010 2011
1 Mexico $74,109 $115,443 $85,909 $99,710 $114,610 $55,510 $98,381 $44,081
2 Taiwan $363 $2,302 $4,899 $5,279 $8,437 $6,617 $3,738 $33,968
3 China $0 $0 $0 $107,434 $48,833 $981 $26,141 $23,788
4 Indonesia $515 $181 $7 $1,543 $3,564 $8,777 $23,025 $14,793
5 Japan $2,289 $3,980 $24,964 $7,035 $28,117 $13,086 $18,366 $2,237
6 Vietnam $0 $161 $15 $413 $498 $579 $3,239 $567
7 Malaysia $20 $20 $0 $184 $23 $3,963 $706 $399
8 Afghanistan $0 $0 $0 $0 $0 $0 $0 $315
9 Philippines $0 $163 $338 $97 $24 $742 $450 $107
10 Canada $12 $65 $683 $383 $74 $14,024 $1,123 $80
11 Argentina $0 $3 $0 $0 $0 $0 $0 $17
12 Singapore $35 $13,929 $0 $0 $0 $59 $45 $15
13 Uruguay $0 $0 $0 $0 $0 $0 $10 $12
14 Bangladesh $0 $1,937 $0 $0 $0 $0 $0 $0
15 Chile $0 $0 $0 $2,273 $0 $0 $0 $0
16 Colombia $0 $0 $0 $4,232 $21,194 $0 $0 $0
17 Cuba $0 $21,010 $0 $0 $6,112 $0 $0 $0
18 Ireland $0 $0 $0 $0 $1,323 $0 $0 $0
19 Guatemala $34 $25 $20 $22 $0 $0 $0 $0
20 Hong Kong $0 $0 $229 $0 $50 $0 $29 $0
21 Korea, South $0 $0 $368 $105 $0 $0 $0 $0
22 Netherlands $0 $0 $0 $11,939 $0 $0 $0 $0
23 Paraguay $0 $0 $3 $0 $0 $0 $0 $0
24 Saudi Arabia $0 $0 $7 $0 $0 $0 $0 $0
25 Spain $0 $0 $0 $0 $0 $6,909 $0 $0
26 Thailand $139 $62 $171 $0 $0 $4,422 $0 $0
27 Turkey $0 $0 $9,384 $0 $0 $0 $0 $0
Total $77,516 $159,281 $126,996 $240,647 $232,860 $115,670 $175,254 $120,379 Source: USDA Foreign Agricultural Service
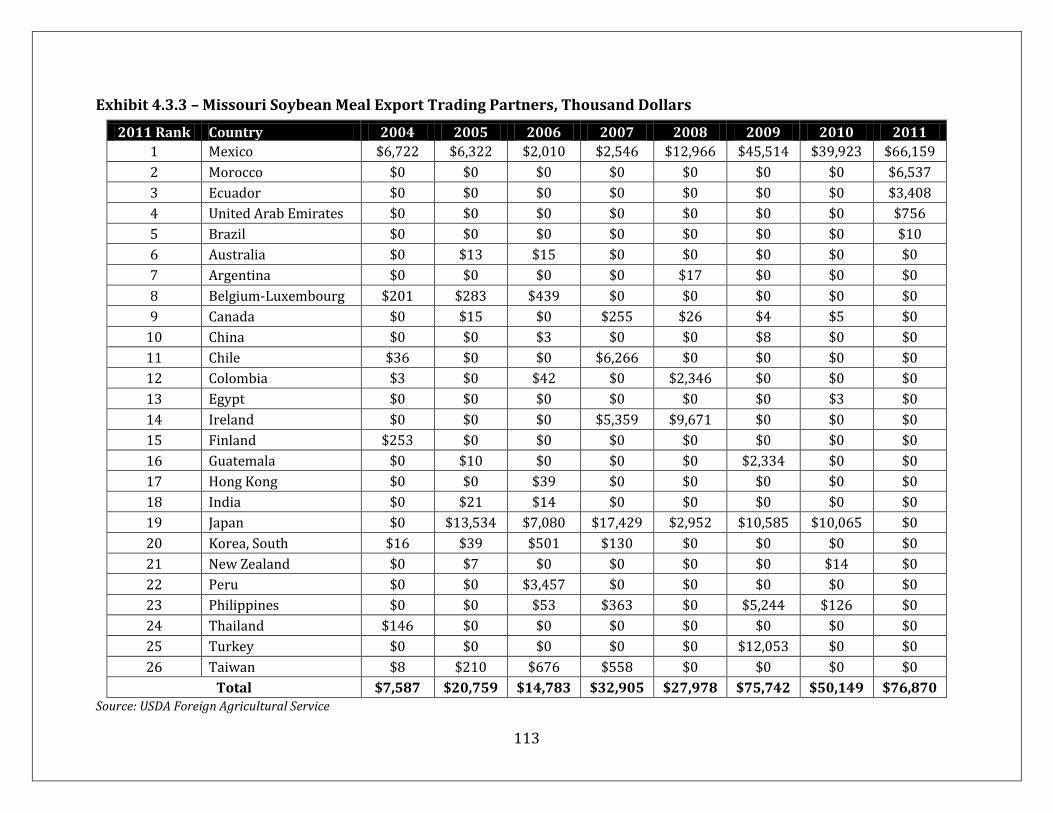
113
Exhibit 4.3.3 – Missouri Soybean Meal Export Trading Partners, Thousand Dollars
2011 Rank Country 2004 2005 2006 2007 2008 2009 2010 2011
1 Mexico $6,722 $6,322 $2,010 $2,546 $12,966 $45,514 $39,923 $66,159
2 Morocco $0 $0 $0 $0 $0 $0 $0 $6,537
3 Ecuador $0 $0 $0 $0 $0 $0 $0 $3,408
4 United Arab Emirates $0 $0 $0 $0 $0 $0 $0 $756
5 Brazil $0 $0 $0 $0 $0 $0 $0 $10
6 Australia $0 $13 $15 $0 $0 $0 $0 $0
7 Argentina $0 $0 $0 $0 $17 $0 $0 $0
8 Belgium-Luxembourg $201 $283 $439 $0 $0 $0 $0 $0
9 Canada $0 $15 $0 $255 $26 $4 $5 $0
10 China $0 $0 $3 $0 $0 $8 $0 $0
11 Chile $36 $0 $0 $6,266 $0 $0 $0 $0
12 Colombia $3 $0 $42 $0 $2,346 $0 $0 $0
13 Egypt $0 $0 $0 $0 $0 $0 $3 $0
14 Ireland $0 $0 $0 $5,359 $9,671 $0 $0 $0
15 Finland $253 $0 $0 $0 $0 $0 $0 $0
16 Guatemala $0 $10 $0 $0 $0 $2,334 $0 $0
17 Hong Kong $0 $0 $39 $0 $0 $0 $0 $0
18 India $0 $21 $14 $0 $0 $0 $0 $0
19 Japan $0 $13,534 $7,080 $17,429 $2,952 $10,585 $10,065 $0
20 Korea, South $16 $39 $501 $130 $0 $0 $0 $0
21 New Zealand $0 $7 $0 $0 $0 $0 $14 $0
22 Peru $0 $0 $3,457 $0 $0 $0 $0 $0
23 Philippines $0 $0 $53 $363 $0 $5,244 $126 $0
24 Thailand $146 $0 $0 $0 $0 $0 $0 $0
25 Turkey $0 $0 $0 $0 $0 $12,053 $0 $0
26 Taiwan $8 $210 $676 $558 $0 $0 $0 $0
Total $7,587 $20,759 $14,783 $32,905 $27,978 $75,742 $50,149 $76,870 Source: USDA Foreign Agricultural Service

114
Exhibit 4.3.4 – Missouri Soybean Oil Export Trading Partners, Thousand Dollars
2011 Rank Country 2004 2005 2006 2007 2008 2009 2010 2011
1 Mexico $0 $0 $412 $11,857 $31,613 $40,309 $96,355 $59,136
2 Colombia $0 $0 $0 $0 $0 $0 $0 $73
3 Saudi Arabia $0 $0 $0 $0 $0 $0 $27 $65
4 Lebanon $0 $0 $0 $0 $0 $0 $0 $51
5 Canada $3 $145 $29 $234 $4,579 $77 $99 $38
6 Bahamas, The $0 $0 $0 $0 $63 $0 $0 $0
7 China $0 $0 $6 $0 $0 $0 $0 $0
8 Guatemala $2,710 $4,695 $0 $0 $0 $0 $0 $0
9 India $0 $58 $0 $0 $0 $0 $0 $0
10 Madagascar $4,203 $3,631 $0 $0 $0 $0 $0 $0
11 Malawi $1,334 $1,552 $721 $0 $0 $0 $0 $0
12 Malaysia $0 $51 $23 $0 $0 $18 $0 $0
13 New Zealand $0 $0 $0 $0 $0 $0 $41 $0
14 Philippines $0 $0 $5 $0 $0 $0 $0 $0
15 Singapore $0 $0 $0 $0 $6 $0 $0 $0
16 Trinidad and Tobago $0 $0 $0 $0 $0 $0 $121 $0
Total $8,250 $10,133 $1,196 $12,091 $36,261 $40,403 $96,683 $59,363 Source: USDA Foreign Agricultural Service
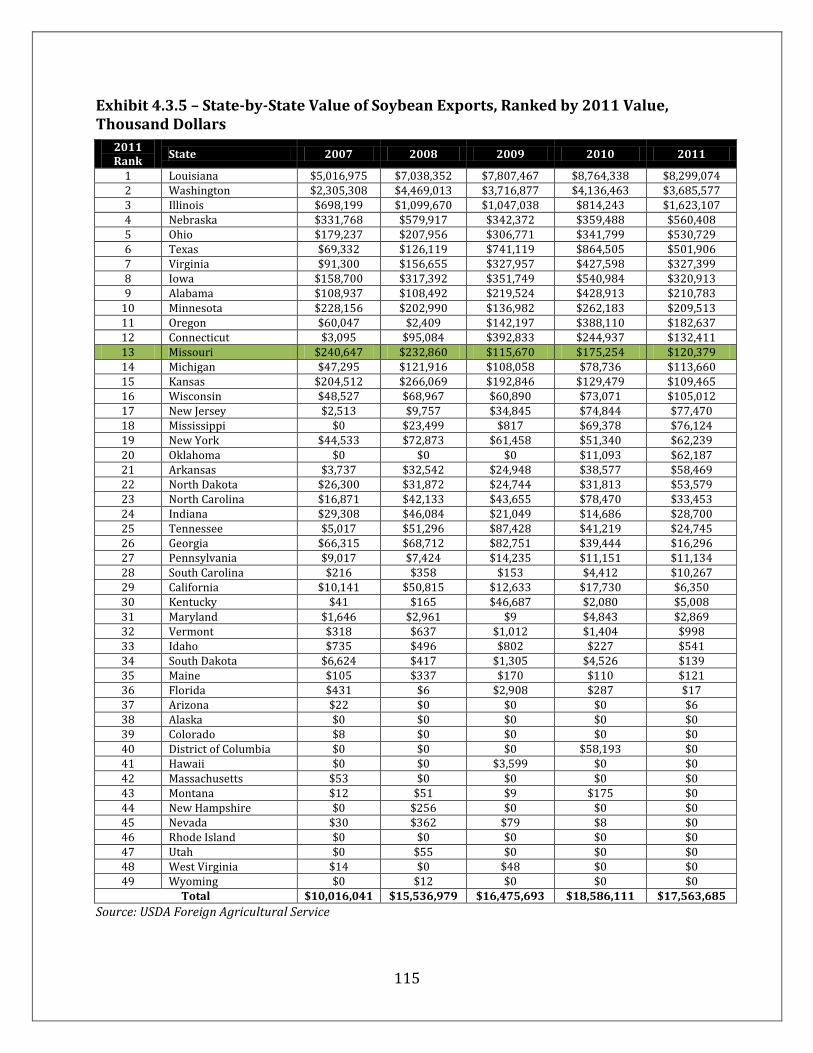
115
Exhibit 4.3.5 – State-by-State Value of Soybean Exports, Ranked by 2011 Value, Thousand Dollars
2011 Rank
State 2007 2008 2009 2010 2011
1 Louisiana $5,016,975 $7,038,352 $7,807,467 $8,764,338 $8,299,074 2 Washington $2,305,308 $4,469,013 $3,716,877 $4,136,463 $3,685,577 3 Illinois $698,199 $1,099,670 $1,047,038 $814,243 $1,623,107 4 Nebraska $331,768 $579,917 $342,372 $359,488 $560,408 5 Ohio $179,237 $207,956 $306,771 $341,799 $530,729 6 Texas $69,332 $126,119 $741,119 $864,505 $501,906 7 Virginia $91,300 $156,655 $327,957 $427,598 $327,399 8 Iowa $158,700 $317,392 $351,749 $540,984 $320,913 9 Alabama $108,937 $108,492 $219,524 $428,913 $210,783
10 Minnesota $228,156 $202,990 $136,982 $262,183 $209,513 11 Oregon $60,047 $2,409 $142,197 $388,110 $182,637 12 Connecticut $3,095 $95,084 $392,833 $244,937 $132,411 13 Missouri $240,647 $232,860 $115,670 $175,254 $120,379 14 Michigan $47,295 $121,916 $108,058 $78,736 $113,660 15 Kansas $204,512 $266,069 $192,846 $129,479 $109,465 16 Wisconsin $48,527 $68,967 $60,890 $73,071 $105,012 17 New Jersey $2,513 $9,757 $34,845 $74,844 $77,470 18 Mississippi $0 $23,499 $817 $69,378 $76,124 19 New York $44,533 $72,873 $61,458 $51,340 $62,239 20 Oklahoma $0 $0 $0 $11,093 $62,187 21 Arkansas $3,737 $32,542 $24,948 $38,577 $58,469 22 North Dakota $26,300 $31,872 $24,744 $31,813 $53,579 23 North Carolina $16,871 $42,133 $43,655 $78,470 $33,453 24 Indiana $29,308 $46,084 $21,049 $14,686 $28,700 25 Tennessee $5,017 $51,296 $87,428 $41,219 $24,745 26 Georgia $66,315 $68,712 $82,751 $39,444 $16,296 27 Pennsylvania $9,017 $7,424 $14,235 $11,151 $11,134 28 South Carolina $216 $358 $153 $4,412 $10,267 29 California $10,141 $50,815 $12,633 $17,730 $6,350 30 Kentucky $41 $165 $46,687 $2,080 $5,008 31 Maryland $1,646 $2,961 $9 $4,843 $2,869 32 Vermont $318 $637 $1,012 $1,404 $998 33 Idaho $735 $496 $802 $227 $541 34 South Dakota $6,624 $417 $1,305 $4,526 $139 35 Maine $105 $337 $170 $110 $121 36 Florida $431 $6 $2,908 $287 $17 37 Arizona $22 $0 $0 $0 $6 38 Alaska $0 $0 $0 $0 $0 39 Colorado $8 $0 $0 $0 $0 40 District of Columbia $0 $0 $0 $58,193 $0 41 Hawaii $0 $0 $3,599 $0 $0 42 Massachusetts $53 $0 $0 $0 $0 43 Montana $12 $51 $9 $175 $0 44 New Hampshire $0 $256 $0 $0 $0 45 Nevada $30 $362 $79 $8 $0 46 Rhode Island $0 $0 $0 $0 $0 47 Utah $0 $55 $0 $0 $0 48 West Virginia $14 $0 $48 $0 $0 49 Wyoming $0 $12 $0 $0 $0
Total $10,016,041 $15,536,979 $16,475,693 $18,586,111 $17,563,685
Source: USDA Foreign Agricultural Service

116
Exhibit 4.3.6 – State-by-State Value of Soybean Meal Exports, Ranked by 2011 Value, Thousand Dollars
2011 Rank State 2007 2008 2009 2010 2011 1 Louisiana $804,145 $1,138,039 $1,257,175 $1,267,066 $1,221,427 2 Iowa $281,281 $259,881 $252,701 $312,907 $263,819 3 Virginia $100,102 $210,893 $257,966 $235,923 $249,152 4 Washington $66,461 $240,248 $317,441 $485,453 $217,171 5 Minnesota $154,610 $183,944 $144,031 $114,965 $157,114 6 Arizona $93,645 $133,097 $133,709 $118,765 $121,715 7 Nebraska $33,015 $47,509 $72,354 $64,355 $100,761 8 Illinois $42,665 $130,183 $134,382 $91,233 $80,695 9 Missouri $32,905 $27,978 $75,742 $50,136 $76,870
10 Georgia $21,197 $111,109 $157,586 $173,240 $76,435 11 South Dakota $35,495 $58,100 $43,404 $49,731 $67,226 12 Michigan $252 $1,115 $1,009 $495 $16,324 13 Kansas $3,253 $4,882 $13,024 $9,132 $13,373 14 Kentucky $7 $109 $48 $10 $7,109 15 West Virginia $0 $0 $0 $8,250 $6,000 16 Maryland $145 $366 $217 $6,376 $5,610 17 North Dakota $3,843 $1,973 $1,355 $1,046 $5,457 18 Oklahoma $2,975 $2,827 $4,121 $4,222 $4,237 19 Montana $1,755 $2,271 $1,957 $2,368 $3,126 20 Oregon $50 $6 $4,289 $1,193 $1,732 21 Florida $24 $17 $51 $62 $1,379 22 Ohio $1,075 $8,151 $14,590 $2,098 $1,136 23 Texas $764 $683 $178 $524 $890 24 California $1,650 $8,736 $4,859 $3,182 $886 25 Tennessee $630 $762 $882 $695 $599 26 New York $2,366 $9,830 $28,168 $4,271 $379 27 Utah $0 $0 $48 $0 $356 28 Arkansas $420 $0 $116 $0 $226 29 North Carolina $0 $180 $1,452 $566 $189 30 Wisconsin $0 $17 $46 $39 $95 31 New Jersey $0 $0 $261 $394 $52 32 South Carolina $7 $8 $0 $263 $50 33 Indiana $205 $9,270 $14,074 $5,366 $30 34 Nevada $3 $0 $0 $0 $20 35 Connecticut $0 $5,000 $65,740 $82,437 $10 36 Alabama $0 $173 $0 $0 $0 37 Delaware $0 $28 $20 $48 $0 38 Hawaii $0 $109 $0 $0 $0 39 Idaho $14 $189 $154 $67 $0 40 Massachusetts $0 $15 $0 $440 $0 41 Maine $0 $0 $0 $0 $0 42 Mississippi $0 $0 $0 $154 $0 43 New Mexico $0 $0 $38 $9 $0 44 Pennsylvania $104 $83 $0 $0 $0
Total $1,685,062 $2,597,780 $3,003,189 $3,097,481 $2,701,652
Source: USDA Foreign Agricultural Service
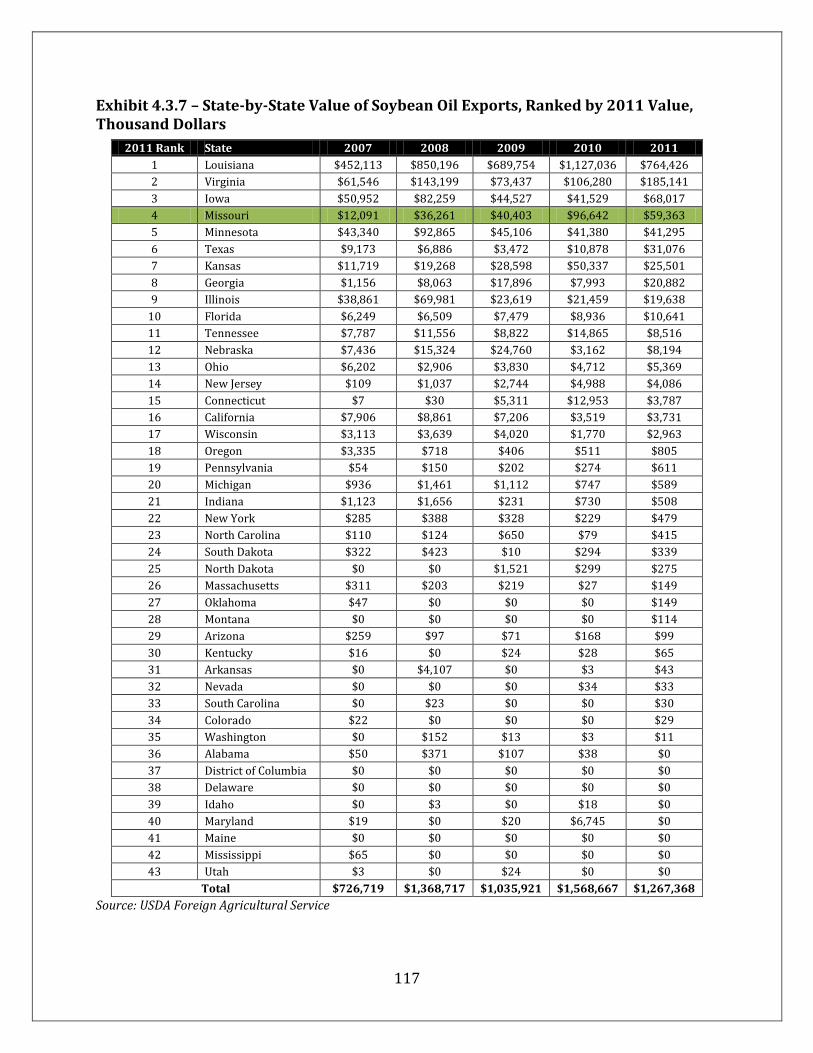
117
Exhibit 4.3.7 – State-by-State Value of Soybean Oil Exports, Ranked by 2011 Value, Thousand Dollars
2011 Rank State 2007 2008 2009 2010 2011
1 Louisiana $452,113 $850,196 $689,754 $1,127,036 $764,426
2 Virginia $61,546 $143,199 $73,437 $106,280 $185,141
3 Iowa $50,952 $82,259 $44,527 $41,529 $68,017
4 Missouri $12,091 $36,261 $40,403 $96,642 $59,363
5 Minnesota $43,340 $92,865 $45,106 $41,380 $41,295
6 Texas $9,173 $6,886 $3,472 $10,878 $31,076
7 Kansas $11,719 $19,268 $28,598 $50,337 $25,501
8 Georgia $1,156 $8,063 $17,896 $7,993 $20,882
9 Illinois $38,861 $69,981 $23,619 $21,459 $19,638
10 Florida $6,249 $6,509 $7,479 $8,936 $10,641
11 Tennessee $7,787 $11,556 $8,822 $14,865 $8,516
12 Nebraska $7,436 $15,324 $24,760 $3,162 $8,194
13 Ohio $6,202 $2,906 $3,830 $4,712 $5,369
14 New Jersey $109 $1,037 $2,744 $4,988 $4,086
15 Connecticut $7 $30 $5,311 $12,953 $3,787
16 California $7,906 $8,861 $7,206 $3,519 $3,731
17 Wisconsin $3,113 $3,639 $4,020 $1,770 $2,963
18 Oregon $3,335 $718 $406 $511 $805
19 Pennsylvania $54 $150 $202 $274 $611
20 Michigan $936 $1,461 $1,112 $747 $589
21 Indiana $1,123 $1,656 $231 $730 $508
22 New York $285 $388 $328 $229 $479
23 North Carolina $110 $124 $650 $79 $415
24 South Dakota $322 $423 $10 $294 $339
25 North Dakota $0 $0 $1,521 $299 $275
26 Massachusetts $311 $203 $219 $27 $149
27 Oklahoma $47 $0 $0 $0 $149
28 Montana $0 $0 $0 $0 $114
29 Arizona $259 $97 $71 $168 $99
30 Kentucky $16 $0 $24 $28 $65
31 Arkansas $0 $4,107 $0 $3 $43
32 Nevada $0 $0 $0 $34 $33
33 South Carolina $0 $23 $0 $0 $30
34 Colorado $22 $0 $0 $0 $29
35 Washington $0 $152 $13 $3 $11
36 Alabama $50 $371 $107 $38 $0
37 District of Columbia $0 $0 $0 $0 $0
38 Delaware $0 $0 $0 $0 $0
39 Idaho $0 $3 $0 $18 $0
40 Maryland $19 $0 $20 $6,745 $0
41 Maine $0 $0 $0 $0 $0
42 Mississippi $65 $0 $0 $0 $0
43 Utah $3 $0 $24 $0 $0
Total $726,719 $1,368,717 $1,035,921 $1,568,667 $1,267,368
Source: USDA Foreign Agricultural Service


