
The 2009 Recovery Act: Directly Created and Saved Jobs ... · PDF fileFederal Reserve Bank of...
24
Federal Reserve Bank of St. Louis REVIEW Second Quarter 2014 123 The 2009 Recovery Act: Directly Created and Saved Jobs Were Primarily in Government Bill Dupor I n February 2009, the U.S. federal government began its largest anti-recession fiscal stimulus in over 70 years when it passed the American Recovery and Reinvestment Act (ARRA; i.e., the Recovery Act). 1 The Congressional Budget Office (CBO)’s most recent assessment is that the cost of the Act will eventually total $821 billion. 2 This article studies the employment effects of the stimulus using a new dataset. 3 The data consist of legally mandated reports provided by the universe of awardees of stimulus funds. In particular, each recipient of a contract, grant, or loan was required to file a report every three months that included a self-constructed estimate of the number of jobs Over one-half of the fiscal spending component of the American Recovery and Reinvestment Act (ARRA; i.e., the Recovery Act) was allocated via grants, loans, and contracts. Businesses, nonprofits, and nonfederal government agencies that received this type of stimulus funding were required to report the number of jobs directly created and saved as a result of their funding. Created and saved jobs represent, precisely, the full-time equivalent of jobs funded by first- and second-tier recipients of and contractors on ARRA grants, loans, and contracts. In this article, the author categorizes these jobs into either the private sector (businesses and nonprofits) or the government sector. It is estimated that at the one-year mark following the start of the stimulus, 166,000 of the 682,000 jobs directly created/ saved were in the private sector. Examples of private sector stimulus jobs include social workers hired by nonprofit groups to assist families, mechanics to repair buses for public transportation, and con- struction workers to repave highways. Examples of government stimulus jobs include public school teachers, civil servants employed at state agencies, and police officers. While fewer than one of four stimulus jobs were in the private sector, more than seven of nine jobs in the U.S. economy overall reside in the private sector. Thus, stimulus-funded jobs were heavily tilted toward government. (JEL E6, H7) Federal Reserve Bank of St. Louis Review, Second Quarter 2014, 96(2), pp. 123-45. Bill Dupor is an assistant vice president and economist at the Federal Reserve Bank of St. Louis. The author thanks John Childs for providing data collected by the Ohio Department of Education and Tim Conley, Duane Dupor, Bill Gavin, Matt Lewis, Mike McCracken, Stephanie Moulton, Jay Shambaugh, and David Wheelock for useful comments and conversations. Alex Bruner and Peter McCrory provided excellent research assistance. A repository containing government documents, data sources, a subject bibliography, and other relevant information pertaining to the Recovery Act is available at billdupor.weebly.com. © 2014, The Federal Reserve Bank of St. Louis. The views expressed in this article are those of the author(s) and do not necessarily reflect the views of the Federal Reserve System, the Board of Governors, or the regional Federal Reserve Banks. Articles may be reprinted, reproduced, published, distributed, displayed, and transmitted in their entirety if copyright notice, author name(s), and full citation are included. Abstracts, synopses, and other derivative works may be made only with prior written permission of the Federal Reserve Bank of St. Louis.
Transcript of The 2009 Recovery Act: Directly Created and Saved Jobs ... · PDF fileFederal Reserve Bank of...

Federal Reserve Bank of St. Louis REVIEW Second Quarter 2014 123
The 2009 Recovery Act: Directly Created and Saved Jobs Were Primarily in Government
Bill Dupor
I n February 2009, the U.S. federal government began its largest anti-recession fiscalstimulus in over 70 years when it passed the American Recovery and Reinvestment Act(ARRA; i.e., the Recovery Act).1 The Congressional Budget Office (CBO)’s most recent
assessment is that the cost of the Act will eventually total $821 billion.2 This article studiesthe employment effects of the stimulus using a new dataset.3
The data consist of legally mandated reports provided by the universe of awardees ofstimulus funds. In particular, each recipient of a contract, grant, or loan was required to filea report every three months that included a self-constructed estimate of the number of jobs
Over one-half of the fiscal spending component of the American Recovery and Reinvestment Act(ARRA; i.e., the Recovery Act) was allocated via grants, loans, and contracts. Businesses, nonprofits,and nonfederal government agencies that received this type of stimulus funding were required toreport the number of jobs directly created and saved as a result of their funding. Created and savedjobs represent, precisely, the full-time equivalent of jobs funded by first- and second-tier recipients ofand contractors on ARRA grants, loans, and contracts. In this article, the author categorizes these jobsinto either the private sector (businesses and nonprofits) or the government sector. It is estimated thatat the one-year mark following the start of the stimulus, 166,000 of the 682,000 jobs directly created/saved were in the private sector. Examples of private sector stimulus jobs include social workers hiredby nonprofit groups to assist families, mechanics to repair buses for public transportation, and con-struction workers to repave highways. Examples of government stimulus jobs include public schoolteachers, civil servants employed at state agencies, and police officers. While fewer than one of fourstimulus jobs were in the private sector, more than seven of nine jobs in the U.S. economy overallreside in the private sector. Thus, stimulus-funded jobs were heavily tilted toward government. (JEL E6, H7)
Federal Reserve Bank of St. Louis Review, Second Quarter 2014, 96(2), pp. 123-45.
Bill Dupor is an assistant vice president and economist at the Federal Reserve Bank of St. Louis. The author thanks John Childs for providing datacollected by the Ohio Department of Education and Tim Conley, Duane Dupor, Bill Gavin, Matt Lewis, Mike McCracken, Stephanie Moulton, JayShambaugh, and David Wheelock for useful comments and conversations. Alex Bruner and Peter McCrory provided excellent research assistance.A repository containing government documents, data sources, a subject bibliography, and other relevant information pertaining to the RecoveryAct is available at billdupor.weebly.com.
© 2014, The Federal Reserve Bank of St. Louis. The views expressed in this article are those of the author(s) and do not necessarily reflect the viewsof the Federal Reserve System, the Board of Governors, or the regional Federal Reserve Banks. Articles may be reprinted, reproduced, published,distributed, displayed, and transmitted in their entirety if copyright notice, author name(s), and full citation are included. Abstracts, synopses, andother derivative works may be made only with prior written permission of the Federal Reserve Bank of St. Louis.
directly created and/or saved as a result of its stimulus funding, as well as a general descriptionof these jobs. Created and saved jobs represent, precisely, the full-time equivalent (FTE) ofjobs funded by first- and second-tier awardees of and contractors on ARRA grants, loans,and contracts.4
Using these reports, I estimate that at the one-year mark of the program, 166,000 of the682,000 jobs directly created or saved by the Act were in the private sector. Thus, fewer thanone of four stimulus jobs were in the private sector. In contrast, more than seven of nine jobsin the U.S. economy overall reside in the private sector.5
To my knowledge, this article is the first that uses direct survey evidence to assess howmany private sector and government jobs were funded by the Recovery Act. Recent years haveseen an ongoing public debate on the differences (or lack thereof) of the stimulative effects ofthe two types of employment.
While limited in quantity, the direct creation/saving of private sectors jobs was not trivial.For example, the U.S. Department of Transportation administered ARRA projects that directlycreated and saved thousands of private sector jobs, most of which were in the depressed con-struction industry; however, transportation jobs made up less than 5 percent of all jobsreported in this period.
This article provides an empirical contribution to the debate on the ability of the govern-ment to stimulate the private economy, with particular focus on jobs. One view expressed inthis debate is that there is little difference between private and government employment.“‘Spending is spending,’ said Lawrence J. White, an economist at New York University’s SternSchool of Business. There is no difference in the multiplier effect from a private sector job ora public sector job” (see Jacobson, 2013). Similarly, in a discussion of the composition of jobscreated by the Recovery Act, Blinder (2013, p. 226) writes, “Aren’t government jobs jobs?”
An alternative view holds that, with respect to boosting the economy, jobs created in theprivate sector are likely to be more effective stimulus and that the government is ineffective atprivate sector job creation. In a letter to President Obama sent in February 2011, 150 econo-mists from universities and research institutes signed this statement: “Efforts to spark privatesector job creation through government ‘stimulus’ spending have been unsuccessful.” The lettergoes on: “To support real economic growth and support the creation of private sector jobs,immediate action is needed to rein in federal spending.”6 Along these same lines, Cohen, Coval,and Malloy (2011) find that state-level fiscal spending shocks, driven by changes in the senior-ity of various U.S. Congress members, caused a decrease in the corresponding states’ corporateemployment and investment.
The outcome that I document has a different flavor than the one predicted by advisers toPresident-elect Obama. On January 9, 2009, Jared Bernstein and Christina Romer wrote “Morethan 90 percent of the jobs created are likely to be in the private sector.”7,8
My estimate is also different from at least one media report assessing the results of thestimulus. A Timemagazine article from February 2010 entitled “After One Year, a StimulusReport Card,” states “about half of the jobs that the government counts as created by thestimulus were state- or local-government-funded positions” (Gandel, 2010).
Dupor
124 Second Quarter 2014 Federal Reserve Bank of St. Louis REVIEW

Analyzing the recipient-reported job creation data provides a new and distinct way toevaluate the stimulus. Other existing methods include aggregate time series analysis and cross-sectional studies. Cross-sectional studies on Recovery Act spending have found a positive,statistically significant jobs effect; however, this job creation was very expensive. Wilson (2012)finds that increasing employment by one worker at the one-year mark of the Act cost $125,000.Conley and Dupor (2013) find that, over the first two years following the Act’s passage, it cost$202,000 to create a job lasting one year.9 Given that the typical employment compensation(wages plus benefits) to a worker in a U.S. job is roughly $40,000 per year, the benchmark pointestimates from these studies suggest that the Recovery Act created/saved a job at a cost ofroughly three to five times that of the typical compensation.
The recipient-reported data have an advantage over these other methods in that they donot require any identification or statistical modeling assumptions. Furthermore, this datasetis an analog to existing surveys that ask respondents how they would (or did) put a particulartax cut or rebate to use (e.g., spend or save the tax savings), such as Shapiro and Slemrod (2003,2009). As with those approaches, the responses alone should not be interpreted as the program’sentire aggregate effects. One reason is that they do not take into account general equilibriumeffects of fiscal policy.
The recipient-reported data do suffer from a drawback that may be less significant in otherapproaches. The recipient-reported jobs are only those directly created/saved due to this fed-eral spending. These data will tend to overstate true job creation if the direct government jobscrowd out private sector employment that would have occurred. On the other hand, these datawill tend to understate true job creation to the extent that there are jobs “indirectly” createdby the spending. Moreover, these data will not include the jobs created indirectly as a result ofthe tax cut and transfer component of the stimulus.
BACKGROUND ON RECIPIENT-REPORTED DATAAward Hierarchy and Definition of a Job Saved/Created
The Recovery Accountability and Transparency Board (RATB) was created by the Act andone of the Board’s responsibilities was to collect a wide variety of data from primary recipients,known as recipient reports.10 Primary recipients are one of the four “recipient roles” establishedby the Board. The other three are sub-recipients, primary vendors, and sub-vendors. Figure 1illustrates the relationship between the roles. Primary recipients receive award funds fromgrants, loans, or contracts. Sub-recipients receive stimulus funds though the primary recipients.Vendors and sub-vendors sell goods and services to primary recipients and sub-recipients,respectively.
The responsibility for filing quarterly reports rested with the primary recipients. Onerequired survey field that each recipient had to complete was titled “Number of Jobs.” TheRATB (2010, p. 19) contains a description of that data field: “Jobs created and retained. Anestimate of the combined number of jobs created and jobs retained funded by the RecoveryAct during the current reporting quarter in the United States and outlying areas.”11 The field
Dupor
Federal Reserve Bank of St. Louis REVIEW Second Quarter 2014 125
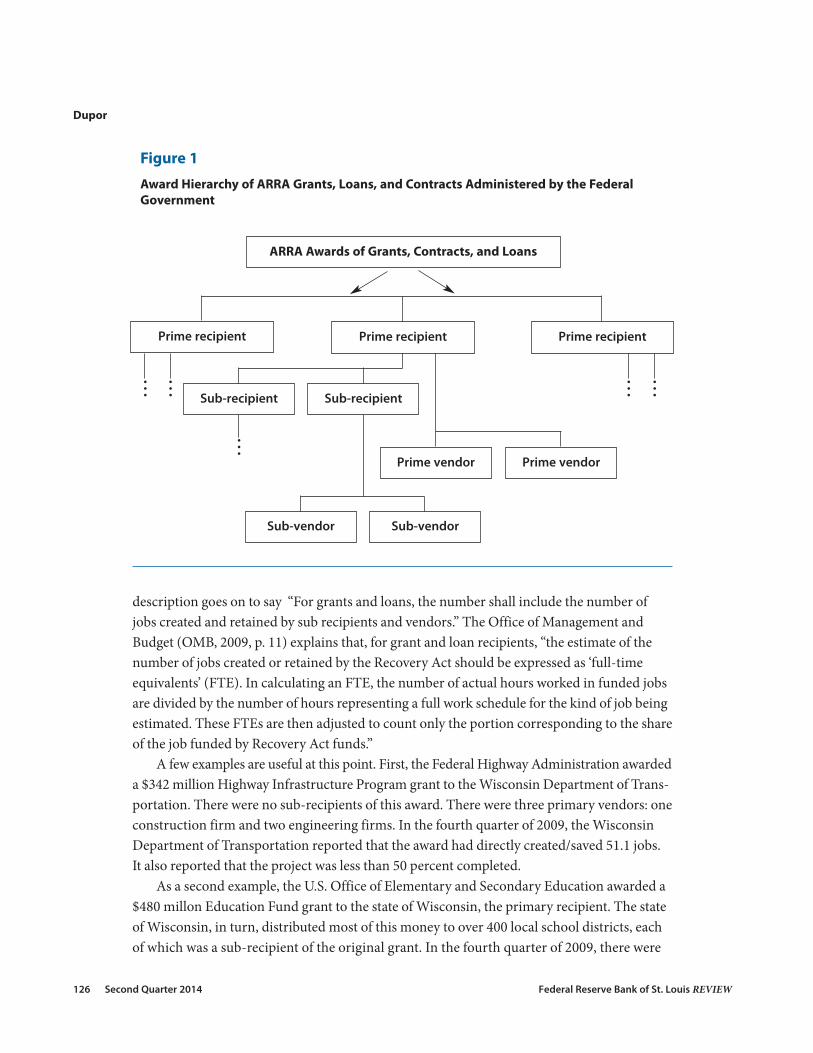
description goes on to say “For grants and loans, the number shall include the number ofjobs created and retained by sub recipients and vendors.” The Office of Management andBudget (OMB, 2009, p. 11) explains that, for grant and loan recipients, “the estimate of thenumber of jobs created or retained by the Recovery Act should be expressed as ‘full-timeequivalents’ (FTE). In calculating an FTE, the number of actual hours worked in funded jobsare divided by the number of hours representing a full work schedule for the kind of job beingestimated. These FTEs are then adjusted to count only the portion corresponding to the shareof the job funded by Recovery Act funds.”
A few examples are useful at this point. First, the Federal Highway Administration awardeda $342 million Highway Infrastructure Program grant to the Wisconsin Department of Trans -portation. There were no sub-recipients of this award. There were three primary vendors: oneconstruction firm and two engineering firms. In the fourth quarter of 2009, the WisconsinDepartment of Transportation reported that the award had directly created/saved 51.1 jobs.It also reported that the project was less than 50 percent completed.
As a second example, the U.S. Office of Elementary and Secondary Education awarded a$480 millon Education Fund grant to the state of Wisconsin, the primary recipient. The stateof Wisconsin, in turn, distributed most of this money to over 400 local school districts, eachof which was a sub-recipient of the original grant. In the fourth quarter of 2009, there were
Dupor
126 Second Quarter 2014 Federal Reserve Bank of St. Louis REVIEW
Figure 1
Award Hierarchy of ARRA Grants, Loans, and Contracts Administered by the FederalGovernment
ARRA Awards of Grants, Contracts, and Loans
Prime recipient Prime recipient
Prime vendor Prime vendor
Sub-vendor Sub-vendor
Prime recipient
Sub-recipientSub-recipient⫶ ⫶ ⫶ ⫶⫶

10 sub-vendors on the grant. These were due to expenses created by some sub-recipients tobusinesses, such as Apple Inc. for computers. At that time, there were no primary vendors,indicating that the primary recipient did not directly buy from vendors. In that quarter, thestate of Wisconsin reported that the award had directly created/saved 3,951.56 jobs. Withrespect to data quality, the recipient-reported jobs data have been scrutinized by state andfederal auditors, congressional committees, media organizations, and private citizens.
A Government Accountability Office (GAO, 2009) report based on the third-quarterrecipient reports of that year did find some questionable data entries. For example, roughly4,000 of the more than 100,000 recipient reports showed “no dollar amount received orexpended but included more than 50,000 jobs created or retained.” This 50,000 is not trivial,but it is relatively small compared with the 682,000 total jobs reported. In addition, there were“9,247 reports that showed no jobs but included expended amounts approaching $1 billion.”In total, this $1 billion represented less than 2.3 percent of the aid covered by these reportingrequirements through the third quarter of 2009. The GAO report did not explore how manyof these awards may have generated expenditures without creating jobs. Finally, the GAOfound other reporting anomalies but stated that they were “relatively small in number.”
The GAO report (2009) concluded with four recommendations to the OMB to improvethe consistency of data collection and reporting. On its website, the GAO posted that two ofits recommendations were adopted by the OMB though a December 2009 OMB memo toARRA fund recipients. One major point of the OMB memo was that “the recipients will nolonger be required to make a subjective judgment on whether jobs were created or retained asa result of the Recovery Act. Instead, recipients will more easily and objectively report on jobsfunded with Recovery Act dollars.” One of the two recommendations not adopted was movingto an hours worked, wages paid model instead of one of jobs created and saved. The otherrecommendation that was not adopted was that the “OMB continue working with federalagencies to provide or improve program-specific guidance to assist recipients, especially as itapplies to the full-time equivalent calculation for individual programs.”
Since the data I consider are from the first-quarter 2010 report, the RATB and OMBchanges resulting from the GAO report may have improved the quality of reports. Unfortu -nately, the GAO has not issued a comprehensive follow-up (to its November 2009 analysis)of the recipient-reported jobs data. On this point, a GAO report (2011) specifically regardingU.S. Department of Energy ARRA funding did find that “the quality of FTE data reported byrecipients to FederalReporting.gov has improved over time.”
There have been relatively few cases of fraud in the recipient reports. Grabell (2012, p. 285)writes that the RATB received more than 7,500 complaints, which led to over 1,500 investiga-tions. “Only about two hundred cases had resulted in criminal convictions, as of the fall of 2011.”
An Algorithm for Categorizing Job Types
Neither the recipients nor the ARRA oversight board categorizes jobs into the privatesector or the government sector; therefore, I perform this task using a three-step procedureas diagrammed in Figure 2.
Dupor
Federal Reserve Bank of St. Louis REVIEW Second Quarter 2014 127

Step A. In the first stage (designated “Step A” in Figure 2), I assign all created/saved jobsthat resulted from stimulus contracts (as opposed to grants and loans) as private sector jobs.My reason is as follows. Analysis of the contract data reveals that the stimulus contracts over-whelmingly were between an agency of the federal government and a private business.
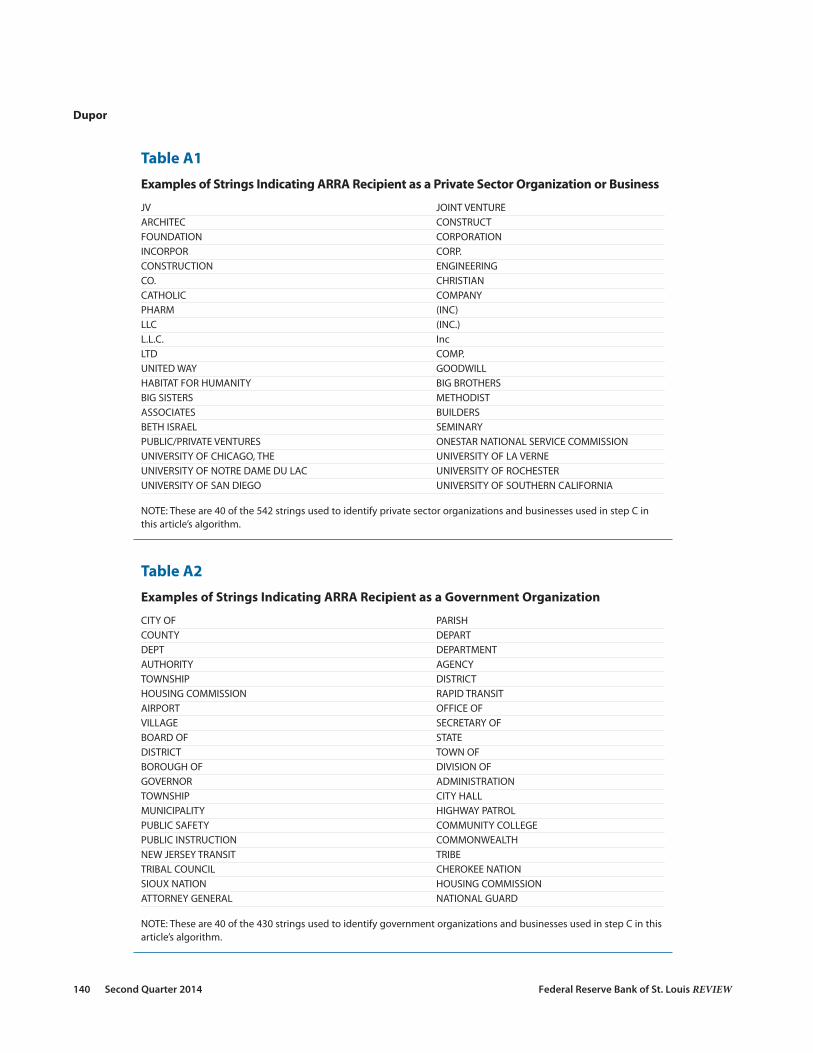
Step B. In the second stage (“Step B”), I begin by sorting each remaining primary recipientinto either a government organization or a private sector organization by using the recipient’sname. Many recipients were assigned by searching within each name for “flags” (i.e., wordsand abbreviations) that indicate a government or private sector organization. For example, if“CITY OF” appears in a recipient’s name, it is categorized as a government organization. If“CORPORATION” appears in a recipient’s name, it is categorized as part of the private sector.Tables A1 and A2 in the appendix contain sample lists of flags used. If the primary recipient’s
Dupor
128 Second Quarter 2014 Federal Reserve Bank of St. Louis REVIEW
Figure 2
Algorithm for Determining Allocation of 100 Created/Saved Jobs Between Private Sectorand Government
NOTE: See Tables A1 and A2 for common flags to indicate private and government primary awardees (applied in step B).
Step AIs award X in the form of a contract(rather than as a loan or grant)?
Step BDoes the primary awardee of Xhave a name indicating a private
sector or government organization?
Step CTo which type (I, II, or III) does thefederal agency awarding X belong?
100Private sectorjobs created
100Private sectorjobs created
98Private sectorjobs created
50Private sectorjobs created
2Private sectorjobs created
No
Yes
Private sectorname
Type I(e.g., Transportation)
(e.g., Education)
Type II(e.g., Housing andUrban Development)
Government name
Type III

name indicates a private sector organization, I assign all of this recipient’s created/saved jobsto the private sector.
One choice I must make in this step is to define a government organization. An organiza-tion is treated as part of a government if operational control is by a person or persons servingin the role of a government official or by a person appointed by a government official or agency.The above definitions imply straightforwardly that teachers at public schools and employeesat state agencies are part of the government sector. Public state universities, such as the Uni -versity of Wisconsin, are treated as part of government as well because the operational controlof a public state university may be in the hands of a private organization whose members aredesignated by a state government official. For example, a public university may be controlledby a board of regents (a private organization), but the regents are selected mainly by state gov-ernment official(s), such as the state’s governor.
This definition also clearly implies that private businesses are not part of the governmentsector. The ownership of a private company, and therefore its direct control, lies outside thehands of a government or government-appointed official. This is not to say that a nongovern-ment organization may not receive funds from the government. For example, although a pri-vate construction company may enter into a legal contract to create a highway for a state’sdepartment of transportation, the operational control of the organization is beyond the handsof government. Similarly, a charity, such as the United Way, may receive funding from a govern-ment, but my definition implies that it is not part of government. A private organization is anyorganization that is not part of government, which includes both businesses and nonprofits.
Approximately 1,750 recipients remained uncategorized after applying the above proce-dure. A research assistant and I split the task of manually assessing the status of each remain-ing recipient and assigning each to the private sector or government. This process almostalways involved locating a website for the organization and reading its description and orga -nization structure. After this manual assignment, 2.6 percent of created/saved jobs had notbeen categorized.
Step C.The third step (“Step C” in Figure 2) is an attempt to distinguish how many privatesector jobs were created/saved through a grant or loan received by a primary recipient if therecipient is a government organization. Step C is necessary because a primary recipient can useits award to purchase goods or services from vendors and sub-vendors and also make sub-awards to sub-recipients. As explained above, only the primary recipient reports the jobscreated/saved and this single number is the sum of jobs created/saved from the entire award.Vendors and sub-vendors are in the private sector and sub-recipients may also be in the privatesector.12 If it is assumed that all jobs created by awards for which the primary recipient waspart of government are government jobs, it might cause an understatement of the number ofprivate sector jobs created/saved.
To address this issue, I examine in turn each federal agency responsible for awardingRecovery Act funds. Based on the awarding federal agency, I allocate the created/saved jobsbetween the government and private sector, which amounts to assigning each agency a “pri-vate sector percentage.” I use three different private sector percentages: 98 percent (mostlyprivate sector, or type I); 50 percent (one-half private sector, or type II); and 2 percent (limited
Dupor
Federal Reserve Bank of St. Louis REVIEW Second Quarter 2014 129
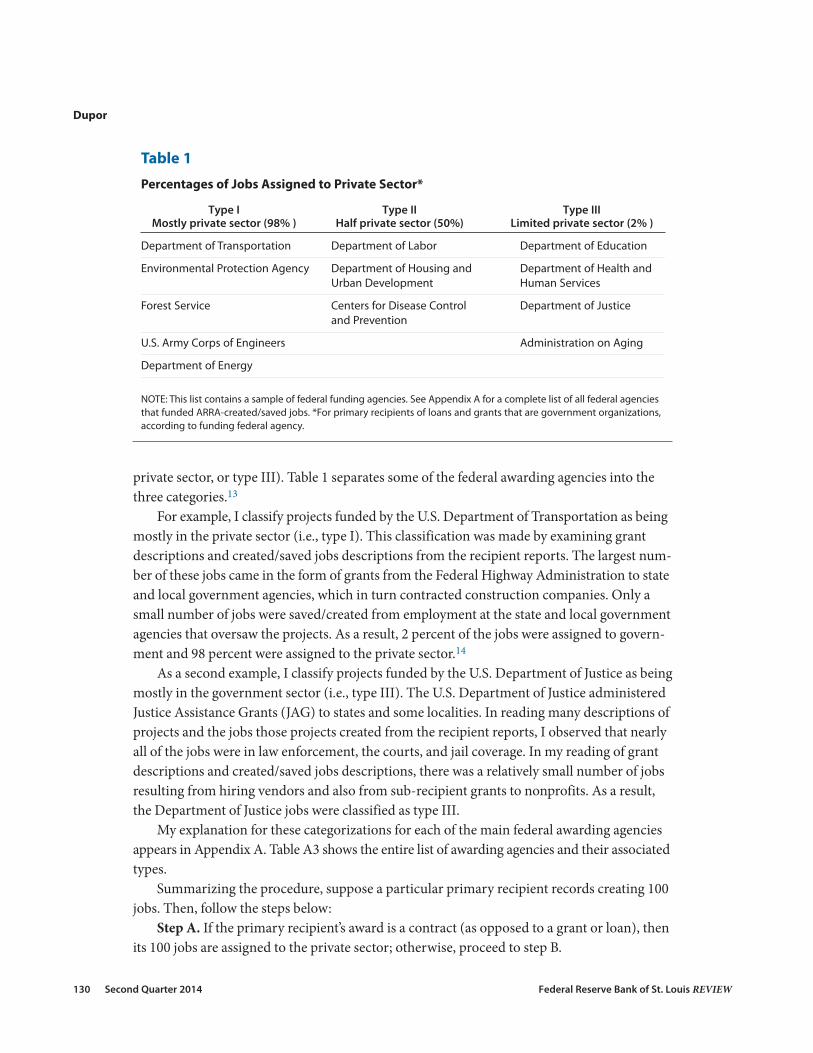
private sector, or type III). Table 1 separates some of the federal awarding agencies into thethree categories.13
For example, I classify projects funded by the U.S. Department of Transportation as beingmostly in the private sector (i.e., type I). This classification was made by examining grantdescriptions and created/saved jobs descriptions from the recipient reports. The largest num-ber of these jobs came in the form of grants from the Federal Highway Administration to stateand local government agencies, which in turn contracted construction companies. Only asmall number of jobs were saved/created from employment at the state and local governmentagencies that oversaw the projects. As a result, 2 percent of the jobs were assigned to govern-ment and 98 percent were assigned to the private sector.14
As a second example, I classify projects funded by the U.S. Department of Justice as beingmostly in the government sector (i.e., type III). The U.S. Department of Justice administeredJustice Assistance Grants (JAG) to states and some localities. In reading many descriptions ofprojects and the jobs those projects created from the recipient reports, I observed that nearlyall of the jobs were in law enforcement, the courts, and jail coverage. In my reading of grantdescriptions and created/saved jobs descriptions, there was a relatively small number of jobsresulting from hiring vendors and also from sub-recipient grants to nonprofits. As a result,the Department of Justice jobs were classified as type III.
My explanation for these categorizations for each of the main federal awarding agenciesappears in Appendix A. Table A3 shows the entire list of awarding agencies and their associatedtypes.
Summarizing the procedure, suppose a particular primary recipient records creating 100jobs. Then, follow the steps below:
Step A. If the primary recipient’s award is a contract (as opposed to a grant or loan), thenits 100 jobs are assigned to the private sector; otherwise, proceed to step B.
Dupor
130 Second Quarter 2014 Federal Reserve Bank of St. Louis REVIEW
Table 1
Percentages of Jobs Assigned to Private Sector*
Type I Type II Type III Mostly private sector (98% ) Half private sector (50%) Limited private sector (2% )
Department of Transportation Department of Labor Department of Education
Environmental Protection Agency Department of Housing and Department of Health andUrban Development Human Services
Forest Service Centers for Disease Control Department of Justiceand Prevention
U.S. Army Corps of Engineers Administration on Aging
Department of Energy
NOTE: This list contains a sample of federal funding agencies. See Appendix A for a complete list of all federal agenciesthat funded ARRA-created/saved jobs. *For primary recipients of loans and grants that are government organizations,according to funding federal agency.

Step B. If the primary recipient has a name indicating that it is in the private sector, thenits 100 jobs are assigned to the private sector; otherwise, proceed to step C.
Step C. If the primary recipient’s award has a government name, then X of its jobs areassigned to the private sector, where X depends on the federal agency that funds the award.The remaining 100 − X jobs are assigned to the government sector.
DIRECTLY FUNDED JOBS PRIMARILY IN STATE AND LOCAL GOVERNMENT
The top row labeled “All” in Table 2 shows the total number of jobs directly created/savedin the first quarter of 2010, which are then broken down into specific categories. These num-bers and those later in the table do not include the 15,000 jobs (roughly 2 percent ) that mycategorization procedure could not assign as either private or public.
Table 2 shows that about 163,000 of the 667,000 total assigned jobs were in the privatesector, which is 24.4 percent of all assigned jobs. This article’s headline finding is that saved/created jobs were primarily in government.
As a sensitivity analysis, I consider an increase in the share of private sector workers inthe three categories. For type I agencies, I increase the private sector share from 98 percent to100 percent. For type II agencies, I increase the private sector share from 50 percent to 80percent. For type III agencies, I increase the share from 2 percent to 12 percent. This modifi-cation implies that the percentage of private sector jobs created/saved was 31.2 percent, onlyslightly greater than the benchmark result. Thus, this adjustment to the model calibrationdoes not overturn my main finding.
Dupor
Federal Reserve Bank of St. Louis REVIEW Second Quarter 2014 131
Table 2
Directly Created and Saved Jobs: Private Sector and Government
Federal department/ Percentage ofagency Private sector jobs Government jobs private sector jobs
All 162,567 504,784 24
Education 17,859 456,062 4
Transportation 32,569 626 98
Health and Human Services 20,397 11,390 64
Energy 21,501 460 98
Housing and Urban Development 10,993 9,175 55
Labor 8,738 7,967 12
Justice 17,29 13,065 12
Environmental Protection Agency 9,509 180 98
Agriculture 5,318 164 97
NOTE: These numbers are based on first-quarter 2010 recipient reports by ARRA recipients of contracts, grants, andloans. I was unable to assign 2.4 percent of all created/saved jobs to either the private sector or government sector.
For completeness, I report the numbers of jobs by sector in a way that does not drop thesmall number of jobs that were not assigned. To do so, I construct these numbers by assumingthat the fraction of private sector jobs among the unassigned jobs equals the fraction of privatesector jobs among the assigned jobs. Under this assumption, the number of private sector jobsis 166,000 among the 682,000 total jobs reported as created/saved. Regardless of whetherunassigned jobs are included or excluded, the numbers are nearly identical. I report thisadjusted number in this article’s abstract and introduction.
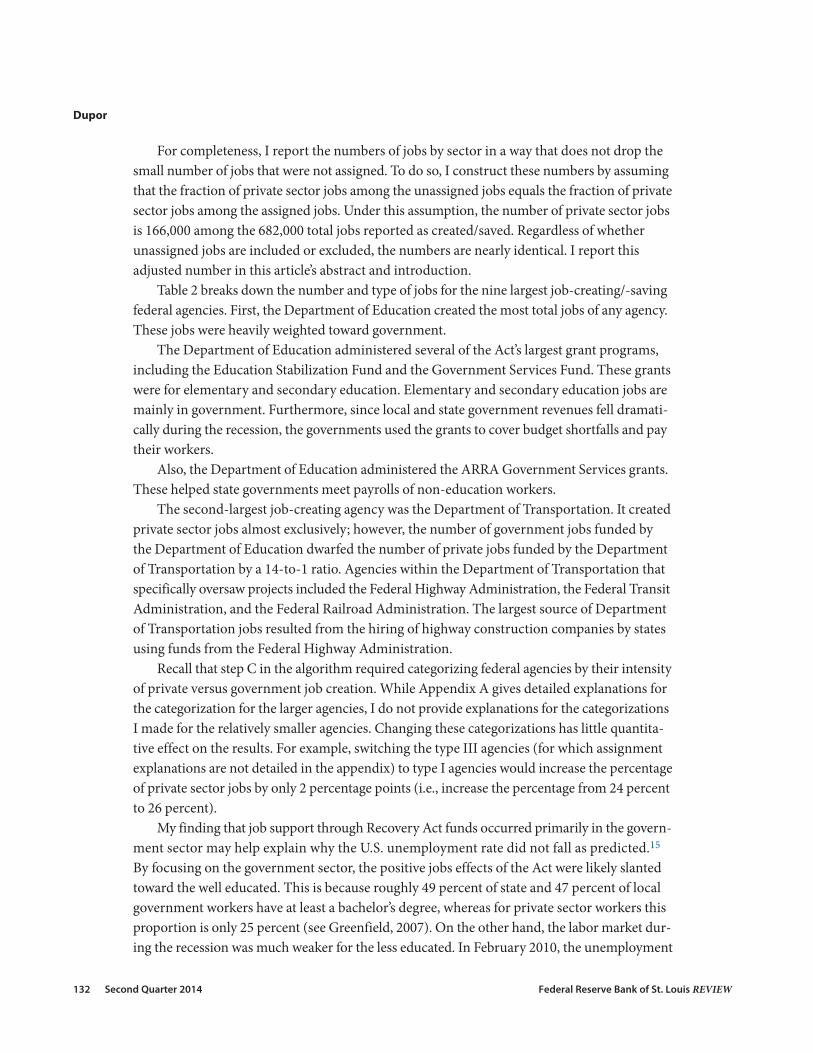
Table 2 breaks down the number and type of jobs for the nine largest job-creating/-savingfederal agencies. First, the Department of Education created the most total jobs of any agency.These jobs were heavily weighted toward government.
The Department of Education administered several of the Act’s largest grant programs,including the Education Stabilization Fund and the Government Services Fund. These grantswere for elementary and secondary education. Elementary and secondary education jobs aremainly in government. Furthermore, since local and state government revenues fell dramati-cally during the recession, the governments used the grants to cover budget shortfalls and paytheir workers.
Also, the Department of Education administered the ARRA Government Services grants.These helped state governments meet payrolls of non-education workers.
The second-largest job-creating agency was the Department of Transportation. It createdprivate sector jobs almost exclusively; however, the number of government jobs funded bythe Department of Education dwarfed the number of private jobs funded by the Departmentof Transportation by a 14-to-1 ratio. Agencies within the Department of Transportation thatspecifically oversaw projects included the Federal Highway Administration, the Federal TransitAdministration, and the Federal Railroad Administration. The largest source of Departmentof Transportation jobs resulted from the hiring of highway construction companies by statesusing funds from the Federal Highway Administration.
Recall that step C in the algorithm required categorizing federal agencies by their intensityof private versus government job creation. While Appendix A gives detailed explanations forthe categorization for the larger agencies, I do not provide explanations for the categorizationsI made for the relatively smaller agencies. Changing these categorizations has little quantita-tive effect on the results. For example, switching the type III agencies (for which assignmentexplanations are not detailed in the appendix) to type I agencies would increase the percentageof private sector jobs by only 2 percentage points (i.e., increase the percentage from 24 percentto 26 percent).
My finding that job support through Recovery Act funds occurred primarily in the govern-ment sector may help explain why the U.S. unemployment rate did not fall as predicted.15
By focusing on the government sector, the positive jobs effects of the Act were likely slantedtoward the well educated. This is because roughly 49 percent of state and 47 percent of localgovernment workers have at least a bachelor’s degree, whereas for private sector workers thisproportion is only 25 percent (see Greenfield, 2007). On the other hand, the labor market dur-ing the recession was much weaker for the less educated. In February 2010, the unemployment
Dupor
132 Second Quarter 2014 Federal Reserve Bank of St. Louis REVIEW

rate was 4 percent among persons with a bachelor’s degree and over 9 percent among personswithout (Figure 3A).
Moreover, on the supply side, job availability (that is, the job posting rate) for white-collarwork was more than double that for blue-collar work during the downturn (see Figure 3B).Thus, the stimulus spending studied in this article may have largely missed that part of thelabor market in most need of assistance.16
A common perception is that the Recovery Act had a strong infrastructure component,suggesting that large numbers of private sector construction (and related industry) jobs shouldhave been created. Job creation through infrastructure spending was complicated by severalfactors. First, school districts had the option of using stimulus education funds to make capitalimprovements, which would have implied more infrastructure job creation. In the 2010:Q1recipient reports, there was almost no U.S. Department of Education spending on infrastruc-ture; schools instead used their stimulus funds to maintain and add to their payrolls and pro-vide pay raises. Second, many programs with funds committed only to infrastructure spentthose funds very slowly. For example, only 56 percent of the Act’s $48.1 billion transportationallocation had been spent at the two-year anniversary of the Act’s passage.
CONCLUSIONA comprehensive understanding of the impact of the American Recovery and Reinvestment
Act is far from complete; however, a growing body of research, taken together, appears to beforming a coherent picture of some of the effects of the stimulus. That is, while the stimulus
Dupor
Federal Reserve Bank of St. Louis REVIEW Second Quarter 2014 133
2007
2007 2010
2010
0
2.0
4.0
6.0
8.0
10.0
At Least Bachelor’s Degree Without Bachelor’s Degree
Percent
0
0.5
1.0
1.5
2.0
2.5
3.0
Blue-Collar Sector White-Collar Sector
Manufacturing Construction
Professional andBusiness Services
Health andEducation
Percent
B. Job Posting Rate by Sector (February 2010)A. Unemployment Rate by Education, Pre-Recession, and During ARRA
Figure 3
Labor Market Conditions Before Recession and During Stimulus Period
NOTE: Unem ployment rates are for February and are restricted to those with at least a high school diploma. The job posting rate is the number ofjob openings divided by employment in the corresponding sector. Data are deseasonalized from the Bureau of Labor Statistics.
was unsuccessful in creating/saving private sector jobs, it helped maintain and sometimesincrease (i) state and local government services, and in turn public sector jobs, as well as (ii)transfer payments to the poor and unemployed. Each of the papers I describe next shows anelement or elements that help shape the above picture of the stimulus.
Conley and Dupor (2013) use state-level data to conduct a cross-sectional study of theeffect of stimulus jobs. They find that the Act resulted in a statistically significant increase instate and local government employment but not in private employment. Jones and Rothschild(2011), using their own surveys of grant, loan, and contract recipients, find that approximatelyone-half of the individuals filling positions directly created by Recovery Act funding wereleaving other jobs.
Wilson (2012) uses state-level variation through an instrumental variables method tostudy the job effects of Recovery Act spending. His results concerning the private sector effectof the stimulus are mixed. He finds that overall employment increased as a result of the stim-ulus. Table 5 in his article breaks down the employment effect by sector. In one specification,he finds a statistically insignificant response of private sector employment to spending. Intwo others, the effect is positive and statistically significant.
Michael Grabell’s (2012) book, Money Well Spent? The Truth Behind the Trillion-DollarStimulus, the Biggest Economic Recovery Plan in History, intended for a general audience, givesan excellent account of many aspects of the Recovery Act. It contains a detailed narrativeaccount of why the design and execution of the stimulus led to slow and limited direct jobcreating/saving in the private sector, such as transportation, but rapid job creating/saving inthe government sector. He also stresses the importance of the stimulus in funding social safetynet programs.17
Several times per year since the beginning of the stimulus plan, the CBO has published alow-high interval estimate of the employment effects (combining direct and indirect jobscreated/saved) of the program. In its first nine reports, the CBO projected that between 1.3and 3.3 million persons would be employed in 2010 as a result of the Act; however, in its 10threport (November 2011), the CBO revised its estimate and reported that the Act may havecreated/saved as few as 650,000 jobs in 2010. Note that the CBO’s jobs effect is estimated basedon all components of the stimulus.
Examining the National Income and Product Accounts, Aizenman and Pasricha (2011,p. 5) find that “the federal fiscal expenditure stimulus in the U.S. during the great recessionmostly compensated for the negative state and local stimuli associated with the collapsing taxrevenue and the limited borrowing capacity of the states.” Cogan and Taylor (2012) go evenfurther, showing that net lending by state and local governments increased during the periodthey were receiving stimulus funds.
Ramey (2013), using several different specifications of structural vector autoregressions,shows that in response to an increase in government purchases, government employmentrises while private sector employment falls or is unchanged.18 �
Dupor
134 Second Quarter 2014 Federal Reserve Bank of St. Louis REVIEW
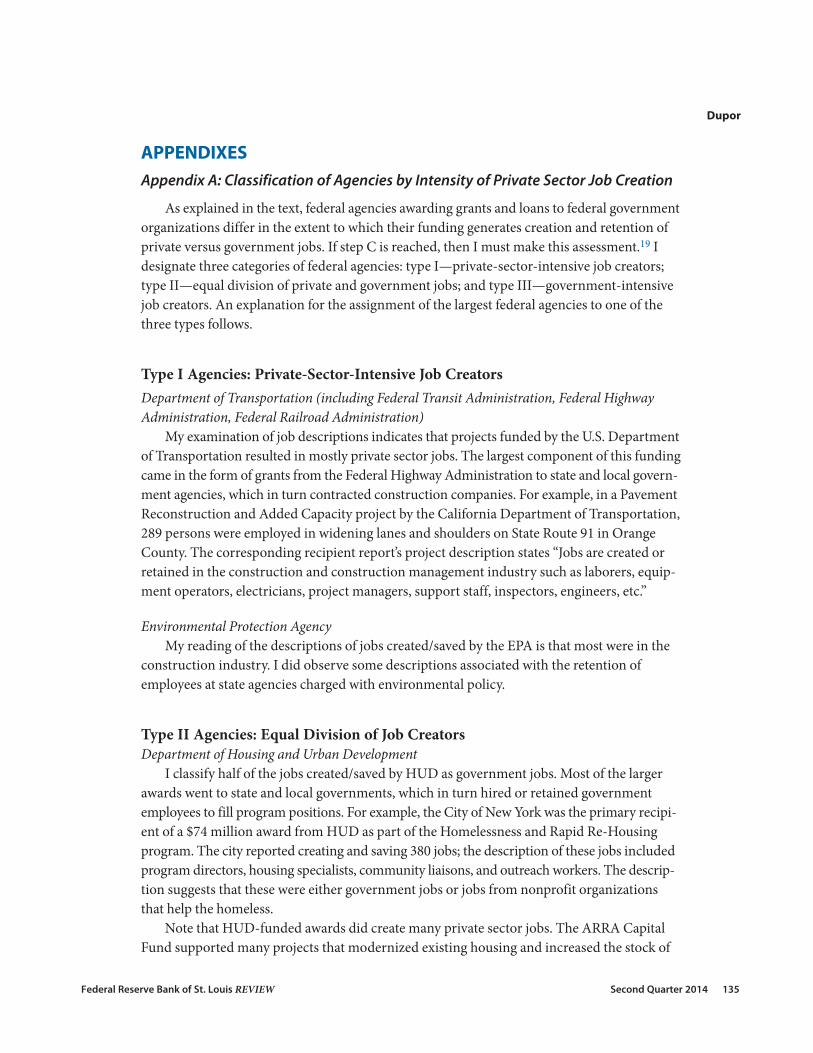
APPENDIXESAppendix A: Classification of Agencies by Intensity of Private Sector Job Creation
As explained in the text, federal agencies awarding grants and loans to federal governmentorganizations differ in the extent to which their funding generates creation and retention ofprivate versus government jobs. If step C is reached, then I must make this assessment.19 Idesignate three categories of federal agencies: type I—private-sector-intensive job creators;type II—equal division of private and government jobs; and type III—government-intensivejob creators. An explanation for the assignment of the largest federal agencies to one of thethree types follows.
Type I Agencies: Private-Sector-Intensive Job CreatorsDepartment of Transportation (including Federal Transit Administration, Federal HighwayAdministration, Federal Railroad Administration)
My examination of job descriptions indicates that projects funded by the U.S. Departmentof Transportation resulted in mostly private sector jobs. The largest component of this fundingcame in the form of grants from the Federal Highway Administration to state and local govern-ment agencies, which in turn contracted construction companies. For example, in a PavementReconstruction and Added Capacity project by the California Department of Transportation,289 persons were employed in widening lanes and shoulders on State Route 91 in OrangeCounty. The corresponding recipient report’s project description states “Jobs are created orretained in the construction and construction management industry such as laborers, equip-ment operators, electricians, project managers, support staff, inspectors, engineers, etc.”
Environmental Protection AgencyMy reading of the descriptions of jobs created/saved by the EPA is that most were in the
construction industry. I did observe some descriptions associated with the retention ofemployees at state agencies charged with environmental policy.
Type II Agencies: Equal Division of Job CreatorsDepartment of Housing and Urban Development
I classify half of the jobs created/saved by HUD as government jobs. Most of the largerawards went to state and local governments, which in turn hired or retained governmentemployees to fill program positions. For example, the City of New York was the primary recipi-ent of a $74 million award from HUD as part of the Homelessness and Rapid Re-Housingprogram. The city reported creating and saving 380 jobs; the description of these jobs includedprogram directors, housing specialists, community liaisons, and outreach workers. The descrip-tion suggests that these were either government jobs or jobs from nonprofit organizationsthat help the homeless.
Note that HUD-funded awards did create many private sector jobs. The ARRA CapitalFund supported many projects that modernized existing housing and increased the stock of
Dupor
Federal Reserve Bank of St. Louis REVIEW Second Quarter 2014 135
public housing. For example, these projects funded construction managers, constructionworkers, and engineers.
The amounts paid by local and state government agencies to these private companieswould appear as payments to vendors and sub-vendors. Given that the HUD funding led toboth private sector and government jobs, it is classified as 50 percent private and 50 percentpublic.
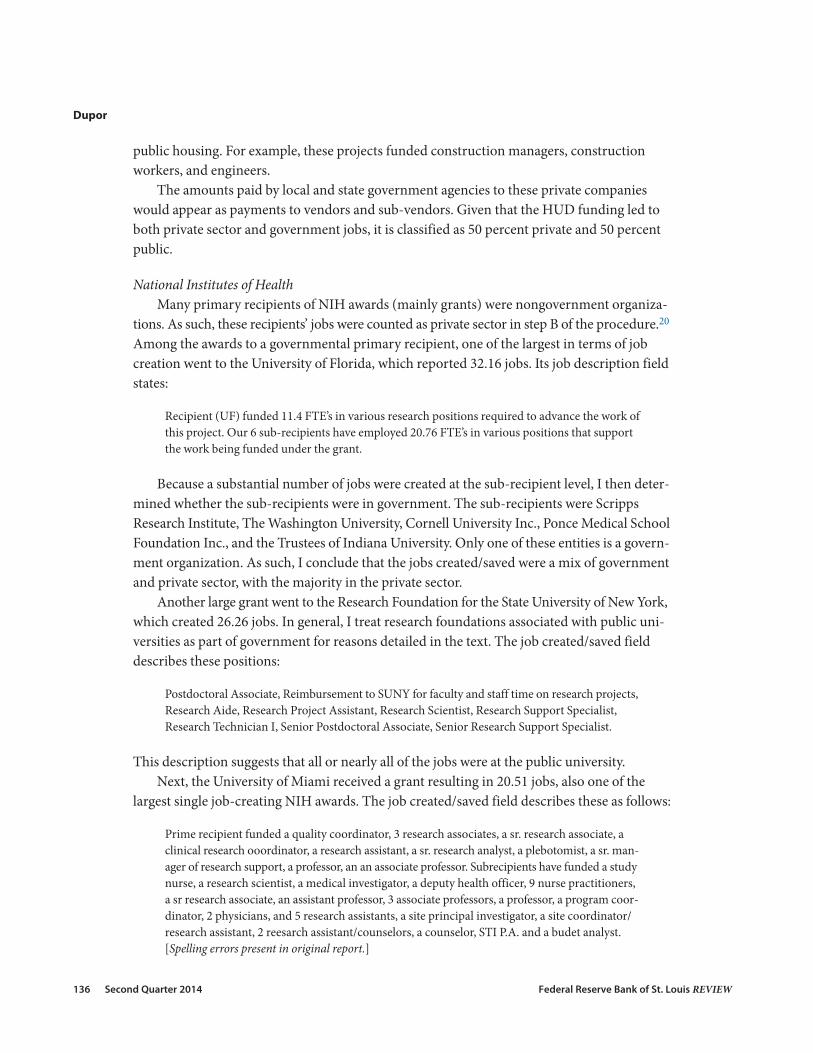
National Institutes of HealthMany primary recipients of NIH awards (mainly grants) were nongovernment organiza-
tions. As such, these recipients’ jobs were counted as private sector in step B of the procedure.20
Among the awards to a governmental primary recipient, one of the largest in terms of jobcreation went to the University of Florida, which reported 32.16 jobs. Its job description fieldstates:
Recipient (UF) funded 11.4 FTE’s in various research positions required to advance the work ofthis project. Our 6 sub-recipients have employed 20.76 FTE’s in various positions that supportthe work being funded under the grant.
Because a substantial number of jobs were created at the sub-recipient level, I then deter-mined whether the sub-recipients were in government. The sub-recipients were ScrippsResearch Institute, The Washington University, Cornell University Inc., Ponce Medical SchoolFoundation Inc., and the Trustees of Indiana University. Only one of these entities is a govern-ment organization. As such, I conclude that the jobs created/saved were a mix of governmentand private sector, with the majority in the private sector.
Another large grant went to the Research Foundation for the State University of New York,which created 26.26 jobs. In general, I treat research foundations associated with public uni-versities as part of government for reasons detailed in the text. The job created/saved fielddescribes these positions:
Postdoctoral Associate, Reimbursement to SUNY for faculty and staff time on research projects,Research Aide, Research Project Assistant, Research Scientist, Research Support Specialist,Research Technician I, Senior Postdoctoral Associate, Senior Research Support Specialist.
This description suggests that all or nearly all of the jobs were at the public university.Next, the University of Miami received a grant resulting in 20.51 jobs, also one of the
largest single job-creating NIH awards. The job created/saved field describes these as follows:
Prime recipient funded a quality coordinator, 3 research associates, a sr. research associate, aclinical research ooordinator, a research assistant, a sr. research analyst, a plebotomist, a sr. man-ager of research support, a professor, an an associate professor. Subrecipients have funded a studynurse, a research scientist, a medical investigator, a deputy health officer, 9 nurse practitioners,a sr research associate, an assistant professor, 3 associate professors, a professor, a program coor-dinator, 2 physicians, and 5 research assistants, a site principal investigator, a site coordinator/research assistant, 2 reesarch assistant/counselors, a counselor, STI P.A. and a budet analyst.[Spelling errors present in original report.]
Dupor
136 Second Quarter 2014 Federal Reserve Bank of St. Louis REVIEW

Upon examining the sub-recipients of the award, I found that there were both private sectorand government organizations.
Overall, I conclude that NIH funding to government prime recipients directly created/saveda similar proportion of private sector and government jobs, and as such it is a type II fundingagency.
Department of LaborI classify the U.S. Department of Labor as a type II agency. The California Department of
Employment Development was the primary recipient of a $489 million grant, the largest singleaward issued by this federal agency. The grant provided “employment services and work readi-ness and occupational skills training for unemployed adults and youth.” The departmentreported creating 1,797 jobs with the description: “case managers and program support” and“hiring of youth program counselors and mentors.” The award was dispersed among mostlycity and county employment agencies. Thus, I infer that many jobs created were in government.A substantial fraction of the jobs created/saved also appear to be in the private sector, as bothfor-profit trade schools were used as sub-vendors on the grant and nonprofit organizationswere sub-recipients of a fraction of the award.
The second-largest job-creating award went to the Ohio Department of Job and FamilyServices. The $138 million award created 1,275 jobs with job descriptions similar to those forthe California award above. The Ohio award was largely divided among sub-awardees thatwere mainly employment departments of various counties. Because of this split of funds, theDepartment of Labor is classified as a type II agency.21
Finally, only 8.3 percent of expenditures went to vendors and sub-vendors, and only 2.4percent of expenditures were made through federal contracts.
Type III Agencies: Government-Intensive Job CreatorsDepartment of Education: Office of Elementary and Secondary Education
I classify the Department of Education as creating mostly government jobs. The largestpart of this department’s funding came as State Fiscal Stabilization Fund education grants.These grants were intended to mitigate and avoid state and local cutbacks in education as wellas improve instruction.
In terms of parsing the jobs created by this funding, California’s jobs descriptions fromeducation awards are particularly useful. California’s main Education Fund grant was a $4.39billion award, of which it had spent $3.95 billion by the quarter I consider. It was California’slargest job-creating grant, with 35,393 jobs created and saved; most importantly, its job descrip-tion provided a useful quantitative breakdown of the jobs. In particular, its description listed287 jobs as vendor jobs. Thus, less than 1 percent of the jobs created were vendor jobs. Of theremaining jobs, 16,208 were precollege teaching positions and 3,547 were nonteaching posi-tions, including food service, bus drivers, teaching assistants, custodians, office staff, librari-ans, and instructional aides. The remaining jobs were at public postsecondary schools, theUniversity of California system, the California State University system, and the CaliforniaCommunity Colleges System.
Dupor
Federal Reserve Bank of St. Louis REVIEW Second Quarter 2014 137

I note that the Recovery Act allowed the education state grants to be used for infrastructureimprovements to a state’s schools. Significant private sector job creation could have come fromlarge infrastructure investment. I do not see this in the data, at least through the quarter studied.In California, only $8.1 million of the $3.95 billion from this grant was spent on infrastructure.22
Ohio’s main Education Fund grant was a $1.46 billion award, of which it had spent $523million by the quarter I consider and created 8,465 jobs. The Ohio Department of Transporta -tion provided me with a very detailed breakdown of the jobs created for Ohio’s ARRA funds.It includes job descriptions from every school, self-reported by each school’s staff.23 Inspectionof the breakdown indicates that nearly all of the jobs went to public school employees: teachers,aides, principals, librarians, and so on.
Department of Education: Office of Special Education and Rehabilitation ServicesThe U.S. Department of Education administered Special Education grants to states through
its Office of Special Education and Rehabilitative Services. This office funded a total of 62,891jobs.24 My inspection of the job descriptions for a group of grants to these states indicates thatnearly all were for professional and support staff in public education.
The State of California reported creating/saving 5,722 jobs from its Special Educationgrant. Its job description (listed as FTEs) follows:
Jobs created or retained include 3164.86 classified jobs, 2360.90 certificated jobs, 193.81 vendorjobs, and 0.00 IHE [Institutions of Higher Education] jobs. Classified jobs include non-teachingpositions such as food service, bus drivers, teacher assistants, custodians, office staff, librarians,and instructional aides for special education. Certificated jobs include teaching positions. Vendorjobs represent a variety of different types of jobs.
Nearly every sub-recipient on the grant was a city government, county government, or schooldistrict.
The Georgia Department of Education was awarded a Special Education grant of $314million. It reported creating/saving 2,522 jobs. Its job description (listed as FTEs) states:
Teachers (693.30); Aides & Paraprofessionals (1528.57); Clerical Staff (27.95); Interpreter (2.63);Technology Specialist (4.00); School Nurse (2.69); Physical Therapist (5.50); Teacher SupportSpecialist (55.47); Secondary Counselor (3.00); School Psychologist (22.33); School Social Worker(3.91); Family Services/Parent Coordinator (5.00); Bus Drivers (57.30); Other Management(21.07); Other Administration (89.79); Other Salaries & Compensation (11.38); Speech LanguageTherapist (2.95); Other (15.26)
Department of JusticeI classify jobs funded by the Department of Justice as mostly in the government sector
(i.e., type III). The Department of Justice administered Justice Assistance Grants (JAG) tostates and some localities. In reading many descriptions of projects and the jobs created bythose projects from the recipient reports, I observe that most of the jobs are in law enforcement,the courts, and jail coverage.
For example, the state of Virginia’s recipient report stated the funds “afforded the statelegislature the opportunity to offset the budget cuts necessitated by declining state revenues.
Dupor
138 Second Quarter 2014 Federal Reserve Bank of St. Louis REVIEW

The Recovery Act JAG funds will be used to provide funds to the Compensation Board for dis-tribution to Sheriff ’s offices during state fiscal year 2010.” Virginia distributed most of its awardamong a total of 121 city governments, county governments, and (a few) jails. It created/saved1,789 jobs and listed the following description:
$23.2 million in Federal funds were used this quarter to offset the State budget cuts. Deputies in144 Sheriff ’s offices across the Commonwealth were able to retain employment. While the numberof jobs retained may seem a little unusual, the entire $23.2 million dollars was expended in onequarter and not spread over the year as projected in our grant application.
In terms of jobs created, the second-largest grant from the Department of Justice wasawarded to the Ohio Office of Criminal Justice Services. It reported creating/saving 398.84positions (it did not report these as FTEs). The corresponding job description suggests that mostof these jobs were in government:
Description of ARRA JAG jobs created: Courts/prosecution/defense/civil attorney 10; Law enforce-ment 44; Info technology 5; Community/social/victim service 101; Training/technical assistance6; Detention/probation/parole/comm corrections 38; Administrative/human resources 10; Con -struction 1; Policy/Research/Intelligence 11.
Description of ARRA JAG jobs retained: Courts/prosecution/defense/civil attorney 24; Lawenforcement 121; Info technology 1; Community/social/victim service 183; Training/technicalassistance 1; Detention/probation/parole/comm corrections 51; Administrative/human resources28; Construction 6; Policy/Research/Intelligence 12.
Hennepin County in Minnesota received a JAG award of $5.7 million and reported 88.9jobs saved. The description of these jobs stated that they were “all law enforcement” and “allretained.” As further evidence, only 3.6 percent of all expenditures was paid to vendors and sub-vendors.
Dupor
Federal Reserve Bank of St. Louis REVIEW Second Quarter 2014 139
Dupor
140 Second Quarter 2014 Federal Reserve Bank of St. Louis REVIEW
Table A1
Examples of Strings Indicating ARRA Recipient as a Private Sector Organization or Business
JV JOINT VENTUREARCHITEC CONSTRUCTFOUNDATION CORPORATIONINCORPOR CORP.CONSTRUCTION ENGINEERINGCO. CHRISTIANCATHOLIC COMPANYPHARM (INC)LLC (INC.)L.L.C. IncLTD COMP.UNITED WAY GOODWILLHABITAT FOR HUMANITY BIG BROTHERSBIG SISTERS METHODISTASSOCIATES BUILDERSBETH ISRAEL SEMINARYPUBLIC/PRIVATE VENTURES ONESTAR NATIONAL SERVICE COMMISSIONUNIVERSITY OF CHICAGO, THE UNIVERSITY OF LA VERNEUNIVERSITY OF NOTRE DAME DU LAC UNIVERSITY OF ROCHESTERUNIVERSITY OF SAN DIEGO UNIVERSITY OF SOUTHERN CALIFORNIA
NOTE: These are 40 of the 542 strings used to identify private sector organizations and businesses used in step C inthis article’s algorithm.
Table A2
Examples of Strings Indicating ARRA Recipient as a Government Organization
CITY OF PARISHCOUNTY DEPARTDEPT DEPARTMENTAUTHORITY AGENCYTOWNSHIP DISTRICTHOUSING COMMISSION RAPID TRANSITAIRPORT OFFICE OFVILLAGE SECRETARY OFBOARD OF STATEDISTRICT TOWN OFBOROUGH OF DIVISION OFGOVERNOR ADMINISTRATIONTOWNSHIP CITY HALLMUNICIPALITY HIGHWAY PATROLPUBLIC SAFETY COMMUNITY COLLEGEPUBLIC INSTRUCTION COMMONWEALTHNEW JERSEY TRANSIT TRIBETRIBAL COUNCIL CHEROKEE NATIONSIOUX NATION HOUSING COMMISSIONATTORNEY GENERAL NATIONAL GUARD
NOTE: These are 40 of the 430 strings used to identify government organizations and businesses used in step C in thisarticle’s algorithm.

Dupor
Federal Reserve Bank of St. Louis REVIEW Second Quarter 2014 141
Table A3
Federal Agencies Funding ARRA Grants and Loans: Numbers of Jobs Created/Saved inFirst Quarter of 2010 and Intensity of Private Sector Job Creation
Federal agency/subagency No. of jobs created/saved Agency type
Office of Elementary and Secondary Education 394,740 IIIOffice of Special Education and Rehabilitative Services 62,891 IIIDepartment of Housing and Urban Development 19,061 IIAdministration for Children and Families 17,828 IIFederal Highway Administration 16,769 IDepartment of Labor 16,347 IINational Institutes of Health 16,199 IIDepartment of Energy 15,408 IDepartment of Justice 15,152 IIIFederal Transit Administration 12,922 IDepartment of Education 11,667 IIIEnvironmental Protection Agency 9,292 ICorporation for National and Community Service 7,327 IIIHealth Resources and Services Administration 7,043 INational Science Foundation 3,565 IIIFederal Aviation Administration 1,992 IForest Service 1,546 IRural Utilities Service 1,366 INational Endowment for the Arts 1,364 IAssistant Secretary for Public and Indian Housing 1,219 IDepartment of Health and Human Services 1,035 IIIFederal Railroad Administration 836 IDepartment of the Army 601 IBureau of Reclamation 562 IIRural Housing Service 513 IMaritime Administration 499 IICenters for Disease Control and Prevention 495 IIU.S. Army Corps of Engineers-Civil Program Financing Only 487 IAdministration on Aging 487 IOffice of Science 392 IIIIndian Health Service 345 IIIndian Affairs (Assistant Secretary) 334 IINational Oceanic and Atmospheric Administration 319 IICommunity Development Financial Institutions 200 IINational Telecommunication and Information Administration 197 IIEmployment and Training Administration 179 IIFood and Nutrition Service 159 IIEconomic Development Administration 144 IIDepartment of the Interior 139 INational Aeronautics and Space Administration 135 IIRural Business-Cooperative Service 123 IIU.S. Fish and Wildlife Service 110 IIFederal Emergency Management Agency 107 II
NOTE: Type I, private-sector-intensive; type II, equal division between private and government sectors; type III, government-sector-intensive. Excludes federal agencies creating fewer than 50 jobs.
SOURCE: Recipient reports available at http://recovery.gov.
Appendix B: Recovery Board Definition of a Job Created or Retained
The RATB’s definition of a saved (i.e., retained) job or a created job is dependent on thereporting instructions provided to recipients. These instructions differed slightly betweenrecipients of contracts and recipients of grants or loans. I discuss the grants and loans rules first.
FederalReporting.gov, along with the OMB, provided instructions to recipients of grantsand loans for calculating the number of jobs created or saved. While recipients have severalpages of guidance for calculating a jobs created/retained number, the following paragraphfrom OMB (2009) summarizes the key aspects:
The estimate of the number of jobs created or retained by the Recovery Act should be expressedas “full-time equivalents” (FTE). In calculating an FTE, the number of actual hours worked infunded jobs are divided by the number of hours representing a full work schedule for the kindof job being estimated. These FTEs are then adjusted to count only the portion correspondingto the share of the job funded by Recovery Act funds. Alternatively, in cases where accountingsystems track the billing of workers’ hours to Recovery Act and non-Recovery Act accounts,recipients may simply count the number of hours funded by the Recovery Act and divide by thenumber of hours in a full-time schedule.
The OMB (2010) gives very similar instructions for reporting jobs created and retainedto recipients of ARRA contracts. One distinction made for contractors that does not hold forgrant and loan recipients is as follows: “The definition applies to prime contractor positionsand first-tier subcontractor positions where the subcontract is $25,000 or more.” Moreover,all primary recipients were instructed to not report the employment impact on materials sup-pliers and central service providers (referred to as “indirect” jobs) or on the local community(referred to as “induced” jobs).
OMB (2010) goes on to say:
“Job Created” means those new positions created and filled, or previously existing unfilled posi-tions that are filled, that are funded by the American Recovery and Reinvestment Act of 2009(Recovery Act). This definition covers only positions established in the United States and out-lying areas (see definition in FAR 2.101). The term does not include indirect jobs or inducedjobs. “Job Retained” means those existing filled positions that are funded by the AmericanRecovery and Reinvestment Act of 2009 (Recovery Act).
Dupor
142 Second Quarter 2014 Federal Reserve Bank of St. Louis REVIEW

NOTES1 President Barack Obama signed the Recovery Act during his first month in office. For an early outline of the plan,see Summers (2008). For an early projected impact of the plan, see Bernstein and Romer (2009).
2 See CBO (2011).
3 At the time this article was written, the data were available for download at the website Recovery.gov. The sitealso contained a data user guide; see Recovery Accountability and Transparency Board (2009).
4 Unless otherwise stated, jobs reported in the text as saved/created are FTEs and are shown as rounded numbers.As a result, they may differ from the exact values in the tables.
5 At the one-year mark, the Act’s funding directed toward grants, contracts, and loans totaled $83.6 billion. Notethat there are no recipient-reported jobs data for other ARRA spending because such spending does not create/save jobs directly.
6 U.S. House of Representatives (2011).
7 See page 2 of Bernstein and Romer (2009).
8 Note that Bernstein and Romer’s number is not directly comparable with my results because they did not includewhat they call both direct and indirect employment creation in this quote. I have not found precise definitions of“direct” versus “indirect” job creation in the existing literature.
9 The above numbers refer to point estimates from the respective studies.
10 Section 1512 of the ARRA.
11 The data description was slightly different in the first quarterly reporting period. At that time, recipients wereasked to construct a jobs number based on whether a given job would have existed were it not for the RecoveryAct. The reason for the change was the subjective nature of the original question. I did not use the first-quarterresponses in my study.
12 The most likely reason that a sub-recipient was in the private sector was because it is a nonprofit organization.
13 In designing the entire procedure, I tried to minimize (to the greatest amount possible) the discretion (i.e., “judg-ment calls”) needed to categorize jobs as being in the private or government sectors. Step C required the mostdiscretion on my part since the time that would be required to partition individual jobs into the private or govern-ment sectors on an award-by-award basis was prohibitive.
14 See Appendix A for a description of type II projects.
15 See Figure 1 in Bernstein and Romer (2009).
16 If the created and saved jobs were in relatively healthy parts of the job market, then one would expect to see asubstantial number of Recovery Act job takers coming from other jobs. To this point, Jones and Rothschild (2011)survey findings have shown that approximately one-half of the individuals filling positions directly created by theARRA were leaving other jobs.
17 Note that Grabell’s overall assessment is that the stimulus may have created/saved millions of jobs (direct plusindirect), which is consistent with some estimates by others, such as the president’s Council of Economic Advisers(2010).
18 The horizon of Ramey’s study does not include the ARRA period.
19 Recall that step C is reached if the award is not a contract and the primary recipient’s name indicates it is a non-federal government organization.
20 Recall that in step B, if the primary recipient has a name indicating that it is in the private sector, then its jobs areassigned to the private sector.
21 The distinction between government and nongovernment can become muddled with respect to employmentservices. For example, the largest sub-recipient of the Ohio award is the Central Ohio Workforce InvestmentCorporation. It has partners in the private sector, such as Goodwill of Ohio. It satisfies this article’s definition of atype II agency because, as its website states, its “Board [is appointed] by the Mayor of the City of Columbus and
Dupor
Federal Reserve Bank of St. Louis REVIEW Second Quarter 2014 143
the Franklin County Board of Commissioners, in conjunction with recommendations made by the GreaterColumbus Chamber of Commerce.”
22 The recipient survey includes several questions about infrastructure spending in particular.
23 These data are a matter of public record and are available from the author on request.
24 This total includes Special Education and other grants that it administered.
REFERENCESAmerican Recovery and Reinvestment Act. Public Law 111-5, 111th Congress, February 17, 2009;http://www.gpo.gov/fdsys/pkg/PLAW-111publ5/pdf/PLAW-111publ5.pdf.
Aizenman, Joshua and Pasricha, Gurnain K. “The Net Fiscal Expenditure Stimulus in the U.S., 2008-9: Less than WhatYou Might Think, and Less than the Fiscal Stimuli of Most OECD Countries.” The Economists’ Voice, June 2011,8(2), pp. 1-6.
Bernstein, Jared and Romer, Christina. “The Job Impact of the American Recovery and Reinvestment Plan.” Councilof Economic Advisers and Office of the Vice President Elect, January 9, 2009;http://otrans.3cdn.net/45593e8ecbd339d074_l3m6bt1te.pdf.
Blinder, Alan S. After the Music Stopped: The Financial Crisis, the Response, and the Work Ahead. New York: PenguinBooks, 2013.
Cogan, John F. and Taylor, John B. “What the Government Purchases Multiplier Actually Multiplied in the 2009Stimulus Package,” in Lee E. Ohanian, John B. Taylor, and Ian Wright, eds., Government Policies and the DelayedEconomic Recovery. Chap. 5. Stanford, CA: Hoover Institution Press, 2012, pp. 85-114.
Cohen, Lauren; Coval, Joshua and Malloy, Christopher. “Do Powerful Politicians Cause Corporate Downsizing?”Journal of Political Economy, December 2011, 119(6), pp. 1015-60.
Congressional Budget Office. “The Budget and Economic Outlook: Fiscal Years 2011 to 2021.” January 2011;http://www.cbo.gov/sites/default/files/cbofiles/ftpdocs/120xx/doc12039/01-26_fy2011outlook.pdf.
Conley, Tim and Dupor, Bill. “The American Recovery and Reinvestment Act: Solely a Government Jobs Program?”Journal of Monetary Economics, July 2013, 60(5) pp. 535-49.
Council of Economic Advisers. “The Economic Impact of the American Recovery and Reinvestment Act of 2009:Third Quarterly Report.” Executive Office of the President, April 14, 2010; http://www.whitehouse.gov/sites/default/files/microsites/CEA-3rd-arra-report.pdf.
Gandel, Stephen. “After One Year, a Stimulus Report Card.” Time, February 17, 2010;http://content.time.com/time/specials/packages/article/0,28804,1964765_1964764_1964758,00.html.
Government Accountability Office. “Recovery Act: Recipient Reported Jobs Data Provide Some Insight into Use ofRecovery Act Funding, but Data Quality and Reporting Issues Need Attention.” GAO-10-223, November 19, 2009;http://www.gao.gov/assets/300/298632.pdf.
Government Accountability Office. “Recovery Act: Progress and Challenges in Spending Weatherization Funds.”GAO-12-195, December 16, 2011; http://www.gao.gov/assets/590/587064.pdf.
Grabell, Michael. Money Well Spent? The Truth Behind the Trillion-Dollar Stimulus, the Biggest Economic Recovery Planin History. New York: PublicAffairs, 2012.
Greenfield, Stuart. “Public Sector Employment: The Current Situation.” Working paper, Center for State and LocalGovernment Excellence, 2007.
Jacobson, Louis. “Government Jobs vs. Private Jobs: Which Help the Economy More?” Tampa Bay Times, February 23,2013; http://www.tampabay.com/news/business/economicdevelopment/government-jobs-vs-private-jobs-which-help-the-economy-more/1276248.
Jones, Garrett and Rothschild, Daniel M. “Did Stimulus Dollars Hire the Unemployed? Answers to Questions aboutthe American Recovery and Reinvestment Act.” Working Paper No. 11-34, Mercatus Center, George Mason
Dupor
144 Second Quarter 2014 Federal Reserve Bank of St. Louis REVIEW

University, September 2011; http://mercatus.org/sites/default/files/publication/Did_Stimulus_Dollars_Hire_The_Unemployed_Jones_Rothschild_WP34.pdf.
Office of Management and Budget. “Memorandum for the Heads of Executive Departments and Agencies. UpdatedGuidance on the American Recovery and Reinvestment Act—Data Quality, Non-Reporting Recipients, andReporting of Job Estimates.” Executive Office of the President, December 18, 2009;http://www.whitehouse.gov/sites/default/files/omb/assets/memoranda_2010/m10-08.pdf.
Office of Management and Budget. “Recovery FAQs for Federal Contractors on Reporting.” July 2, 2010;http://www.whitehouse.gov/omb/recovery_faqs_contractors.
Ramey, Valerie A. “Government Spending and Private Activity,” in Alberto Alesina and Francesco Giavazzi, eds.,Fiscal Policy after the Financial Crisis. Chap. 1. Chicago: University of Chicago Press, 2013, pp. 19-55.
Recovery Accountability and Transparency Board. “Recovery.gov: Download Center User Guide.” Recovery.Gov,2009; http://www.recovery.gov/arra/FAQ/OtherDLFiles/Download%20Center%20User%20Guide.pdf.
Recovery Accountability and Transparency Board. “Recipient Reporting Data Model v4.0: Final Production Release,for Quarter Ending September 30, 2010.” Recovery.Gov, 2010;http://billdupor.weebly.com/uploads/2/2/8/0/22808472/fedrptgdatamodel_v4.0.pdf.
Shapiro, Matthew D. and Slemrod, Joel. “Did The 2001 Tax Rebate Stimulate Spending? Evidence From TaxpayerSurveys,” in James M. Poterba, ed., Tax Policy and the Economy. Volume 17. Cambridge, MA: MIT Press, 2003, pp. 83-110.
Shapiro, Matthew D. and Slemrod, Joel. “Did the 2008 Tax Rebates Stimulate Spending?” American Economic Review,May 2009, 99(2), pp. 374-79.
Summers, Larry. “The Economic Recovery PlanPolicy Work,” in a memo to President-Elect Obama, December 15,2008; http://s3.documentcloud.org/documents/285065/summers-12-15-08-memo.pdf.
U.S. House of Representatives. “Economists’ Statement to President Obama.” [Letter from John A. Boehner toPresident Barack Obama.] February 13, 2011;http://www.speaker.gov/sites/speaker.house.gov/files/UploadedFiles/Boehner-Obama-Letter-2-13-11-1.pdf.
Wilson, Daniel J.“Fiscal Spending Jobs Multipliers: Evidence from the 2009 American Recovery and ReinvestmentAct.” American Economic Journal: Economic Policy, August 2012, 4(3), pp. 251-82.
Dupor
Federal Reserve Bank of St. Louis REVIEW Second Quarter 2014 145

146 Second Quarter 2014 Federal Reserve Bank of St. Louis REVIEW