The 2009 National Assessments of Mathematics and English ... · vii Executive Summary The 2009...
120
The 2009 National Assessments of Mathematics and English Reading Eemer Eivers, Seán Close, Gerry Shiel, David Millar, Aidan Clerkin, Lorraine Gilleece & Joanne Kiniry Prepared for the Department of Education and Skills by the Educational Research Centre
Transcript of The 2009 National Assessments of Mathematics and English ... · vii Executive Summary The 2009...

The 2009 National Assessmentsof Mathematics and English Reading
Eemer Eivers, Seán Close, Gerry Shiel,
David Millar, Aidan Clerkin, Lorraine Gilleece & Joanne Kiniry
Prepared for the Department of Education and Skillsby the Educational Research Centre
www.erc.ie/NA2009
Th
e 20
09
Natio
nal A
ssessmen
ts of M
athem
atics and
En
glish
Read
ing
E
ivers et al.

The 2009 National Assessmentsof Mathematics and English Reading
Eemer Eivers, Seán Close, Gerry Shiel,
David Millar, Aidan Clerkin, Lorraine Gilleece & Joanne Kiniry
Prepared for the Department of Education and Skillsby the Educational Research Centre

Copyright © 2010, Department of Education and Skills
Cataloguing-in-Publication Data
Eivers, Eemer
The 2009 National Assessments of Mathematics and English Reading / Eemer Eivers …[et al.].
Dublin: Department of Education and Skills.
xii, 104p; 30cm Includes bibliographical references.
1. Reading (Primary) – Ireland – Evaluation 2. Mathematics (Primary) – Ireland – Evaluation 3. Academic achievement 4. Educational surveys - Ireland
2010 I Title. II Close, Seán. III Shiel, Gerry. 371.262
Published by the Stationery Office, Dublin
To be purchased directly from theGovernment Publications Sales Office,Molesworth Street, Dublin 2
or by mail order fromGovernment PublicationsUnit 20 Lakeside Retail ParkClaremorrisCo. MayoLo-call (01) 1890 213434
€12.00ISBN: 978-1-4064-2529-1
Design by SilverBark Creative Printed in the Republic of Ireland by Eprint

Contents Preface . . . . . . . . . . . . . . . . . . . . . . . . . . . . . . . . . . . . . . . . . . . . . . . . . . . . . . . . . . . . . . . . . . . . . . . . . . . . . . . . . . . . . . . . . . . . . . . . . . . . . . . . . . . . . . . . . . v
StatisticalTermsUsed . . . . . . . . . . . . . . . . . . . . . . . . . . . . . . . . . . . . . . . . . . . . . . . . . . . . . . . . . . . . . . . . . . . . . . . . . . . . . . . . . . . . . . . . . . . vi
ExecutiveSummary . . . . . . . . . . . . . . . . . . . . . . . . . . . . . . . . . . . . . . . . . . . . . . . . . . . . . . . . . . . . . . . . . . . . . . . . . . . . . . . . . . . . . . . . . . . . . . . vii
ListofAcronymsandAbbreviations . . . . . . . . . . . . . . . . . . . . . . . . . . . . . . . . . . . . . . . . . . . . . . . . . . . . . . . . . . . . . . . . . . . . . . xi
1. Introduction . . . . . . . . . . . . . . . . . . . . . . . . . . . . . . . . . . . . . . . . . . . . . . . . . . . . . . . . . . . . . . . . . . . . . . . . . . . . . . . . . . . . . . . . . . . . . . . . . . . . . . . . . . 1
NationalAssessmentsinIreland . . . . . . . . . . . . . . . . . . . . . . . . . . . . . . . . . . . . . . . . . . . . . . . . . . . . . . . . . . . . . . . . . . . . . . . . . . . 1
IrishParticipationinInternationalAssessments . . . . . . . . . . . . . . . . . . . . . . . . . . . . . . . . . . . . . . . . . . . . . . . . . . . 4
FactorsAssociatedwithAchievement . . . . . . . . . . . . . . . . . . . . . . . . . . . . . . . . . . . . . . . . . . . . . . . . . . . . . . . . . . . . . . . . . . . 6
HowtoInterprettheAnalysesinThisReport . . . . . . . . . . . . . . . . . . . . . . . . . . . . . . . . . . . . . . . . . . . . . . . . . . . . . . . 12
2. Assessment Frameworks and Methodology . . . . . . . . . . . . . . . . . . . . . . . . . . . . . . . . . . . . . . . . . . . . . . . . . . . . . . . 15
ReadingFrameworkandTestDevelopment . . . . . . . . . . . . . . . . . . . . . . . . . . . . . . . . . . . . . . . . . . . . . . . . . . . . . . . . . 15
MathematicsFrameworkandTestDevelopment . . . . . . . . . . . . . . . . . . . . . . . . . . . . . . . . . . . . . . . . . . . . . . . . 19
DevelopmentofQuestionnaires . . . . . . . . . . . . . . . . . . . . . . . . . . . . . . . . . . . . . . . . . . . . . . . . . . . . . . . . . . . . . . . . . . . . . . . . . . . 21
FieldTrial . . . . . . . . . . . . . . . . . . . . . . . . . . . . . . . . . . . . . . . . . . . . . . . . . . . . . . . . . . . . . . . . . . . . . . . . . . . . . . . . . . . . . . . . . . . . . . . . . . . . . . . . . . . . . . 22
MainStudySampleDesignandAdministration . . . . . . . . . . . . . . . . . . . . . . . . . . . . . . . . . . . . . . . . . . . . . . . . . . . 23
Weighting,ScoringandScalingofData . . . . . . . . . . . . . . . . . . . . . . . . . . . . . . . . . . . . . . . . . . . . . . . . . . . . . . . . . . . . . . . 25
3. Overview of Performance . . . . . . . . . . . . . . . . . . . . . . . . . . . . . . . . . . . . . . . . . . . . . . . . . . . . . . . . . . . . . . . . . . . . . . . . . . . . . . . . . . . 27
OverallPerformanceonReading . . . . . . . . . . . . . . . . . . . . . . . . . . . . . . . . . . . . . . . . . . . . . . . . . . . . . . . . . . . . . . . . . . . . . . . . . 27
OverallPerformanceonMathematics . . . . . . . . . . . . . . . . . . . . . . . . . . . . . . . . . . . . . . . . . . . . . . . . . . . . . . . . . . . . . . . . . . 29
ProficiencyLevelsandExampleItems . . . . . . . . . . . . . . . . . . . . . . . . . . . . . . . . . . . . . . . . . . . . . . . . . . . . . . . . . . . . . . . . . 31
AchievementandAbilityRatings . . . . . . . . . . . . . . . . . . . . . . . . . . . . . . . . . . . . . . . . . . . . . . . . . . . . . . . . . . . . . . . . . . . . . . . . . 44
AchievementandAdditionalSupport . . . . . . . . . . . . . . . . . . . . . . . . . . . . . . . . . . . . . . . . . . . . . . . . . . . . . . . . . . . . . . . . . . 46
4. The Pupil and Achievement . . . . . . . . . . . . . . . . . . . . . . . . . . . . . . . . . . . . . . . . . . . . . . . . . . . . . . . . . . . . . . . . . . . . . . . . . . . . . . . . . 47
FamilyCharacteristics . . . . . . . . . . . . . . . . . . . . . . . . . . . . . . . . . . . . . . . . . . . . . . . . . . . . . . . . . . . . . . . . . . . . . . . . . . . . . . . . . . . . . . . . . . . . 47
HomeAtmosphereandSupports . . . . . . . . . . . . . . . . . . . . . . . . . . . . . . . . . . . . . . . . . . . . . . . . . . . . . . . . . . . . . . . . . . . . . . . . . . 48
AttitudesandEngagement . . . . . . . . . . . . . . . . . . . . . . . . . . . . . . . . . . . . . . . . . . . . . . . . . . . . . . . . . . . . . . . . . . . . . . . . . . . . . . . . . . . . 52
iii
iv
5 The School, the Classroom and Achievement . . . . . . . . . . . . . . . . . . . . . . . . . . . . . . . . . . . . . . . . . . . . . . . . . . . . . 55
CharacteristicsoftheLearningEnvironment . . . . . . . . . . . . . . . . . . . . . . . . . . . . . . . . . . . . . . . . . . . . . . . . . . . . . . . . 55
ContinuingProfessionalDevelopment . . . . . . . . . . . . . . . . . . . . . . . . . . . . . . . . . . . . . . . . . . . . . . . . . . . . . . . . . . . . . . . . . 57
ConfidenceinTeaching . . . . . . . . . . . . . . . . . . . . . . . . . . . . . . . . . . . . . . . . . . . . . . . . . . . . . . . . . . . . . . . . . . . . . . . . . . . . . . . . . . . . . . . . 59
TeachingandLearningPractices . . . . . . . . . . . . . . . . . . . . . . . . . . . . . . . . . . . . . . . . . . . . . . . . . . . . . . . . . . . . . . . . . . . . . . . . . . 60
ResourcesforTeachingandLearning . . . . . . . . . . . . . . . . . . . . . . . . . . . . . . . . . . . . . . . . . . . . . . . . . . . . . . . . . . . . . . . . . . . 64
Assessment . . . . . . . . . . . . . . . . . . . . . . . . . . . . . . . . . . . . . . . . . . . . . . . . . . . . . . . . . . . . . . . . . . . . . . . . . . . . . . . . . . . . . . . . . . . . . . . . . . . . . . . . . . 67
AdditionalSupportsforLearning . . . . . . . . . . . . . . . . . . . . . . . . . . . . . . . . . . . . . . . . . . . . . . . . . . . . . . . . . . . . . . . . . . . . . . . . . . 69
Principals’ViewsoftheKeyIssues . . . . . . . . . . . . . . . . . . . . . . . . . . . . . . . . . . . . . . . . . . . . . . . . . . . . . . . . . . . . . . . . . . . . . . 71
FactorsRelatedtoAchievement . . . . . . . . . . . . . . . . . . . . . . . . . . . . . . . . . . . . . . . . . . . . . . . . . . . . . . . . . . . . . . . . . . . . . . . . . . 72
6. Typical and Atypical Performance Patterns . . . . . . . . . . . . . . . . . . . . . . . . . . . . . . . . . . . . . . . . . . . . . . . . . . . . . . . 77
SESandPerformance . . . . . . . . . . . . . . . . . . . . . . . . . . . . . . . . . . . . . . . . . . . . . . . . . . . . . . . . . . . . . . . . . . . . . . . . . . . . . . . . . . . . . . . . . . . 77
PerformanceAcrossDomains:Similarities . . . . . . . . . . . . . . . . . . . . . . . . . . . . . . . . . . . . . . . . . . . . . . . . . . . . . . . . . . . 79
PerformanceAcrossDomains:Differences . . . . . . . . . . . . . . . . . . . . . . . . . . . . . . . . . . . . . . . . . . . . . . . . . . . . . . . . . . . 81
PerformanceWithinDomains:Differences . . . . . . . . . . . . . . . . . . . . . . . . . . . . . . . . . . . . . . . . . . . . . . . . . . . . . . . . . . . 82
7. Summary and Recommendations . . . . . . . . . . . . . . . . . . . . . . . . . . . . . . . . . . . . . . . . . . . . . . . . . . . . . . . . . . . . . . . . . . . . . . 85
SummaryofNationalAssessments2009 . . . . . . . . . . . . . . . . . . . . . . . . . . . . . . . . . . . . . . . . . . . . . . . . . . . . . . . . . . . . . 85
TrendsinNon-achievementData . . . . . . . . . . . . . . . . . . . . . . . . . . . . . . . . . . . . . . . . . . . . . . . . . . . . . . . . . . . . . . . . . . . . . . . . . 86
ConclusionsandRecommendations . . . . . . . . . . . . . . . . . . . . . . . . . . . . . . . . . . . . . . . . . . . . . . . . . . . . . . . . . . . . . . . . . . . . . 87
References . . . . . . . . . . . . . . . . . . . . . . . . . . . . . . . . . . . . . . . . . . . . . . . . . . . . . . . . . . . . . . . . . . . . . . . . . . . . . . . . . . . . . . . . . . . . . . . . . . . . . . . . . . . 99
PrefaceThis report summarises the findings of the 2009 National Assessments of mathematics and English reading (NA 2009), the tenth in a series of National Assessments in Irish primary schools, dating back to 1972. It differs from earlier assessments in that the target classes have changed to Second and Sixth classes (to represent the end of the junior and senior cycles of primary school education, respectively), and the same cohort of pupils took both elements of the assessment (previous National Assessments used separate samples of pupils for the mathematics and reading components).
The present report, which is designed for a general audience, summarises key findings and recommendations. It is divided into seven chapters. Chapter 1 provides some background to National Assessments, while Chapter 2 describes how the tests were developed and the assessments carried out. Chapter 3 provides an overview of pupil performance, describes performance in terms of proficiency levels, and shows test items exemplifying each proficiency level. In Chapter 4, achievement is related to characteristics of the pupil and home environment, while in Chapter 5, aspects of the school and classroom are described and linked to achievement. Chapter 6 examines performance across and within reading and mathematics, while Chapter 7 summarises the main findings and presents some recommendations. The report is supported by a Technical Report and an e-appendix – the former provides more detail on the theoretical and technical underpinnings of NA 2009, while the latter provides more detail on the results presented in this report (see www.erc.ie/NA2009 for details).
Acknowledgements
We gratefully acknowledge the help of two subject expert groups and a National Advisory Committee. The Advisory Committee members were Carmel Nic Airt (An Foras Pátrúnachta), Dónal Ó hAiniféin (Gaelscoileanna), Mark Candon (CPSMA), Deirbhile Nic Craith (INTO), John Curran (IPPN), Arlene Forster (NCCA), Áine Lynch (NPC–P), and Catherine Shanahan (replaced by Ciara O’Donnell) (PPDS). The Department of Education and Science was represented by Margaret Kelly and Harold Hislop (replaced by Pádraig Mac Fhlannchadha).
The Mathematics Expert Group members were Patricia Cassidy, Dolores Corcoran, Therese Dooley, Cheryl Greene and Noreen O’Loughlin. Rachel Cunningham, Joan Hanrahan, Sean O’Cearbhaill and Mairéad Twohig were members until 2009. The latter three were replaced by John White, Eamonn Clavin, and Ciara O’Donnell. The Reading Expert Group members were Tara Concannon-Gibney (replaced in 2009 by Aoibheann Kelly), Pat Delea, Diarmuid Dullaghan, Kieran Fanning, and Therese McPhillips. Additional help with reading test development was provided by Betty Behan and Kate Brand.
Thanks are due to staff at the ERC, including Peter Archer (acting Director), Thomas Kellaghan (retired Director), Paula Chute, John Coyle, Caoimhe Máirtín, Mary Rohan and Hilary Walshe. Thanks are due to Fernando Cartwright (Statistics Canada), for advice on scaling. Finally, we thank all school principals, teachers, pupils and parents who participated in either the pilot or main study.
v
Statistical Terms UsedStatistical terms used to describe our findings are explained below.
Correlation A correlation coefficient is a measure of the relationship between two variables. Values can range from –1.00 to +1.00. A negative correlation (e.g., –.45) means that as one variable increases, the other decreases; a positive correlation (e.g., .35) means that both either increase or decrease together.
The closer a value is to ±1, the stronger the relationship between variables. A strong correlation does not necessarily mean that one variable causes the other; it is always necessary to consider the possible influence of other factors. See Inset 1.1 on page 13 for more details on interpreting correlations.
Proficiency level
As well as scores, pupil performance can be described using proficiency levels. These describe the skills that pupils falling within certain score ranges can demonstrate. There are four proficiency levels, with Level 4 representing the most complex skills and Level 1 the most basic. There is also a ‘Below Level 1’ category for pupils who did not show the competencies required for the simplest assessment tasks. Proficiency levels are based on mastery of skills, meaning that pupils are consistently able to demonstrate the skills at their proficiency level and the Levels below, but are not consistently able to demonstrate the skills exemplifying the Levels above them.
Scale Score When a pupil completes a test, the numbers of correct answers are checked. These “raw scores” (or percent correct) are converted to scale scores, to give a more regular distribution of scores, and allow comparison across different tests.
In this assessment, test results were scaled so that the average scale score on the test is 250, and the standard deviation is 50. This means that 68% of pupils’ scores fall between 200 and 300 (i.e. within one standard deviation above or below the average of 250).
Significant difference
A significant difference between groups is one that a statistical test has established is unlikely to be due to chance.
Standard Error/Error
We report mean, or average, test scores obtained by various groups of pupils (e.g., girls in Second class). These scores are estimates, as we estimate that, nationally, Second class girls’ reading score is X, based on the sample of pupils we have selected. However, it is unlikely that the ‘true’ national mean is exactly the same as our sample mean. Some variation or error around scores is to be expected. Thus, each mean has a standard error, which allows us to estimate how accurately the mean found in our sample reflects the ‘true’ mean in the population. A mean score that has a large standard error needs to be interpreted with caution.
vi

vii
Executive SummaryThe 2009 National Assessments of mathematics and English reading in Irish primary schools (NA 2009) is the most recent 1 in a series of such assessments conducted at regular intervals since 1972. Mathematics and reading tests were completed by almost 4,000 Second and 4,000 Sixth class pupils. Contextual data were obtained from questionnaires completed by pupils, parents, class teachers, and principals. As the target grades differed from previous National Assessments, new test materials were developed and used. Thus, trend data for achievement are not available. Instead, NA 2009 provides baseline data against which future performance can be compared.
The data were scored and scaled using an Item Response Theory framework. Scores for overall tests and for subscales were scaled to have a mean of 250 and a standard deviation of 50, approximating a normal distribution. As well as overall scales for reading and mathematics, content and process subscales were developed for each domain. Four process subscales were developed for reading (Retrieve, Infer, Interpret & Integrate, and Examine & Evaluate) and five for mathematics (Understand & Recall, Implement, Integrate & Connect, Reason, and Apply & Problem-Solve). For content, two subscales were developed for reading (Vocabulary and Comprehension), and four for mathematics (Number & Algebra, Shape & Space, Measures, and Data).
Overall performance
For mathematics, the overall percent correct scores were 57% for Second Class and 55% for Sixth Class. For content, percent correct ranged from 49% (Measures) to 73% (Shape & Space) at Second class, and from 38% (Measures) to 64% (Data) at Sixth. For process, percent correct ranged from 49% (Apply & Problem-Solve) to 74% (Understand & Recall) at Second class, and from 44% (Apply & Problem-Solve) to 63% (Reasoning) at Sixth. Thus, items assessing Measures and Apply & Problem-Solve proved to be the most difficult at both class levels. There were no gender differences on overall performance, but a significant difference was found in favour of boys on one subscale (Measures, Sixth class only).
For reading, the percent of items answered correctly at Second class was 63% (overall, and for Vocabulary and Comprehension). At Sixth class the overall percent correct was 65% (64% correct for Vocabulary and 66% for Comprehension). At each grade Retrieve items proved easiest (65% correct at Second, 70% at Sixth). At Second class, Infer items proved most difficult (59% correct), while Interpret & Integrate proved most difficult at Sixth (54% correct). At Second class, girls performed significantly better than boys overall, and in each content area. At Sixth, the gender difference was not statistically significant for overall reading performance, or for any content area or process skill.
Test scores were also grouped by proficiency levels (clusters of skill-sets and competencies describing what pupils are likely to be able to do.). To facilitate comparability across grade and domain, the cutpoints used to create each proficiency scale were based on pre-defined percentages of pupils. Thus, 10% of pupils were classified as at Level 4; 25% at Level 3; 30% at Level 2; and 25% at Level 1, with 10% of pupils described as failing to reach Level 1. While pupils scoring below Level 1 may
1 The previous National Assessments (2004) assessed mathematics at Fourth and reading at First and Fifth class.

have some basic reading or mathematics skills, those skills were not fully assessed in NA 2009. In much the same way as scale scores do, proficiency levels provide baseline data against which future performance can be compared.
Factors Related to Achievement
Pupil characteristics associated with higher performance included high attendance rates, positive ratings by themselves, their teachers and parents on the domain, positive mathematics self-concept (for mathematics performance), enjoyment of reading (for reading performance), and not being in receipt of additional support in school. Pupils in receipt of additional support for English
or mathematics performed poorly on both assessments, while those receiving language support performed poorly on reading and slightly below average on mathematics. Lower pupil achievement was linked to a number of demographic characteristics, including familial low socioeconomic status (SES), parental unemployment, membership of the Traveller community, speaking a first language other than English or Irish, living in a lone-parent household, or being part of a large family. Home “process” variables that were positively related to achievement included parents reading for enjoyment, the availability of resources such as books in the home, parental confidence in their ability to assist their child with reading or mathematics homework, and pupils spending no more than a moderate amount of time on school days on the internet or playing computer games.
Classroom or teacher characteristics significantly associated with achievement included teaching experience, possession of an additional teaching qualification (such as an M.Ed.), and – for Second class mathematics – teacher confidence in their ability to teach reading and mathematics. For Sixth class mathematics, higher test scores were associated with infrequent use of tablebooks, while for Sixth class reading, infrequent use of workbooks was associated with higher scores. School-level characteristics associated with higher achievement on both assessments included a high SES enrolment (e.g., non-SSP/DEIS school, few pupils covered by the Books Scheme), high attendance rates, and few pupils in receipt of language or learning support. Principals’ estimates of the percentage of their schools’ enrolment likely to perform at or below the 12th percentile on English or mathematics tests showed stronger correlations with school-level achievement than did the percentage of enrolment in receipt of additional support for English or mathematics.
At both pupil- and school- level, achievement on one domain was highly correlated with achievement on the other, and with SES. However, a small number of schools did better or worse than might be predicted from their intake characteristics. The minority of pupils that performed significantly better on the reading than the mathematics test were more likely to be girls, to have more positive attitudes to reading, and to have more books in their homes. Schools with a significant reading-advantage were more likely to be all-girls or SSP/DEIS schools. Pupils with a significant mathematics-advantage were more likely to be boys, to have higher mathematics self-concept, and to speak a language other than English or Irish at home. Mathematics-advantage schools were more likely to be all-boys or rural schools.
Trends on Non-Achievement Variables
Although NA 2009 presents baseline achievement data, some comparisons can be made with non-achievement data from the 2004 assessments. However, as the target grades differed, it is more appropriate to look for broad trend indicators, rather than statistically significant differences. In terms of the home, increases were noted in the percentages of pupils from lone parent families, with no employed
viii
The 2009 National Assessments of Mathematics and English Reading

parent, and with a quiet place to study. The number of books in the home remained largely unchanged, but the percentages with home internet access almost doubled. Increases were noted in the percentages of pupils born outside of Ireland or with a mother tongue other than English or Irish. Pupils’ academic aspirations were similar to 2004, but academic expectations had increased in the interim (i.e., similar percentages wanted to attend college or university, but more expected to do so).
Regarding teachers, the most notable change was that all pupils in NA 2009 were taught by qualified teachers, whereas in 2004, between 4% and 9% of pupils (more in designated disadvantaged schools) were taught by an unqualified teacher. Time allocated to English lessons decreased since the last National Assessments, while time allocated to mathematics lessons increased. Half of pupils surveyed had an interactive whiteboard in their school – technology that barely registered in schools in 2004. The ratio of computers to pupils also improved slightly, but, as in 2004, a large minority of pupils rarely or never used computers in English or mathematics lessons.
Recommendations
1. Future changes to the English curriculum should promote use of self-regulated comprehension strategies at all class levels, across a range of paper and digital texts. Changes to mathematics should promote a stronger social constructivist perspective, including using problems to develop mathematical thinking, teach mathematical concepts and problem-solving strategies. Generally, clearer identification of key cross-curricular skills and processes might help teachers to address curriculum overload.
2. In all schools, the results of standardised English and mathematics tests should be shared at least annually. Individual outcomes should be used to inform pupils and parents about progress, to plan learning programmes around key objectives, and to inform differentiated classroom instruction. Pooled outcomes should be used to identify school-level targets. To facilitate these activities, schools and teachers should have access to appropriate supports, including software.
3. Principals and teachers should ensure that assessment for learning is a feature of every classroom, with good practice shared at school-level. Both cross-curricular and subject-specific strategies should be used – e.g., using miscue analysis (reading), observing pupil response methods, ability to connect modes of representation, and use of problem-solving strategies (mathematics).
4. Schools, led by principals, need to develop a more integrated approach to LS/RT. Where possible, provision needs to be restructured to increase in-class provision, and to support collaboration between class teachers and SEN personnel.
5. Organisations providing CPD should ensure that each course offered adheres fully to the TES guidelines, is of high quality, and directly relevant to teaching. The suite of courses they offer should provide adequate coverage of literacy and numeracy.
6. Each school should have a CPD plan that identifies key school- and individual-level CPD needs. Those identified needs should be the criteria on which participation in CPD is based.
7. For mathematics, additional CPD is needed on developing mathematical thinking, problem-solving skills and on incorporating calculator use into lessons. For reading/English, additional CPD is needed on developing pupils’ writing skills, teaching comprehension strategies, and using multi-genre texts (including digital texts) to explore a common theme.
8. ICT is an area in which many teachers feel they need additional skills. Therefore, in the context
ix
Executive Summary

of our earlier recommendations for CPD, teachers should have greater access to courses and packages that support innovative and constructivist methods of teaching and learning in English and maths.
9. In line with the curriculum and with international best practice, calculators should be an integral part of the teaching and learning of mathematics in all classrooms from Fourth class onwards.
10. Classroom practice should reflect advances in the teaching of problem-solving. Pupils should spend more time solving substantial problems, analysing and discussing problems with other pupils and their teacher, and acquiring improved understanding of the concepts and skills involved. Teachers should ensure that pupils meet a range of problems across curriculum strands, including complex problems embedded in real-life contexts and those of a non-routine nature.
11. Schools should make greater use of aggregated data (particularly from standardised tests) to identify strengths and weaknesses across grade levels and curricular areas. The resultant planning and actions should be grounded in what research indicates are characteristics of effective schools – e.g., strong leadership, collaborative and consistent approaches to teaching, and ongoing appraisal of teaching and learning.
12. Pupils should be encouraged to engage with reading and mathematics to the best of their ability, unconstrained by gendered notions about the value of either. To this end, class libraries should contain a balance of text types, rather than the current strong bias towards fiction texts, while mathematics lessons should incorporate a greater focus on collaborative problem-solving and discussion.
13. The DES should initiate a public information campaign to advise parents about practices that help their child’s general academic development (e.g., discussing books, estimating sizes or costs), and about practices that do not (e.g., unmonitored access to a TV in the bedroom). It should be supported at school level by advice to parents on specific curricular areas, particularly mathematics.
14. Schools should recognise that parents are entitled to information about their child’s performance relative to classmates and to national standards. Parents should be provided with written and verbal feedback on performance –including, but not limited to, the results of standardised tests.
15. Future research needs include both longitudinal and observational educational research (particularly classroom discourse around reading comprehension and problem-solving), a review of textbooks, and research to build on the initial analyses of atypical performance contained in Chapter 6 of this report.
The 2009 National Assessments of Mathematics and English Reading
x

List of Acronyms and AbbreviationsDES Department of Education and Science / Department of Education and Skills
DEIS Delivering Equality of opportunity In Schools
ERC Educational Research Centre
IALS International Adult Literacy Survey
IAEP International Assessment of Educational Progress
CPD Continuing Professional Development
ICT Information and Communications Technology
IRT Item Response Theory
LS/RT Learning Support / Resource Teaching
OECD Organisation for Economic Co-operation and Development
PIRLS Progress in International Reading Literacy Study
PISA Programme for International Student Assessment
PSEC Primary School English Curriculum
PSMC Primary School Mathematics Curriculum
SEN Special Educational Needs
SSP School Support Programme
SES Socioeconomic Status
TES Teacher Education Section
TIMSS Trends in International Maths and Science Study
Executive Summary
xi

The 2009 National Assessments of Mathematics and English Reading
xii
1

IntroductionThis report describes the 2009 National Assessments of English reading and mathematics (NA 2009), conducted on Second and Sixth class pupils in Irish primary schools. Assessment, in its many forms, is a regular feature of school life. Pupil self-assessment is envisioned as a core part of our primary curriculum, while teachers use formal and informal assessments to monitor progress, identify pupil difficulties, and to inform individual- and school-level approaches to learning. Assessments are used by schools and universities to select their intake, by national governments to assess educational outcomes (what pupils have learned), and by international agencies to compare educational outcomes across different educational systems.
Assessments that may have significant positive or negative consequences are often called “high-stakes” assessments. Ireland’s Leaving Certificate examination and the SAT Reasoning Test (used for US college admissions) are examples of assessments that are high-stakes for the individual, while the UK’s national curricular assessments at age 11 could be considered high-stakes for the schools and teachers involved.
In contrast, Ireland’s National Assessments are low-stakes assessments. They measure performance at system-level, but do not foster practices such as “teaching for the test”, and consequently, can provide realistic measures of standards. Greaney and Kellaghan (1996) identified eight main uses for the national-level data derived from such assessments: informing policy, monitoring standards, identifying correlates of achievement, introducing realistic standards, promoting accountability, increasing public awareness, directing teachers’ efforts and raising pupil achievement, and informing political debate. These are reflected in the aims of NA 2009, which are to:
• establish current reading and mathematics standards of Second and Sixth class pupils;
• provide high quality and reliable data for the (then) Department of Education and Science2 to assist in policy review and formulation and in decisions regarding resource allocation;
• examine school, teacher, home background, and pupil characteristics, and teaching methods which may be related to reading and mathematics achievement;
• provide a basis against which to compare outcomes of future assessments of English reading and mathematics at Second and Sixth classes.
The rest of this chapter is divided into three sections, the first of which describes previous Irish national assessments, and outlines how the present assessments differ. The second describes some international comparative studies of achievement in which Ireland has participated, while the third outlines some factors found in previous research to be related to reading or to mathematics achievement.
National Assessments in Ireland
Ireland’s first National Assessment was carried out in 1972, shortly after the introduction of Curaclam
na Bunscoile (Department of Education, 1971). The 1972 assessment examined the reading skills
2 In March 2010, the Department was re-named the Department of Education and Skills.
1
1

of a sample of 10-year-olds, and was followed by the first National Assessment of mathematics in 1977. Either mathematics or reading was assessed at regular intervals from then until 2004, when both were assessed (in the same schools but at different class levels) (Table 1.1). Over the years, the assessments have also used questionnaires to gather contextual information, such as information about family background. This has allowed an examination of the relationships between achievement (test scores) and characteristics of individual pupils, or of their families or school environments.
Table 1.1: Previous Irish national assessments of reading and/or mathematicsYear Domain Targetgroup Approx .Npupils Report1972 English reading 10-year olds 4,500 Unpublished1977 Mathematics 2nd & 4th classes 4,000 Dept of Education (1980)1979 Mathematics 6th class 2,000 Dept of Education (1980)1980 English reading 4th & 5th classes 2,400 Dept of Education (1982)1984 Mathematics 6th class 2,400 Dept of Education (1985)1988 English reading 5th class 2,200 Dept of Education (1991)1993 English reading 5th class & 11-year olds 4,000 Unpublished ERC (1995)1998 English reading 5th class 4,000 Cosgrove et al. (2000)1999 Mathematics 4th class 5,000 Shiel & Kelly (2001)
2004{ English reading 1st & 5th class 8,000 Eivers et al. (2005)Mathematics 4th class 4,000 Shiel et al. (2006)
National Assessments of English Reading
The first four national assessments of English reading (1972 to 1993) used a British-developed sentence-completion test called the National Survey Form 6 (NS6). In addition, the Schonell (Form A) and Kingston tests were used in 1972, and the Schonell in 1980. A key finding in 1972 was that NS6 scores for Irish 10-year olds were about 1 year six months behind their British counterparts, and 1 year five months behind pupils in Northern Ireland (Mulrooney, 1986) while scores on the Schonell were about one year behind English pupils3. By the 1980 assessment, the gap for 10-year olds was about 6 months on the NS6, and 3 months on the Schonell Test. Hence, two separate measures showed that the reading performance gap between pupils in Ireland and Britain reduced considerably between 1972 and 1980. One contributing factor may have been the introduction of the 1971 curriculum, the effects of which would not have been fully apparent in 1972. The results of a series of Dublin-based studies regularly conducted between 1964 and 1979 provide some support for this view. No significant improvement on NS6 scores were found between 1964 and 1969, but considerable improvements were found in the 1970s (McDonagh, 1973; Travers, 1976; Ward, 1982). In 1988, two new tests were introduced to complement the NS6. The D88 was a vocabulary and reading comprehension test produced from pre-existing test materials (Educational Research Centre, 1977), while the ST88 was based on materials developed by the Assessment Performance Unit of the UK Department of Education and Science. The D88 enabled the use of Irish norms, while the ST88 offered more variation in the type of reading tasks presented. Results revealed no significant improvement among Fifth class pupils on the NS6 (since 1980) or on the D88 (since its standardisation in 1977). Some differences were found between Irish and British pupils on the ST88. For example, on ST88 items dealing with the use of reference material, Irish pupils’ mean percent correct was 65%, compared with 85% for the comparable British sample. Irish performance on the NS6 was also slightly poorer than that of British pupils, but item analyses
3 Similar differences in standards were found in earlier studies (MacNamara, 1966; Kelly & McGee, 1967).
The 2009 National Assessments of Mathematics and English Reading
2
revealed that a small number of items did not work properly in an Irish context, and were depressing the overall Irish score.
The NS6 was used for the last time in 1993, when it was found that performance on the test remained unchanged since 1988 and, by extension, unchanged since 1980. It was replaced by a new test – Tasks for the Assessment of Reading Achievement (TARA). TARA was an Irish-developed test, inspired by the ST88 and the IEA Reading Literacy Study (Martin & Morgan, 1994). Baseline data were established for TARA in 1993, and compared with subsequent performance in 1998 and 2004. Overall performance remained unchanged over that time, despite the implementation of the 1999 Primary School English Curriculum in 2001, though the 2004 assessment did find that higher-achieving pupils had made a small but significant improvement on the documents subscale. Also in 2004, a new test, based on the 1999 Primary School English Curriculum, was administered to pupils in First class.
National Assessments of Mathematics
National assessments of mathematics conducted in the late 1970s and early 1980s were based on the 1971 mathematics curriculum (Department of Education, 1971). Scores were generated for each mathematics content area, but no overall index of performance was constructed. Across class levels, pupils were found to do well on Whole Number Operations, but poorly on Whole Number Structure, Problems and Geometry (Department of Education, 1980, 1985). There was relatively little change in performance at Sixth class between 1979 and 1984, although mastery of long division dropped slightly. A more detailed analysis of the structure of the earlier assessments and their outcomes can be found in Shiel and Kelly (2001).
The first National Assessment to be based on the revised primary school mathematics curriculum (DES/NCCA, 1999b) was in 1999. Although the pupils tested did not have experience of the revised curriculum, they were tested on it so that baseline performance could be established prior to implementation. One consequence of this was that a “calculator” unit was included in the new test. Other features of the 1999 and 2004 assessments were the shift to Fourth class as the target grade, the generation of an overall measure of performance, and scores on the mathematics content areas.
Overall performance in 1999 and in 2004 was not significantly different, indicating no change in overall achievement. However, there were significant improvements on two mathematics content areas (Data and Shape & Space) and one skill process (Reasoning). In both assessments, relative weaknesses were identified in the content areas of Measures and Number, and the process skills of Applying & Problem-solving. The 2004 assessment also saw the establishment of proficiency levels, with 12.4% of pupils scoring at a “minimal” level. This means that they could only answer the easiest mathematics items correctly – e.g., recalling basic multiplication and division facts, identifying place value in decimal numbers and identifying properties of 2D shapes. A further 2.4% scored below minimal level, indicating that the test was unable to measure their mathematics skills. Therefore, about 15% of pupils were likely to experience difficulties in learning mathematics.
How 2009 Differs From Previous Assessments
The 2009 National Assessments differ from previous National Assessments in a number of ways. First, the same pupils were selected to participate in both the reading and mathematics assessments. Thus, it is now possible to compare pupil performance on the two domains. Second, the target
3
Introduction
grades are now the same for English reading and for mathematics. In 2004, First and Fifth classes were assessed for reading and Fourth classes for mathematics. In contrast, the 2009 study assessed Second and Sixth class pupils. These grades were chosen by the DES because pupils in these classes are expected to display the knowledge and skills that should be acquired by the end of the junior and senior cycles of primary school, respectively.
Third, the change in target grades necessitated the development of new test materials and ancillary instruments (such as Pupil Questionnaires). These were underpinned by new assessment frameworks for English reading and for mathematics that were appropriate to the target grades and reflected recent developments in the relevant disciplines. Such frameworks are descriptions of what is being assessed, how it is being assessed, and why it is being assessed (Kirsch, 2001). Although primarily used to guide the construction of tests, they are also of interest to wider audiences. Both frameworks are briefly described in Chapter 2, and are available in full at www.erc.ie/NA2009.
For logistical reasons, the 2009 assessments did not include assessments of Fourth class (for mathematics) and Fifth class (for reading). Assessment of these grades would allow trend data to be maintained from 1972, and although not possible as part of the 2009 assessments, might prove feasible later.
Irish Participation in International Assessments
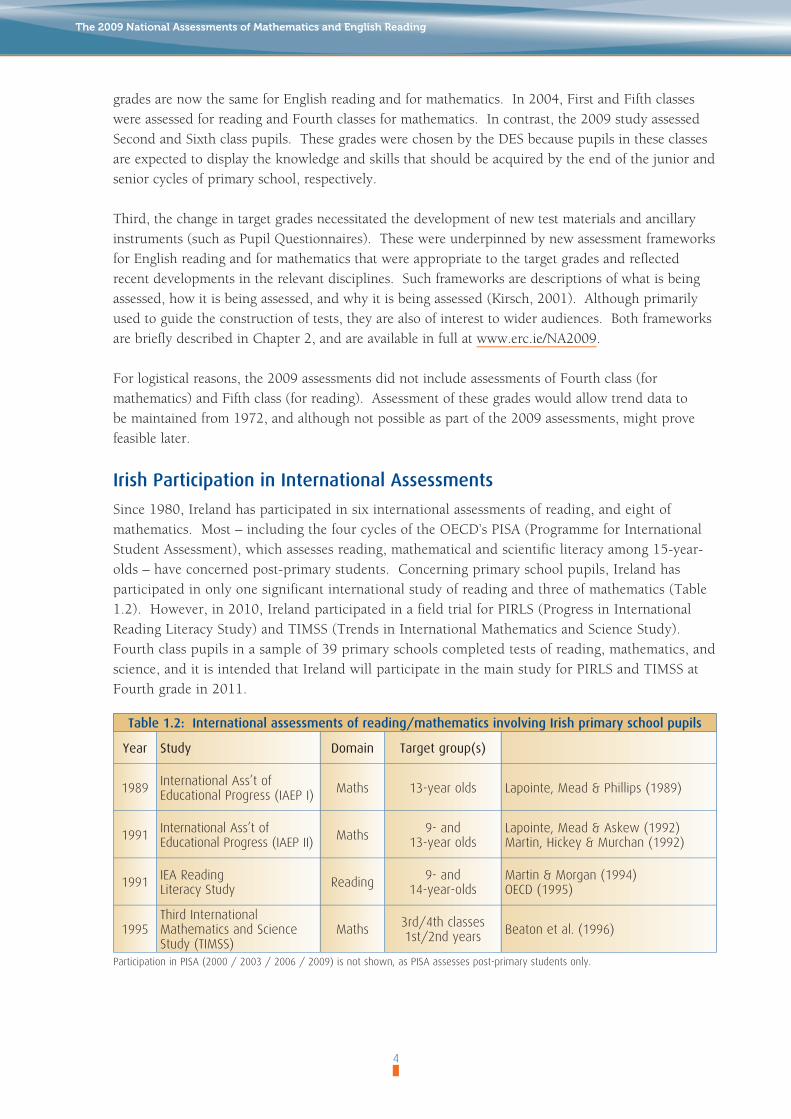
Since 1980, Ireland has participated in six international assessments of reading, and eight of mathematics. Most – including the four cycles of the OECD’s PISA (Programme for International Student Assessment), which assesses reading, mathematical and scientific literacy among 15-year-olds – have concerned post-primary students. Concerning primary school pupils, Ireland has participated in only one significant international study of reading and three of mathematics (Table 1.2). However, in 2010, Ireland participated in a field trial for PIRLS (Progress in International Reading Literacy Study) and TIMSS (Trends in International Mathematics and Science Study). Fourth class pupils in a sample of 39 primary schools completed tests of reading, mathematics, and science, and it is intended that Ireland will participate in the main study for PIRLS and TIMSS at Fourth grade in 2011.
Table 1.2: International assessments of reading/mathematics involving Irish primary school pupils
Year Study Domain Targetgroup(s)
1989 International Ass’t of Educational Progress (IAEP I) Maths 13-year olds Lapointe, Mead & Phillips (1989)
1991 International Ass’t of Educational Progress (IAEP II) Maths 9- and
13-year oldsLapointe, Mead & Askew (1992)Martin, Hickey & Murchan (1992)
1991 IEA Reading Literacy Study Reading 9- and
14-year-oldsMartin & Morgan (1994)OECD (1995)
1995Third International Mathematics and Science Study (TIMSS)
Maths 3rd/4th classes 1st/2nd years Beaton et al. (1996)
Participation in PISA (2000 / 2003 / 2006 / 2009) is not shown, as PISA assesses post-primary students only.
The 2009 National Assessments of Mathematics and English Reading
4

Mathematics
As the target age group for IAEP I was 13-year-olds, very few participants were in primary school. Thus, IAEP II (conducted in 1991) can be considered the first study that allowed a detailed comparison of the mathematical abilities of Irish primary pupils with those of primary pupils in other countries. Results indicated that, on average, Irish 9-year-olds answered 60% of mathematics questions correctly, just below the average of 63% correct across all 14 participating countries. Seven countries (including Korea, Israel and the (then) Soviet Union) had significantly higher average mathematics performance than Ireland, four had similar overall average scores to Ireland, while only Slovenia and Portugal had significantly lower overall average scores (Martin, Hickey & Murchan, 1992). In terms of mathematical content areas, Irish pupils were relatively weak in Geometry, Data Analysis, and Statistics & Probability.
The 1995 TIMSS study gave a more positive view, as Irish Third class pupils ranked seventh of 16 countries, while Fourth class pupils were significantly above the international mean score, and ranked 6th of 14. Again, however, Irish pupils displayed a relative weakness on Geometry. TIMSS also assessed 1st and 2nd year students. At these grade levels, Irish students also performed significantly above the international average. In contrast, the three cycles of PISA for which results have been released show that Ireland’s 15-year-olds consistently achieve mean scores close to the OECD average (OECD, 2001; 2004; 2007). For example, in 2003, when mathematics was the major PISA domain4, Ireland ranked 17th of 29 OECD countries, and 20th of 40 participating countries. Irish students displayed relative strengths in the PISA content areas of Change & Relationships and Uncertainty, and a relative weakness on Space & Shape (which includes both geometry and measurement items).
Reading
The only international comparative study of reading achievement in which Irish primary pupils participated was the 1991 IEA (International Association for the Evaluation of Educational Achievement) study. In this, Irish 9-year-olds (all in Third class) scored close to overall international and OECD average scores (12th of the 27 participating countries, and 10th of the 19 participating countries that were OECD members) (Martin & Morgan, 1994; OECD, 1995). Irish pupils performed best on Narrative texts, next best on Expository texts, and poorest on Documents.
Other comparative studies of reading achievement conducted in Ireland on non-primary school populations include the International Adult Literacy Survey (IALS) and PISA. In 1994, Ireland took part in the IALS, which surveyed adults aged 16 to 65. Ireland’s adults performed relatively poorly, ranking 14th of 22 countries/regions on the Prose scale and 17th on the Documents scale (OECD/Statistics Canada, 2000). However, this was largely attributable to a very poor performance among the older adults assessed. In contrast, PISA results consistently show Irish 15-year-olds performing above the OECD average for reading (OECD, 2001; 2004; 2007). For example, in PISA 2006, Irish students ranked 5th of 30 OECD countries and 6th of all 56 countries for which reading data were available. In PISA 2000, when reading was
4 In each PISA cycle, one of the three domains (reading, mathematical and scientific literacy) is selected as the major domain. This means that the majority of test items and questionnaire data relate to that domain. Reading was the major domain in 2000 and 2009, as was mathematics in 2003, and science in 2006.
Introduction
5
the major domain, Irish students showed a particular strength on the Reflect & Evaluate scale (items which required the reader to draw on their own knowledge, experience or ideas in evaluating a text).
Factors Associated With Achievement
Tables 1.3 to 1.5 list some of the main correlates of reading and mathematics achievement reported in previous research. The tables are divided into individual pupil characteristics, characteristics of pupils’ homes, and characteristics of schools and classrooms. The tables are elaborated upon in the text, and supporting research is discussed. As the present study is an Irish National Assessment, priority was assigned to research that was recent, Irish-based, or relating to primary-aged pupils. Consequently, two research reports (Eivers, Shiel, Perkins & Cosgrove, 2005, and Shiel, Surgenor, Close & Millar, 2006) are frequently cited. The former describes the results of the 2004 National Assessment of English Reading in Ireland, while the latter describes the equivalent study for mathematics. Also frequently cited are Eivers, Shiel and Shortt (2004), a survey of reading among pupils in designated disadvantaged schools in Ireland, and the reports of the 1998 National Assessment of English Reading (Cosgrove, Kellaghan, Forde & Morgan, 2000) and 1999 National Assessment of Mathematics Achievement (Shiel & Kelly, 2001).
Non-Irish research cited includes PIRLS (Progress in International Reading Literacy Study) (Mullis, Martin, Kennedy & Foy, 2007) and TIMSS (Beaton, Mullis, Martin, Gonzalez, Kelly, & Smith, 1996), two international studies of achievement among primary pupils. We also draw on the OECD’s PISA studies (Cosgrove, Shiel, Sofroniou, Zastrutzki & Shortt, 2005; Eivers, Shiel & Cunningham, 2008; Shiel, Cosgrove, Sofroniou & Kelly, 2001; OECD, 2001, 2004, 2007), as, although not based on primary pupils, PISA studies are recent, and Ireland is a participant.
Most of the findings reported are based on what are called “univariate analyses”. This is where the relationship between a given variable (or characteristic) and achievement is examined without considering other variables. However, sometimes such relationships are not statistically significant when other variables are also considered (e.g., a particular feature of a school is no longer significantly related to achievement once socioeconomic characteristics of the enrolment are considered). This should be borne in mind when reviewing the research findings in the following sections.
Individual Characteristics
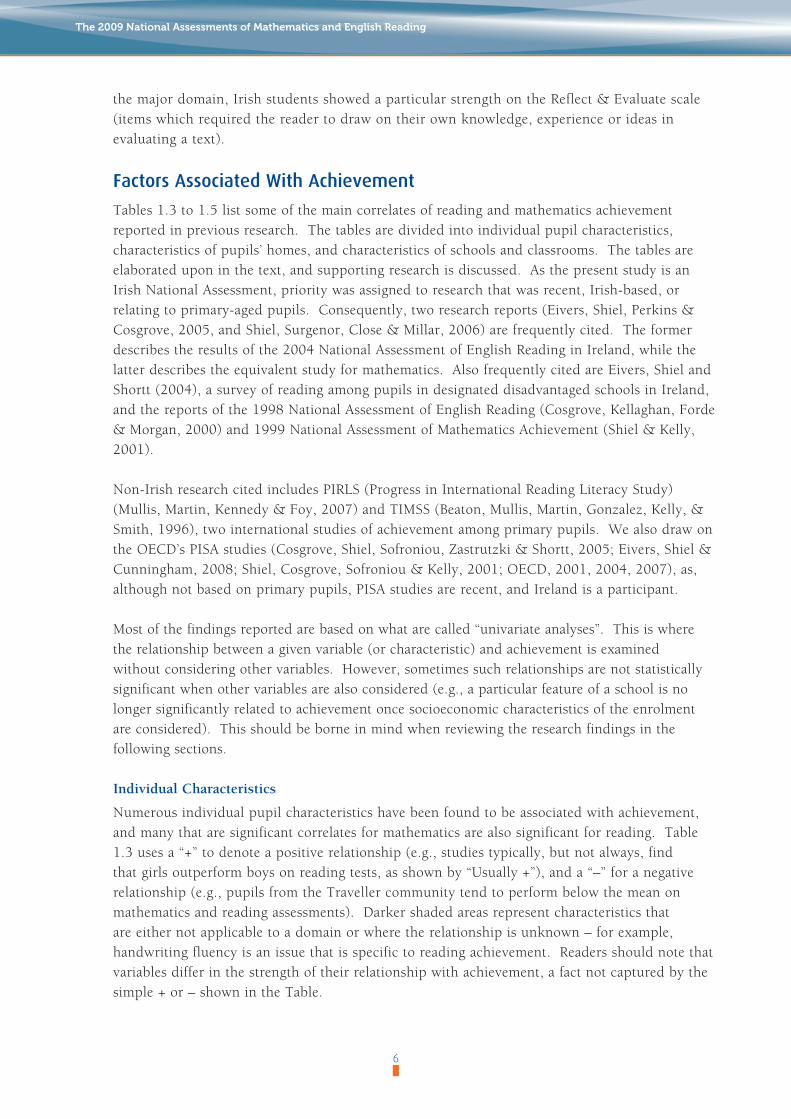
Numerous individual pupil characteristics have been found to be associated with achievement, and many that are significant correlates for mathematics are also significant for reading. Table 1.3 uses a “+” to denote a positive relationship (e.g., studies typically, but not always, find that girls outperform boys on reading tests, as shown by “Usually +”), and a “–” for a negative relationship (e.g., pupils from the Traveller community tend to perform below the mean on mathematics and reading assessments). Darker shaded areas represent characteristics that are either not applicable to a domain or where the relationship is unknown – for example, handwriting fluency is an issue that is specific to reading achievement. Readers should note that variables differ in the strength of their relationship with achievement, a fact not captured by the simple + or – shown in the Table.
The 2009 National Assessments of Mathematics and English Reading
6
Table 1.3: Summary table of selected individual characteristics associated with achievementReading Maths
Demographic
Home language not language of instruction – –Member of the Traveller community – –Girl Usually + Mixed resultsAge Depends on grade Depends on grade
Attitudinal
Positive attitudes towards the domain (reading/maths) + +
Interest in the domain + +Motivation towards the domain + +Self-efficacy in the domain + +High academic aspirations and goals + +Subject anxiety –
BehaviouralAbsenteeism – –Behaviour in class (e.g., concentration) + +
In-school
Positive teacher ratings in the domain + +Receipt of additional support (e.g., learning support) – –
Use of metacognitive strategies + +Handwriting fluency +
A number of demographic characteristics are associated with both reading and mathematics achievement. Pupils who speak a language at home other than English or Irish tend to perform poorly in reading assessments (Eivers et al., 2005). Similar findings have been reported at post-primary and in other countries (Eivers et al., 2008; Mullis et al., 2007; Martin, Mullis & Foy, 2008). In Ireland, pupils who are members of the Traveller community typically obtain lower scores on reading and mathematics tests than pupils from the settled community (e.g., Cosgrove et al., 2005; Eivers et al., 2004, 2005).
Regarding pupil age, the 2004 National Assessments found that, for reading, pupils who were younger than average for their grade performed relatively poorly on the First class assessment but displayed average achievement on the Fifth class test. For mathematics, the 2004 National Assessments only assessed Fourth class pupils (finding no age effects). The relationship between pupil gender and achievement is perhaps the most complicated. In the case of reading, girls typically perform better than boys on achievement tests at primary (Eivers et al., 2005) and post-primary (all cycles of PISA released thus far) levels, as well as on Junior Certificate and Leaving Certificate examination results in English. However, while the 1998 National Assessment also revealed significantly higher reading performance among girls, gender differences were not significant in the 1993 assessment (Cosgrove et al., 2000). Further, the Eivers et al. (2004) study of pupils in designated disadvantaged schools found that girls outperformed boys in First and Third, but not Sixth, class. Thus, girls often, but not always, outperform boys on reading assessments.
In the case of mathematics, research from the 1970’s and 1980’s found that while girls performed significantly better than boys in the early and middle classes of primary school, the situation was reversed by the end of primary school, and in post-primary school (Department of Education, 1977, 1980, 1985; Lynch, Close & Oldham, 1994). Gender differences were not found in the 1999 and 2004 National Assessment in mathematics nor in the two international surveys of mathematics (IAEP II, TIMSS 1995) conducted in the 1990s in which Ireland participated. However, over the past ten years, girls have performed better than boys in the Junior Certificate mathematics examinations,
Introduction
7

while boys have performed significantly better than girls in the PISA mathematics surveys (Close & Shiel, 2009). Thus, the direction of gender differences in mathematics seems to depend on the age of pupils being tested and the type of test being taken.
Many studies have found that pupil attitudes – e.g., interest and enjoyment, motivation, and self-efficacy in the domain – are associated with both mathematics and reading achievement (Eivers et al., 2005; Shiel et al., 2001; Shiel & Kelly, 2001). Pupils who have positive attitudes towards their own ability in the subject, towards school in general and who have high academic aspirations or expectations (e.g., want to, or expect to, attend college) typically have higher than average reading and mathematics achievement (Eivers et al., 2004, 2005; Weir & Milis, 2001). Specific to mathematics, “maths anxiety” has been linked with poorer performance on the PISA mathematics assessment (Cosgrove et al, 2005). Of course, there is an element of circularity, in that positive/negative attitudes may feed into higher/lower achievement, which in turn leads to more positive/negative attitudes.
Pupil behaviours, such as participation in class, attention span, persistence in school work, and ability to work with limited supervision were also shown to have significant positive relationships with achievement in both domains, with girls likely to be rated more highly than boys by their teachers on these characteristics (Eivers et al., 2005; Shiel et al., 2006). Attendance was also found to have a strong positive relationship with achievement, meaning that pupils who are absent on a large number of days usually perform considerably poorer on tests of reading and mathematics achievement than do pupils who are rarely absent (Eivers et al., 2005; Shiel et al., 2006). Further, Eivers et al.’s 2004 study of reading among pupils in schools designated as disadvantaged found that not only was the relationship between reading test performance and attendance stronger for First class pupils than for Third or Sixth class pupils, but that a high level of attendance might compensate for pupils not being regularly read to before they began school. Out-of-school behaviours that show positive associations with achievement include frequent reading for pleasure, use of public libraries, and spending moderate amounts of time watching TV or DVDs or playing computer games (Eivers et al., 2005; Shiel & Kelly, 1999).
There is a close link between teacher ratings of pupil reading and mathematical skills and how pupils perform on assessments (Eivers et al., 2005; Shiel et al., 2006). Also, there are very strong links between receipt of additional support (be it learning support, resource or language support teaching) and lower reading achievement (Eivers et al., 2005; Shiel et al., 2006). Specific to reading achievement, positive associations have been found with pupils’ use of metacognitive strategies (e.g., self-monitoring of learning) (Duffy & Roehler, 1987), and with handwriting fluency. The extent to which pupils have developed “automaticity” in handwriting (i.e., can write without the need for conscious attention to letter development) is strongly correlated with reading test scores, even among pupils approaching the end of primary school (Medwell, Strand & Wray, 2007, 2009). Finally, strategies that are specifically related to mathematics achievement include planning and self-monitoring in problem-solving, re-reading problems and trying again (Schoenfeld, 1992; Shiel et al., 2006).
Characteristics of the Home Environment
Table 1.4 summarises some of the main home and family characteristics associated with reading and mathematics achievement. Strong associations between family socioeconomic status (SES) – including parental employment status, income, educational attainment, and family medical card coverage – and achievement are consistent features of Irish and international studies (e.g., Eivers et al., 2005; Shiel
The 2009 National Assessments of Mathematics and English Reading
8
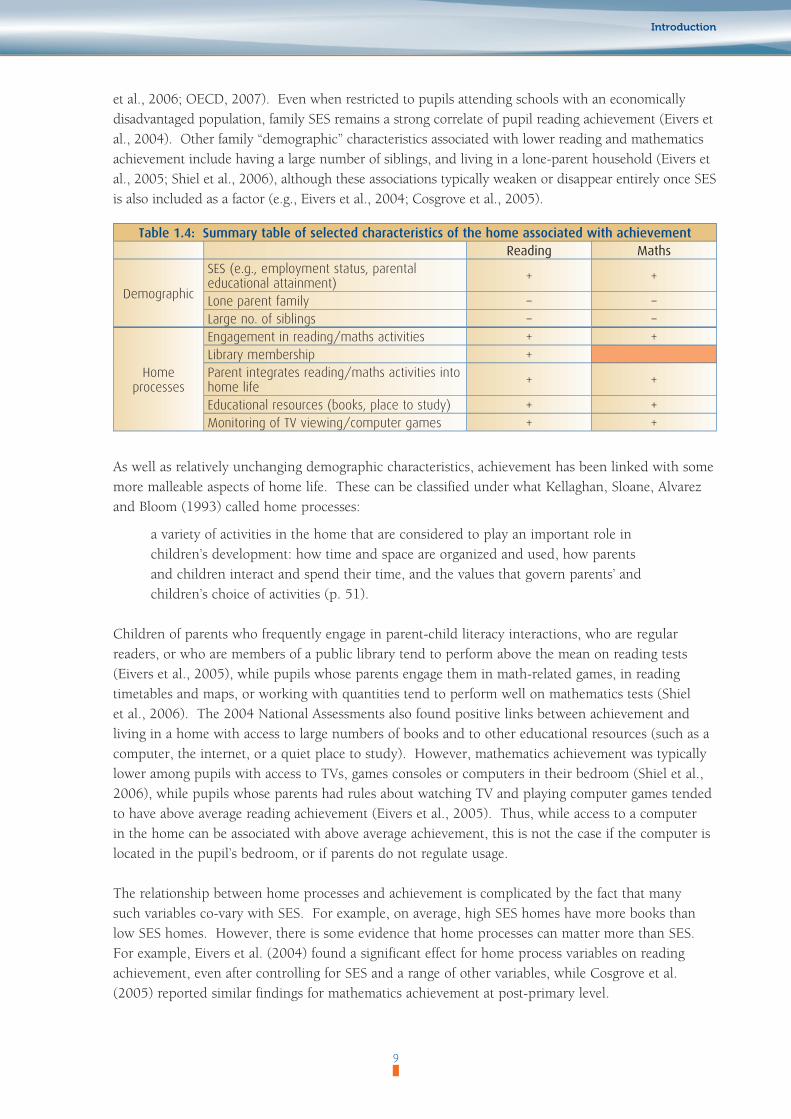
et al., 2006; OECD, 2007). Even when restricted to pupils attending schools with an economically disadvantaged population, family SES remains a strong correlate of pupil reading achievement (Eivers et al., 2004). Other family “demographic” characteristics associated with lower reading and mathematics achievement include having a large number of siblings, and living in a lone-parent household (Eivers et al., 2005; Shiel et al., 2006), although these associations typically weaken or disappear entirely once SES is also included as a factor (e.g., Eivers et al., 2004; Cosgrove et al., 2005).
Table 1.4: Summary table of selected characteristics of the home associated with achievementReading Maths
Demographic
SES (e.g., employment status, parental educational attainment) + +
Lone parent family – –Large no. of siblings – –
Home processes
Engagement in reading/maths activities + +Library membership +Parent integrates reading/maths activities into home life + +
Educational resources (books, place to study) + +Monitoring of TV viewing/computer games + +
As well as relatively unchanging demographic characteristics, achievement has been linked with some more malleable aspects of home life. These can be classified under what Kellaghan, Sloane, Alvarez and Bloom (1993) called home processes:
a variety of activities in the home that are considered to play an important role in children’s development: how time and space are organized and used, how parents and children interact and spend their time, and the values that govern parents’ and children’s choice of activities (p. 51).
Children of parents who frequently engage in parent-child literacy interactions, who are regular readers, or who are members of a public library tend to perform above the mean on reading tests (Eivers et al., 2005), while pupils whose parents engage them in math-related games, in reading timetables and maps, or working with quantities tend to perform well on mathematics tests (Shiel et al., 2006). The 2004 National Assessments also found positive links between achievement and living in a home with access to large numbers of books and to other educational resources (such as a computer, the internet, or a quiet place to study). However, mathematics achievement was typically lower among pupils with access to TVs, games consoles or computers in their bedroom (Shiel et al., 2006), while pupils whose parents had rules about watching TV and playing computer games tended to have above average reading achievement (Eivers et al., 2005). Thus, while access to a computer in the home can be associated with above average achievement, this is not the case if the computer is located in the pupil’s bedroom, or if parents do not regulate usage.
The relationship between home processes and achievement is complicated by the fact that many such variables co-vary with SES. For example, on average, high SES homes have more books than low SES homes. However, there is some evidence that home processes can matter more than SES. For example, Eivers et al. (2004) found a significant effect for home process variables on reading achievement, even after controlling for SES and a range of other variables, while Cosgrove et al. (2005) reported similar findings for mathematics achievement at post-primary level.
Introduction
9

School and Classroom Characteristics
Table 1.5 presents a summary of some of the main school and teacher characteristics associated with performance on assessments of reading and mathematics. Broadly speaking, relationships between achievement and school intake characteristics (such as SES composition) are stronger than relationships between achievement and other types of school or classroom characteristics. As is the case at the level of the individual pupil, school-level SES is one of the strongest predictors of achievement. Schools where the majority of pupils are from low SES families typically have significantly poorer average pupil achievement than schools where most pupils are from middle or high SES backgrounds (e.g., DES, 2005b). For example, in the 2004 National Assessments, pupils in schools designated as disadvantaged obtained significantly lower mean scores on the reading and mathematics tests than those in non-designated schools (Eivers et al., 2005; Shiel et al., 2006).
As well as designated disadvantaged or School Support Programme (popularly known as DEIS) status, other SES indicators – e.g., the percentage of a school’s enrolment in receipt of the Books Grant, covered by the Medical Card scheme, or with unemployed parents – have been linked with both mathematics and reading achievement (Eivers et al., 2005; Shiel et al, 2006). Evidence has also been found that the effects of school and individual SES can combine (Eivers et al., 2004; Shiel et al., 2001). Pupils from low SES families will, on average, be expected to have significantly poorer reading and mathematics achievement if they attend a low SES school than if they attend a high SES school. The effect of school-level SES was most pronounced for boys, meaning that boys attending low-SES schools are particularly at risk of poor reading achievement (Eivers et al., 2004). Other school variables, such as school size and gender composition tend to have weak, and usually non-significant, relationships with mathematics and reading achievement (Eivers et al., 2005; Shiel et al., 2006).
Table 1.5: Summary table of selected characteristics of the school and teacher associated with achievementReading Maths
IntakeDesignated disadvantaged / SSP status – –SES composition + +
School
Class size Mixed MixedMulti-grade classes Mixed MixedAttendance rates + +Home-school links Mixed MixedDisciplinary climate + +
Teacher
Teacher characteristics (e.g., teaching experience) + +
Assessment practices + +Participation in professional development + +
In terms of structural characteristics, previous National Assessments found that smaller class size has a weak negative association with achievement – i.e., pupils in larger classes perform better (Eivers et al., 2005; Shiel et al, 2006). This is an artefact association (disadvantaged schools are allocated smaller class sizes) which is not significant once average school-level SES is factored in. Generally, Irish research has not found significant benefits to achievement from reduced class size. Internationally, analyses of TIMSS data suggest that the US was the only one of the nine countries reviewed where there was a beneficial effect on mathematics achievement from small classes (Pong & Pallas, 2001). Previous National Assessments have not found significant achievement differences based on single- versus multi-grade classes. Eivers et al. (2004) did find significantly higher reading achievement among single-grade (versus multi-grade) pupils in Third class, but no difference at either
The 2009 National Assessments of Mathematics and English Reading
10
First or Sixth class. Thus, the balance of evidence suggests that reduced class size and single grade classes have a weak, or non-significant, relationship with pupil achievement.
Other school-level factors related to achievement include good pupil attendance rates (Eivers et al, 2005; Shiel et al., 2006) and a positive disciplinary climate, even after school-level SES is taken into account (Cosgrove et al., 2005; Shiel et al., 2001). High levels of home-school contact – e.g., courses for parents, or frequent contact between school and parents – have sometimes been found to have a weak negative relationship with achievement (e.g., Eivers et al., 2005). However, this does not imply a causal relationship – low SES schools have traditionally been more likely to run courses for parents, and parents of children who are experiencing difficulties are most likely to be contacted by teachers.
At the classroom or teacher level, teacher qualifications and experience are linked with pupil achievement (although Irish research evidence in this regard is weak due to a dearth of longitudinal studies). However, US research on outcomes from the National Assessment of Educational Progress suggest that teacher qualification and experience are the strongest correlates of reading and mathematics achievement, both before and after controlling for student poverty and language status (Darling-Hammond, 2000). Finally, teachers who engage in regular professional development (Eivers et al., 2005), who report high levels of satisfaction with ICD attended (Shiel et al., 2006), who regularly assess pupils using a variety of methods (Eivers et al., 2005), or who use formative assessment (Black & Wiliam, 1998) are those whose pupils tend to display superior achievement.
Within-School Practices and Reading Achievement
The previous section focussed on how achievement relates to broad characteristics of schools and teachers. In this section, we relate specific classroom practices and school ethos to reading achievement. Unfortunately, there is a dearth of reliable Irish research that uses longitudinal or observational approaches to examining the relationship between achievement and what happens in a class or school. Thus, this section draws heavily on international research, particularly school effectiveness research.
Some of the school-level characteristics linked with superior reading achievement are strong leadership, a collaborative approach, an atmosphere of collegiality, and an emphasis on professional development (Taylor, Pressley & Pearson, 2002), as well as regular assessment and monitoring of pupil achievement (Sammons, Hillman, & Mortimore, 1995). In schools where a large proportion of pupils need additional support for reading, there is evidence that the practice (common in Irish primary schools) of withdrawing pupils to receive additional support is not the most effective method (Shiel, Morgan, & Larney, 1998). In such situations, whole-school re-structuring of reading instruction, coupled with an increase in the amount of instruction time allocated to reading, may be more effective (e.g., Borman, Hewes, Overman, & Brown, 2003; Kennedy & Shiel, 2010).
In terms of classroom teaching practices, the international evidence suggests that effective teachers tend to emphasise that reading is an enjoyable activity, embed their teaching into a wider context, engage in “coaching” pupils on reading strategies, ask higher-level oral comprehension questions following reading, and have high expectations of their pupils (Taylor, Pressley & Pearson, 2002; Wray, Medwell, Poulson & Fox, 2001). They also use a variety of instructional materials – an over-emphasis on the use of basal readers is associated with poorer reading performance (Guthrie, Schafer, Von Secker, & Alban, 2000). Finally, there is a weak, but statistically significant, positive relationship between the number of books in the classroom library and reading achievement (Eivers et al., 2004, 2005).
Introduction
11

Within-School Practices and Mathematics Achievement
In this section we focus on the relationship between classroom and teaching variables and mathematics achievement. As with reading, the lack of relevant large-scale Irish research studies means the following paragraphs refer mainly to international findings.
Linking classroom and teaching variables to mathematics achievement has proved to be difficult. Darling-Hammond’s (1999) major review of research on the relationship between student mathematics achievement and teacher characteristics –including academic ability, subject matter knowledge, knowledge of teaching and learning, teaching experience, teaching behaviours and practices – found the results to be inconclusive. These findings were echoed in a later review by the US Department of Education National Mathematics Advisory Panel (2008). As Hiebert and Grouws (2007) point out, teaching mathematics is a complex system involving the interaction of student, teacher, curriculum, and classroom environmental and resource variables, and they suggest that different teaching methods are effective for different goals, particularly in multi-lesson sequences. For example, expository teaching methods may be adequate for achieving skill efficiency but discovery teaching methods are more effective for developing conceptual understanding and making connections.
Recent TIMSS studies, mainly in post-primary classrooms, have used video to obtain greater reliability and validity in measures of teaching practices (e.g., Stigler, Gonzales, Kawanaka, Knoll, & Serrano, 1999; Hiebert et al., 2003). A conclusion from the studies was that no single method of teaching eighth grade (i.e., Second year, post-primary) mathematics was observed in all the relatively higher achieving countries. A video study of Irish mathematics lessons in second year post-primary revealed that the predominant methodology was expository teaching with a focus on procedural efficiency, with little focus on discovery methods or mathematical understandings and problem-solving skills (Lyons, Lynch, Close, Sheerin & Boland, 2003). There was also a strong belief among the teachers involved that the methods they were using were the most effective in improving learning. These findings are broadly in line with those found in a TIMSS survey of teachers’ views on the teaching of mathematics (Beaton et al., 1996). In Ireland, Delaney (2010) assessed the mathematical knowledge for teaching of 500 primary teachers and found that while Irish teachers demonstrated good knowledge of algebra and fractions and identification of pupil errors, they found applying properties of shapes, numbers and operations, attending to pupil explanations, and assessing pupil understandings more difficult.
How to Interpret the Analyses in This Report
Much of this report describes how pupil achievement relates to “contextual” variables – e.g., scores in single-sex versus mixed schools. Variables are linked with achievement in two ways: correlations and comparisons. Correlations are used for continuous variables (e.g., achievement related to attendance rates or class size). Comparisons are used for categorical variables (e.g., achievement among boys versus girls). This section explains how to interpret each type of information, and describes how to access additional information from the e-appendix and Technical Report.
+Data shown in this report are rounded to the nearest whole number/percentage. Thus, percentages shown in tables may not sum to exactly 100%, while the points difference between two scores as described in the text may differ marginally from the difference between the rounded scores shown in a table.
The 2009 National Assessments of Mathematics and English Reading
12
Inset 1.1: Correlations
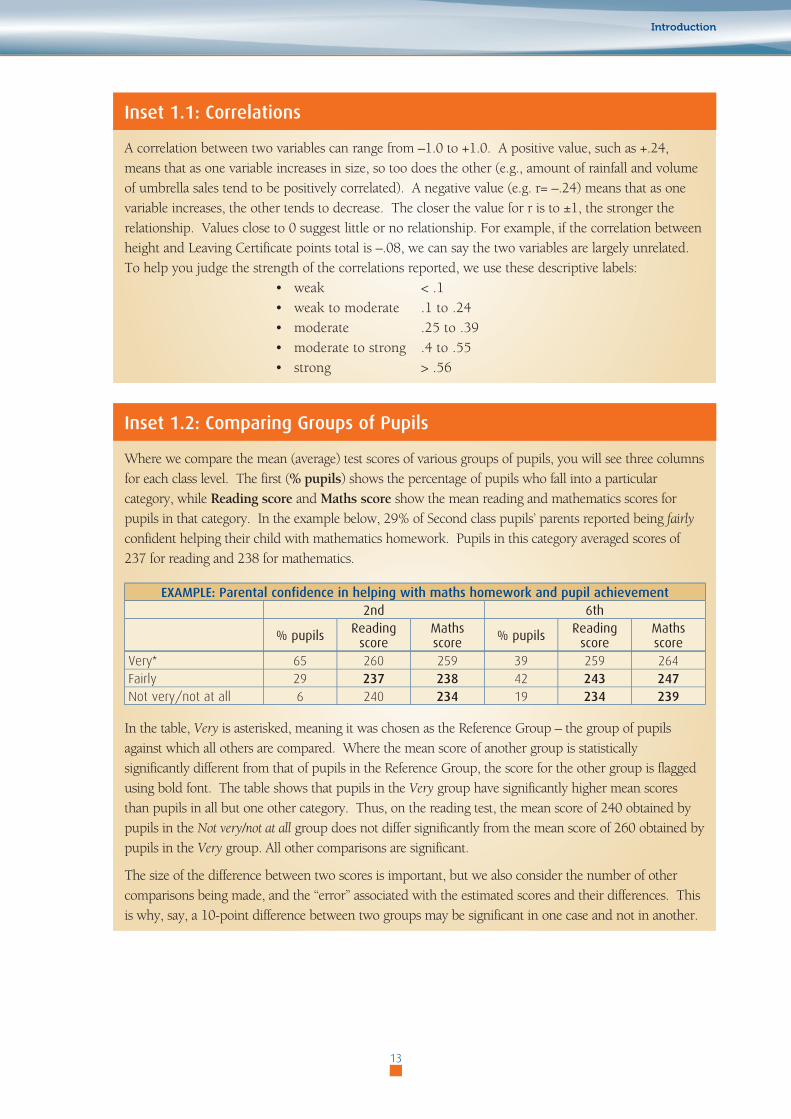
A correlation between two variables can range from –1.0 to +1.0. A positive value, such as +.24, means that as one variable increases in size, so too does the other (e.g., amount of rainfall and volume of umbrella sales tend to be positively correlated). A negative value (e.g. r= –.24) means that as one variable increases, the other tends to decrease. The closer the value for r is to ±1, the stronger the relationship. Values close to 0 suggest little or no relationship. For example, if the correlation between height and Leaving Certificate points total is –.08, we can say the two variables are largely unrelated. To help you judge the strength of the correlations reported, we use these descriptive labels:
• weak < .1 • weak to moderate .1 to .24 • moderate .25 to .39• moderate to strong .4 to .55• strong > .56
Inset 1.2: Comparing Groups of Pupils
Where we compare the mean (average) test scores of various groups of pupils, you will see three columns for each class level. The first (% pupils) shows the percentage of pupils who fall into a particular category, while Reading score and Maths score show the mean reading and mathematics scores for pupils in that category. In the example below, 29% of Second class pupils’ parents reported being fairly confident helping their child with mathematics homework. Pupils in this category averaged scores of 237 for reading and 238 for mathematics.
EXAMPLE: Parental confidence in helping with maths homework and pupil achievement2nd 6th
%pupils Readingscore
Mathsscore %pupils Reading
scoreMathsscore
Very* 65 260 259 39 259 264Fairly 29 237 238 42 243 247Not very/not at all 6 240 234 19 234 239
In the table, Very is asterisked, meaning it was chosen as the Reference Group – the group of pupils against which all others are compared. Where the mean score of another group is statistically significantly different from that of pupils in the Reference Group, the score for the other group is flagged using bold font. The table shows that pupils in the Very group have significantly higher mean scores than pupils in all but one other category. Thus, on the reading test, the mean score of 240 obtained by pupils in the Not very/not at all group does not differ significantly from the mean score of 260 obtained by pupils in the Very group. All other comparisons are significant.
The size of the difference between two scores is important, but we also consider the number of other comparisons being made, and the “error” associated with the estimated scores and their differences. This is why, say, a 10-point difference between two groups may be significant in one case and not in another.
Introduction
13

The E-appendix and Technical Report
This report summarises some of the statistical analyses conducted. It is supported by an e-appendix and Technical Report, both available at www.erc.ie/NA2009. The Technical Report documents the development, administration and scaling of the tests, while the e-appendix provides additional information on the statistical analyses conducted. For all comparisons of means reported here (in text or in tables), the e-appendix provides the following extra information: missing data, Bonferroni Confidence Intervals, and standard errors of differences between means. It also provides the standard errors associated with descriptive data. The e-appendix follows a similar order to this report – e.g., tables from Chapter 5 are found in “Chapter 5: Tables”, and presented in the same sequence. Additional data referred to only in the text in this report are presented at the end of each e-appendix chapter, in the order in which they appear in the present report, with page number indicated in a tablenote.
The 2009 National Assessments of Mathematics and English Reading
14
2
Assessment Frameworks and MethodologyThere are six main sections in this chapter. The first provides an overview of the framework for the reading assessment, and explains how the framework influenced the development of test items. Section two provides similar information for the mathematics framework, while section three describes the development of ancillary materials and questionnaires. The fourth section describes the field trial conducted in 2008, and the fifth describes the sample design and administration of the main assessment, including response rates. The final section describes how data were weighted, scored, and used to develop scales of mathematics and reading achievement.
Reading Framework and Test Development
This section outlines the assessment framework (an explanation of what is being assessed, and how and why it is being assessed) for reading in NA 2009, and explains how the framework led to the eventual test materials developed5. As in the 2004 National Assessment, reading was defined as:
the process of constructing meaning through the dynamic interaction among the reader’s existing knowledge, the information suggested by the written language, and the context of the reading situation. Young readers read to learn, to participate in communities of readers, and for enjoyment (Eivers et al., 2005, p. 15).
Reading comprehension is classified on two different dimensions – the purpose of the text and the processes the reader must use in order to interpret the text. Although the framework emphasises reading comprehension, it also recognises that core reading skills are important elements of an assessment. Thus, there is an explicit requirement for a set of vocabulary items in the test instruments, to assess the ability to decode and process word and sentence meanings.
For young children, the main reasons for reading are either for literary experience or to acquire and use information (Mullis, Kennedy, Martin & Sainsbury, 2006). The former requires the reader to engage with the text and become involved in imagined events, and to enjoy language itself. Children’s experience of literary text is usually via narrative fiction, but poetry and plays also fall under this category. In contrast, reading for informational purposes requires the reader to engage not with imagined worlds, but with aspects of the real universe. Readers learn how the world is and why things work as they do. While literary texts are typically continuous, informational texts can be continuous or non-continuous, and do not always need to be read from beginning to end.
Reading comprehension is also classified by the process (Retrieve, Infer, Interpret & Integrate, Examine & Evaluate) the reader uses to comprehend text. These processes also formed part of the National Assessment 2004 and PIRLS 2006 frameworks, and are summarised in Table 2.1.
5 A more detailed description of the reading framework (and of other topics outlined in this chapter) is available in a companion volume – The 2009 National Assessments Technical Report, available at www.erc.ie/na2009.
15
2

Table 2.1: Processes of reading comprehension, and related examplesProcess Examples
Retrieve requires the reader to read a text, and to understand how what is stated in the text relates to the information that is sought.
Look for specific information, events, ideas, definitions or phrases; identify the setting of a story; find the main theme of a text when explicitly stated.
Infer requires the reader to make inferences about how pieces of information relate to each other. The nature of the relationship is not explicitly stated in the text, but the inferences are usually simple, and based on explicitly stated information.
Deduce or infer that one event caused another; determine the main point of a series of arguments; identify generalisations in a text; describe the relationships between two characters.
Interpret & integrate requires a more holistic understanding of the text, beyond the level of sentence. Some integration of personal knowledge or experience with text content may be required.
Discern the overall message or theme of a text; consider an alternative to actions of characters; compare and contrast text information; infer the mood or tone of a story; apply text information to a real world situation.
Examine & evaluate involves evaluation of a text, either from a personal perspective or a more critical and objective viewpoint. Emphasis changes from understanding the text to critiquing it.
Evaluate the plausibility of what the text describes; identify and comment on the structure and organisation of texts; judge the completeness or clarity of information in a text; identify or comment on the writer’s purposes and viewpoints.
Test Specifications
The framework for reading, the Primary School English Curriculum (PSEC), and a review of the types of reading materials encountered by Second and Sixth class pupils guided the test specifications (i.e., what the test should measure, and how). This section summarises the resultant broad, general specifications agreed for the assessment instruments.
Reading Purposes
As part of the 2004 National Assessment of reading, the Educational Research Centre (ERC) conducted a comprehensive review of English textbooks for First and Fifth class, as these were the then target grades (Cosgrove, Milis, Shiel, Forde & Wardle, 2004). Extrapolating from findings for these grades suggests that 70% to 80% of Second class texts involve reading for literary experience, while 20% to 30% involve reading to acquire and use information. For Sixth class, the split between the two purposes is more even, with a little more than half of texts likely to involve reading for literary experience. Despite the emphasis at Second on literary texts, it was decided that the tests at both grade levels should reflect a relatively even split between literary and informational texts, as both should be very familiar to pupils, and both are core elements of the assessment and the PSEC.
Reading Processes
The processes in which pupils are expected to engage when reading can be inferred from the PSEC. First/Second class pupils are expected to be able to retrieve and infer, and to a lesser extent, to interpret and integrate information. They will also have encountered texts that require examination and evaluation, but their experiences of such processes will be somewhat limited. Consequently, the specifications for the Second class test materials prioritised the assessment of Retrieval processes, followed by Inferences, and then Interpretation & Integration. Due to pupils’ limited exposure to evaluating texts, the Examine & Evaluate process was not included in the test specifications for Second class.
By Fifth/Sixth class, pupils are expected to be able to draw inferences, to interpret and to evaluate what they read (with a gradually increasing emphasis on interpretation and evaluation). Therefore, the Sixth class specifications were that the test materials should include items assessing the Interpret & Integrate and Examine & Evaluate processes, as well as Retrieve and Infer processes.
The 2009 National Assessments of Mathematics and English Reading
16
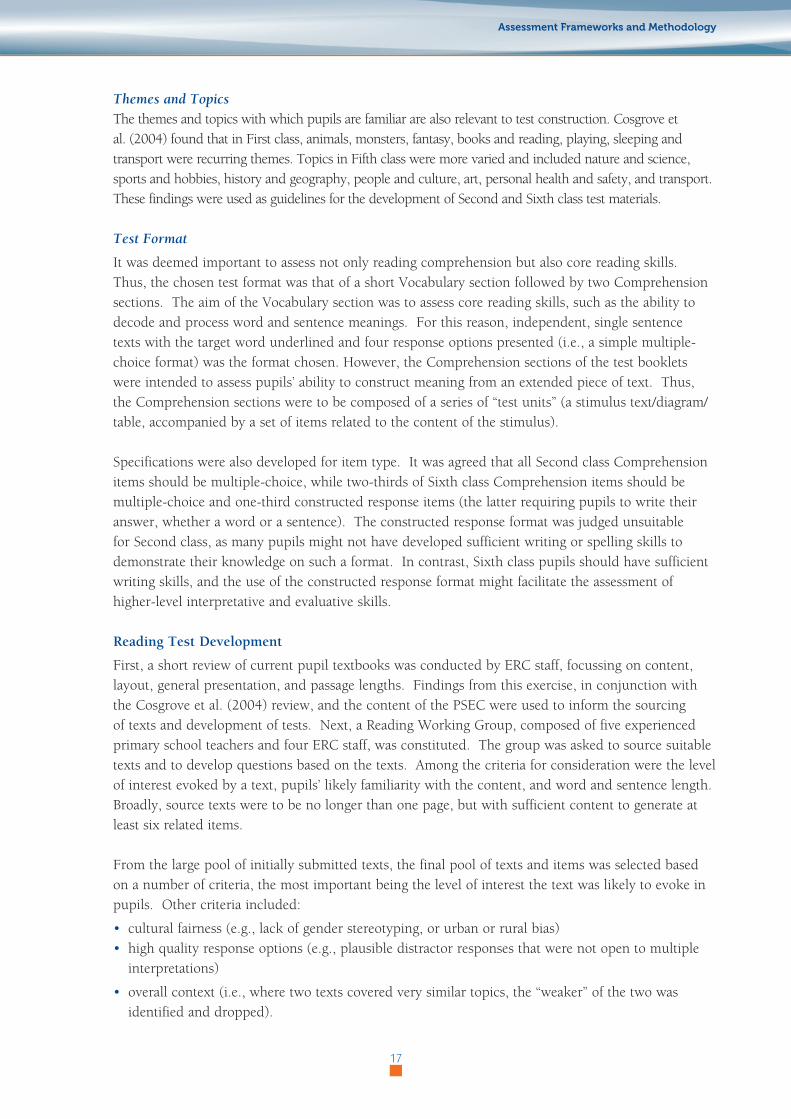
Themes and TopicsThe themes and topics with which pupils are familiar are also relevant to test construction. Cosgrove et al. (2004) found that in First class, animals, monsters, fantasy, books and reading, playing, sleeping and transport were recurring themes. Topics in Fifth class were more varied and included nature and science, sports and hobbies, history and geography, people and culture, art, personal health and safety, and transport. These findings were used as guidelines for the development of Second and Sixth class test materials.
Test Format
It was deemed important to assess not only reading comprehension but also core reading skills. Thus, the chosen test format was that of a short Vocabulary section followed by two Comprehension sections. The aim of the Vocabulary section was to assess core reading skills, such as the ability to decode and process word and sentence meanings. For this reason, independent, single sentence texts with the target word underlined and four response options presented (i.e., a simple multiple-choice format) was the format chosen. However, the Comprehension sections of the test booklets were intended to assess pupils’ ability to construct meaning from an extended piece of text. Thus, the Comprehension sections were to be composed of a series of “test units” (a stimulus text/diagram/table, accompanied by a set of items related to the content of the stimulus).
Specifications were also developed for item type. It was agreed that all Second class Comprehension items should be multiple-choice, while two-thirds of Sixth class Comprehension items should be multiple-choice and one-third constructed response items (the latter requiring pupils to write their answer, whether a word or a sentence). The constructed response format was judged unsuitable for Second class, as many pupils might not have developed sufficient writing or spelling skills to demonstrate their knowledge on such a format. In contrast, Sixth class pupils should have sufficient writing skills, and the use of the constructed response format might facilitate the assessment of higher-level interpretative and evaluative skills.
Reading Test Development
First, a short review of current pupil textbooks was conducted by ERC staff, focussing on content, layout, general presentation, and passage lengths. Findings from this exercise, in conjunction with the Cosgrove et al. (2004) review, and the content of the PSEC were used to inform the sourcing of texts and development of tests. Next, a Reading Working Group, composed of five experienced primary school teachers and four ERC staff, was constituted. The group was asked to source suitable texts and to develop questions based on the texts. Among the criteria for consideration were the level of interest evoked by a text, pupils’ likely familiarity with the content, and word and sentence length. Broadly, source texts were to be no longer than one page, but with sufficient content to generate at least six related items.
From the large pool of initially submitted texts, the final pool of texts and items was selected based on a number of criteria, the most important being the level of interest the text was likely to evoke in pupils. Other criteria included:
• cultural fairness (e.g., lack of gender stereotyping, or urban or rural bias)• high quality response options (e.g., plausible distractor responses that were not open to multiple
interpretations)
• overall context (i.e., where two texts covered very similar topics, the “weaker” of the two was identified and dropped).
Assessment Frameworks and Methodology
17

The resultant set of test units was administered to a small sample of Second and Sixth class pupils, and each unit discussed with the pupils afterwards. Subsequent to this, there was some further revision of items and units.
For Sixth class, the final pool of materials for the field trial consisted of 26 texts, with 209 associated test items. Texts included travel brochures, biographical pieces, dictionary pages, DVD covers, and timetables. The texts were spread over 5 test booklets, so that each pupil would be expected to read 5 or 6 texts, and answer about 40 questions. In addition, 40 multiple-choice Vocabulary items were placed at the start of each test booklet.
For Second class, 22 texts and 151 items (all multiple-choice) were used in the field trial. The texts included narratives, descriptions, instructions, timetables and weather maps. The texts were distributed across 5 booklets. Each pupil was asked to read either 4 or 5 texts and answer about 35 questions. Each booklet contained 20 multiple-choice Vocabulary items, with all pupils asked to attempt the full set.
Characteristics of Final Reading Tests
As described later in this chapter, a field trial was conducted in May 2008, and results were used to inform final item and unit selection. At Second class, average booklet-level difficulty ranged from 59% to 69% correct. Eighteen items were dropped because of problematic difficulty or discrimination. The remaining items did not show any significant differential gender bias. The reduced unit and item pool was re-distributed across four new test booklets. Each booklet contained 20 vocabulary items, as well as 5 texts and 33-35 questions. All questions were multiple-choice.
At Sixth class, average booklet-level difficulty ranged from 62% to 67% correct. Two texts and a total of 37 items were dropped, because they were too easy or too difficult, or because they did not discriminate between high and low achievers. None of the retained items was significantly gender-biased. The reduced unit and item pool was re-distributed across four new test booklets. As well as 5-6 texts and 42-44 items, each booklet contained a common block of 20 vocabulary items selected from the 40 used in the field trial on the basis that they provided a range of difficulties, good discrimination, no gender bias and had an average difficulty level of 65% correct. Of the remaining 172 comprehension items, 60 (34.9%) were constructed response and 112 (65.1%) were multiple-choice – very close to the one-third/two-thirds split proposed in the item specifications. Tables 2.2 and 2.3 show the final item pool for each grade level, classified by reading purpose and process.
Table 2.2: Final numbers of items for reading tests, by purpose and process, Second class
Section ProcessesPurposes
TotalLiterary Informational
Comprehension
Retrieve information 26 45 71Make inferences 25 16 41Interpret & integrate 17 4 21Examine & evaluate — — —
Vocabulary Core reading skills — — 20Test Total 68 65 153
The 2009 National Assessments of Mathematics and English Reading
18
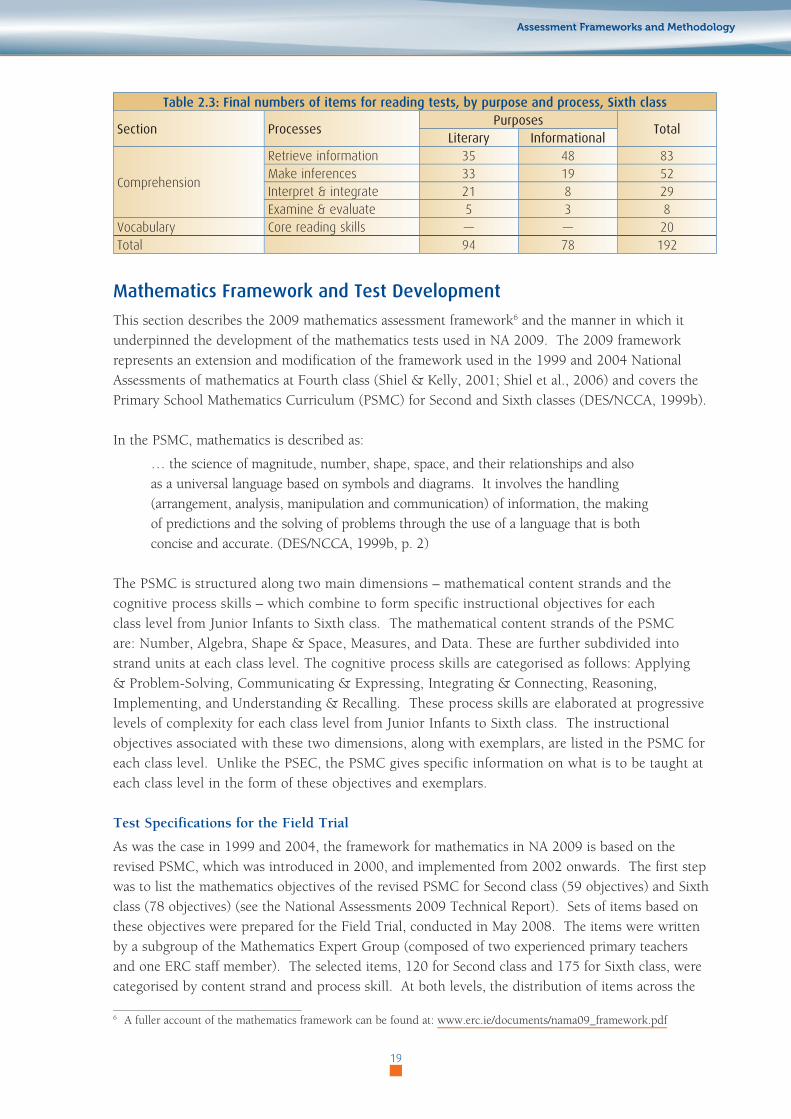
Table 2.3: Final numbers of items for reading tests, by purpose and process, Sixth class
Section ProcessesPurposes
TotalLiterary Informational
Comprehension
Retrieve information 35 48 83Make inferences 33 19 52Interpret & integrate 21 8 29Examine & evaluate 5 3 8
Vocabulary Core reading skills — — 20Total 94 78 192
Mathematics Framework and Test Development
This section describes the 2009 mathematics assessment framework6 and the manner in which it underpinned the development of the mathematics tests used in NA 2009. The 2009 framework represents an extension and modification of the framework used in the 1999 and 2004 National Assessments of mathematics at Fourth class (Shiel & Kelly, 2001; Shiel et al., 2006) and covers the Primary School Mathematics Curriculum (PSMC) for Second and Sixth classes (DES/NCCA, 1999b).
In the PSMC, mathematics is described as:
… the science of magnitude, number, shape, space, and their relationships and also as a universal language based on symbols and diagrams. It involves the handling (arrangement, analysis, manipulation and communication) of information, the making of predictions and the solving of problems through the use of a language that is both concise and accurate. (DES/NCCA, 1999b, p. 2)
The PSMC is structured along two main dimensions – mathematical content strands and the cognitive process skills – which combine to form specific instructional objectives for each class level from Junior Infants to Sixth class. The mathematical content strands of the PSMC are: Number, Algebra, Shape & Space, Measures, and Data. These are further subdivided into strand units at each class level. The cognitive process skills are categorised as follows: Applying & Problem-Solving, Communicating & Expressing, Integrating & Connecting, Reasoning, Implementing, and Understanding & Recalling. These process skills are elaborated at progressive levels of complexity for each class level from Junior Infants to Sixth class. The instructional objectives associated with these two dimensions, along with exemplars, are listed in the PSMC for each class level. Unlike the PSEC, the PSMC gives specific information on what is to be taught at each class level in the form of these objectives and exemplars.
Test Specifications for the Field Trial
As was the case in 1999 and 2004, the framework for mathematics in NA 2009 is based on the revised PSMC, which was introduced in 2000, and implemented from 2002 onwards. The first step was to list the mathematics objectives of the revised PSMC for Second class (59 objectives) and Sixth class (78 objectives) (see the National Assessments 2009 Technical Report). Sets of items based on these objectives were prepared for the Field Trial, conducted in May 2008. The items were written by a subgroup of the Mathematics Expert Group (composed of two experienced primary teachers and one ERC staff member). The selected items, 120 for Second class and 175 for Sixth class, were categorised by content strand and process skill. At both levels, the distribution of items across the
6 A fuller account of the mathematics framework can be found at: www.erc.ie/documents/nama09_framework.pdf
19
Assessment Frameworks and Methodology
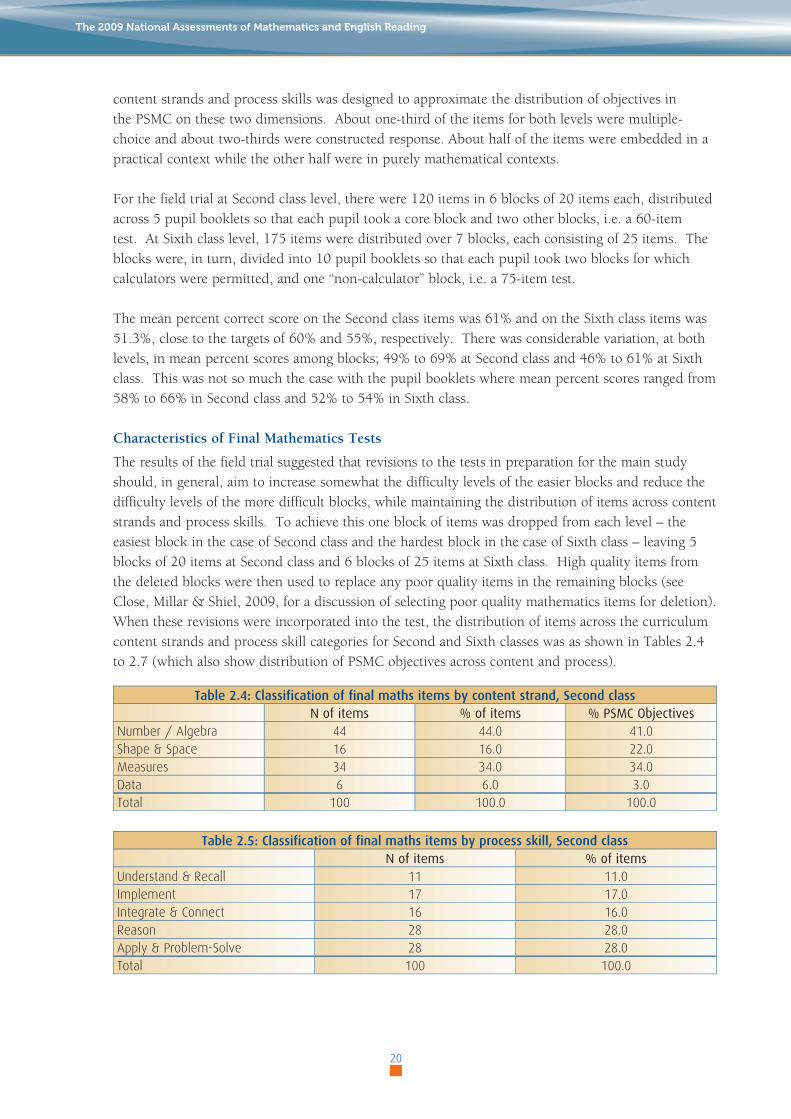
content strands and process skills was designed to approximate the distribution of objectives in the PSMC on these two dimensions. About one-third of the items for both levels were multiple-choice and about two-thirds were constructed response. About half of the items were embedded in a practical context while the other half were in purely mathematical contexts.
For the field trial at Second class level, there were 120 items in 6 blocks of 20 items each, distributed across 5 pupil booklets so that each pupil took a core block and two other blocks, i.e. a 60-item test. At Sixth class level, 175 items were distributed over 7 blocks, each consisting of 25 items. The blocks were, in turn, divided into 10 pupil booklets so that each pupil took two blocks for which calculators were permitted, and one “non-calculator” block, i.e. a 75-item test.
The mean percent correct score on the Second class items was 61% and on the Sixth class items was 51.3%, close to the targets of 60% and 55%, respectively. There was considerable variation, at both levels, in mean percent scores among blocks; 49% to 69% at Second class and 46% to 61% at Sixth class. This was not so much the case with the pupil booklets where mean percent scores ranged from 58% to 66% in Second class and 52% to 54% in Sixth class.
Characteristics of Final Mathematics Tests
The results of the field trial suggested that revisions to the tests in preparation for the main study should, in general, aim to increase somewhat the difficulty levels of the easier blocks and reduce the difficulty levels of the more difficult blocks, while maintaining the distribution of items across content strands and process skills. To achieve this one block of items was dropped from each level – the easiest block in the case of Second class and the hardest block in the case of Sixth class – leaving 5 blocks of 20 items at Second class and 6 blocks of 25 items at Sixth class. High quality items from the deleted blocks were then used to replace any poor quality items in the remaining blocks (see Close, Millar & Shiel, 2009, for a discussion of selecting poor quality mathematics items for deletion). When these revisions were incorporated into the test, the distribution of items across the curriculum content strands and process skill categories for Second and Sixth classes was as shown in Tables 2.4 to 2.7 (which also show distribution of PSMC objectives across content and process).
Table 2.4: Classification of final maths items by content strand, Second classNofitems %ofitems %PSMCObjectives
Number / Algebra 44 44.0 41.0Shape & Space 16 16.0 22.0Measures 34 34.0 34.0Data 6 6.0 3.0Total 100 100.0 100.0
Table 2.5: Classification of final maths items by process skill, Second classNofitems %ofitems
Understand & Recall 11 11.0Implement 17 17.0Integrate & Connect 16 16.0Reason 28 28.0Apply & Problem-Solve 28 28.0Total 100 100.0
The 2009 National Assessments of Mathematics and English Reading
20

Table 2.6: Classification of final maths items by content strand, Sixth classNofitems %ofitems %PSMCObjectives
Number / Algebra 69 46.0 43.0Shape & Space 32 21.3 21.0Measures 31 20.7 24.0Data 18 12.0 12.0Total 150 100.0 100.0
Table 2.7: Classification of final maths items by process skill, Sixth classNofitems %ofitems
Understand & Recall 15 10.0Implement 30 20.0Integrate & Connect 8 5.3Reason 47 31.3Apply & Problem-Solve 50 33.3Total 150 100.0
The revised test maintained a satisfactory distribution of items across the content strands and process skills of the PSMC, with about one-third of the items at each level being multiple-choice (Table 2.8) and about half of the items at each level involving a practical or environmental context.
Table 2.8: Distribution of final maths items by item format, Second and Sixth classes2ndclass 6thclass
Nofitems %ofitems Nofitems %ofitemsMultiple-choice 30 30.0 56 37.3Constructed response 70 70.0 94 62.7Total 100 100.0 150 100.0
For the main study at Second class level, there were 100 items in 5 blocks of 20 items each, distributed across 4 pupil booklets so that each pupil took a core block and two other blocks - 60 items in all. At Sixth class level, 150 items were distributed over 6 blocks, each consisting of 25 items. The blocks were, in turn, distributed across 6 pupil booklets so that each pupil took one of two non-calculator blocks, a common calculator block, and one of the three remaining calculator blocks – 75 items in all.
Development of Questionnaires
Questionnaires were developed for pupils, parents, teachers, and principals, to provide a “context” in which to interpret achievement. All questionnaires administered, and a summary of responses given, can be found at www.erc.ie/NA2009/questionnaires.
School Questionnaire
A School Questionnaire was designed for completion by the principal of each school. It contained questions about school location, intake and enrolment characteristics, school resources (e.g., library books, computers and interactive whiteboards) and staffing, and the provision of additional support within the school. The questionnaire also asked about assessment and planning practices, while the final section asked principals for their personal views on the most serious obstacles to the teaching of English and of mathematics in their school, and invited them to make additional comments if they wished.
Assessment Frameworks and Methodology
21

Teacher Questionnaire
Broadly similar questionnaires (apart from some specific references to the curriculum at each class level) were developed for those teaching participating Second and Sixth classes. Teachers were asked about their qualifications, teaching experience, experience of continuing professional development, and classes taught. They were also asked about the resources and strategies used in the teaching of English reading and of mathematics, as well as the amount of time allocated to teaching English and mathematics, and their confidence in implementing various strategies. The questionnaires also included items on the availability and use of resources such as books, computers and interactive whiteboards for the teaching of mathematics and English, and about the provision of additional support to pupils.
Pupil Rating Form
Each class teacher was given a Pupil Rating Form, on which they were asked to provide contextual information about each pupil who participated in the survey. Areas covered included attendance, receipt of additional support, general academic ability, and class level of English/mathematics materials typically used by a pupil. The Second and Sixth class versions of the Forms sought the same information.
Pupil Questionnaire
The Pupil Questionnaires asked about language spoken in the home, homework practices, attitudes to, and engagement in, reading and mathematics, and other activities outside of school. The Second class questionnaire was a shorter, more simplified version of the Sixth class questionnaire.
Parent Questionnaire
The Parent Questionnaire was almost identical for both grade levels. It included questions relating to family size, composition and parental occupation, and to home educational processes and resources, parental reading habits, and to providing help with homework to pupils. Occupations were subsequently placed on a scale of socioeconomic status (higher scores indicative of higher SES occupations, such as judge or doctor). Maternal and paternal scores were compared and the highest value was assigned as the “family” SES score.
Field Trial
As noted earlier, a field trial was carried out prior to the main study (full details are provided in the Technical Report). The aims of the field trial were to:
• gauge the appropriateness (difficulty and length) of the tests • eliminate problematic items (e.g., gender biased, too easy/difficult) • gauge the appropriateness of the questionnaire measures• evaluate and refine administrative procedures.
All National Assessments tests, questionnaires and administrative procedures were field trialled in May 2008. At both Second and Sixth class, five booklets were trialled. In order to generate reliable test item statistics, a minimum of 200 responses per item is required. Thus, there was a requirement for 1000 pupils per grade level (5 booklets X 200 pupils) as a minimum sample size. Incorporating the likelihood of non-response meant that the initial sample required close to 1200 pupils selected for participation at each grade level. A sample of 32 schools was randomly selected from a “convenience”
The 2009 National Assessments of Mathematics and English Reading
22
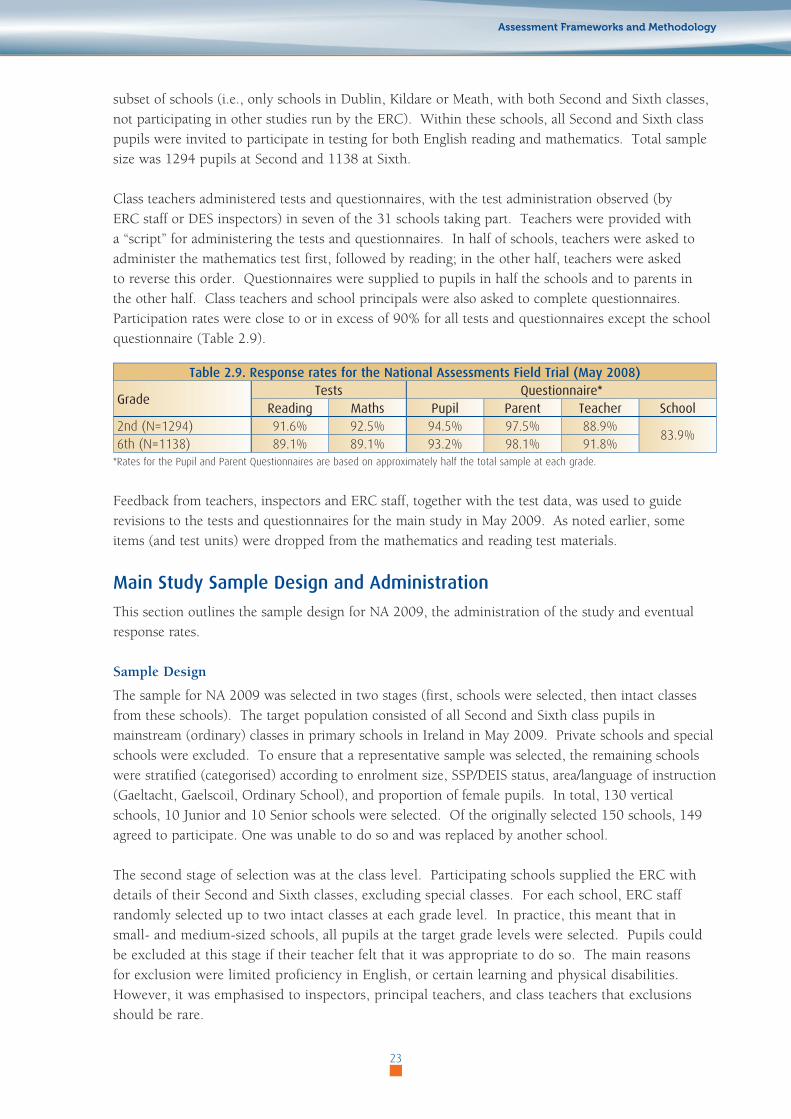
subset of schools (i.e., only schools in Dublin, Kildare or Meath, with both Second and Sixth classes, not participating in other studies run by the ERC). Within these schools, all Second and Sixth class pupils were invited to participate in testing for both English reading and mathematics. Total sample size was 1294 pupils at Second and 1138 at Sixth.
Class teachers administered tests and questionnaires, with the test administration observed (by ERC staff or DES inspectors) in seven of the 31 schools taking part. Teachers were provided with a “script” for administering the tests and questionnaires. In half of schools, teachers were asked to administer the mathematics test first, followed by reading; in the other half, teachers were asked to reverse this order. Questionnaires were supplied to pupils in half the schools and to parents in the other half. Class teachers and school principals were also asked to complete questionnaires. Participation rates were close to or in excess of 90% for all tests and questionnaires except the school questionnaire (Table 2.9).
Table 2.9. Response rates for the National Assessments Field Trial (May 2008)
GradeTests Questionnaire*
Reading Maths Pupil Parent Teacher School2nd (N=1294) 91.6% 92.5% 94.5% 97.5% 88.9%
83.9%6th (N=1138) 89.1% 89.1% 93.2% 98.1% 91.8%
*Rates for the Pupil and Parent Questionnaires are based on approximately half the total sample at each grade.
Feedback from teachers, inspectors and ERC staff, together with the test data, was used to guide revisions to the tests and questionnaires for the main study in May 2009. As noted earlier, some items (and test units) were dropped from the mathematics and reading test materials.
Main Study Sample Design and Administration
This section outlines the sample design for NA 2009, the administration of the study and eventual response rates.
Sample Design
The sample for NA 2009 was selected in two stages (first, schools were selected, then intact classes from these schools). The target population consisted of all Second and Sixth class pupils in mainstream (ordinary) classes in primary schools in Ireland in May 2009. Private schools and special schools were excluded. To ensure that a representative sample was selected, the remaining schools were stratified (categorised) according to enrolment size, SSP/DEIS status, area/language of instruction (Gaeltacht, Gaelscoil, Ordinary School), and proportion of female pupils. In total, 130 vertical schools, 10 Junior and 10 Senior schools were selected. Of the originally selected 150 schools, 149 agreed to participate. One was unable to do so and was replaced by another school.
The second stage of selection was at the class level. Participating schools supplied the ERC with details of their Second and Sixth classes, excluding special classes. For each school, ERC staff randomly selected up to two intact classes at each grade level. In practice, this meant that in small- and medium-sized schools, all pupils at the target grade levels were selected. Pupils could be excluded at this stage if their teacher felt that it was appropriate to do so. The main reasons for exclusion were limited proficiency in English, or certain learning and physical disabilities. However, it was emphasised to inspectors, principal teachers, and class teachers that exclusions should be rare.
Assessment Frameworks and Methodology
23

Administration
Thirty-seven DES inspectors were assigned to the participating schools, to assist with the assessment and to act as quality monitors. All were briefed on the aims and procedures of the assessment, after which they contacted their assigned schools to confirm test dates and other arrangements. To ensure test security, test materials were not sent directly to schools, but delivered to inspectors shortly before the start of the overall testing window (May 11th to 29th, 2009).
ERC staff liaised with a designated co-ordinator in each school. In mid-April each co-ordinator received all ancillary materials. These included an information booklet for the co-ordinator, a School Questionnaire, and a class pack for each participating class. The class pack contained a Teacher Questionnaire, sets of Pupil and Parent Questionnaires, and an Administration Manual (containing information on aspects of the survey aims, design and administration, including a “script” for administering the tests and questionnaires). Teachers were asked to have all ancillary materials ready for collection by the inspector.
In each school, testing was conducted over two mornings. Half of participating schools completed the mathematics test first, while the other half completed English reading first. At Second class, the mathematics test was read aloud by the class teacher, to minimise the effects of pupil reading skills on mathematics performance. Thus, all pupils in a given Second class completed the same mathematics test booklet. In all other cases, pupils were randomly assigned different test booklets, with teachers and inspectors ensuring that the pupil completing a booklet was the pupil whose name was on the booklet label. Schools teaching through the medium of Irish were offered a choice of English or Irish language versions of the mathematics tests and questionnaires.
Each inspector made two visits per assigned school, during which they distributed the appropriate tests, oversaw the administration, assisted where appropriate, and collected all assessment and ancillary materials for return to the ERC. For each school, inspectors also conducted a short, informal review with the school co-ordinator, and completed their own review form. With the exception of the amount of work required by teachers (with which 12% of co-ordinators expressed some dissatisfaction), co-ordinators were very satisfied with the administration of the assessment. For example, only one person expressed dissatisfaction with the quality of the test materials, although almost 6% were dissatisfied with the suitability of the test materials for pupils in their school. Similarly, inspectors were universally positive in their reviews of teacher adherence to testing procedures and administration guidelines, while teacher preparedness for the administration (primarily, reading the manual) was rated as good in most or all cases in 96% of schools. Full details of the views of school co-ordinators and inspectors are available in the Technical Report.
Response Rates
Generally, response rates for the assessment and ancillary materials were very high. Table 2.10 shows the response rates for the main instruments used in the assessment. The response rates for the School and Teacher Questionnaires reached almost 100%, while approximately 95% of selected pupils at each grade completed a Pupil Questionnaire. At 92%, response rates for Parent Questionnaires were slightly lower (but still very high), while response rates for all test materials exceeded 90%. Response rates for the Pupil Rating Forms were also very high (99%), although many were only partially completed.
The 2009 National Assessments of Mathematics and English Reading
24

Table 2.10: Response rates for the National Assessments Main Study
Instrument2ndclass(N=4199) 6thclass(N=4189)N % N %
Maths Test Booklet* 3905 93 3832 91Reading Test Booklet* 3839 91 3803 91Pupil Questionnaire 3992 95 3979 95Parent Questionnaire 3843 92 3847 92
No .ofclasses=202 No .ofclasses=193Pupil Rating Form 200 99 191 99Teacher Questionnaire 202 100 192 99
No .ofschools=150School Questionnaire N=149 % = 99
* Data for tests refer to fully completed tests. Pupils who completed parts of the test booklets are not included.
Weighting, Scoring and Scaling of Data
This section provides an overview of the purpose of, and processes involved in, weighting and scaling the test data. Readers interested in further details about the theory and methodologies underpinning the information presented here are referred to the Technical Report (see www.erc.ie/NA2009).
Sampling Weights
Sampling weights were calculated prior to the analysis of the test data. Weights are necessary since schools (and therefore pupils) were sampled disproportionately with regard to their overall presence in the population. The weighting process also applies a correction to account for non-response (e.g., a pupil being absent on the day of testing). Weighting of data ensures that the contributions of certain groups of pupils (e.g. pupils attending large schools, or pupils who were present on the day of testing) are not over- or under-represented in the data and therefore do not bias findings. Sampling weights feed into the scaling of test data and the analysis and reporting of data from the survey questionnaires.
Scaling of Test Data
The data were scored and scaled using the Item Response Theory (IRT) framework. IRT provides more adaptable and effective methods of test development, analysis, and scaling than those derived from classical test theory. It provides a difficulty estimate for each of the test items and an ability estimate for each of the pupils. Most importantly, the item difficulty and pupil ability estimates are on the same scale, and these estimates are not dependent on the ability levels of different samples (having adjusted for any differences in the sample means and standard deviations). Because IRT treats items, or blocks of items, as interchangeable, new items, or blocks of items, can be added gradually over the years. Thus, tests can keep apace with curricular and societal changes.
A feature of the test design was that pupils only saw a subset of the test items. The advantage of this approach is that a wider range of items can be used, thus improving the curriculum coverage and content validity, without overburdening pupils with very long tests. Comparability of results from pupils taking different test booklets was ensured firstly by the random assignment of booklets. Random assignment means that there should be no systematic differences between the ability levels of pupils taking any particular booklet. Secondly, all pupils within a grade level and domain were presented with a common set of items. In the case of reading, these were 20 vocabulary items presented at the beginning of the test. For mathematics there were 20 common items in Second class and 25 at Sixth class, appearing as the second of three blocks.
Assessment Frameworks and Methodology
25

Percent correct scores and IRT scale scores were calculated for both domains at both class levels. As well as an overall test score, scores were created for the reading purposes and processes, and mathematics content strands and process skills outlined above. In line with the practice of previous national assessments, the IRT scale scores for each overall test and individual subscale were scaled to have a mean of 250 and a standard deviation of 50. The overall test scores are approximately normally distributed. Thus, 68% of pupils obtained test scores that fell between 200 and 300 (250 50).
The 2009 study was the first in which the present National Assessment tests were administered. As baseline data, the 2009 results are the benchmark against which performance of pupils will be compared in future cycles.
The 2009 National Assessments of Mathematics and English Reading
26
3
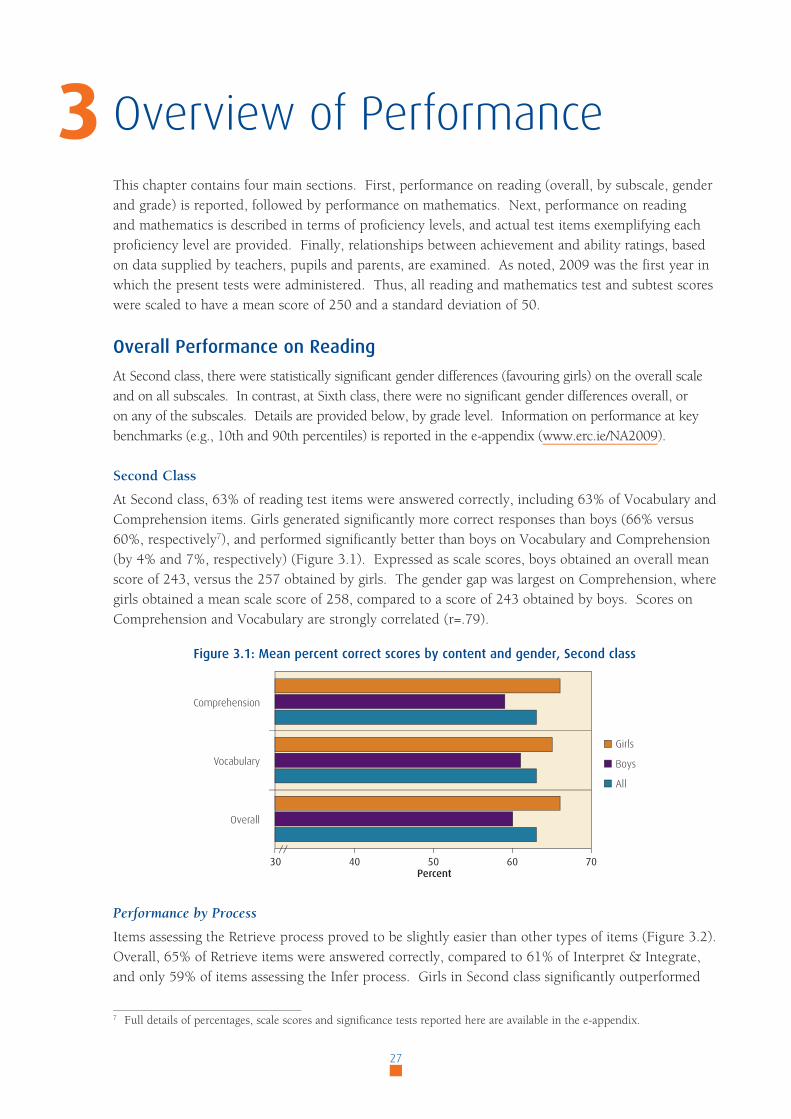
Overview of PerformanceThis chapter contains four main sections. First, performance on reading (overall, by subscale, gender and grade) is reported, followed by performance on mathematics. Next, performance on reading and mathematics is described in terms of proficiency levels, and actual test items exemplifying each proficiency level are provided. Finally, relationships between achievement and ability ratings, based on data supplied by teachers, pupils and parents, are examined. As noted, 2009 was the first year in which the present tests were administered. Thus, all reading and mathematics test and subtest scores were scaled to have a mean score of 250 and a standard deviation of 50.
Overall Performance on Reading
At Second class, there were statistically significant gender differences (favouring girls) on the overall scale and on all subscales. In contrast, at Sixth class, there were no significant gender differences overall, or on any of the subscales. Details are provided below, by grade level. Information on performance at key benchmarks (e.g., 10th and 90th percentiles) is reported in the e-appendix (www.erc.ie/NA2009).
Second Class
At Second class, 63% of reading test items were answered correctly, including 63% of Vocabulary and Comprehension items. Girls generated significantly more correct responses than boys (66% versus 60%, respectively7), and performed significantly better than boys on Vocabulary and Comprehension (by 4% and 7%, respectively) (Figure 3.1). Expressed as scale scores, boys obtained an overall mean score of 243, versus the 257 obtained by girls. The gender gap was largest on Comprehension, where girls obtained a mean scale score of 258, compared to a score of 243 obtained by boys. Scores on Comprehension and Vocabulary are strongly correlated (r=.79).
Figure 3.1: Mean percent correct scores by content and gender, Second class
30 40 50 60 70
Comprehension
Vocabulary
Overall
Percent
Girls
Boys
All
Performance by Process
Items assessing the Retrieve process proved to be slightly easier than other types of items (Figure 3.2). Overall, 65% of Retrieve items were answered correctly, compared to 61% of Interpret & Integrate, and only 59% of items assessing the Infer process. Girls in Second class significantly outperformed
7 Full details of percentages, scale scores and significance tests reported here are available in the e-appendix.
27
3
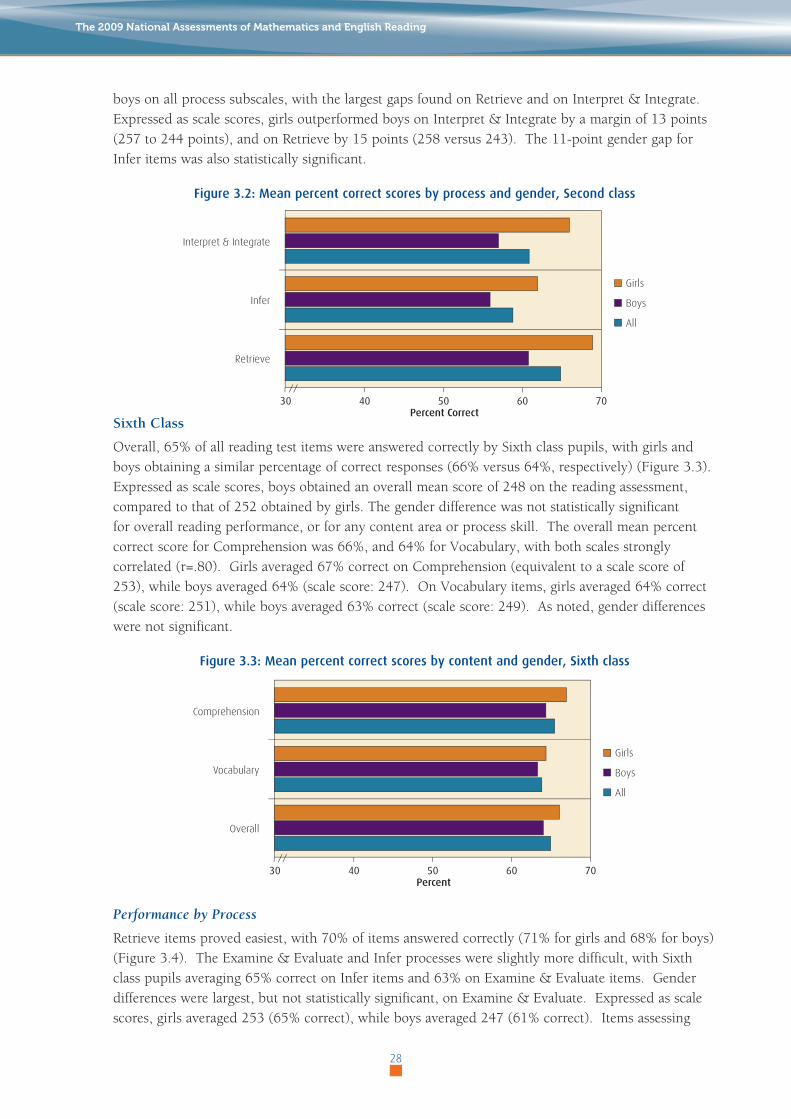
boys on all process subscales, with the largest gaps found on Retrieve and on Interpret & Integrate. Expressed as scale scores, girls outperformed boys on Interpret & Integrate by a margin of 13 points (257 to 244 points), and on Retrieve by 15 points (258 versus 243). The 11-point gender gap for Infer items was also statistically significant.
Figure 3.2: Mean percent correct scores by process and gender, Second class
30 40 50 60 70
Interpret & Integrate
Infer
Retrieve
Percent Correct
Girls
Boys
All
Sixth Class
Overall, 65% of all reading test items were answered correctly by Sixth class pupils, with girls and boys obtaining a similar percentage of correct responses (66% versus 64%, respectively) (Figure 3.3). Expressed as scale scores, boys obtained an overall mean score of 248 on the reading assessment, compared to that of 252 obtained by girls. The gender difference was not statistically significant for overall reading performance, or for any content area or process skill. The overall mean percent correct score for Comprehension was 66%, and 64% for Vocabulary, with both scales strongly correlated (r=.80). Girls averaged 67% correct on Comprehension (equivalent to a scale score of 253), while boys averaged 64% (scale score: 247). On Vocabulary items, girls averaged 64% correct (scale score: 251), while boys averaged 63% correct (scale score: 249). As noted, gender differences were not significant.
Figure 3.3: Mean percent correct scores by content and gender, Sixth class
30 40 50 60 70
Comprehension
Vocabulary
Overall
Percent
Girls
Boys
All
Performance by Process
Retrieve items proved easiest, with 70% of items answered correctly (71% for girls and 68% for boys) (Figure 3.4). The Examine & Evaluate and Infer processes were slightly more difficult, with Sixth class pupils averaging 65% correct on Infer items and 63% on Examine & Evaluate items. Gender differences were largest, but not statistically significant, on Examine & Evaluate. Expressed as scale scores, girls averaged 253 (65% correct), while boys averaged 247 (61% correct). Items assessing
The 2009 National Assessments of Mathematics and English Reading
28
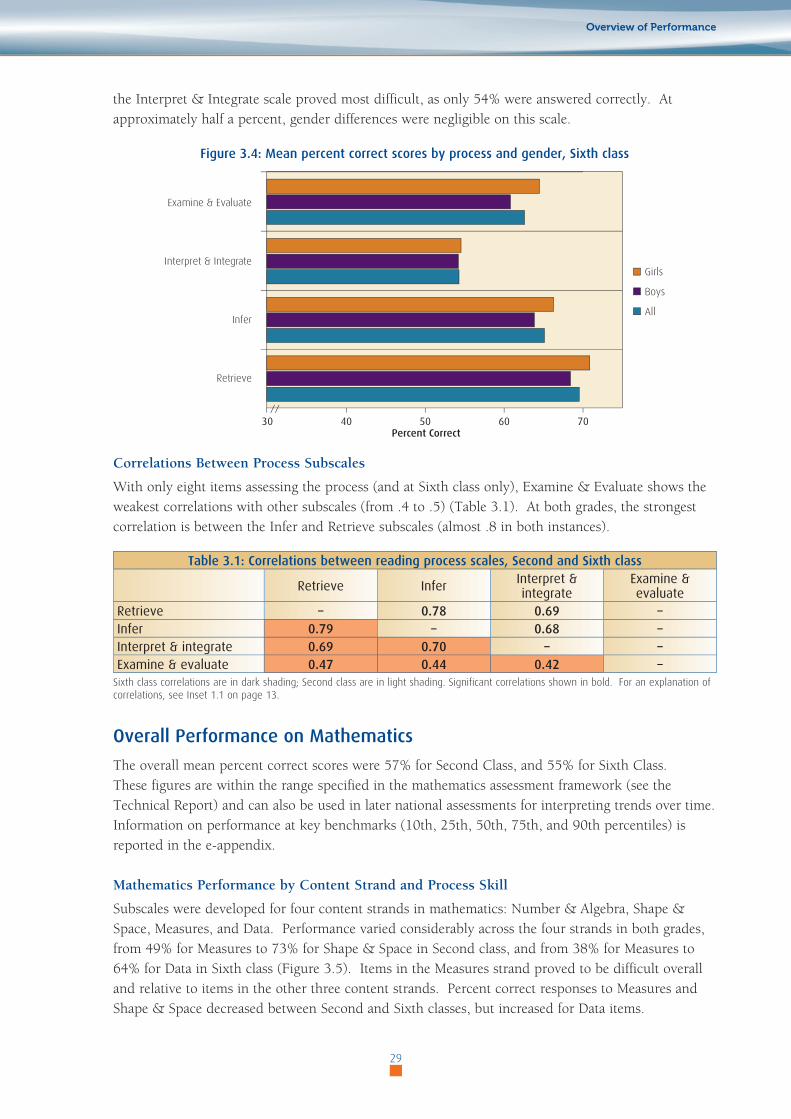
the Interpret & Integrate scale proved most difficult, as only 54% were answered correctly. At approximately half a percent, gender differences were negligible on this scale.
Figure 3.4: Mean percent correct scores by process and gender, Sixth class
30 40 50 60 70
Examine & Evaluate
Interpret & Integrate
Infer
Retrieve
Percent Correct
Girls
Boys
All
Correlations Between Process Subscales
With only eight items assessing the process (and at Sixth class only), Examine & Evaluate shows the weakest correlations with other subscales (from .4 to .5) (Table 3.1). At both grades, the strongest correlation is between the Infer and Retrieve subscales (almost .8 in both instances).
Table 3.1: Correlations between reading process scales, Second and Sixth class
Retrieve Infer Interpret&integrate
Examine&evaluate
Retrieve – 0.78 0.69 –Infer 0.79 – 0.68 –Interpret&integrate 0.69 0.70 – –Examine&evaluate 0.47 0.44 0.42 –
Sixth class correlations are in dark shading; Second class are in light shading. Significant correlations shown in bold. For an explanation of correlations, see Inset 1.1 on page 13.
Overall Performance on Mathematics
The overall mean percent correct scores were 57% for Second Class, and 55% for Sixth Class. These figures are within the range specified in the mathematics assessment framework (see the Technical Report) and can also be used in later national assessments for interpreting trends over time. Information on performance at key benchmarks (10th, 25th, 50th, 75th, and 90th percentiles) is reported in the e-appendix.
Mathematics Performance by Content Strand and Process Skill
Subscales were developed for four content strands in mathematics: Number & Algebra, Shape & Space, Measures, and Data. Performance varied considerably across the four strands in both grades, from 49% for Measures to 73% for Shape & Space in Second class, and from 38% for Measures to 64% for Data in Sixth class (Figure 3.5). Items in the Measures strand proved to be difficult overall and relative to items in the other three content strands. Percent correct responses to Measures and Shape & Space decreased between Second and Sixth classes, but increased for Data items.
Overview of Performance
29
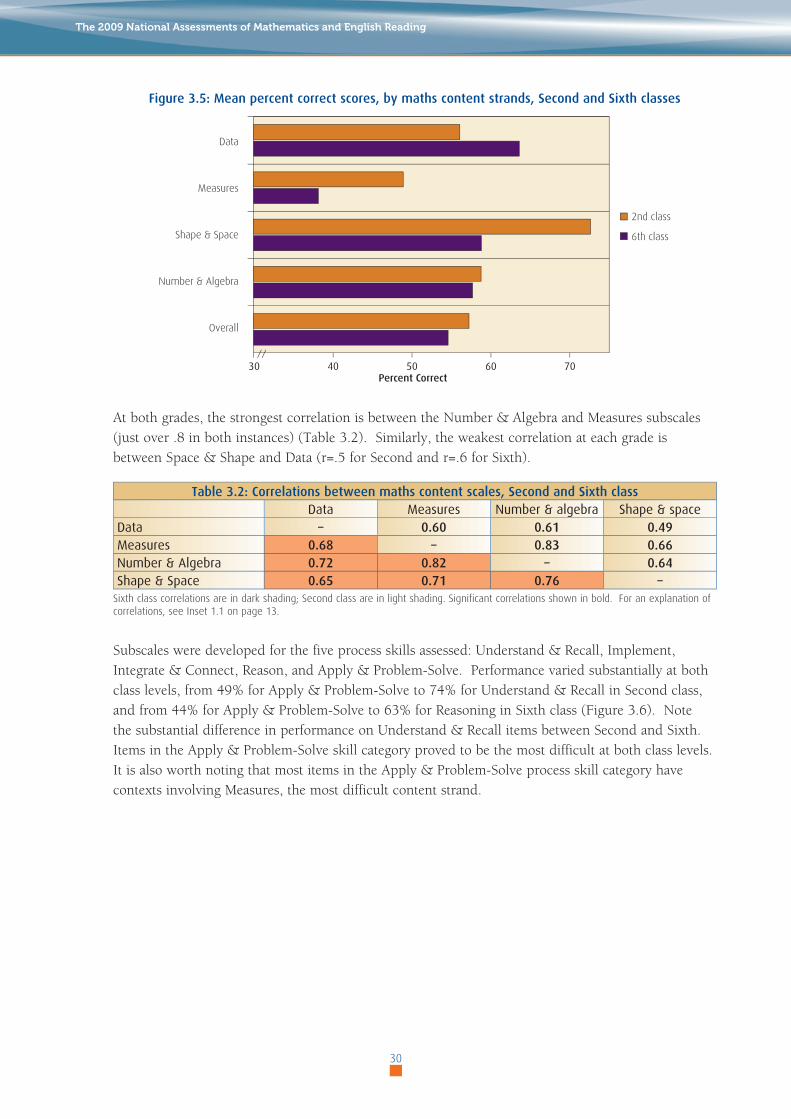
Figure 3.5: Mean percent correct scores, by maths content strands, Second and Sixth classes
30 40 50 60 70
Data
Measures
Shape & Space
Number & Algebra
Overall
Percent Correct
2nd class
6th class
At both grades, the strongest correlation is between the Number & Algebra and Measures subscales (just over .8 in both instances) (Table 3.2). Similarly, the weakest correlation at each grade is between Space & Shape and Data (r=.5 for Second and r=.6 for Sixth).
Table 3.2: Correlations between maths content scales, Second and Sixth classData Measures Number&algebra Shape&space
Data – 0.60 0.61 0.49Measures 0.68 – 0.83 0.66Number&Algebra 0.72 0.82 – 0.64Shape&Space 0.65 0.71 0.76 –
Sixth class correlations are in dark shading; Second class are in light shading. Significant correlations shown in bold. For an explanation of correlations, see Inset 1.1 on page 13.
Subscales were developed for the five process skills assessed: Understand & Recall, Implement, Integrate & Connect, Reason, and Apply & Problem-Solve. Performance varied substantially at both class levels, from 49% for Apply & Problem-Solve to 74% for Understand & Recall in Second class, and from 44% for Apply & Problem-Solve to 63% for Reasoning in Sixth class (Figure 3.6). Note the substantial difference in performance on Understand & Recall items between Second and Sixth. Items in the Apply & Problem-Solve skill category proved to be the most difficult at both class levels. It is also worth noting that most items in the Apply & Problem-Solve process skill category have contexts involving Measures, the most difficult content strand.
The 2009 National Assessments of Mathematics and English Reading
30
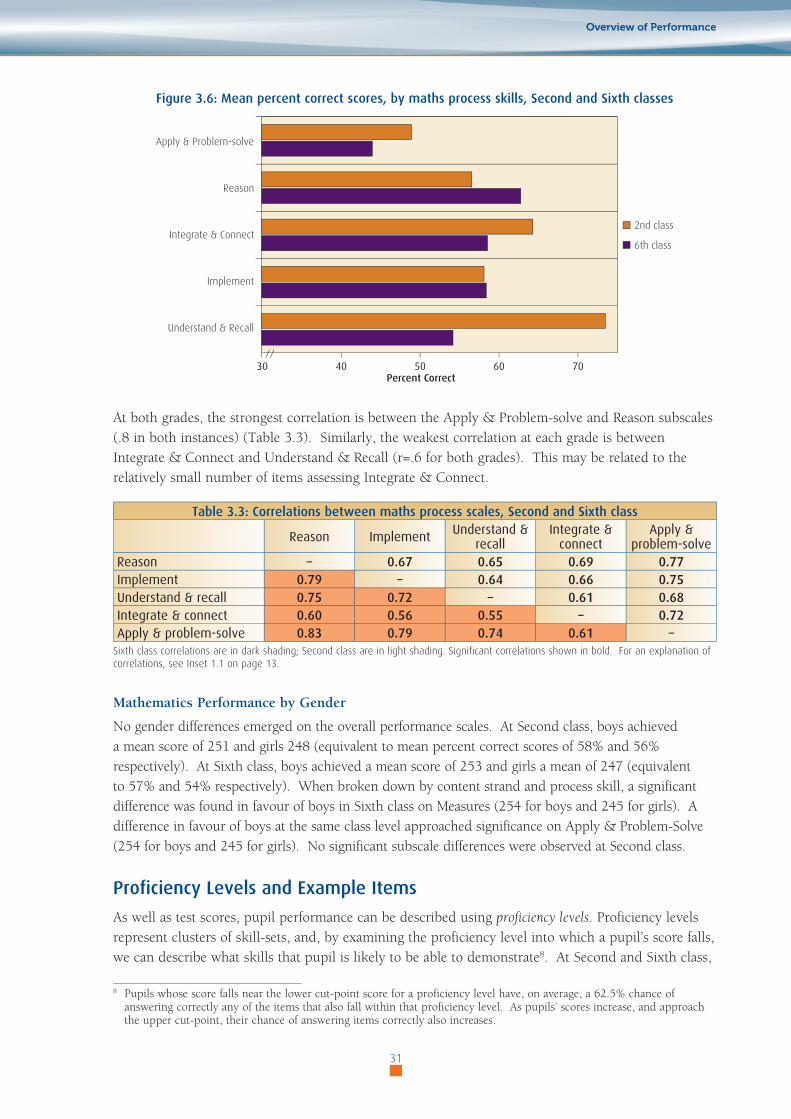
Figure 3.6: Mean percent correct scores, by maths process skills, Second and Sixth classes
30 40 50 60 70
Apply & Problem-solve
Reason
Integrate & Connect
Implement
Understand & Recall
Percent Correct
2nd class
6th class
At both grades, the strongest correlation is between the Apply & Problem-solve and Reason subscales (.8 in both instances) (Table 3.3). Similarly, the weakest correlation at each grade is between Integrate & Connect and Understand & Recall (r=.6 for both grades). This may be related to the relatively small number of items assessing Integrate & Connect.
Table 3.3: Correlations between maths process scales, Second and Sixth class
Reason Implement Understand&recall
Integrate&connect
Apply&problem-solve
Reason – 0.67 0.65 0.69 0.77Implement 0.79 – 0.64 0.66 0.75Understand&recall 0.75 0.72 – 0.61 0.68Integrate&connect 0.60 0.56 0.55 – 0.72Apply&problem-solve 0.83 0.79 0.74 0.61 –
Sixth class correlations are in dark shading; Second class are in light shading. Significant correlations shown in bold. For an explanation of correlations, see Inset 1.1 on page 13.
Mathematics Performance by Gender
No gender differences emerged on the overall performance scales. At Second class, boys achieved a mean score of 251 and girls 248 (equivalent to mean percent correct scores of 58% and 56% respectively). At Sixth class, boys achieved a mean score of 253 and girls a mean of 247 (equivalent to 57% and 54% respectively). When broken down by content strand and process skill, a significant difference was found in favour of boys in Sixth class on Measures (254 for boys and 245 for girls). A difference in favour of boys at the same class level approached significance on Apply & Problem-Solve (254 for boys and 245 for girls). No significant subscale differences were observed at Second class.
Proficiency Levels and Example Items
As well as test scores, pupil performance can be described using proficiency levels. Proficiency levels represent clusters of skill-sets, and, by examining the proficiency level into which a pupil’s score falls, we can describe what skills that pupil is likely to be able to demonstrate8. At Second and Sixth class,
8 Pupils whose score falls near the lower cut-point score for a proficiency level have, on average, a 62.5% chance of answering correctly any of the items that also fall within that proficiency level. As pupils’ scores increase, and approach the upper cut-point, their chance of answering items correctly also increases.
Overview of Performance
31

there are four proficiency levels for reading and mathematics, with Level 1 representing the most basic skills and Level 4 the most complex skills. The description of skills at each proficiency level is based on the notion of mastery, meaning that pupils are consistently able to demonstrate the skills at their proficiency level and the Levels below, but are not consistently able to demonstrate the skills exemplifying the Levels above them. Thus, for example, while a pupil at Level 2 might occasionally demonstrate a Level 3 skill, they are unlikely to be able to do so consistently. In the 2009 National Assessments, 10% of pupils did not reach proficiency level 1, meaning that they did not demonstrate the most basic skills on the domain being assessed. The remainder of this section provides examples of reading and mathematics items used as part of the main study in 2009, relates them to proficiency levels for each domain, and describes the skills that pupils at each Level can demonstrate.
Reading Proficiency Levels and Example Items
Tables 3.4 and 3.5 describe reading proficiency levels for Second and Sixth classes, respectively. Each table is preceded by an example of a test unit administered as part of the reading test in May 2009. As explained in Chapter 2, reading test units consist of a stimulus text (the piece of text about which the questions are asked), followed by a series of questions. The units selected for inclusion in this report demonstrate a diversity of stimulus texts and item difficulties. The Second class text is a non-continuous informational piece, while the Sixth class text is a continuous, literary piece (both types are used in both test levels). Both units also contain test items that exemplify the types of questions that can be answered by pupils at each of the four proficiency levels. Units have been re-formatted for this report. The versions used in the test booklets were more visually appealing to children.
Second Class
Figures 3.7 and 3.8 show an example of a Second class stimulus text and associated questions. For each item, the percent of pupils who answered the item correctly in NA 2009 is also shown, as is the type of processing required (e.g. Retrieve information) in order to answer the question. The Figures are followed by Table 3.4, which describes the type of skills that Second class pupils at each proficiency level are able to demonstrate. Overall, 10% of pupils fail to reach proficiency level 1 (test scores below 187), meaning that they are not consistently able to demonstrate the types of reading skills assessed by the simplest of items on the Second class assessment. Their reading skills are very low, and might be more appropriately assessed by a diagnostic test. Thirteen percent of boys, but only 7% of girls fall into the “Below Level 1” category.
Figure 3.7: Example of a stimulus text from the TV Timetable test unit, Second class reading testTVTIMETABLESaturday20thJanuary
08.00 Arthur Animated series following the adventures of a young aardvark and his friends.
08.30 CaptainPlanetandthePlaneteers
Animated series about a superhero out to save the environment with the help of the five planeteers.
09.00 TheCobblestones Prehistoric cartoon fun with Terry Dactyl and Stacy Saurus.
09.15 YuckYuck! Cartoon action with crime-fighting duo Ben and Belinda O’Brien, who take on the cases that become too yucky for adults to handle.
09.30 LucyMcGurken Cartoon about a junior inventor who has all sorts of adventures with her best friend and sidekick Jamesie Woo.
10.00 Cook4YouCookery series with cooks Dara and Alice. Together they run a special cafe where every day a different surprise guest calls in for a tasty treat.
11.00 FreakyFriday An exciting movie where a mother and daughter wake up in each other’s bodies after eating magical biscuits.
The 2009 National Assessments of Mathematics and English Reading
32

Figure 3.8: Sample questions from the TV Timetable test unit, the process assessed and percentage of pupils answering correctly in the NA 2009 main study, Second class reading test
%3 Process Itemnumber&content
87% Retrieve
Q1. At what time does ‘The Cobblestones’ begin?a) 08.30b) 09.00*c) 08.00d) 09.30
81% Retrieve
Q2. In which TV show would you find Jamesie Woo?a) Arthur.b) Yuck Yuck!c) Lucy McGurken*d) The Cobblestones
71% Infer
Q3. Which of these is a film?a) Yuck Yuck!b) Freaky Friday*c) Cook 4 Youd) Lucy McGurken
61% Retrieve
Q4. ‘Cook 4 You’ is abouta) cooking magical biscuitsb) cooking for a special guest*c) a special guest cooking a meal d) a cookery class for children
50% Infer
Q5. Which show would you watch if you enjoy watching crimes being solved?a) The Cobblestones.b) Cook 4 You.c) Freaky Friday. d) Yuck Yuck!*
37% Retrieve
Q6. Which of these programmes is the shortest?a) Cook 4 Youb) Yuck Yuck!*c) Arthurd) Lucy McGurken
Pupils whose scores fall between 187 and 224 are categorised as being at proficiency level 1 (the lowest Level). These 25% of pupils can only demonstrate the most basic reading skills, such as retrieving simple pieces of information that are explicitly stated in the text, when there is a direct match between the wording of the question and the information in the text (e.g., Question 1 from TV
Timetable, shown in Figure 3.8). Items exemplifying Level 1 are very easy items, answered correctly by most pupils (e.g., 87% correct, in the case of Question 1). For Second class reading, 28% of boys and 22% of girls are categorised as at Level 1.
The 30% of pupils who are at Level 2 (scores between 225 and 268) can retrieve information where the wording of the question and the text differ, provided that the information sought is in a small section of text. Questions 2, 3 and 4 from TV Timetable are examples of items that such pupils are likely to answer correctly.
33
Overview of Performance

319
268
224
<187
269
225
187
320+
Table 3.4: Proficiency levels on the reading scale and percentages of pupils (overall and by gender) achieving each level, Second class
Level&scorerange
Sampleitems(see
Fig .3 .8)Whatpupilscantypicallydo Total Boys Girls
4 Q6
As well as lower proficiency level skills, pupils at level 4 can retrieve complex information (e.g., the information needed is located in multiple parts of the text). They can link multiple pieces of information to draw inferences.They can integrate text-wide information in order to identify the main themes in a text. As well as using discrete or explicit information, they can use the text as a whole to interpret character behaviour.
10 8 12
3 Q5
As well as Level 1 and 2 skills, pupils can process texts at a whole-text level, in order to retrieve information. They can make basic-level inferences, sometimes linking one or two discrete pieces of information. They can infer word meanings if the context provides clear clues.
25 22 28
2Q4
Q3
Q2
As well as Level 1 skills, pupils can retrieve explicitly stated information where the wording of the question and the text differ. However, the information sought must be specific to a small section of text. They can make low-level inferences, including character motives, if the required information is explicitly stated in a specific section of the text.
30 29 31
1 Q1
Level 1 pupils show basic reading skills. They can retrieve simple, explicitly stated, pieces of information, when there is a direct match between the wording of the question and the text. They are most successful on tasks that require comprehension of smaller units of text, such as sentences.They can perform some very basic interpretation and integration of text (e.g., identifying the theme of a text, where the theme is explicitly stated in the text).
25 28 22
Pupils below proficiency level 1 have a less than 62.5% chance of correctly answering a Level 1 question. Their reading skills are very low, relative to other 2nd class pupils and are not properly assessed by the National Assessment.
10 13 7
In addition to skills demonstrated by pupils at Levels 1 and 2, Second class pupils at proficiency level 3 are able to use one or two discrete pieces of information from the text to make basic-level inferences. For example, they can answer questions such as Question 5, which requires them to infer the most suitable programme for those interested in watching crimes being solved. While only 50% of pupils, overall, were able to answer this question, 74% of Level 3 pupils were able to do so. Nationally, one-quarter of pupils are at Level 3, and a slightly higher percentage of girls than boys attain this Level (28% versus 22%, respectively).
Pupils at Level 4 show all the skills shown by pupils at lower proficiency levels. However, they are also able to retrieve complex information, identify main themes and use information in the text as a whole to interpret character behaviour. They can answer difficult items like Question 6, where they must retrieve information from multiple sections of the text in order to identify the correct response. Question 6 was one of the more difficult items in the Second class reading test. Eighty percent of pupils at Level 4 answered correctly, compared to 37% overall, and only 19% of pupils at Level 1. Ten percent of pupils are categorised as at Level 4 (12% of girls and 8% of boys).
The 2009 National Assessments of Mathematics and English Reading
34
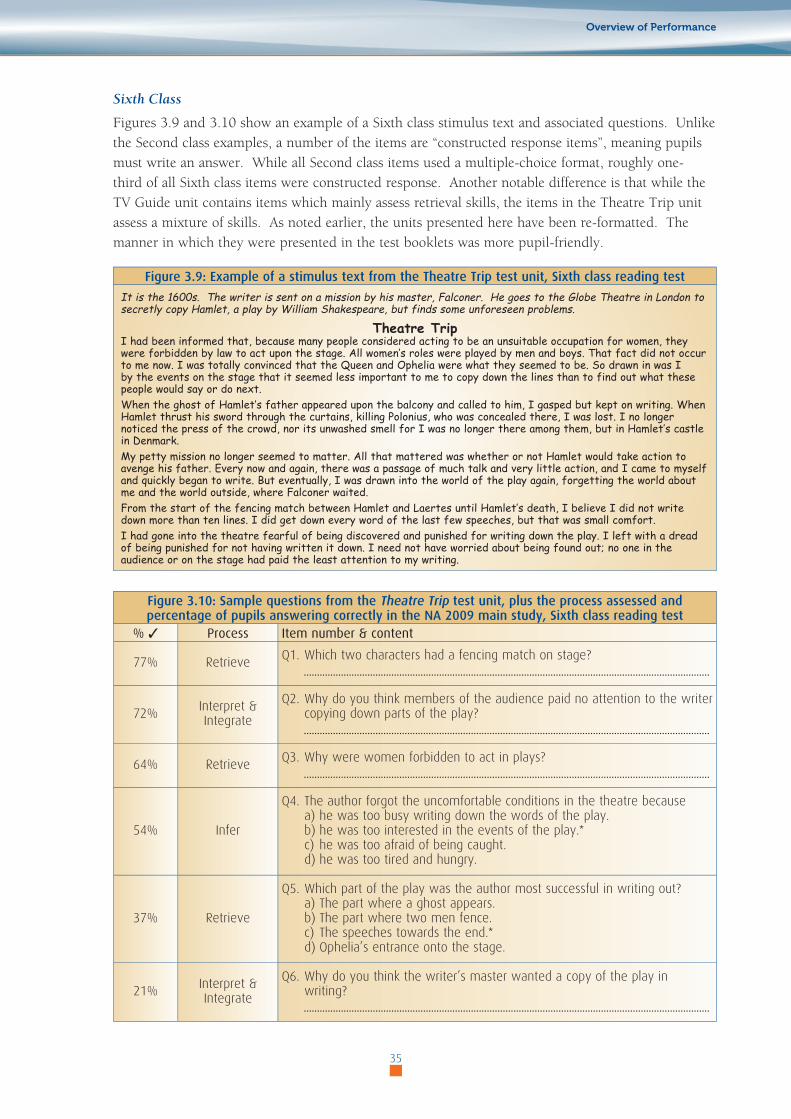
Sixth Class
Figures 3.9 and 3.10 show an example of a Sixth class stimulus text and associated questions. Unlike the Second class examples, a number of the items are “constructed response items”, meaning pupils must write an answer. While all Second class items used a multiple-choice format, roughly one-third of all Sixth class items were constructed response. Another notable difference is that while the TV Guide unit contains items which mainly assess retrieval skills, the items in the Theatre Trip unit assess a mixture of skills. As noted earlier, the units presented here have been re-formatted. The manner in which they were presented in the test booklets was more pupil-friendly.
Figure 3.9: Example of a stimulus text from the Theatre Trip test unit, Sixth class reading test
It is the 1600s. The writer is sent on a mission by his master, Falconer. He goes to the Globe Theatre in London to secretly copy Hamlet, a play by William Shakespeare, but finds some unforeseen problems.
Theatre TripI had been informed that, because many people considered acting to be an unsuitable occupation for women, they were forbidden by law to act upon the stage. All women’s roles were played by men and boys. That fact did not occur to me now. I was totally convinced that the Queen and Ophelia were what they seemed to be. So drawn in was I by the events on the stage that it seemed less important to me to copy down the lines than to find out what these people would say or do next. When the ghost of Hamlet’s father appeared upon the balcony and called to him, I gasped but kept on writing. When Hamlet thrust his sword through the curtains, killing Polonius, who was concealed there, I was lost. I no longer noticed the press of the crowd, nor its unwashed smell for I was no longer there among them, but in Hamlet’s castle in Denmark. My petty mission no longer seemed to matter. All that mattered was whether or not Hamlet would take action to avenge his father. Every now and again, there was a passage of much talk and very little action, and I came to myself and quickly began to write. But eventually, I was drawn into the world of the play again, forgetting the world about me and the world outside, where Falconer waited.From the start of the fencing match between Hamlet and Laertes until Hamlet’s death, I believe I did not write down more than ten lines. I did get down every word of the last few speeches, but that was small comfort.I had gone into the theatre fearful of being discovered and punished for writing down the play. I left with a dread of being punished for not having written it down. I need not have worried about being found out; no one in the audience or on the stage had paid the least attention to my writing.
Figure 3.10: Sample questions from the Theatre Trip test unit, plus the process assessed and percentage of pupils answering correctly in the NA 2009 main study, Sixth class reading test
%3 Process Itemnumber&content
77% Retrieve Q1. Which two characters had a fencing match on stage?
72% Interpret & Integrate
Q2. Why do you think members of the audience paid no attention to the writer copying down parts of the play?
64% Retrieve Q3. Why were women forbidden to act in plays?
54% Infer
Q4. The author forgot the uncomfortable conditions in the theatre becausea) he was too busy writing down the words of the play.b) he was too interested in the events of the play.*c) he was too afraid of being caught.d) he was too tired and hungry.
37% Retrieve
Q5. Which part of the play was the author most successful in writing out?a) The part where a ghost appears.b) The part where two men fence.c) The speeches towards the end.*d) Ophelia’s entrance onto the stage.
21% Interpret & Integrate
Q6. Why do you think the writer’s master wanted a copy of the play in writing?
Overview of Performance
35
Table 3.5 describes the type of skills that Sixth class pupils at each proficiency level are able to demonstrate. Overall, 10% of Sixth class pupils score below 183, thereby failing to reach proficiency level 1. This means that they are not consistently able to demonstrate the types of reading skills assessed by the simplest of items on the Sixth class assessment. Twelve percent of boys, compared to 8% of girls fall into the “Below Level 1” category.
The 25% of pupils (overall, and for boys and girls) whose scores fall between 183 and 229 are categorised as at proficiency level 1 (the lowest Level). These pupils can carry out basic retrieval processes, such as making literal matches of phrases in the question with the same phrases in the stimulus text (see Question 1 from Theatre Trip as an example). Pupils at Level 1 can make very basic inferences (e.g., at least part of the information required for the answer is explicitly stated in the text) and identify the rationale behind a piece of text where it is clearly flagged.
The 30% of Sixth class pupils (32% of girls and 28% of boys) at Level 2 can carry out more complex retrieval processes, including retrieving modified phrasings, and retrieving information from a larger section of text (once the question and text content are a reasonably literal match). Question 3 from Theatre Trip (Figure 3.10) is an example of a Level 2 item assessing retrieval skills. Pupils at Level 2 can also demonstrate some mid-level integration skills, including a more holistic understanding of the text, drawing on outside knowledge, if necessary. Question 2, where pupils must interpret the audience’s lack of interest in the writer, is indicative of the skills pupils at this Level have mastered.
Pupils at Level 3 (scores between 271 and 316) show complex retrieval skills, and can use multiple elements of the text to locate the correct response. They can link two pieces of information to infer the correct response, and can interpret meanings at whole-text level. They can draw on personal knowledge in their answers, and evaluate arguments and the “appeal” of texts. Question 4 – where pupils must use information at a global text level to infer the correct answer – is an example of a Level 3 skill. Twenty-five percent of girls and boys are categorised as at Level 3.
The 2009 National Assessments of Mathematics and English Reading
36

316
270
229
<183
271
230
183
317+
Table 3.5: Proficiency levels on the reading scale and percentages of pupils (overall and by gender) achieving each level, Sixth class
Level&scorerange
Sampleitems(seeFig3 .10)
Whatpupilscantypicallydo Total Boys Girls
4Q6
Q5
As well as skills exemplifying lower Levels, pupils at proficiency level 4 show advanced retrieval skills. They can find answers where the phrasing of the text and question differ considerably. They do not need to rely on explicitly stated information or connections, but can infer answers from multiple pieces of text, and use broad themes at whole-text level to infer an answer. They can evaluate the rationale behind a piece of text, even where the text covers multiple events/topics, and the overall rationale is not apparent unless analysed at a global level.
10 10 10
3 Q4
As well as Levels 1 and 2 skills, pupils at Level 3 have complex retrieval skills. They can examine multiple elements of the text to locate the correct response and rule out incorrect responses. They can answer items where the phrasing in the text and question are not identical, and locate detail in dense texts such as advertisements or dictionaries. Pupils at level 3 have more strongly established inferencing skills (e.g., they are consistently able to link two pieces of information from a text to infer the correct response).They can interpret meanings at whole-text level, and integrate this with personal knowledge or experience, in order to identify a correct response. They can use opinion and external knowledge to evaluate arguments made, the clarity of information presented, or the structure and “appeal” of texts.
25 25 25
2Q3
Q2
Pupils at Level 2 can carry out multipart retrieval processes, such as answering questions that use a modified version of the phrasing in the text. They can also match question content with information in the stimulus text that extends beyond one or two adjacent sentences, provided that the question is an almost literal match with text content.They can combine two pieces of non-adjacent information in the text to infer a response, but their skills at this level are not consistent. They demonstrate integration skills such as identifying overall themes from texts, or drawing on outside knowledge.
30 28 32
1 Q1
Pupils at Level 1 can carry out basic retrieval processes and can match words and phrases in the question with the same words and phrases in the stimulus text to answer items. They can also make low-level inferences, where at least part of the information required for the answer is explicitly stated in the text, or where a discrete piece of explicitly stated text coupled with very basic external knowledge is sufficient to answer the question.Pupils at this level can also engage in some interpretation and integration of information, such as identifying an idea or theme in a section of text. They can identify the rationale behind a piece of text where it is clearly flagged (for example, in the title).
25 25 25
Pupils below proficiency level 1 have a less than 62.5% chance of correctly answering the easiest questions. Their reading skills are very low, relative to other 6th class pupils and are not properly assessed by this assessment.
10 12 8
Overview of Performance
37

The 10% of Sixth class pupils who obtained reading scores higher than 316 are classified as at proficiency level 4. They show advanced retrieval skills, and can locate complex information in a text, even when phrasing differs considerably from the question. Question 5 is an example of a difficult item assessing retrieval skills. Seventy-four percent of pupils at Level 4 answered it correctly, compared to 37% overall and only 17% of Level 1 pupils. Pupils at Level 4 can also infer responses when details are not explicitly stated in a text, and can evaluate text rationale or writers’ purposes, even where the text covers multiple topics, and the overall rationale is not apparent unless analysed at a global level. Question 6 (interpreting the master’s motivation) is an example of the type of processing in which pupils at this level can engage. As well as being the most difficult question in Theatre Trip, it was one of the hardest questions asked in the Sixth class reading test. Only 6% of pupils at Level 1 answered this question correctly, and even among pupils at Level 4, only 61% did so.
Mathematics Proficiency Levels and Example Items
Tables 3.6 and 3.7 describe the scales of mathematics proficiency levels for Second and Sixth classes, respectively. Each table is accompanied by a set of example questions, with one or more examples for each proficiency level. The examples selected cover a range of content strands and process skills and exemplify the types of questions that can be answered by pupils at each of the four proficiency levels. For each example, the content area (strand and strand unit) and process skill involved are shown.
Second Class
Table 3.6 describes the type of skills that Second class pupils at each mathematics proficiency level can demonstrate. Ten percent of pupils score below 184, thereby failing to reach proficiency level 1. Their mathematical skills are very low, and are not appropriately assessed by this test. Pupils scoring between 184 and 231 are categorised as at proficiency level 1 (the lowest Level). These 25% of pupils only show very basic mathematical skills, such as understanding place value and numeration within 200, and recalling addition facts. They can classify 2-D and 3-D shapes and list their properties. They can identify half of a shape, use the vocabulary of time and identify a date on a calendar. They can find the value of a group of coins. Items exemplifying Level 1 are very easy, answered correctly by most pupils (e.g., Example Question 1 below).
Example of mathematics question that can be completed by Second Class pupils at proficiency level 1Content Area: Shape & Space: 2-D ShapesProcess: Understand & RecallCorrect: 94%
Q.1Colour in halfof this shape
The 30% of pupils who are at Level 2 (scores between 232 and 269) can, in addition to skills demonstrated by pupils at Levels 1, add a column of three numbers within 99 and identify odd and even numbers. They can identify halves of sets, combine two 2-D shapes to make other shapes, and compare lengths of objects. They can convert analogue time to digital time (to the half-hour). They can interpret information in block graphs, and solve one-step word problems involving addition or subtraction of simple whole numbers. Example Questions 2 and 3 are the kinds of items that such pupils are likely to answer correctly.
The 2009 National Assessments of Mathematics and English Reading
38

Table 3.6: Proficiency levels on the mathematics scale, and percentages of pupils (overall and by gender) achieving each level, Second class
Level&scorerange
Sampleitems Whatpupilscantypicallydo Total Boys Girls
4Q8
Q7
Pupils at Level 4 can calculate items which may be bought with a given sum of money; and can calculate the best estimate of the sum or difference of two two-digit numbers. They show understanding of the associative property of addition; the connection between two-step word problems and their corresponding numerical expressions; and the correct use of the symbols =, <, >. They can measure length using metres and centimetres and measure area using a non-standard unit.They can interpret information from a bar-line graph and make a calculation with it. They can solve one-step word problems involving: repeated addition; addition or subtraction of clock times; halves and quarters of metres, kg, and litres. They can solve two-step word problems involving addition and subtraction of two-digit numbers and money.
10 12 8
3Q6
Q5
Q4
Pupils at Level 3 can recall the subtraction facts, add a row of three numbers with renaming within 99, and find the difference between two two-digit numbers. They can use the vocabulary of ordinal number, and convert tens and units to numbers from 10 to 199. They can extend number patterns, identify quarters of 2-D shapes, and partition a 2-D shape into two other shapes.They can use the concept of an angle as a rotation, use a calendar to read days, dates, months and seasons, and select appropriate non-standard units for measuring capacity. They can exchange coins. They can also solve one-step word problems involving: addition or subtraction of two-digit numbers; halves and quarter of sets of up to 20 objects; addition or subtraction of money, cm and m, kg or litres; time in hr and min on 12-hour clock. They can solve one-step and two-step word problems involving minutes, hours and days.
25 25 25
2Q3
Q2
Pupils at Level 2 can be expected to add columns of three numbers with renaming within 99. They can identify odd and even numbers. They can use the symbols +, - to complete number sentences. They can identify halves of sets with up to 20 objects. Pupils at this level can combine two 2-D shapes to make other shapes. They can identify properties of 3-D shapes and compare lengths of objects in non-standard units. Pupils at this level can convert analogue to digital time (to the half-hour), and interpret information in simple block graphs. They can solve one-step word problems involving addition or subtraction of simple whole numbers.
30 28 32
1 Q1
Pupils at Level 1 can be expected to count objects in groups of threes and fives; use ordinal number; locate numbers within specified intervals up to 199; connect verbal and numerical forms of numbers, up to 199; and to recall the addition facts. They can use the vocabulary of spatial relations to locate objects; identify and classify simple 2-D and 3-D shapes and list some of their properties. They can identify half of a regular 2-D shape. Pupils at this level can use the vocabulary of time to sequence events; and identify a date in a calendar. They can find the value of a group of coins. They can read a simple block graph.
25 25 25
Pupils below proficiency level 1 have a less than 62.5% chance of correctly answering a Level 1 question. Their mathematical skills are very low, relative to other 2nd class pupils and are not properly assessed by the National Assessments.
10 10 10
314
269
231
<184
270
232
184
315+
Overview of Performance
39
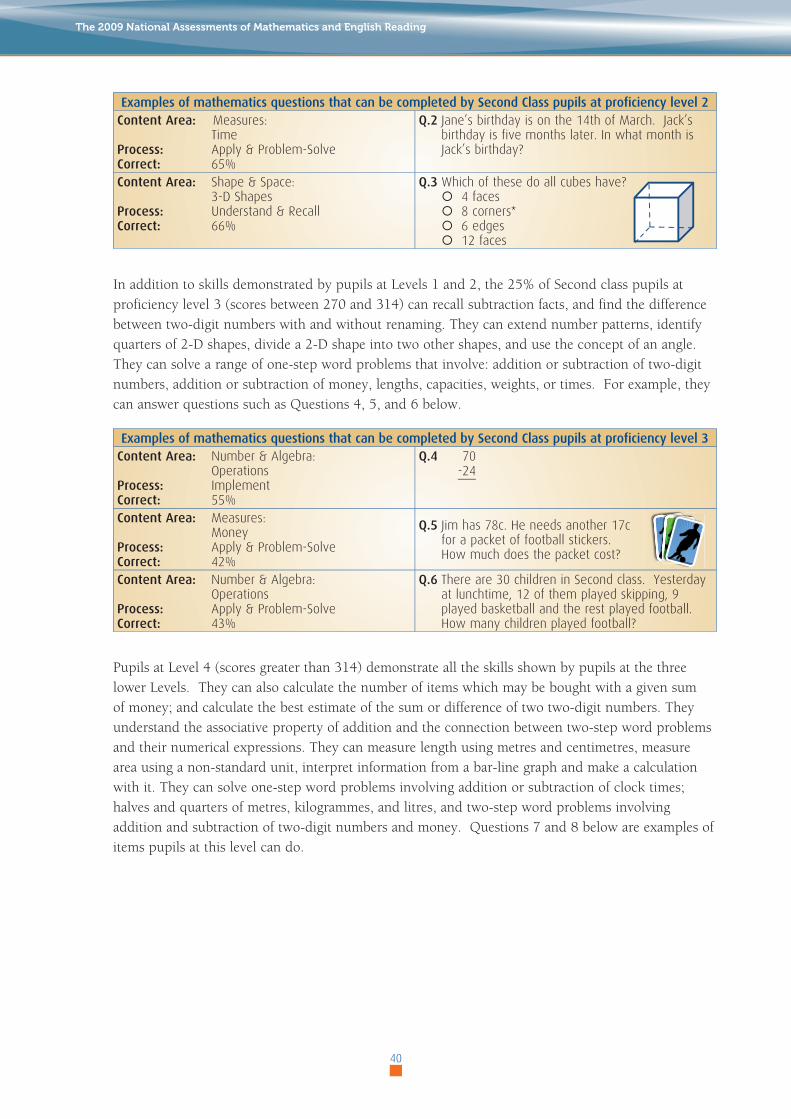
Examples of mathematics questions that can be completed by Second Class pupils at proficiency level 2Content Area: Measures: TimeProcess: Apply & Problem-SolveCorrect: 65%
Q.2 Jane’s birthday is on the 14th of March. Jack’s birthday is five months later. In what month is Jack’s birthday?
Content Area: Shape & Space: 3-D ShapesProcess: Understand & RecallCorrect: 66%
Q.3 Which of these do all cubes have?¡ 4 faces¡ 8 corners*¡ 6 edges¡ 12 faces
In addition to skills demonstrated by pupils at Levels 1 and 2, the 25% of Second class pupils at proficiency level 3 (scores between 270 and 314) can recall subtraction facts, and find the difference between two-digit numbers with and without renaming. They can extend number patterns, identify quarters of 2-D shapes, divide a 2-D shape into two other shapes, and use the concept of an angle. They can solve a range of one-step word problems that involve: addition or subtraction of two-digit numbers, addition or subtraction of money, lengths, capacities, weights, or times. For example, they can answer questions such as Questions 4, 5, and 6 below.
Examples of mathematics questions that can be completed by Second Class pupils at proficiency level 3Content Area: Number & Algebra: OperationsProcess: ImplementCorrect: 55%
Q.4 70 -24
Content Area: Measures: MoneyProcess: Apply & Problem-SolveCorrect: 42%
Q.5 Jim has 78c. He needs another 17c for a packet of football stickers. How much does the packet cost?
Content Area: Number & Algebra: OperationsProcess: Apply & Problem-SolveCorrect: 43%
Q.6 There are 30 children in Second class. Yesterday at lunchtime, 12 of them played skipping, 9 played basketball and the rest played football. How many children played football?
Pupils at Level 4 (scores greater than 314) demonstrate all the skills shown by pupils at the three lower Levels. They can also calculate the number of items which may be bought with a given sum of money; and calculate the best estimate of the sum or difference of two two-digit numbers. They understand the associative property of addition and the connection between two-step word problems and their numerical expressions. They can measure length using metres and centimetres, measure area using a non-standard unit, interpret information from a bar-line graph and make a calculation with it. They can solve one-step word problems involving addition or subtraction of clock times; halves and quarters of metres, kilogrammes, and litres, and two-step word problems involving addition and subtraction of two-digit numbers and money. Questions 7 and 8 below are examples of items pupils at this level can do.
The 2009 National Assessments of Mathematics and English Reading
40
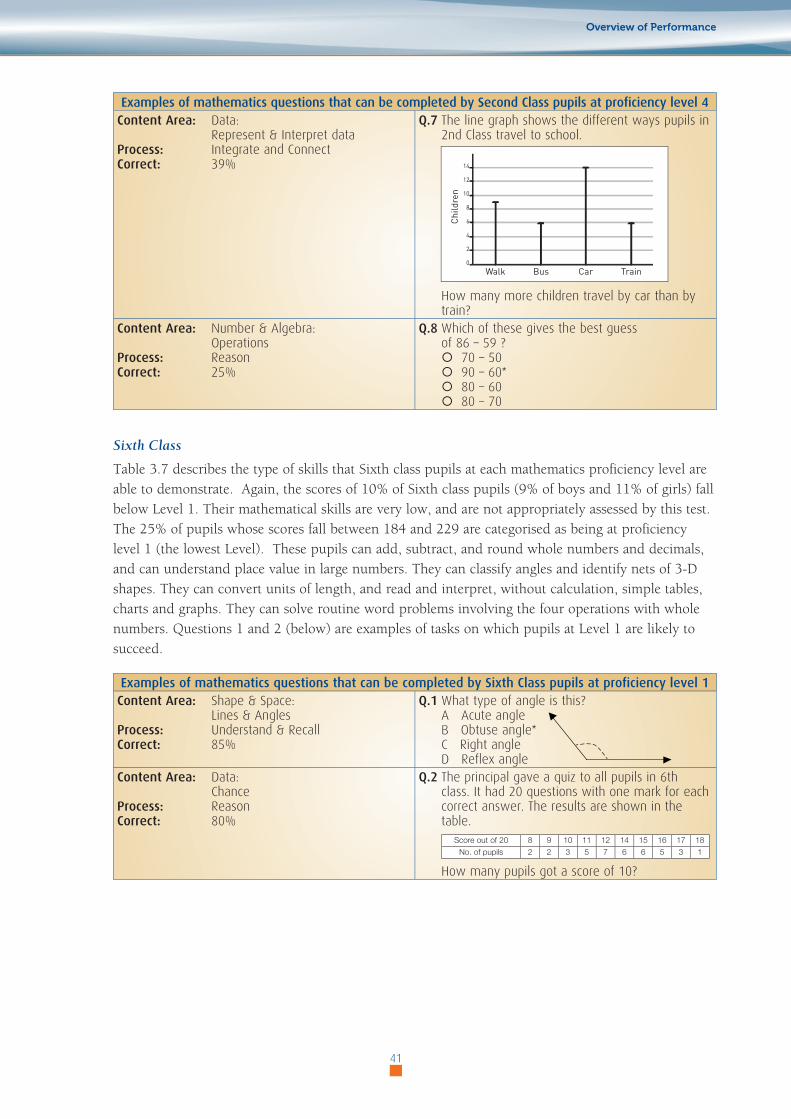
Examples of mathematics questions that can be completed by Second Class pupils at proficiency level 4Content Area: Data: Represent & Interpret dataProcess: Integrate and ConnectCorrect: 39%
Q.7 The line graph shows the different ways pupils in 2nd Class travel to school.
How many more children travel by car than by train?
Content Area: Number & Algebra: OperationsProcess: ReasonCorrect: 25%
Q.8 Which of these gives the best guessof 86 – 59 ?¡ 70 – 50¡ 90 – 60*¡ 80 – 60¡ 80 – 70
Sixth Class
Table 3.7 describes the type of skills that Sixth class pupils at each mathematics proficiency level are able to demonstrate. Again, the scores of 10% of Sixth class pupils (9% of boys and 11% of girls) fall below Level 1. Their mathematical skills are very low, and are not appropriately assessed by this test. The 25% of pupils whose scores fall between 184 and 229 are categorised as being at proficiency level 1 (the lowest Level). These pupils can add, subtract, and round whole numbers and decimals, and can understand place value in large numbers. They can classify angles and identify nets of 3-D shapes. They can convert units of length, and read and interpret, without calculation, simple tables, charts and graphs. They can solve routine word problems involving the four operations with whole numbers. Questions 1 and 2 (below) are examples of tasks on which pupils at Level 1 are likely to succeed.
Examples of mathematics questions that can be completed by Sixth Class pupils at proficiency level 1Content Area: Shape & Space:
Lines & AnglesProcess: Understand & RecallCorrect: 85%
Q.1 What type of angle is this? A Acute angle B Obtuse angle*C Right angle D Reflex angle
Content Area: Data: ChanceProcess: ReasonCorrect: 80%
Q.2 The principal gave a quiz to all pupils in 6th class. It had 20 questions with one mark for each correct answer. The results are shown in the table.
Score out of 20 8 9 10 11 12 14 15 16 17 18
No. of pupils 2 2 3 5 7 6 6 5 3 1
How many pupils got a score of 10?
Overview of Performance
41
Children
Walk
14
12
10
8
6
4
2
0
Bus Car Train
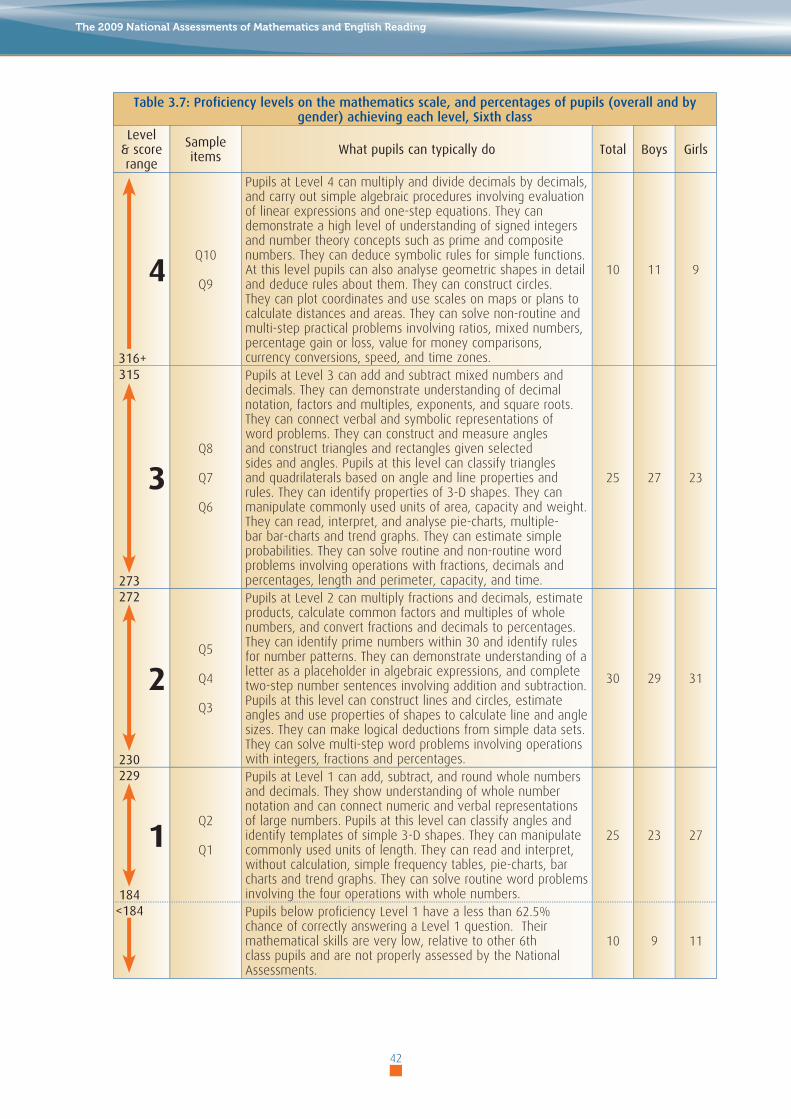
Table 3.7: Proficiency levels on the mathematics scale, and percentages of pupils (overall and by gender) achieving each level, Sixth class
Level&scorerange
Sampleitems Whatpupilscantypicallydo Total Boys Girls
4Q10
Q9
Pupils at Level 4 can multiply and divide decimals by decimals, and carry out simple algebraic procedures involving evaluation of linear expressions and one-step equations. They can demonstrate a high level of understanding of signed integers and number theory concepts such as prime and composite numbers. They can deduce symbolic rules for simple functions. At this level pupils can also analyse geometric shapes in detail and deduce rules about them. They can construct circles. They can plot coordinates and use scales on maps or plans to calculate distances and areas. They can solve non-routine and multi-step practical problems involving ratios, mixed numbers, percentage gain or loss, value for money comparisons, currency conversions, speed, and time zones.
10 11 9
3Q8
Q7
Q6
Pupils at Level 3 can add and subtract mixed numbers and decimals. They can demonstrate understanding of decimal notation, factors and multiples, exponents, and square roots. They can connect verbal and symbolic representations of word problems. They can construct and measure angles and construct triangles and rectangles given selected sides and angles. Pupils at this level can classify triangles and quadrilaterals based on angle and line properties and rules. They can identify properties of 3-D shapes. They can manipulate commonly used units of area, capacity and weight. They can read, interpret, and analyse pie-charts, multiple-bar bar-charts and trend graphs. They can estimate simple probabilities. They can solve routine and non-routine word problems involving operations with fractions, decimals and percentages, length and perimeter, capacity, and time.
25 27 23
2Q5
Q4
Q3
Pupils at Level 2 can multiply fractions and decimals, estimate products, calculate common factors and multiples of whole numbers, and convert fractions and decimals to percentages. They can identify prime numbers within 30 and identify rules for number patterns. They can demonstrate understanding of a letter as a placeholder in algebraic expressions, and complete two-step number sentences involving addition and subtraction. Pupils at this level can construct lines and circles, estimate angles and use properties of shapes to calculate line and angle sizes. They can make logical deductions from simple data sets. They can solve multi-step word problems involving operations with integers, fractions and percentages.
30 29 31
1Q2
Q1
Pupils at Level 1 can add, subtract, and round whole numbers and decimals. They show understanding of whole number notation and can connect numeric and verbal representations of large numbers. Pupils at this level can classify angles and identify templates of simple 3-D shapes. They can manipulate commonly used units of length. They can read and interpret, without calculation, simple frequency tables, pie-charts, bar charts and trend graphs. They can solve routine word problems involving the four operations with whole numbers.
25 23 27
Pupils below proficiency Level 1 have a less than 62.5% chance of correctly answering a Level 1 question. Their mathematical skills are very low, relative to other 6th class pupils and are not properly assessed by the National Assessments.
10 9 11
315
272
229
<184
273
230
184
316+
The 2009 National Assessments of Mathematics and English Reading
42
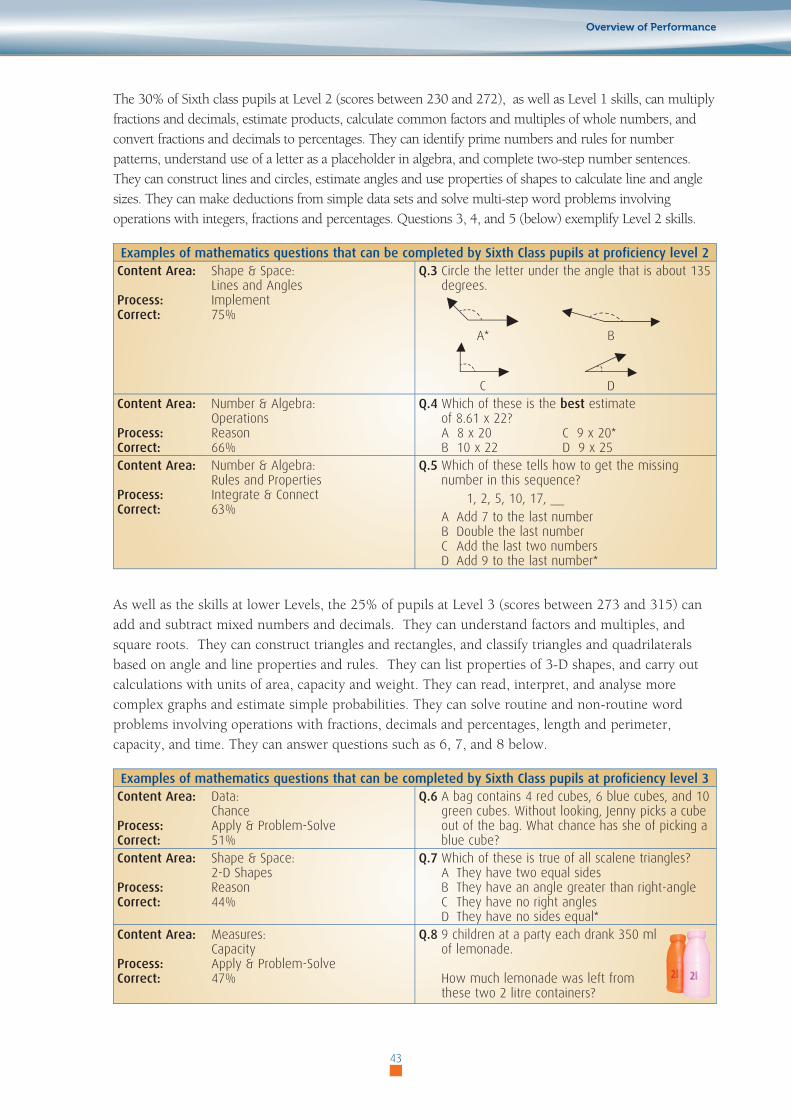
The 30% of Sixth class pupils at Level 2 (scores between 230 and 272), as well as Level 1 skills, can multiply fractions and decimals, estimate products, calculate common factors and multiples of whole numbers, and convert fractions and decimals to percentages. They can identify prime numbers and rules for number patterns, understand use of a letter as a placeholder in algebra, and complete two-step number sentences. They can construct lines and circles, estimate angles and use properties of shapes to calculate line and angle sizes. They can make deductions from simple data sets and solve multi-step word problems involving operations with integers, fractions and percentages. Questions 3, 4, and 5 (below) exemplify Level 2 skills.
Examples of mathematics questions that can be completed by Sixth Class pupils at proficiency level 2Content Area: Shape & Space: Lines and AnglesProcess: ImplementCorrect: 75%
Q.3 Circle the letter under the angle that is about 135 degrees.
A* B
C DContent Area: Number & Algebra: OperationsProcess: ReasonCorrect: 66%
Q.4 Which of these is the best estimateof 8.61 x 22?A 8 x 20 C 9 x 20*B 10 x 22 D 9 x 25
Content Area: Number & Algebra: Rules and PropertiesProcess: Integrate & ConnectCorrect: 63%
Q.5 Which of these tells how to get the missing number in this sequence?
1, 2, 5, 10, 17, __A Add 7 to the last numberB Double the last numberC Add the last two numbersD Add 9 to the last number*
As well as the skills at lower Levels, the 25% of pupils at Level 3 (scores between 273 and 315) can add and subtract mixed numbers and decimals. They can understand factors and multiples, and square roots. They can construct triangles and rectangles, and classify triangles and quadrilaterals based on angle and line properties and rules. They can list properties of 3-D shapes, and carry out calculations with units of area, capacity and weight. They can read, interpret, and analyse more complex graphs and estimate simple probabilities. They can solve routine and non-routine word problems involving operations with fractions, decimals and percentages, length and perimeter, capacity, and time. They can answer questions such as 6, 7, and 8 below.
Examples of mathematics questions that can be completed by Sixth Class pupils at proficiency level 3Content Area: Data: ChanceProcess: Apply & Problem-SolveCorrect: 51%
Q.6 A bag contains 4 red cubes, 6 blue cubes, and 10 green cubes. Without looking, Jenny picks a cube out of the bag. What chance has she of picking a blue cube?
Content Area: Shape & Space: 2-D ShapesProcess: ReasonCorrect: 44%
Q.7 Which of these is true of all scalene triangles?A They have two equal sidesB They have an angle greater than right-angleC They have no right anglesD They have no sides equal*
Content Area: Measures: CapacityProcess: Apply & Problem-SolveCorrect: 47%
Q.8 9 children at a party each drank 350 ml of lemonade.
How much lemonade was left from these two 2 litre containers?
Overview of Performance
43
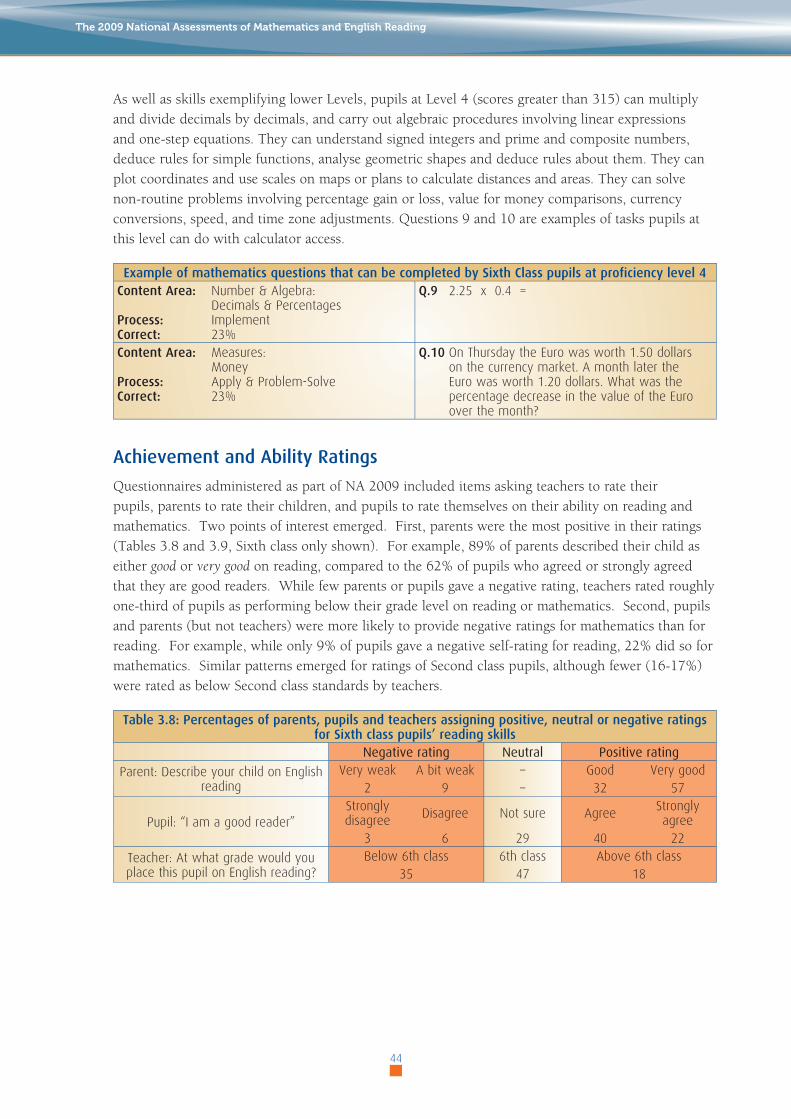
As well as skills exemplifying lower Levels, pupils at Level 4 (scores greater than 315) can multiply and divide decimals by decimals, and carry out algebraic procedures involving linear expressions and one-step equations. They can understand signed integers and prime and composite numbers, deduce rules for simple functions, analyse geometric shapes and deduce rules about them. They can plot coordinates and use scales on maps or plans to calculate distances and areas. They can solve non-routine problems involving percentage gain or loss, value for money comparisons, currency conversions, speed, and time zone adjustments. Questions 9 and 10 are examples of tasks pupils at this level can do with calculator access.
Example of mathematics questions that can be completed by Sixth Class pupils at proficiency level 4Content Area: Number & Algebra: Decimals & PercentagesProcess: ImplementCorrect: 23%
Q.9 2.25 x 0.4 =
Content Area: Measures: MoneyProcess: Apply & Problem-SolveCorrect: 23%
Q.10 On Thursday the Euro was worth 1.50 dollars on the currency market. A month later the Euro was worth 1.20 dollars. What was the percentage decrease in the value of the Euro over the month?
Achievement and Ability Ratings
Questionnaires administered as part of NA 2009 included items asking teachers to rate their pupils, parents to rate their children, and pupils to rate themselves on their ability on reading and mathematics. Two points of interest emerged. First, parents were the most positive in their ratings (Tables 3.8 and 3.9, Sixth class only shown). For example, 89% of parents described their child as either good or very good on reading, compared to the 62% of pupils who agreed or strongly agreed that they are good readers. While few parents or pupils gave a negative rating, teachers rated roughly one-third of pupils as performing below their grade level on reading or mathematics. Second, pupils and parents (but not teachers) were more likely to provide negative ratings for mathematics than for reading. For example, while only 9% of pupils gave a negative self-rating for reading, 22% did so for mathematics. Similar patterns emerged for ratings of Second class pupils, although fewer (16-17%) were rated as below Second class standards by teachers.
Table 3.8: Percentages of parents, pupils and teachers assigning positive, neutral or negative ratings for Sixth class pupils’ reading skills
Negativerating Neutral Positiverating
Parent: Describe your child on English reading
Very weak A bit weak – Good Very good2 9 – 32 57
Pupil: “I am a good reader”Strongly disagree Disagree Not sure Agree Strongly
agree3 6 29 40 22
Teacher: At what grade would you place this pupil on English reading?
Below 6th class 6th class Above 6th class35 47 18
The 2009 National Assessments of Mathematics and English Reading
44
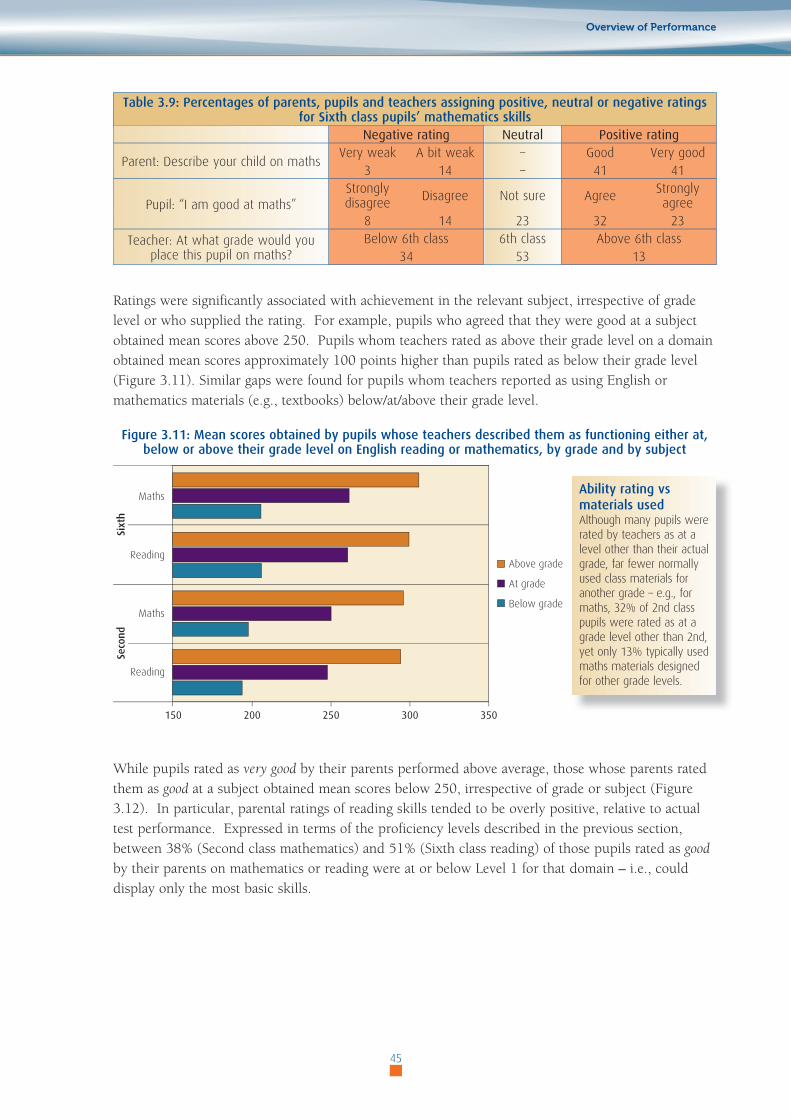
Table 3.9: Percentages of parents, pupils and teachers assigning positive, neutral or negative ratings for Sixth class pupils’ mathematics skills
Negativerating Neutral Positiverating
Parent: Describe your child on mathsVery weak A bit weak – Good Very good
3 14 – 41 41
Pupil: “I am good at maths”Strongly disagree Disagree Not sure Agree Strongly
agree8 14 23 32 23
Teacher: At what grade would you place this pupil on maths?
Below 6th class 6th class Above 6th class34 53 13
Ratings were significantly associated with achievement in the relevant subject, irrespective of grade level or who supplied the rating. For example, pupils who agreed that they were good at a subject obtained mean scores above 250. Pupils whom teachers rated as above their grade level on a domain obtained mean scores approximately 100 points higher than pupils rated as below their grade level (Figure 3.11). Similar gaps were found for pupils whom teachers reported as using English or mathematics materials (e.g., textbooks) below/at/above their grade level.
Figure 3.11: Mean scores obtained by pupils whose teachers described them as functioning either at, below or above their grade level on English reading or mathematics, by grade and by subject
150 200 250 300 350
Maths
Reading
Maths
Reading
Sixt
hSe
cond
Above grade
At grade
Below grade
While pupils rated as very good by their parents performed above average, those whose parents rated them as good at a subject obtained mean scores below 250, irrespective of grade or subject (Figure 3.12). In particular, parental ratings of reading skills tended to be overly positive, relative to actual test performance. Expressed in terms of the proficiency levels described in the previous section, between 38% (Second class mathematics) and 51% (Sixth class reading) of those pupils rated as good by their parents on mathematics or reading were at or below Level 1 for that domain – i.e., could display only the most basic skills.
Overview of Performance
45
Ability rating vs materials usedAlthough many pupils were rated by teachers as at a level other than their actual grade, far fewer normally used class materials for another grade – e.g., for maths, 32% of 2nd class pupils were rated as at a grade level other than 2nd, yet only 13% typically used maths materials designed for other grade levels.
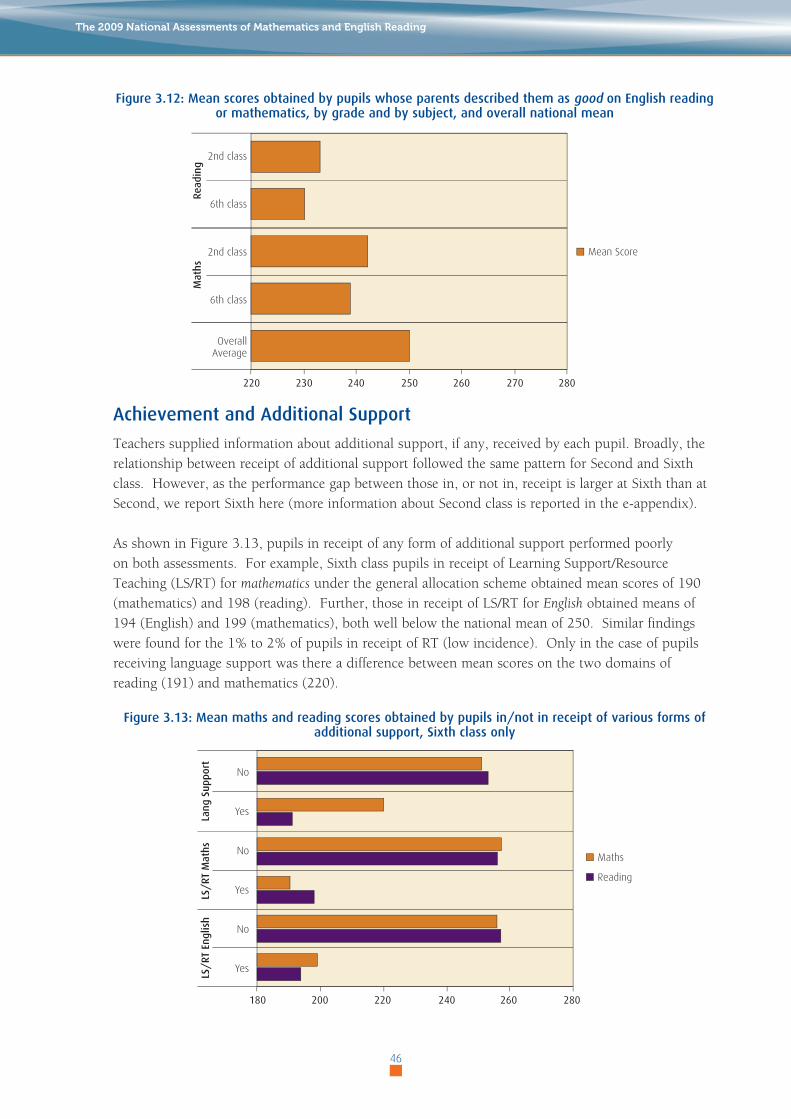
Figure 3.12: Mean scores obtained by pupils whose parents described them as good on English reading or mathematics, by grade and by subject, and overall national mean
220 230 240 250 270 280260
2nd class
6th class
2nd class
6th class
OverallAverage
Read
ing
Mat
hs
Mean Score
Achievement and Additional Support
Teachers supplied information about additional support, if any, received by each pupil. Broadly, the relationship between receipt of additional support followed the same pattern for Second and Sixth class. However, as the performance gap between those in, or not in, receipt is larger at Sixth than at Second, we report Sixth here (more information about Second class is reported in the e-appendix).
As shown in Figure 3.13, pupils in receipt of any form of additional support performed poorly on both assessments. For example, Sixth class pupils in receipt of Learning Support/Resource Teaching (LS/RT) for mathematics under the general allocation scheme obtained mean scores of 190 (mathematics) and 198 (reading). Further, those in receipt of LS/RT for English obtained means of 194 (English) and 199 (mathematics), both well below the national mean of 250. Similar findings were found for the 1% to 2% of pupils in receipt of RT (low incidence). Only in the case of pupils receiving language support was there a difference between mean scores on the two domains of reading (191) and mathematics (220).
Figure 3.13: Mean maths and reading scores obtained by pupils in/not in receipt of various forms of additional support, Sixth class only
180 200 220 240 260 280
No
Yes
No
Yes
No
Yes
Lang
Sup
port
LS/
RT M
aths
LS/
RT E
nglis
h
Maths
Reading
The 2009 National Assessments of Mathematics and English Reading
46
4

The Pupil and AchievementThis chapter describes some characteristics of the pupils who took part in the assessments, and of their home environments. There are three main sections. First, characteristics of the pupils’ family – such as parental employment – are described and related to achievement. Second, home supports and help are outlined. Third, attitudes to, and engagement with, reading and mathematics are described.
+
Bearinmindtwocaveatswhenreadingthisreport .First,NA2009isa“snapshot”study,notalongitudinalone .Thus,wecannot,forexample,saythatdislikingmathscauseslowertestscores,merelythatthetwoarerelated .Second,mostofouranalysesrelateVariableAtoVariableB .However,theremaybeanunderlyingVariableCtobeconsidered–e .g .,socioeconomicstatus(SES)underpinsmanyrelationships .
Family Characteristics
Table 4.1 (overleaf) relates some family characteristics to pupil scores on the reading and mathematics tests. Most pupils (86% of pupils at Second class, and 87% at Sixth) lived in homes where at least one parent was employed. These pupils significantly outperformed pupils with no parent in employment, by 32 to 35 score points. The 20-21% of pupils who lived in a lone-parent household achieved mean scores that were between 19 and 25 points lower than the means for pupils in two-parent households9. There is a strong link between SES and pupil test scores, with mean reading and mathematics scores for pupils from low SES families significantly lower than those for pupils in mid or high SES families. Further, the gap between low SES and high SES pupils is wider at Sixth class (in excess of 40 points for both domains) than at Second (27 points for mathematics and 32 for reading).
Roughly 60% of pupils at each grade had either one or two siblings (Second class mean: 1.9; Sixth class mean: 2.1). Pupils with fewer than four siblings significantly outperformed pupils with four or more siblings. The gap between the two groups was largest for Sixth class reading scores (23 points) and smallest for Second class mathematics (12 points). The 14-15% of pupils born outside of Ireland had slightly lower test scores than Irish-born pupils, but the differences are significant only for reading. Most pupils (90% at Second and 94% at Sixth class) indicated that English was the language spoken most often in their home. Second class pupils who normally spoke English at home significantly outperformed other pupils on reading (31-point gap) and mathematics (22-point gap) (Figure 4.1). At Sixth class, the 42-point gap for reading was significant, but the 11-point gap for mathematics was not.
Less than 2% of pupils were members of the Traveller community. At Second class, these pupils scored close to 200 on each domain. At Sixth, they obtained a mean reading test score of 192 and a mean mathematics score of 180. While statistically significant, these data should be interpreted with caution due to the very small numbers of pupils involved.
9 The category includes parent plus guardian as well as traditional two-parent households.
47
4
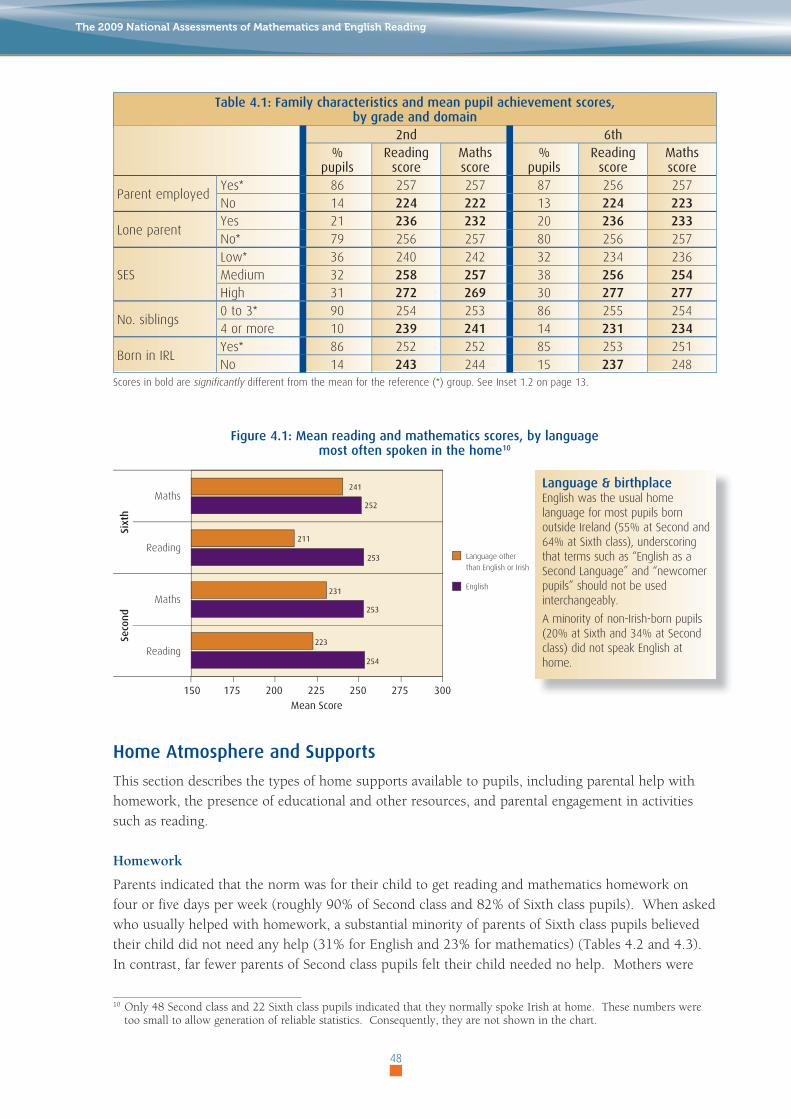
Table 4.1: Family characteristics and mean pupil achievement scores, by grade and domain
2nd 6th%
pupilsReading
scoreMathsscore
%pupils
Readingscore
Mathsscore
Parent employedYes* 86 257 257 87 256 257No 14 224 222 13 224 223
Lone parentYes 21 236 232 20 236 233No* 79 256 257 80 256 257
SESLow* 36 240 242 32 234 236Medium 32 258 257 38 256 254High 31 272 269 30 277 277
No. siblings0 to 3* 90 254 253 86 255 2544 or more 10 239 241 14 231 234
Born in IRLYes* 86 252 252 85 253 251No 14 243 244 15 237 248
Scores in bold are significantly different from the mean for the reference (*) group. See Inset 1.2 on page 13.
Figure 4.1: Mean reading and mathematics scores, by language most often spoken in the home10
150
241
252
211
253
231
253
223
254
175 200 225 250 275 300
Mean Score
Maths
Reading
Maths
Reading
Sixt
hSe
cond
Language otherthan English or Irish
English
Home Atmosphere and Supports
This section describes the types of home supports available to pupils, including parental help with homework, the presence of educational and other resources, and parental engagement in activities such as reading.
Homework
Parents indicated that the norm was for their child to get reading and mathematics homework on four or five days per week (roughly 90% of Second class and 82% of Sixth class pupils). When asked who usually helped with homework, a substantial minority of parents of Sixth class pupils believed their child did not need any help (31% for English and 23% for mathematics) (Tables 4.2 and 4.3). In contrast, far fewer parents of Second class pupils felt their child needed no help. Mothers were
10 Only 48 Second class and 22 Sixth class pupils indicated that they normally spoke Irish at home. These numbers were too small to allow generation of reliable statistics. Consequently, they are not shown in the chart.
The 2009 National Assessments of Mathematics and English Reading
48
Language & birthplace English was the usual home language for most pupils born outside Ireland (55% at Second and 64% at Sixth class), underscoring that terms such as “English as a Second Language” and “newcomer pupils” should not be used interchangeably.
A minority of non-Irish-born pupils (20% at Sixth and 34% at Second class) did not speak English at home.
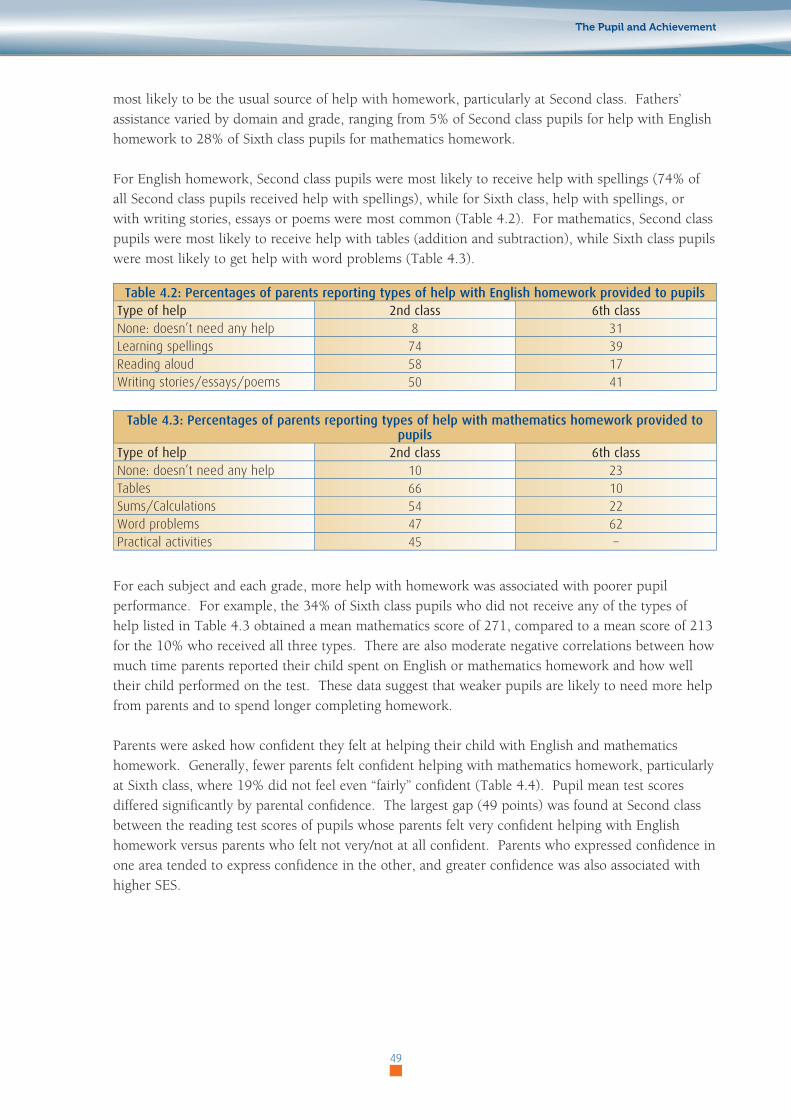
most likely to be the usual source of help with homework, particularly at Second class. Fathers’ assistance varied by domain and grade, ranging from 5% of Second class pupils for help with English homework to 28% of Sixth class pupils for mathematics homework.
For English homework, Second class pupils were most likely to receive help with spellings (74% of all Second class pupils received help with spellings), while for Sixth class, help with spellings, or with writing stories, essays or poems were most common (Table 4.2). For mathematics, Second class pupils were most likely to receive help with tables (addition and subtraction), while Sixth class pupils were most likely to get help with word problems (Table 4.3).
Table 4.2: Percentages of parents reporting types of help with English homework provided to pupilsTypeofhelp 2ndclass 6thclassNone: doesn’t need any help 8 31Learning spellings 74 39Reading aloud 58 17Writing stories/essays/poems 50 41
Table 4.3: Percentages of parents reporting types of help with mathematics homework provided to pupils
Typeofhelp 2ndclass 6thclassNone: doesn’t need any help 10 23Tables 66 10Sums/Calculations 54 22Word problems 47 62Practical activities 45 –
For each subject and each grade, more help with homework was associated with poorer pupil performance. For example, the 34% of Sixth class pupils who did not receive any of the types of help listed in Table 4.3 obtained a mean mathematics score of 271, compared to a mean score of 213 for the 10% who received all three types. There are also moderate negative correlations between how much time parents reported their child spent on English or mathematics homework and how well their child performed on the test. These data suggest that weaker pupils are likely to need more help from parents and to spend longer completing homework.
Parents were asked how confident they felt at helping their child with English and mathematics homework. Generally, fewer parents felt confident helping with mathematics homework, particularly at Sixth class, where 19% did not feel even “fairly” confident (Table 4.4). Pupil mean test scores differed significantly by parental confidence. The largest gap (49 points) was found at Second class between the reading test scores of pupils whose parents felt very confident helping with English homework versus parents who felt not very/not at all confident. Parents who expressed confidence in one area tended to express confidence in the other, and greater confidence was also associated with higher SES.
The Pupil and Achievement
49

Table 4.4: Parental confidence in providing homework assistance, and mean pupil achievement scores2nd 6th
%pupils
Readingscore
Mathsscore
%pupils
Readingscore
Mathsscore
Confidence helping ENGLISH homework
Very* 72 259 257 57 261 259Fairly 24 235 240 37 241 243
Not very/not at all 3 210 221 5 219 234
Confidence helping MATHS homework
Very* 65 260 259 39 262 264Fairly 29 237 238 42 247 247
Not very/not at all 6 241 234 19 243 239
Scores in bold are significantly different from the mean for the reference (*) group. See Inset 1.2 on page 13.
Home Atmosphere
Achievement can also be related to the “atmosphere” of the home. Broadly speaking, atmosphere relates to whether parents provide a supportive environment for academic achievement (e.g., by modelling appropriate behaviour, setting appropriate limits, or by making certain resources available). One common measure of home atmosphere in relation to achievement is the number of books in the home (excluding schoolbooks).
There is a very strong association between the numbers of books and performance on both reading and mathematics. For example, Sixth class pupils who have – according to their parents – 500 or more books in the home obtained mean scores of 288 and 283 for reading and mathematics, respectively (Figure 4.2). For mathematics, this was 71 points higher than the score obtained by those whose homes had few books (between zero and 10 books), while the equivalent gap for reading was 81 points. The magnitude of the difference was only slightly smaller at Second class (63 points for mathematics and 72 for reading), again indicating a very strong relationship. Approximately 9% of Second class and 11% of Sixth class pupils lived in homes with no more than 10 books.
Figure 4.2: Number of books in the home and reading and mathematics achievement, Sixth class
180 205 230 255 280 305
Maths
Reading
501+
101 to 500
51 to 100
11 to 50
0 to 10
283
267
250
238
212
288
270
249
233
208
Mean Score
At least three-quarters of pupils lived in homes where someone was a member of a public library. These pupils obtained mean reading scores over 20 points higher than those from homes without any library members, and mean maths scores that were at least 11 points higher (Table 4.5). Over 90% of pupils had a quiet place to study, and their reading and mathematics mean scores were significantly higher than pupils who did not. Two-thirds of pupils at each grade level had access to
The 2009 National Assessments of Mathematics and English Reading
50
Access to books As well as at school and in the home, pupils can encounter books via public libraries. At each grade level in NA 2009, approximately 4% of pupils came from families where there were 10 books or fewer in the home and where nobody in the household was a member of a public library.

both reference books and educational games in their home, while fewer than one in ten pupils had access to neither. At each grade, pupils with access to both obtained mean scores close to 260 for both reading and mathematics, significantly higher than the mean scores of pupils with access to none or one of the two.
The internet and computer games were ubiquitous, with only 9% of Sixth class pupils reporting that they did not spend any time on schooldays using the internet or playing computer games. The 21% who spent at least one to two hours per school day on each activity (i.e., totalling a minimum of two hours each day) were classified as high users of technology while the remaining pupils were classified as moderate users. The high group obtained significantly lower scores on reading and mathematics than pupils who reported moderate usage.
Table 4.5: Home “atmosphere” and mean pupil achievement scores2nd 6th
%pupils
Readingscore
Mathsscore
%pupils
Readingscore
Mathsscore
Library memberYes* 75 258 255 79 257 256No 25 237 244 21 235 239
Quiet place to study
Yes* 93 253 253 94 254 254No 7 239 235 6 223 226
Educational Resources (ref. books & educ. games)
Both* 65 261 260 66 260 259One 26 242 244 27 241 244
None 9 224 223 7 215 216
Time on internet/ computer games
NoneNot asked at this grade
9 249 249Moderate* 70 255 256
High 21 237 237Scores in bold are significantly different from the mean for the reference (*) group. See Inset 1.2 on page 13.
Most pupils (62% at Sixth class and 53% at Second) had a TV in their bedroom, with large differences in the mean achievement scores of those who did and did not (Figure 4.3). The advantage for those without a bedroom TV ranged from 28 points (Sixth class reading and mathematics) to 34 points (Second class reading). Pupils with few or no books at home were those most likely to have a TV in their bedroom. At Second and Sixth class, 81% of pupils with no more than 10 books in their home had a TV in their bedroom.
Figure 4.3: Mean reading and mathematics scores, by whether or not pupils have a TV in their bedroom
180 200 220 240 260 280 300
239
267
240
268
235
269
237
267
Mean Score
Reading
Maths
Reading
Maths
Sixt
hSe
cond
TV in bedrom
No TV in bedroom
The Pupil and Achievement
51
TVs, Gender & SES Boys and pupils from low SES families were most likely to have TVs in their bedroom – e.g. at Sixth class, 81% of boys from low SES families had a bedroom TV, compared to 30% of girls in high SES families.
Among boys from low SES families, those without bedroom TVs scored between 13 (reading, Second class) and 18 points (maths, Sixth class) higher than those with TVs.

Attitudes and Engagement
This section describes pupil attitudes to, and engagement with, school, reading and mathematics, and parental engagement in reading.
School
Attendance at school is a basic measure of engagement with the education system. At both Second and Sixth class, those who completed one or both tests had an average attendance rate of 94%. Attendance showed a weak to moderate positive correlation with test performance – ranging from r=.14 (reading, Second class) to r=.19 (mathematics, Sixth).
Sixth class pupils were asked about their educational aspirations and expectations (how far they wanted to, and expected to, continue in the education system). Although Table 4.6 shows only expectations, the relationship with test scores was broadly similar for aspirations. The 16% of pupils who expected to cease their education after the Leaving Certificate obtained mean scores of 227 for reading and 229 for mathematics, significantly higher than the means obtained by those who did not expect to continue beyond Junior Certificate, but significantly lower than the means of pupils who expected to attend Third level.
Table 4.6: Pupils’ educational expectations, and mean achievement scores, Sixth class%pupils Readingscore Mathsscore
No more than Junior Cert 2 193 193Leaving Cert* 16 227 229College/university 69 261 260Don’t know 14 233 235
Scores in bold are significantly different from the mean for the reference (*) group. See Inset 1.2 on page 13.
Second class pupils were not asked about their academic aspirations or expectations, but they were asked if they liked school. The highest mean scores (259 for reading and 261 for mathematics) were found among pupils who were unsure if they liked school, with no significant differences between the means of pupils who did and did not like school (Table 4.7). Girls tended to be more positive than boys in their attitude to school. While 57% of girls liked, and only 12% disliked school, among boys, 42% liked school and 29% disliked school.
Table 4.7: Pupils’ reported liking of school, and mean achievement scores, Second class%pupils Readingscore Mathsscore
Yes, like school* 49 249 246Not sure 30 259 261No, don’t like school 21 241 246
Scores in bold are significantly different from the mean for the reference (*) group. See Inset 1.2 on page 13.
Reading
Parent responses to a series of questions about leisure reading were combined to form an overall “parental frequency of reading” scale. Pupils were also asked questions about their attitudes to and engagement in reading. Analysis of Sixth class pupil responses11 suggested three underlying scales (confidence in own reading ability, perceived value of reading, and willingness to expend effort on reading). The latter two scales were moderately correlated with reading test scores (r=0.3 in both
11 Sixth class pupils were asked more questions than Second class, and their responses were on a 5-point, rather than a simple Yes/No scale. Second class questionnaire items and responses are available at www.erc.ie/na2009/questionnaires.
The 2009 National Assessments of Mathematics and English Reading
52
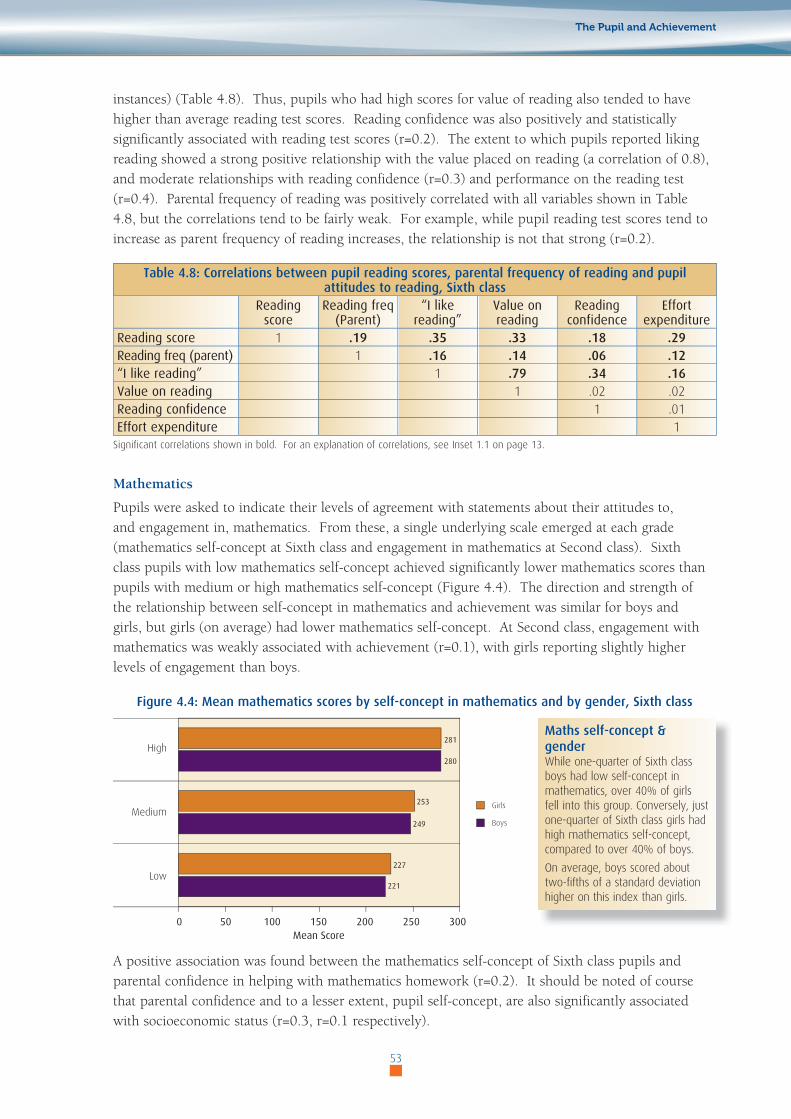
instances) (Table 4.8). Thus, pupils who had high scores for value of reading also tended to have higher than average reading test scores. Reading confidence was also positively and statistically significantly associated with reading test scores (r=0.2). The extent to which pupils reported liking reading showed a strong positive relationship with the value placed on reading (a correlation of 0.8), and moderate relationships with reading confidence (r=0.3) and performance on the reading test (r=0.4). Parental frequency of reading was positively correlated with all variables shown in Table 4.8, but the correlations tend to be fairly weak. For example, while pupil reading test scores tend to increase as parent frequency of reading increases, the relationship is not that strong (r=0.2).
Table 4.8: Correlations between pupil reading scores, parental frequency of reading and pupil attitudes to reading, Sixth class
Readingscore
Readingfreq(Parent)
“Ilikereading”
Valueonreading
Readingconfidence
Effortexpenditure
Readingscore 1 .19 .35 .33 .18 .29Readingfreq(parent) 1 .16 .14 .06 .12“Ilikereading” 1 .79 .34 .16Valueonreading 1 .02 .02Readingconfidence 1 .01Effortexpenditure 1
Significant correlations shown in bold. For an explanation of correlations, see Inset 1.1 on page 13.
Mathematics
Pupils were asked to indicate their levels of agreement with statements about their attitudes to, and engagement in, mathematics. From these, a single underlying scale emerged at each grade (mathematics self-concept at Sixth class and engagement in mathematics at Second class). Sixth class pupils with low mathematics self-concept achieved significantly lower mathematics scores than pupils with medium or high mathematics self-concept (Figure 4.4). The direction and strength of the relationship between self-concept in mathematics and achievement was similar for boys and girls, but girls (on average) had lower mathematics self-concept. At Second class, engagement with mathematics was weakly associated with achievement (r=0.1), with girls reporting slightly higher levels of engagement than boys.
Figure 4.4: Mean mathematics scores by self-concept in mathematics and by gender, Sixth class
0 50 100 150 200 250 300
High
Medium
Low
Girls
Boys
280
281
253
249
227
221
Mean Score
A positive association was found between the mathematics self-concept of Sixth class pupils and parental confidence in helping with mathematics homework (r=0.2). It should be noted of course that parental confidence and to a lesser extent, pupil self-concept, are also significantly associated with socioeconomic status (r=0.3, r=0.1 respectively).
The Pupil and Achievement
53
Maths self-concept & genderWhile one-quarter of Sixth class boys had low self-concept in mathematics, over 40% of girls fell into this group. Conversely, just one-quarter of Sixth class girls had high mathematics self-concept, compared to over 40% of boys.
On average, boys scored about two-fifths of a standard deviation higher on this index than girls.

The 2009 National Assessments of Mathematics and English Reading
54
5

The School, the Classroom and AchievementThis chapter is concerned with school and classroom characteristics and practices. As such, most of the chapter is descriptive, rather than focussing on achievement. There are nine main sections. The first describes pupils’ schools (e.g., location and SSP/DEIS classification) and teachers (e.g., teacher gender and qualifications). Section two describes teacher participation in continuing professional development (CPD), and section three examines teacher confidence in teaching reading and mathematics. Section four describes practices related to teaching and learning (including time allocated to each domain, planning, and grouping). The fifth section examines the availability and use of resources within the school and classroom, while section six examines assessment practices. Section seven describes the provision of additional support to pupils, section eight summarises views expressed by principals, while the final section relates school and teacher characteristics to pupil test performance.
Characteristics of the Learning Environment
In this section, we summarise some characteristics of the schools attended by pupils that participated in NA 2009, and some characteristics of their teachers.
+Thechapterreportsdatafromschoolandteacherquestionnairesatthepupillevel .Forexample,ratherthansaying“Only15%ofSixthclassteachersdidX”,wecalculatehowmanypupilsthoseteacherstaught,andsay“Only12%ofSixthclasspupilsweretaughtbyteacherswhodidX” .Responsesfocusonwhatchildren,nationally,experience,ratherthanhowmanyteachersengageinanactivity .
School Characteristics
Roughly one-third of pupils in NA 2009 attended city schools (including Galway, Limerick and Waterford), while one-third attended schools in villages or rural areas (Table 5.1). The remainder were divided between schools in small and large towns. In terms of participation in the School Support Programme (popularly known as DEIS), 9% of pupils were enrolled in Band 1 Urban schools (i.e., the most disadvantaged urban schools), with approximately 10% in Band 2 Urban schools. Only 4% of pupils were in rural schools receiving additional resources under SSP/DEIS, while over three-quarters of all pupils attended schools that were not in receipt of any additional supports under SSP/DEIS. A large majority of pupils (76% at Second and 71% at Sixth class) were enrolled in mixed-sex schools, while only 6% were taught through the medium of Irish (including scoileanna lán-Ghaeilge and schools in Gaeltacht areas).
55
5

Table 5.1: Percentage of pupils attending various types of schools, by grade level2ndclass 6thclass
Location City 34 34Large town (pop. 10,000+) 12 13Small town (pop. 1,500-10,000) 18 20Village or rural (pop. < 1,500) 36 34
SSP/DEIS Urban: SSP/DEIS Band 1 9 9Urban: SSP/DEIS Band 2 10 9Urban: Non-DEIS 42 45Rural: SSP/DEIS 4 4Rural: Non-SSP/DEIS 35 33
School gender composition Mixed 76 71All-Boys 13 16All-Girls 11 13
Irish-medium No 94 94Yes 6 6
There was considerable variation between schools on variables such as school size and enrolment characteristics. Thus, Table 5.2 presents not only means (the average for each characteristic), but also modes (the most common response) and the 90% range (the range into which schools attended by approximately 90% of pupils fell). The average school size was 271 pupils, and 90% of Second class pupils were in schools with enrolments between 44 and 609 pupils (between 52 and 609 pupils, in the case of Sixth class) (Table 5.2). The mean school attendance rate was 92%, and attendance in the vast majority of schools fell between 87-96%. On average, only 2% of school enrolments were pupils from the Traveller community, while just over half of schools had no pupils from the Traveller community.
Roughly one-quarter of schools’ enrolment were covered by the Books Scheme as of September 2008, while, on average across schools, 10% of pupils enrolled spoke a language other than English or Irish. In schools attended by the Second class pupils in NA 2009, an average of 14% of pupils were receiving LS/RT for English, while 8% were rated as likely to score below the 12th percentile on a standardised English test. For mathematics, 10% were in receipt of assistance and 8% were rated below the 12th percentile. Similar percentages were found at Sixth class.
Table 5.2: Summary characteristics of schools attended by pupils in the National Assessments, by grade2ndclass 6thclass
Mean Mode 90%range Mean Mode 90%rangeEnrolment 271 pupils 71 pupils 44 to 609 271 pupils 71 pupils 52 to 609Attendancerate 92% 95% 88 to 96% 92% 95% 87 to 96%TravellerCommunity 2% 0% 0 to 7% 2% 0% 0 to 7%BooksScheme 25% 0% 0 to 63% 26% 0% 0 to 72%Differentlanguage 10% 0% 0 to 28% 10% 0% 0 to 28%LS/RTforEnglish 14% 10% 4 to 25% 15% 10% 5 to 31%<12thpercentile:ENG 8% 3% 1 to 21% 9% 3% 1 to 24%LS/RTformaths 10% 7% 1 to 21% 10% 7% 1 to 22%<12thpercentile:MAT 8% 3% 1 to 25% 9% 3% 1 to 21%
Mode = the most common response; 90% range = the range into which approximately 90% of pupils’ schools fall.
The 2009 National Assessments of Mathematics and English Reading
56
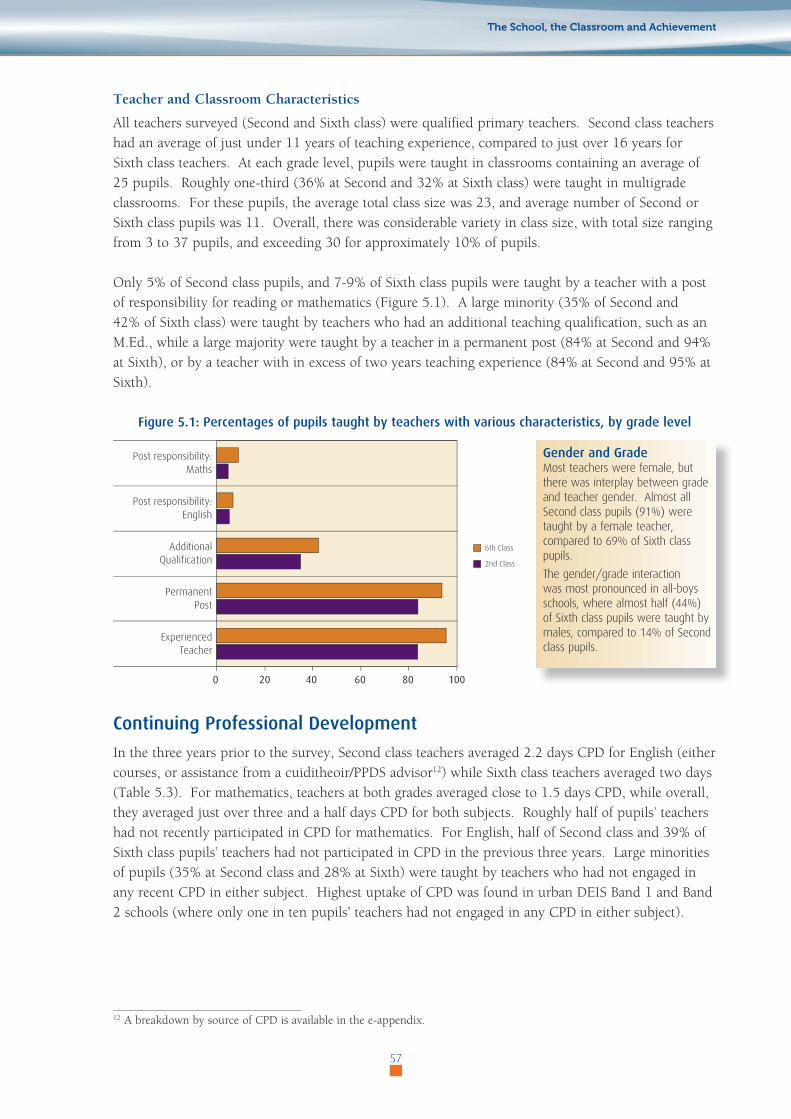
Teacher and Classroom Characteristics
All teachers surveyed (Second and Sixth class) were qualified primary teachers. Second class teachers had an average of just under 11 years of teaching experience, compared to just over 16 years for Sixth class teachers. At each grade level, pupils were taught in classrooms containing an average of 25 pupils. Roughly one-third (36% at Second and 32% at Sixth class) were taught in multigrade classrooms. For these pupils, the average total class size was 23, and average number of Second or Sixth class pupils was 11. Overall, there was considerable variety in class size, with total size ranging from 3 to 37 pupils, and exceeding 30 for approximately 10% of pupils.
Only 5% of Second class pupils, and 7-9% of Sixth class pupils were taught by a teacher with a post of responsibility for reading or mathematics (Figure 5.1). A large minority (35% of Second and 42% of Sixth class) were taught by teachers who had an additional teaching qualification, such as an M.Ed., while a large majority were taught by a teacher in a permanent post (84% at Second and 94% at Sixth), or by a teacher with in excess of two years teaching experience (84% at Second and 95% at Sixth).
Figure 5.1: Percentages of pupils taught by teachers with various characteristics, by grade level
0 20 40 60 80 100
Post responsibility:Maths
Post responsibility:English
AdditionalQualification
PermanentPost
ExperiencedTeacher
6th Class
2nd Class
Continuing Professional Development
In the three years prior to the survey, Second class teachers averaged 2.2 days CPD for English (either courses, or assistance from a cuiditheoir/PPDS advisor12) while Sixth class teachers averaged two days (Table 5.3). For mathematics, teachers at both grades averaged close to 1.5 days CPD, while overall, they averaged just over three and a half days CPD for both subjects. Roughly half of pupils’ teachers had not recently participated in CPD for mathematics. For English, half of Second class and 39% of Sixth class pupils’ teachers had not participated in CPD in the previous three years. Large minorities of pupils (35% at Second class and 28% at Sixth) were taught by teachers who had not engaged in any recent CPD in either subject. Highest uptake of CPD was found in urban DEIS Band 1 and Band 2 schools (where only one in ten pupils’ teachers had not engaged in any CPD in either subject).
12 A breakdown by source of CPD is available in the e-appendix.
57
The School, the Classroom and Achievement
Gender and Grade Most teachers were female, but there was interplay between grade and teacher gender. Almost all Second class pupils (91%) were taught by a female teacher, compared to 69% of Sixth class pupils.
The gender/grade interaction was most pronounced in all-boys schools, where almost half (44%) of Sixth class pupils were taught by males, compared to 14% of Second class pupils.

Table 5.3: Mean number of days CPD attended in the last three years, and percentage of pupils whose teachers did not attend any CPD, Second and Sixth class
2ndclass 6thclassNo .ofdays %none No .ofdays %none
English 2.2 49 2.0 39Maths 1.5 48 1.4 52Total days 3.7 35 3.5 28
Teachers were asked to identify their three personal priority areas for CPD in relation to English and to mathematics for the grade level they taught. For English, developing writing skills was by far the most frequently cited CPD need (48% of Second class pupils’ teachers and 59% for Sixth class) (Table 5.4). Phonics or phonological awareness was the second most frequently cited topic for Second class, but – unsurprisingly – was not raised by Sixth class teachers. Teachers of roughly one in five pupils wanted CPD on strategies to deal with lower achieving pupils, over twice as many as those who wanted to learn more about dealing with higher achieving pupils.
One-third of Sixth class pupils (22% at Second class) were in classes where their teacher wanted training on the use of Information and Communication Technologies (ICT). Other frequently cited topics were the teaching of reading generally, developing vocabulary and oral language skills, assessment, and text selection and use. Differentiation, or teaching in a multigrade setting, was more frequently identified as a CPD need by Second class teachers, while ways of “selling” reading to pupils and making it appear to be an interesting and fulfilling activity was a training need identified by Sixth class teachers only.
Table 5.4: Percentages of pupils taught by teachers who identified various topics as among their three priority topics for English CPD
Topic 2ndclass 6thclassDeveloping writing skills 48 59Phonics/Phonological awareness 24 –Strategies/materials for working with lower achieving pupils 22 18ICT 22 33Differentiation/multigrade classes 18 6Comprehension strategies 14 17Teaching reading – general 11 10Oral language, developing vocabulary 10 15Strategies/materials for challenging high achievers 10 7Text selection and use 9 11Assessment 9 13“Selling” reading as an interesting activity – 10
Table shows topics identified by teachers of at least 10% of pupils at one or both grades.
For mathematics, the teachers of over half of Sixth class pupils (41% at Second class) identified ICT as one of their priority topics (Table 5.5). The next most commonly cited topics were teaching word problems and non-routine problem-solving skills (23% at Second and 30% at Sixth class), and a number of specific mathematics topics, such as teaching fractions, directed numbers or decimals. Assistance with identifying or using the most appropriate manipulative materials, and differentiation (either in single or multigrade settings) were also cited as CPD needs by the teachers of approximately one in five pupils. Other topics identified by the teachers of at least 10% of pupils included teaching pupils with special needs/low achievers, assessment, and, integrating mathematics with other subject areas.
The 2009 National Assessments of Mathematics and English Reading
58

Table 5.5: Percentages of pupils taught by teachers who identified various topics as among their three priority topics for mathematics CPD
2ndclass 6thclassICT 41 61Word problems/non-routine problem solving abilities 23 30Specific maths topics (e.g., directed numbers, fractions, decimals, basic understanding of number) 32 22
Identification and/or use of manipulative materials 19 26Differentiation/multigrade classes 21 18Teaching pupils with special needs/low achievers 14 12Assessment 19 11Integrating maths into other subjects 11 11
Table shows topics identified by the teachers of at least 10% of pupils at one or both grades.
Confidence in Teaching
This section examines teacher self-reports of confidence in teaching reading and mathematics. Teachers of pupils in both Second and Sixth classes were asked to indicate whether they were very confident, somewhat confident, or not confident engaging in certain activities and situations when teaching English and mathematics. Teachers’ confidence in their teaching ability varied considerably across the different teaching areas (Tables 5.6 and 5.7).
In relation to reading, a majority of pupils in both Second (57%) and Sixth (58%) were taught by teachers who felt very confident teaching high achievers in reading, whereas no more than 40% were very confident working with lower-achieving pupils in reading (Table 5.6). Teachers of almost half of pupils were very confident of their ability to teach reading skills in other subject areas, while one-quarter or fewer were taught by teachers who were very confident using computers to teach English.
Table 5.6: Percentages of pupils whose teachers indicated that they felt very confident in a number of areas of teaching English reading, by grade level
2ndclass 6thclassTeaching high achievers in reading 57 58Teaching reading skills in other subject areas (e.g., science) 45 48Working with lower-achieving pupils in reading 38 40Using computers to teach English 18 25
A majority of pupils in Second (61%) and Sixth class (75%) were taught by teachers who were very confident in their ability to teach mathematical vocabulary, while 56% of pupils in Sixth class were taught by teachers who felt very confident in their ability to teach real-life problem-solving in mathematics (Table 5.7). Close to half of pupils were taught by teachers very confident of their ability to teach both higher- and lower-achieving pupils in mathematics. Despite the prominence given to calculators in the PSMC for senior classes, just 39% of pupils were taught by teachers who were very
confident in using calculators to teach mathematics. As with reading, the use of computers was the teaching area least likely to elicit very confident responses at either grade level.
Factor analyses of teachers’ responses identified two underlying factors at Second class level (confidence in teaching mathematics and reading, confidence in teaching with technology) and three factors from the more detailed Sixth class set of questions (confidence in teaching mathematics, confidence in teaching reading, and confidence in teaching with technology).
The School, the Classroom and Achievement
59

Table 5.7: Percentages of pupils whose teachers indicated that they felt very confident in a number of areas of maths teaching, by grade level
2ndclass 6thclassTeaching mathematical vocabulary 61 75Teaching real-life problem solving – 56Extending higher-achieving pupils in mathematics 46 55Working with lower-achieving pupils in mathematics 40 51Integrating mathematics into other subjects 39 51Using calculators to teach mathematics – 39Developing higher-level mathematics thinking skills – 35Using computers to teach mathematics 20 19
Teaching and Learning Practices
This section looks at a number of aspects of teaching and learning in English and mathematics in the classroom including: lesson planning, time allocations, grouping practices, and teaching methods.
Planning
Teachers were asked to identify the three main resources used to plan the previous week’s lessons in English and mathematics. As can be seen from Table 5.8, which shows the five most popular resources used, there was considerable overlap across domains. By far the most popular resource for planning was the main textbook in use in the classroom, used by teachers of between 74% (Second class, English) and 94% (Sixth class, mathematics) of pupils. Next most popular were ICTs or material from the internet, followed by curriculum content and curriculum teacher guidelines. Books other than the main textbook were widely used to plan English lessons, but were less frequently used to plan mathematics lessons. Real-life materials (e.g., newspapers for English; timetables for mathematics) were also a relatively common planning resource.
Table 5.8: Percentages of pupils in Second and Sixth classes whose teachers indicated that they used particular resources for planning English and mathematics lessons in the week prior to administration
of the tests2ndclass 6thclass
English Maths English MathsMain textbook 77 82 74 94ICTs*/internet material 40 28 62 33Curriculum/teacher guidelines 38 47 22 37Other texts/books/novels 31 8 43 18Real-life materials (newspapers, timetables) 14 19 35 17
* Excluding interactive whiteboards
Time Allocated to English and Mathematics
The curriculum guidelines specify that a minimum of 3 hours weekly be allocated to teaching mathematics, and 4 hours to teaching English (or the main language of instruction). In NA 2009, the average weekly time allocated to mathematics lessons was 3 hours 45 minutes in Second class and 4 hours 18 minutes in Sixth class (see Figure 5.2 for average number of minutes per day allocated to each). For English, 4 hours 25 minutes was allocated at Second class, and 4 hours 35 minutes at Sixth class. Approximately one quarter of pupils (Second and Sixth) did not receive the minimum allocated time for English lessons, compared to fewer than 6% for mathematics.
The 2009 National Assessments of Mathematics and English Reading
60

Figure 5.2: Mean number of minutes per day allocated to teaching English and mathematics, as reported by Second and Sixth class teachers, and minimum specified in the curriculum (PSC)
0 10 20 30 40 50 60
Maths
English
6th Class
2nd Class
PSC
52
45
36
55
53
48
Organisation and Grouping
Teachers were presented with a list of seven methods for organising lessons, and asked to indicate which were used for most lessons, some lessons or which were rarely or never used. Figure 5.3 presents the percentages of Sixth class pupils whose teachers indicated that a particular approach was used for most lessons. (More detailed data for both grades are available in the e-appendix.) As can be seen, a large majority of pupils were taught by teachers who typically used a whole class approach in English and mathematics lessons, while close to two-thirds experienced independent individual work in most lessons. Small group activities (in pairs, mixed ability groups, or similar ability groups) were a feature of most lessons for a minority of pupils – less than 9% for either domain – while no more than 7% experienced team teaching in most lessons.
Figure 5.3: Percentage of Sixth class pupils whose teachers reported organising lessons in various ways for most lessons
0 20 40 60 80 100
Team teaching– support teacher
Team teaching– class teacher
IndependentWork
Small Group– pairs
Small Group– mixed ability
Small Group– similar ability
Whole Class
Maths
Reading
English Teaching Methods
Teachers of were asked about their methods of teaching English, including the emphasis they placed on specific reading skills; on the particular kinds of activities they engaged pupils in before, during, and after reading; and on the kinds of writing activities in which they engaged Sixth class pupils.
The vast majority of both Second and Sixth class pupils were taught by teachers who frequently (i.e. most days or once or twice a week) addressed a range of skills during English lessons, ranging from 88% of pupils in Second class whose teachers regularly taught phonemic awareness to 99%
The School, the Classroom and Achievement
61
Guidelines versus Practice In most schools, lesson times significantly exceeded the minimum specified in the curriculum guidelines, with the gap largest at Sixth class.
The guidelines also propose considerably more time for English than maths. In practice, the time allocated to each is quite similar – e.g., time spent in Sixth class English lessons exceeds maths time by only 6%.
Differences by grade At Second class, a broadly similar pattern to that at Sixth emerged. In most English and maths lessons, independent work and whole class teaching dominated.
The main difference of note was that slightly greater percentages of Second class pupils experienced small group work, ranging from 9% (English, mixed ability groups) to 15% (maths, similar ability groups).

of pupils for oral reading, and from 65% of pupils in Sixth class whose teachers regularly taught reference skills to 93% of pupils whose teachers regularly developed comprehension strategies (Table 5.9). However, regular teaching of study strategies and interpretation of diagrammatic texts was less common (53% and 27% of Sixth class pupils, respectively).
Table 5.9: Percentages of pupils whose teachers indicated that they provided at least weekly instruction on specific skills during English classes, by grade level
TeachingArea 2ndclass 6thclassOral reading 99 –Comprehension strategies 94 93Phonics 93 –Silent reading 92 93Word attack skills 90 72Phonemic awareness 88 –Reference skills – 65Study strategies – 53Diagrammatic texts (e.g., maps, charts) – 27
Teachers were also asked how frequently – most days, once or twice a week, once or twice a month, or rarely or never – they engaged pupils in particular activities to prepare them for reading, to check their comprehension during reading, and to obtain responses to what they had read. The results show that a very high proportion of pupils in both Second and Sixth class were taught by teachers who reported engaging pupils most days or once or twice a week in all of the activities listed (Table 5.10). Exceptions were activities involving the dramatisation of stories (just 16% of pupils in Second class and 12% in Sixth class were taught by teachers who engaged them in this activity every week), and the discussion of different genres (44% of pupils in Second class and 55% of pupils in Sixth class).
Table 5.10: Percentages of pupils whose teachers indicated that various reading activities were used at least weekly, by grade level.
2ndclass 6thclass
Preparingforreading
Identify new words and their meanings 98 99Discuss prior knowledge 88 93Predict what might happen in a text 92 88Set goals for reading 60 70
ComprehensionduringreadingRelate predictions to the text 89 88Self-manage reading comprehension 76 81Make generalizations and inferences 71 86
Responsetoreading
Discuss main points of the text 98 99Relate own experience to the text 86 90Summarise stories / texts orally 78 85Discuss characteristics of difference genres 44 55Dramatise stories 16 12
Writing in response to reading was the most common form of writing engaged in by Sixth class pupils, with teacher reports indicating that 88% of pupils engaged in this activity at least once a week. Sixty-five percent of pupils were taught by teachers who said they engaged pupils in creative writing at least once a week, 57% by teachers who said they engaged them in expository writing at least once a week, and 38% by teachers who said they engaged them in reading other pupils’ writing at least once a week.
The 2009 National Assessments of Mathematics and English Reading
62
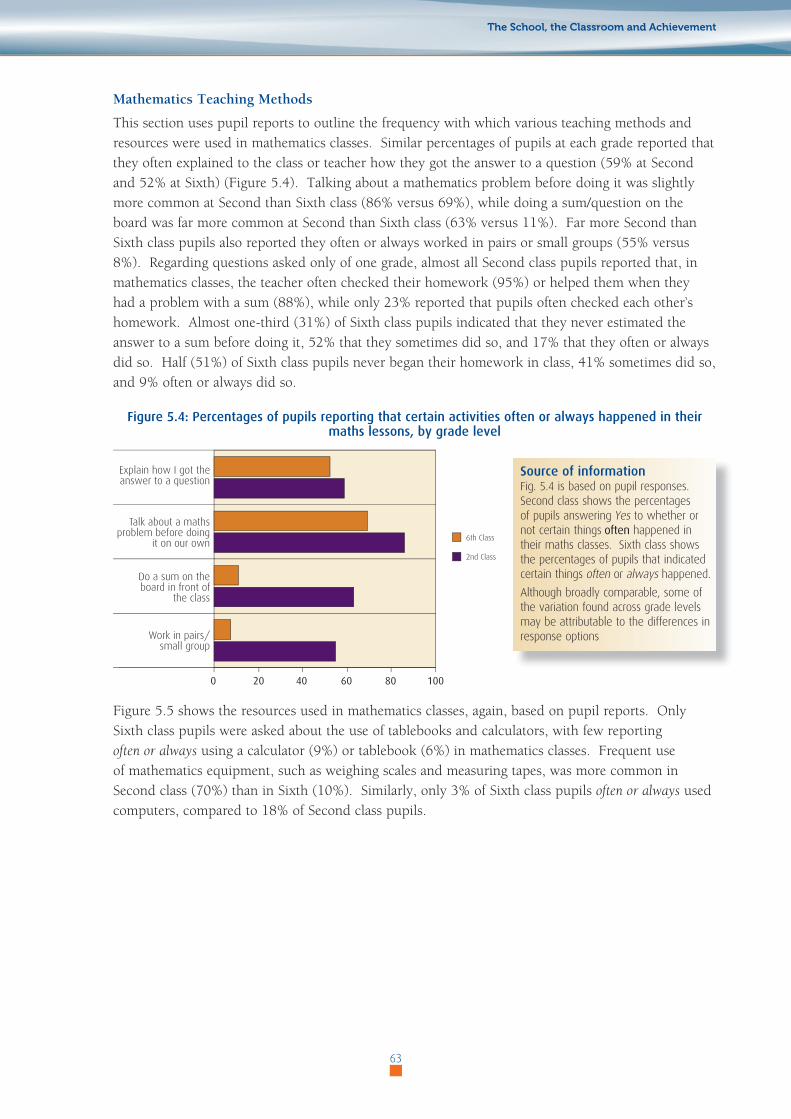
Mathematics Teaching Methods
This section uses pupil reports to outline the frequency with which various teaching methods and resources were used in mathematics classes. Similar percentages of pupils at each grade reported that they often explained to the class or teacher how they got the answer to a question (59% at Second and 52% at Sixth) (Figure 5.4). Talking about a mathematics problem before doing it was slightly more common at Second than Sixth class (86% versus 69%), while doing a sum/question on the board was far more common at Second than Sixth class (63% versus 11%). Far more Second than Sixth class pupils also reported they often or always worked in pairs or small groups (55% versus 8%). Regarding questions asked only of one grade, almost all Second class pupils reported that, in mathematics classes, the teacher often checked their homework (95%) or helped them when they had a problem with a sum (88%), while only 23% reported that pupils often checked each other’s homework. Almost one-third (31%) of Sixth class pupils indicated that they never estimated the answer to a sum before doing it, 52% that they sometimes did so, and 17% that they often or always did so. Half (51%) of Sixth class pupils never began their homework in class, 41% sometimes did so, and 9% often or always did so.
Figure 5.4: Percentages of pupils reporting that certain activities often or always happened in their maths lessons, by grade level
0 20 40 60 80 100
Explain how I got theanswer to a question
Talk about a mathsproblem before doing
it on our own
Do a sum on theboard in front of
the class
Work in pairs/small group
6th Class
2nd Class
Figure 5.5 shows the resources used in mathematics classes, again, based on pupil reports. Only Sixth class pupils were asked about the use of tablebooks and calculators, with few reporting often or always using a calculator (9%) or tablebook (6%) in mathematics classes. Frequent use of mathematics equipment, such as weighing scales and measuring tapes, was more common in Second class (70%) than in Sixth (10%). Similarly, only 3% of Sixth class pupils often or always used computers, compared to 18% of Second class pupils.
The School, the Classroom and Achievement
63
Source of information Fig. 5.4 is based on pupil responses. Second class shows the percentages of pupils answering Yes to whether or not certain things often happened in their maths classes. Sixth class shows the percentages of pupils that indicated certain things often or always happened.
Although broadly comparable, some of the variation found across grade levels may be attributable to the differences in response options

Figure 5.5: Percentages of pupils reporting that various resources were often or always used in maths classes, by grade level
0 20 40 60 80 100
Calculator
Tablebook
Computer
MathsEquipment
6th Class
2nd Class
Resources for Teaching and Learning
This section summarises principal and class teacher reports on the main resources and materials used in English and mathematics lessons, the size and composition of classroom and school libraries, and the availability and use of technology in schools and classrooms.
Subject-Specific Resources and Materials
Published reading schemes and workbooks/worksheets were by far the most widely used materials in English classes (Table 5.11). Most pupils (92% at Second; 84% at Sixth class) were taught by teachers who used a published reading scheme at least once a week. The figures for use of workbooks were similar. Children’s literature was also used extensively, with 73% of pupils in Second class and 67% of pupils in Sixth class using it on an at least weekly basis. Reference materials and informational texts were used at least a few times a week by roughly one-third of Second class pupils, and by close to half of Sixth class pupils. Real-life documents and digital texts were regularly used by roughly one-third of Sixth class pupils, but by only a small minority of those in Second class.
Table 5.11: Percentages of pupils whose teachers indicated that they used specified materials at least once a week in English classes, by grade level
2ndclass 6thclassMostdays Weekly Mostdays Weekly
Published reading schemes/materials 70 22 56 28Workbooks or worksheets 49 45 33 53Children’s literature (not part of reading schemes) 35 38 30 37
Informational texts 7 31 4 43Reference materials (e.g., encyclopaedia) 4 28 8 36Digital texts (e.g., on web pages) 7 18 3 33‘Real-life’ texts or documents, e.g., newspaper articles 1 12 4 28
Table 5.12 shows that, as with English, textbooks and workbooks/worksheets were by far the most widely used materials in mathematics classes. Almost all pupils (98% and 99%) in Second and Sixth class were taught by teachers who said they used a textbook on most days or at least once or twice a
The 2009 National Assessments of Mathematics and English Reading
64
Traditional methodsThe curriculum provides for the use of calculators, computers and maths equipment at Sixth class, yet large percentages of pupils reported never using them in maths lessons (calculators: 20%, maths equipment: 35%, computers: 85%). Also, 42% of Sixth class pupils reported never engaging in small group work during maths lessons.
These data suggest that whole class, textbook-based teaching still predominates in Sixth class maths lessons.

week. The corresponding figures for use of workbooks are 95% and 86% respectively. Tablebooks were also used extensively in Second class (80% of pupils used them at least once a week) but were less frequently used by Sixth class pupils (38% used them at least once a week).
Most (69%) Second class pupils were taught by teachers who used manipulatives at least once a week, compared to 10% at Sixth class. Teachers of the majority of Second class pupils used mathematical games and real-life materials at least once a week (60% in each case) whereas the corresponding figures for Sixth class were 25% and 43%. Thus, while the predominant resources for teaching mathematics in Second and Sixth classes are textbooks and workbooks, other materials (such as manipulatives and mathematics games) are regularly used in Second classes, but to a lesser extent in Sixth classes.
Table 5.12: Percentages of pupils whose teachers indicated that they used specified materials at least once a week in mathematics classes, by grade level
2ndclass 6thclassMostdays Weekly Mostdays Weekly
Textbooks 82 16 89 10Workbooks / worksheets 65 30 45 41Tablebooks 42 38 9 29Manipulatives (e.g., blocks) 25 44 0 10Real-life materials (e.g., timetables, weights) 21 39 10 33Mathematics games 18 42 6 19
Library Facilities
Based on principal reports, approximately 90% of pupils (Second and Sixth) were in schools in which there was a library in every classroom, while 18% were in schools with a room that was used exclusively as a school library (Table 5.13). In addition, between one-fifth (Second) and one-quarter (Sixth) were in schools in which a room was used as a school library and for other purposes. Two-thirds of pupils attended schools where there was a post-holder with responsibility for libraries.
Table 5.13: Percentages of pupils in schools with various library facilities, by grade level2ndclass 6thclass
Classroom libraryIn every classroom 92 89In some classrooms 8 10
School library roomUsed only as library 18 18Shared purpose room 22 25
Staffing Post of responsibility for library duties 65 66
There was considerable variation in the total number of library books per school – ranging from 100 to 12,000. On average, there were slightly more than 13 books per pupil (Table 5.14). The books to pupil ratio was moderately negatively correlated with school size (r= –.31 in Sixth class, and –.32 in Second), indicating that pupils in bigger schools had a poorer ratio. Just under 5% of Second and Sixth class pupils were in schools where there were no more than two books per pupil, while, at the other extreme, roughly 5% of pupils enjoyed book-to-pupil ratios in excess of 29. In schools with pupils whose first language was neither English nor Irish, over half had no library books in another language, while, of those that did, there was an average of two books per pupil. Just under two new titles per pupil were added to school or class libraries in 2008-09.
The School, the Classroom and Achievement
65
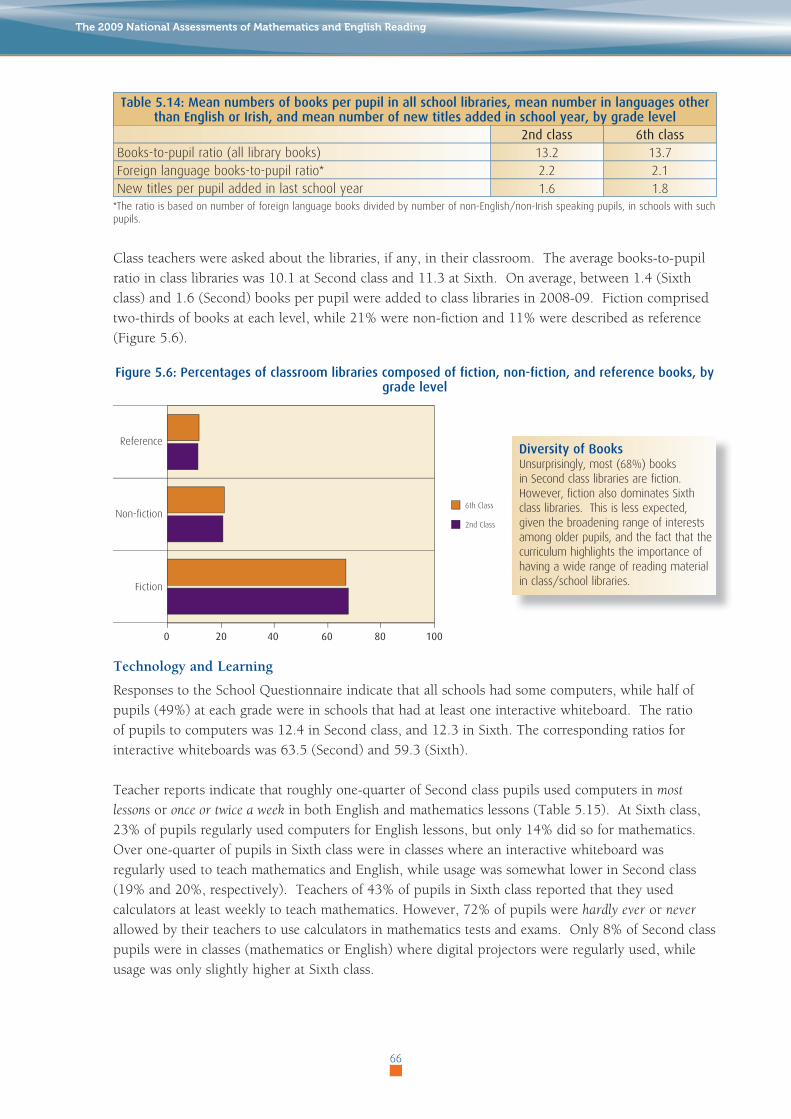
Table 5.14: Mean numbers of books per pupil in all school libraries, mean number in languages other than English or Irish, and mean number of new titles added in school year, by grade level
2ndclass 6thclassBooks-to-pupil ratio (all library books) 13.2 13.7Foreign language books-to-pupil ratio* 2.2 2.1New titles per pupil added in last school year 1.6 1.8
*The ratio is based on number of foreign language books divided by number of non-English/non-Irish speaking pupils, in schools with such pupils.
Class teachers were asked about the libraries, if any, in their classroom. The average books-to-pupil ratio in class libraries was 10.1 at Second class and 11.3 at Sixth. On average, between 1.4 (Sixth class) and 1.6 (Second) books per pupil were added to class libraries in 2008-09. Fiction comprised two-thirds of books at each level, while 21% were non-fiction and 11% were described as reference (Figure 5.6).
Figure 5.6: Percentages of classroom libraries composed of fiction, non-fiction, and reference books, by grade level
0 20 40 60 80 100
Reference
Non-fiction
Fiction
6th Class
2nd Class
Technology and Learning
Responses to the School Questionnaire indicate that all schools had some computers, while half of pupils (49%) at each grade were in schools that had at least one interactive whiteboard. The ratio of pupils to computers was 12.4 in Second class, and 12.3 in Sixth. The corresponding ratios for interactive whiteboards was 63.5 (Second) and 59.3 (Sixth).
Teacher reports indicate that roughly one-quarter of Second class pupils used computers in most
lessons or once or twice a week in both English and mathematics lessons (Table 5.15). At Sixth class, 23% of pupils regularly used computers for English lessons, but only 14% did so for mathematics. Over one-quarter of pupils in Sixth class were in classes where an interactive whiteboard was regularly used to teach mathematics and English, while usage was somewhat lower in Second class (19% and 20%, respectively). Teachers of 43% of pupils in Sixth class reported that they used calculators at least weekly to teach mathematics. However, 72% of pupils were hardly ever or never allowed by their teachers to use calculators in mathematics tests and exams. Only 8% of Second class pupils were in classes (mathematics or English) where digital projectors were regularly used, while usage was only slightly higher at Sixth class.
The 2009 National Assessments of Mathematics and English Reading
66
Diversity of Books Unsurprisingly, most (68%) books in Second class libraries are fiction. However, fiction also dominates Sixth class libraries. This is less expected, given the broadening range of interests among older pupils, and the fact that the curriculum highlights the importance of having a wide range of reading material in class/school libraries.

Table 5.15: Percentages of pupils using various types of technology in most lessons or once or twice a week in English / mathematics lessons, by grade level
2ndclass 6thclassEnglish Maths English Maths
Computers 26 24 23 14Interactive whiteboard 20 19 28 26Calculator N/A N/A N/A 43Digital projector 8 8 15 11
The frequency with which teachers incorporated computers into lessons was unrelated to whether the computers were in the classroom or in a central room. In contrast, the frequency with which interactive whiteboards were used was closely linked to whether or not they were located in the classroom or in another room. Teachers of roughly half of pupils with an interactive whiteboard in their classroom used them in most or all lessons. In contrast, among teachers who had access to a whiteboard (not in their classroom), none used the resource for most lessons, and a majority rarely or
never used it.
Sixth class teachers were asked a series of questions about the use of calculators and computers in mathematics lessons. Half of pupils were in classes where calculators were used at least a few times a week to check answers (Table 5.16). Other frequent applications included routine calculations (35%) and developing estimation skills (32%). In terms of activities for which computers were used at least weekly, practicing mathematics facts and basic skills was the most common (22% of pupils), followed by learning mathematics concepts (16%). Only 6% of pupils were in classes where computers were used on a regular basis to learn how to handle data, and only 5% used computers weekly for non-routine problem-solving.
Table 5.16: Percentages of pupils whose teachers reported that they used calculators and computers in most lessons or once or twice a week for varying purposes, Sixth class
Calculator ComputerCheck answers 50 Practice mathematical facts & basic skills 22Perform routine calculations 35 Learn mathematical concepts 16Develop estimation skills 32 Handle data 6Develop number concepts (e.g., number sequences) 21 Non-routine problem-solving/
higher-level thinking 5
Assessment
Teacher reports indicated that most pupils had been, or would be, tested once on standardised tests of reading and mathematics in the 2008-09 school year (Table 5.17). Between 11% and 17% were to be tested twice, and 3% or fewer were to be tested more frequently. At Second class, teachers of 5% of pupils did not anticipate any standardised tests would be administered, while at Sixth, between 10% (mathematics test) and 12% (reading) would not be tested. Data from principals (see e-appendix) suggest that at each grade, most pupils completed standardised tests of English and mathematics on an annual basis. First class mathematics was least likely to be assessed (13% of such pupils did not complete any standardised test of mathematics).
The School, the Classroom and Achievement
67

Table 5.17: Teacher reports on frequency of administering standardised tests in 2008-09 school year, by grade level and subject (percentages of pupils)
2ndclass 6thclassReading Maths Reading Maths
Once 75 80 72 72Twice 17 11 15 15More than Twice 3 3 2 3Not Assessed 5 5 12 10
Teachers were also asked about the use of non-standardised assessments. Teacher questioning was the most common form, with teachers of almost all pupils reporting that they used this form of assessment at least monthly (Table 5.18). Error analysis in reading was reportedly used at least monthly by teachers of three-quarters of pupils in Second class, while error analysis in mathematics was used by teachers of three-fifths of pupils at this class level, with the same frequency. Teacher-made tests of reading and maths were administered to over half of all pupils on an at least monthly basis, rising to 79% of pupils for Sixth class mathematics. Two other methods of assessment – teacher-made checklists and documented observations – were used at least monthly by teachers of about half of pupils. Other assessment methods were reported as used less frequently.
Table 5.18: Percentages of pupils whose teachers reported administering non-standardised assessments at least monthly, by subject
2ndclass 6thclassReading Maths Reading Maths
Teacher questioning 99 99 96 97Error analysis 76 60 64Teacher-made tests 57 70 59 79Teacher-made checklists 50 55 48 52Documented observations 46 46 48 47Pupil self-assessment 37 37Portfolios 21 16 16 11Curriculum profiles 12 10 13 7Published progress tests/checklists 12 21 15 18Diagnostic test 6 8 9 7Reflective journals 7 17 8
Roughly 90% of pupils attended schools whose principal teacher agreed that aggregated standardised test results in English reading and maths were discussed at staff meetings, and used to monitor school-level performance (Table 5.19). However, less than three-quarters of pupils were in schools where aggregated results were used to establish teaching and learning targets. The most common use of test results at the individual level was to identify pupils with learning difficulties. All pupils attended schools where the principal reported that individual English test results were used to identify pupils with learning difficulties, while almost all (93% to 96% of pupils) were in schools where mathematics test results were used in this way. Principals’ responses also indicate that using test results to provide feedback to parents was widespread (in excess of 90% of pupils attended schools where this happened). In contrast, using standardised tests to provide feedback to pupils occurred in only a minority of instances.
The 2009 National Assessments of Mathematics and English Reading
68

Table 5.19: Percentages of pupils whose principal teachers report on varying uses of standardised test results (either aggregated or individual), by domain and grade level
2ndclass 6thclassEnglish Maths English Maths
Aggregated results
Discussed at staff meetings 92 91 92 92Used to monitor school-level performance 94 88 93 90
Used to establish targets 74 73 74 73
Individual results
Used to identify pupils with learning difficulties 100 93 100 96
Used for feedback to parents 98 91 98 94Used for feedback to pupils 34 27 30 27
Additional Supports for Learning
This section summarises the extent to which there was a perceived need for additional support among the schools that participated in the study, and describes how such support was provided. As noted earlier, roughly 10% of schools’ enrolment spoke a language other than Irish or English. However, not all such pupils received assistance with the language of instruction. Principals reported that an average of 6% of pupils were in receipt of language support, with an additional 1% in receipt of language support and learning support/resource teaching (LS/RT) (Table 5.20). Principals estimated that approximately 8% of total enrolment would score below the 12th percentile on standardised tests of English or mathematics (i.e., met the main DES criterion for receipt of additional support). However, for English, the percentages of pupils in receipt of additional support were roughly double the percentages estimated as at or below the 12th percentile. In contrast, for mathematics, the percentages in receipt of additional support were similar to the percentages estimated as in need of support. Included in the LS/RT percentages were approximately 3% of pupils with an assessed high-incidence specific learning disability – e.g., dyslexia – and a further 3% with an assessed low-incidence specific learning disability – e.g., a hearing impairment. As a general rule, schools with high DEIS scores tended to have the highest percent of pupils in need/receipt of additional support (e.g., 33% of the enrolment in DEIS Urban Band 1 schools were in receipt of LS/RT for English).
Table 5.20: Mean school-level percentages of pupils in need/ receipt of various forms of additional support, by grade level
%ofpupilsintheschool 2ndclass 6thclass
Estimated as below the 12th percentileMaths 8 9English 8 9
In receipt of
language support only 6 6language support + LS/RT 1 1LS/RT: high-incidence SLD 3 3LS/RT: low-incidence SLD 3 3
Total in receipt ofLS/RT: Maths 10 10LS/RT: English 14 15
As well as providing additional support to pupils, schools provided support through programmes directed at parents. Sixty-nine percent of the Second class pupils who participated in NA 2009 were enrolled in schools where parents were offered a programme to assist their child with reading, while 36% were in schools where a similar programme for mathematics was offered (Table 5.21). For Sixth class pupils, the percentages were 65 (for reading) and 29 (for mathematics). Where programmes were offered, the most popular types were paired or shared reading and Maths 4 Fun.
The School, the Classroom and Achievement
69
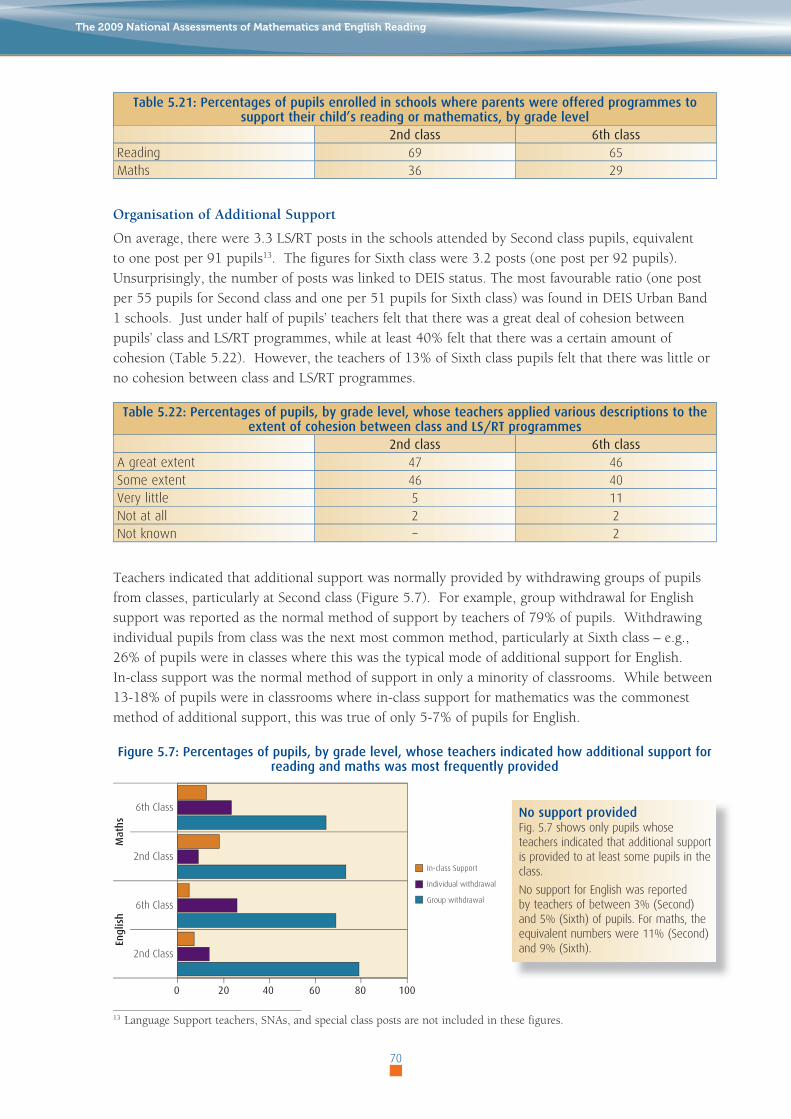
Table 5.21: Percentages of pupils enrolled in schools where parents were offered programmes to support their child’s reading or mathematics, by grade level
2ndclass 6thclassReading 69 65Maths 36 29
Organisation of Additional Support
On average, there were 3.3 LS/RT posts in the schools attended by Second class pupils, equivalent to one post per 91 pupils13. The figures for Sixth class were 3.2 posts (one post per 92 pupils). Unsurprisingly, the number of posts was linked to DEIS status. The most favourable ratio (one post per 55 pupils for Second class and one per 51 pupils for Sixth class) was found in DEIS Urban Band 1 schools. Just under half of pupils’ teachers felt that there was a great deal of cohesion between pupils’ class and LS/RT programmes, while at least 40% felt that there was a certain amount of cohesion (Table 5.22). However, the teachers of 13% of Sixth class pupils felt that there was little or no cohesion between class and LS/RT programmes.
Table 5.22: Percentages of pupils, by grade level, whose teachers applied various descriptions to the extent of cohesion between class and LS/RT programmes
2ndclass 6thclassA great extent 47 46Some extent 46 40Very little 5 11Not at all 2 2Not known – 2
Teachers indicated that additional support was normally provided by withdrawing groups of pupils from classes, particularly at Second class (Figure 5.7). For example, group withdrawal for English support was reported as the normal method of support by teachers of 79% of pupils. Withdrawing individual pupils from class was the next most common method, particularly at Sixth class – e.g., 26% of pupils were in classes where this was the typical mode of additional support for English. In-class support was the normal method of support in only a minority of classrooms. While between 13-18% of pupils were in classrooms where in-class support for mathematics was the commonest method of additional support, this was true of only 5-7% of pupils for English.
Figure 5.7: Percentages of pupils, by grade level, whose teachers indicated how additional support for reading and maths was most frequently provided
0 20 40 60 80 100
6th Class
Mat
hsEn
glis
h
2nd Class
6th Class
2nd Class
In-class Support
Individual withdrawal
Group withdrawal
13 Language Support teachers, SNAs, and special class posts are not included in these figures.
The 2009 National Assessments of Mathematics and English Reading
70
No support providedFig. 5.7 shows only pupils whose teachers indicated that additional support is provided to at least some pupils in the class.
No support for English was reported by teachers of between 3% (Second) and 5% (Sixth) of pupils. For maths, the equivalent numbers were 11% (Second) and 9% (Sixth).

Principals’ Views of the Key Issues
As part of the School Questionnaire, principals were asked to indicate what they perceived to be the three most serious challenges experienced by their school in providing for the teaching and learning of English and of mathematics. As the questions were open-ended, principals’ responses have been grouped into broad themes. Table 5.23 presents the issues raised that are common to both reading and mathematics, while Table 5.24 presents those specific to mathematics and to reading.
The most commonly cited challenge was large class sizes – raised as an issue by principals of least one-third of pupils in NA 2009 (Table 5.23). Next was lack of home support, raised as a reading challenge by principals of roughly 40% of pupils, and as a challenge to mathematics teaching by 24% to 29% of pupils’ principals. This category includes lack of home educational resources, lack of exposure to numbers, poor parental monitoring or support of homework, and, parents using “old maths”. The third most commonly raised challenge was lack of subject-specific resources. In the case of reading, this typically meant a shortage of books, or specific software for weaker readers. For mathematics, lack of resources was cited by over one-third of pupils’ principals. While the category includes comments related to specific resources, it also encompasses general complaints about the high cost of mathematics equipment, and about the lack of suitable storage space.
The next broad area raised as a challenge to teaching was related to time shortages (including too much content to cover in the subject itself, or not enough time for the subject due to curriculum overload). Dealing with pupils from non-English speaking families was cited as a challenge to teaching English by principals of over 20% of pupils, but was far less frequently cited as a challenge for mathematics teaching. Other challenges raised by a large number of principals included dealing with pupils of different ability levels, pupil attitudes and behaviours (including indiscipline, poor motivation and concentration, absenteeism, and, specific to mathematics, lack of confidence about or interest in mathematics), and dealing with multigrade classes.
Table 5.23: The main challenges for the teaching of English and mathematics, as identified by principals (themes common to both subjects)
Reading Maths2ndclass 6thclass 2ndclass 6thclass
Large class size / pupil:teacher ratio 38 34 40 38Lack of home support 40 39 29 24Lack of specific resources 25 27 36 38Subject / curriculum overload / time shortages 19 19 22 25
Pupils from non-English speaking families 23 21 13 11Dealing with different ability levels 18 20 15 19Pupil behaviour or attitudes 15 17 19 19Multigrade classes 14 11 16 12Additional support, including LS/RT 12 16 18 19Teacher-related 6 8 15 15
A perceived lack of additional support was raised as a challenge for mathematics slightly more frequently than for English. For English, the comments typically referred to cutbacks in learning support, or to the general allocation in an all-girls school. For mathematics, the comments referred to general cutbacks, but also to the prioritisation of reading as problematic for accessing mathematics support. How teachers taught reading was raised by a small number of principals, with comments
The School, the Classroom and Achievement
71
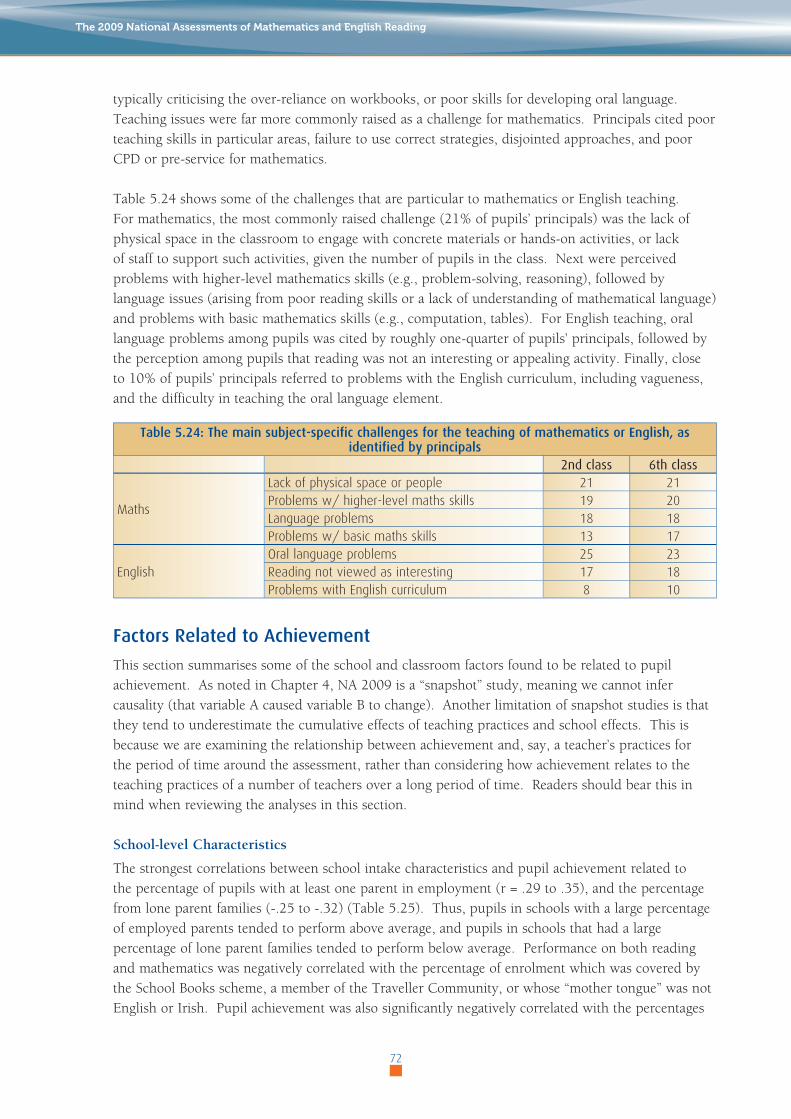
typically criticising the over-reliance on workbooks, or poor skills for developing oral language. Teaching issues were far more commonly raised as a challenge for mathematics. Principals cited poor teaching skills in particular areas, failure to use correct strategies, disjointed approaches, and poor CPD or pre-service for mathematics.
Table 5.24 shows some of the challenges that are particular to mathematics or English teaching. For mathematics, the most commonly raised challenge (21% of pupils’ principals) was the lack of physical space in the classroom to engage with concrete materials or hands-on activities, or lack of staff to support such activities, given the number of pupils in the class. Next were perceived problems with higher-level mathematics skills (e.g., problem-solving, reasoning), followed by language issues (arising from poor reading skills or a lack of understanding of mathematical language) and problems with basic mathematics skills (e.g., computation, tables). For English teaching, oral language problems among pupils was cited by roughly one-quarter of pupils’ principals, followed by the perception among pupils that reading was not an interesting or appealing activity. Finally, close to 10% of pupils’ principals referred to problems with the English curriculum, including vagueness, and the difficulty in teaching the oral language element.
Table 5.24: The main subject-specific challenges for the teaching of mathematics or English, as identified by principals
2ndclass 6thclass
Maths
Lack of physical space or people 21 21Problems w/ higher-level maths skills 19 20Language problems 18 18Problems w/ basic maths skills 13 17
EnglishOral language problems 25 23Reading not viewed as interesting 17 18Problems with English curriculum 8 10
Factors Related to Achievement
This section summarises some of the school and classroom factors found to be related to pupil achievement. As noted in Chapter 4, NA 2009 is a “snapshot” study, meaning we cannot infer causality (that variable A caused variable B to change). Another limitation of snapshot studies is that they tend to underestimate the cumulative effects of teaching practices and school effects. This is because we are examining the relationship between achievement and, say, a teacher’s practices for the period of time around the assessment, rather than considering how achievement relates to the teaching practices of a number of teachers over a long period of time. Readers should bear this in mind when reviewing the analyses in this section.
School-level Characteristics
The strongest correlations between school intake characteristics and pupil achievement related to the percentage of pupils with at least one parent in employment (r = .29 to .35), and the percentage from lone parent families (-.25 to -.32) (Table 5.25). Thus, pupils in schools with a large percentage of employed parents tended to perform above average, and pupils in schools that had a large percentage of lone parent families tended to perform below average. Performance on both reading and mathematics was negatively correlated with the percentage of enrolment which was covered by the School Books scheme, a member of the Traveller Community, or whose “mother tongue” was not English or Irish. Pupil achievement was also significantly negatively correlated with the percentages
The 2009 National Assessments of Mathematics and English Reading
72
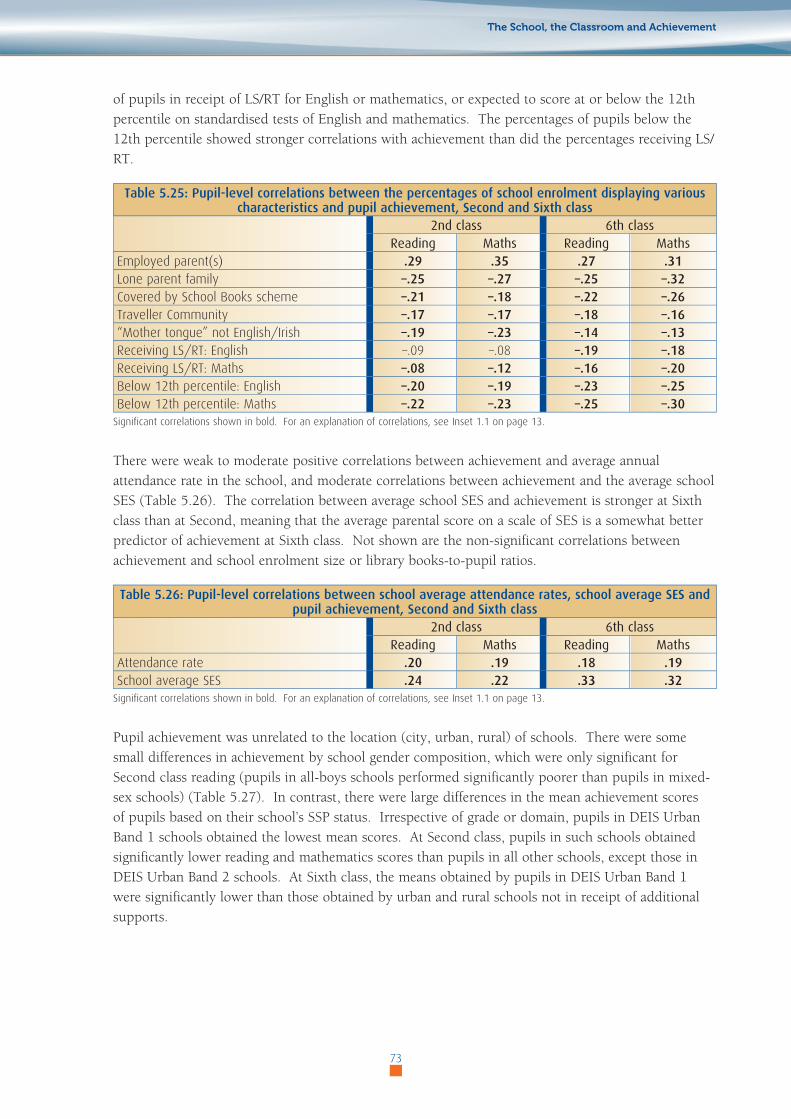
of pupils in receipt of LS/RT for English or mathematics, or expected to score at or below the 12th percentile on standardised tests of English and mathematics. The percentages of pupils below the 12th percentile showed stronger correlations with achievement than did the percentages receiving LS/RT.
Table 5.25: Pupil-level correlations between the percentages of school enrolment displaying various characteristics and pupil achievement, Second and Sixth class
2ndclass 6thclassReading Maths Reading Maths
Employed parent(s) .29 .35 .27 .31Lone parent family –.25 –.27 –.25 –.32Covered by School Books scheme –.21 –.18 –.22 –.26Traveller Community –.17 –.17 –.18 –.16“Mother tongue” not English/Irish –.19 –.23 –.14 –.13Receiving LS/RT: English –.09 –.08 –.19 –.18Receiving LS/RT: Maths –.08 –.12 –.16 –.20Below 12th percentile: English –.20 –.19 –.23 –.25Below 12th percentile: Maths –.22 –.23 –.25 –.30
Significant correlations shown in bold. For an explanation of correlations, see Inset 1.1 on page 13.
There were weak to moderate positive correlations between achievement and average annual attendance rate in the school, and moderate correlations between achievement and the average school SES (Table 5.26). The correlation between average school SES and achievement is stronger at Sixth class than at Second, meaning that the average parental score on a scale of SES is a somewhat better predictor of achievement at Sixth class. Not shown are the non-significant correlations between achievement and school enrolment size or library books-to-pupil ratios.
Table 5.26: Pupil-level correlations between school average attendance rates, school average SES and pupil achievement, Second and Sixth class
2ndclass 6thclassReading Maths Reading Maths
Attendance rate .20 .19 .18 .19School average SES .24 .22 .33 .32
Significant correlations shown in bold. For an explanation of correlations, see Inset 1.1 on page 13.
Pupil achievement was unrelated to the location (city, urban, rural) of schools. There were some small differences in achievement by school gender composition, which were only significant for Second class reading (pupils in all-boys schools performed significantly poorer than pupils in mixed-sex schools) (Table 5.27). In contrast, there were large differences in the mean achievement scores of pupils based on their school’s SSP status. Irrespective of grade or domain, pupils in DEIS Urban Band 1 schools obtained the lowest mean scores. At Second class, pupils in such schools obtained significantly lower reading and mathematics scores than pupils in all other schools, except those in DEIS Urban Band 2 schools. At Sixth class, the means obtained by pupils in DEIS Urban Band 1 were significantly lower than those obtained by urban and rural schools not in receipt of additional supports.
The School, the Classroom and Achievement
73
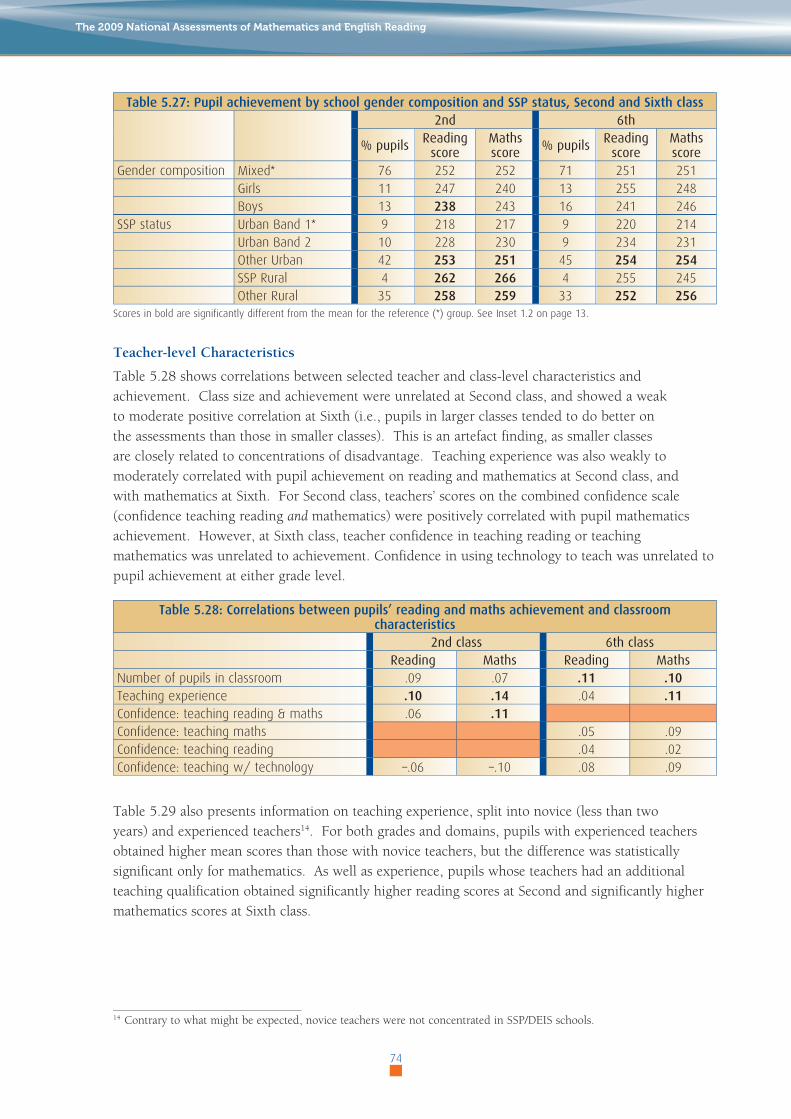
Table 5.27: Pupil achievement by school gender composition and SSP status, Second and Sixth class2nd 6th
%pupils Readingscore
Mathsscore %pupils Reading
scoreMathsscore
Gender composition Mixed* 76 252 252 71 251 251Girls 11 247 240 13 255 248Boys 13 238 243 16 241 246
SSP status Urban Band 1* 9 218 217 9 220 214Urban Band 2 10 228 230 9 234 231Other Urban 42 253 251 45 254 254SSP Rural 4 262 266 4 255 245Other Rural 35 258 259 33 252 256
Scores in bold are significantly different from the mean for the reference (*) group. See Inset 1.2 on page 13.
Teacher-level Characteristics
Table 5.28 shows correlations between selected teacher and class-level characteristics and achievement. Class size and achievement were unrelated at Second class, and showed a weak to moderate positive correlation at Sixth (i.e., pupils in larger classes tended to do better on the assessments than those in smaller classes). This is an artefact finding, as smaller classes are closely related to concentrations of disadvantage. Teaching experience was also weakly to moderately correlated with pupil achievement on reading and mathematics at Second class, and with mathematics at Sixth. For Second class, teachers’ scores on the combined confidence scale (confidence teaching reading and mathematics) were positively correlated with pupil mathematics achievement. However, at Sixth class, teacher confidence in teaching reading or teaching mathematics was unrelated to achievement. Confidence in using technology to teach was unrelated to pupil achievement at either grade level.
Table 5.28: Correlations between pupils’ reading and maths achievement and classroom characteristics
2ndclass 6thclassReading Maths Reading Maths
Number of pupils in classroom .09 .07 .11 .10Teaching experience .10 .14 .04 .11Confidence: teaching reading & maths .06 .11Confidence: teaching maths .05 .09Confidence: teaching reading .04 .02Confidence: teaching w/ technology –.06 –.10 .08 .09
Table 5.29 also presents information on teaching experience, split into novice (less than two years) and experienced teachers14. For both grades and domains, pupils with experienced teachers obtained higher mean scores than those with novice teachers, but the difference was statistically significant only for mathematics. As well as experience, pupils whose teachers had an additional teaching qualification obtained significantly higher reading scores at Second and significantly higher mathematics scores at Sixth class.
14 Contrary to what might be expected, novice teachers were not concentrated in SSP/DEIS schools.
The 2009 National Assessments of Mathematics and English Reading
74
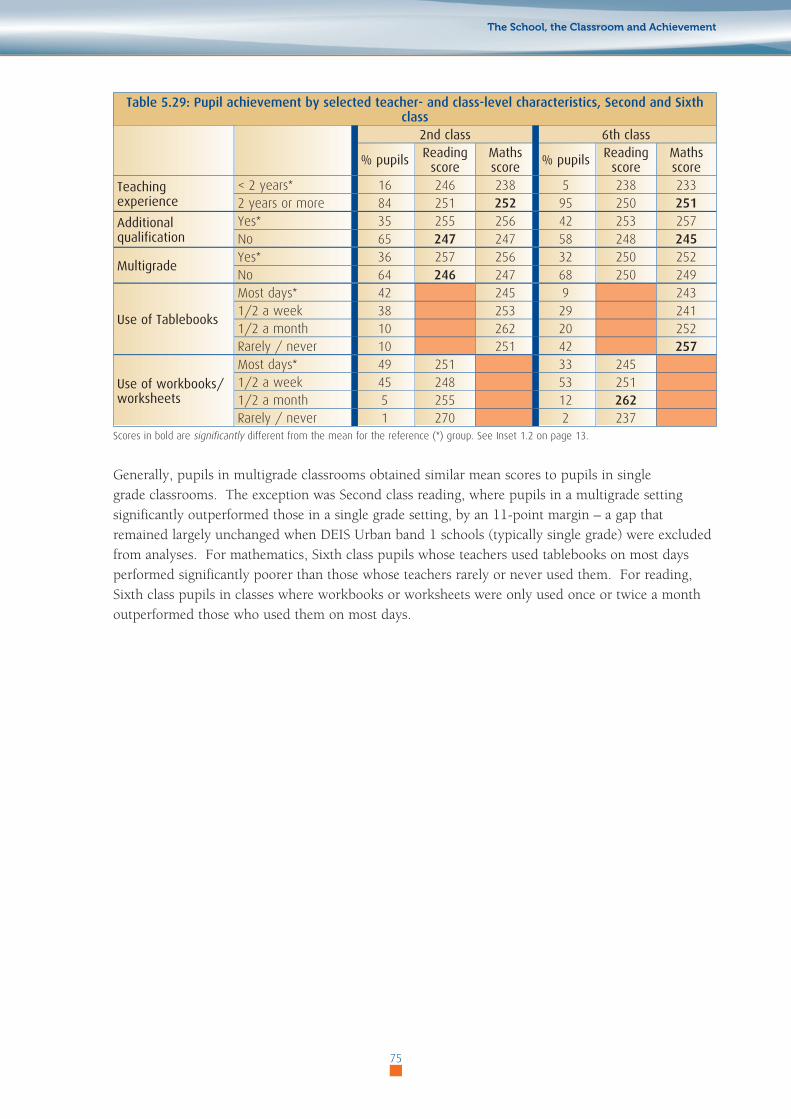
Table 5.29: Pupil achievement by selected teacher- and class-level characteristics, Second and Sixth class
2ndclass 6thclass
%pupils Readingscore
Mathsscore %pupils Reading
scoreMathsscore
Teachingexperience
< 2 years* 16 246 238 5 238 2332 years or more 84 251 252 95 250 251
Additionalqualification
Yes* 35 255 256 42 253 257No 65 247 247 58 248 245
MultigradeYes* 36 257 256 32 250 252No 64 246 247 68 250 249
UseofTablebooks
Most days* 42 245 9 2431/2 a week 38 253 29 2411/2 a month 10 262 20 252Rarely / never 10 251 42 257
Useofworkbooks/worksheets
Most days* 49 251 33 2451/2 a week 45 248 53 2511/2 a month 5 255 12 262Rarely / never 1 270 2 237
Scores in bold are significantly different from the mean for the reference (*) group. See Inset 1.2 on page 13.
Generally, pupils in multigrade classrooms obtained similar mean scores to pupils in single grade classrooms. The exception was Second class reading, where pupils in a multigrade setting significantly outperformed those in a single grade setting, by an 11-point margin – a gap that remained largely unchanged when DEIS Urban band 1 schools (typically single grade) were excluded from analyses. For mathematics, Sixth class pupils whose teachers used tablebooks on most days performed significantly poorer than those whose teachers rarely or never used them. For reading, Sixth class pupils in classes where workbooks or worksheets were only used once or twice a month outperformed those who used them on most days.
The School, the Classroom and Achievement
75

The 2009 National Assessments of Mathematics and English Reading
76
6

Typical and Atypical Performance PatternsUnlike previous National Assessments, the same group of pupils completed both tests in NA 2009. Thus, for the first time we can compare scores on reading and mathematics. As might be expected, most pupils who did well on one also did well on the other. However, while strong, the relationship is by no means perfect. Thus, this chapter examines different patterns of performance.
We begin by examining pupils and schools with similar performance across the domains of reading and mathematics (i.e., a typical performance pattern). Then, we look at those with large differences in performance across domains (e.g., good on reading, poor on mathematics). Finally, we look at those with large performance differences within domains (e.g., good on Comprehension, poor on Vocabulary). The latter two groups display atypical patterns, and are perhaps of more interest. Examining the different groups may help to clarify the characteristics that underpin achievement generally, as well as those more specific to reading than to mathematics, and vice versa. Because this is the first time it has been possible to compare the data for reading and mathematics, the analyses are largely exploratory and descriptive. They form the basis for more comprehensive analyses to be conducted at a later stage.
However, before any comparison of performance on reading and mathematics, we begin with socioeconomic status (SES). SES is almost universally recognised as mediating the relationship between performance and many individual- and school-level factors. Consequently, the first section in this chapter examines school-level SES and performance, presenting the relationship between the two and highlighting some atypical schools.
SES and Performance
Chapters 4 and 5 outlined the relationship between pupil achievement scores and family SES15. This is the simplest way to relate SES and achievement: each pupil’s test score is related to each pupil’s SES score. However, we can also use pupil SES to create school SES scores, by creating a school-level average from the pupil data for a given school. Thus, individual pupil achievement can be related to school-level SES (as in Chapter 5). This section goes a step further and examines the relationship between school-level achievement and school-level SES. Only Sixth class reading data are discussed, but similar findings pertain for Sixth class mathematics data and for Second class.
15 SES scores were obtained by scoring parental occupations, using the International Socio-Economic Index (Ganzeboom, De Graaf, & Treiman, 1992). Scores ranged from 16-90, with 90 reflecting highest status jobs.
77
6
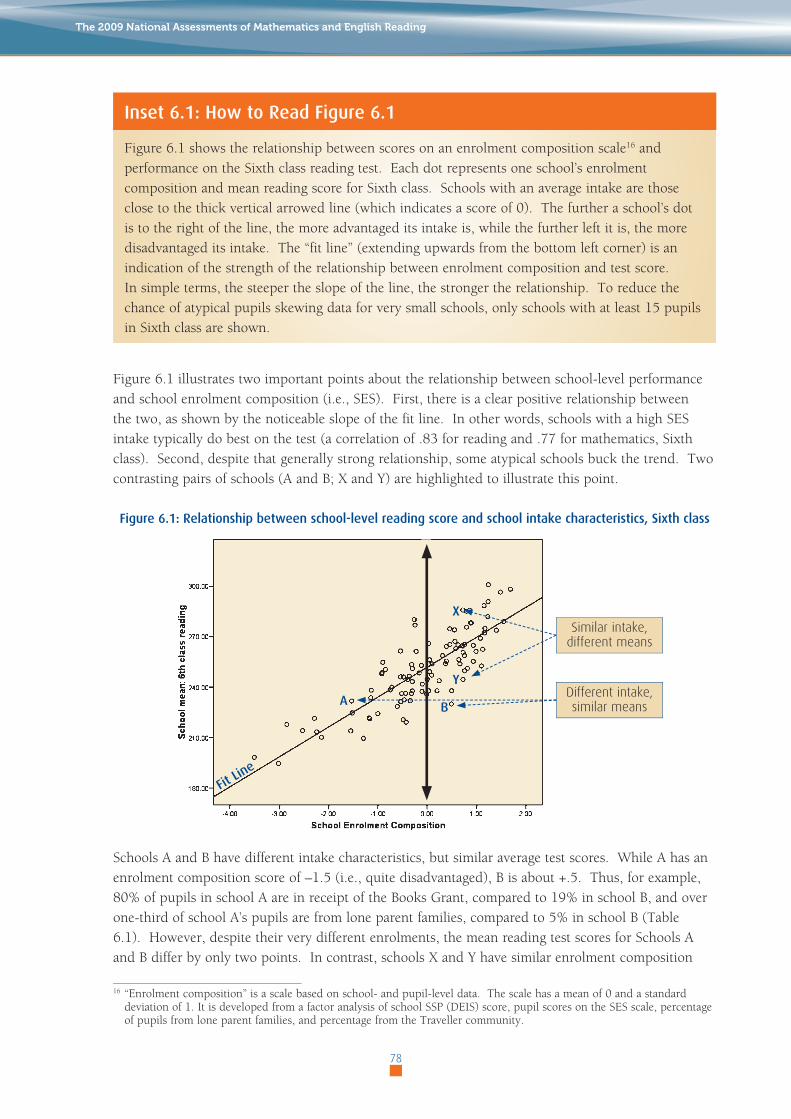
Inset 6.1: How to Read Figure 6.1
Figure 6.1 shows the relationship between scores on an enrolment composition scale16 and performance on the Sixth class reading test. Each dot represents one school’s enrolment composition and mean reading score for Sixth class. Schools with an average intake are those close to the thick vertical arrowed line (which indicates a score of 0). The further a school’s dot is to the right of the line, the more advantaged its intake is, while the further left it is, the more disadvantaged its intake. The “fit line” (extending upwards from the bottom left corner) is an indication of the strength of the relationship between enrolment composition and test score. In simple terms, the steeper the slope of the line, the stronger the relationship. To reduce the chance of atypical pupils skewing data for very small schools, only schools with at least 15 pupils in Sixth class are shown.
Figure 6.1 illustrates two important points about the relationship between school-level performance and school enrolment composition (i.e., SES). First, there is a clear positive relationship between the two, as shown by the noticeable slope of the fit line. In other words, schools with a high SES intake typically do best on the test (a correlation of .83 for reading and .77 for mathematics, Sixth class). Second, despite that generally strong relationship, some atypical schools buck the trend. Two contrasting pairs of schools (A and B; X and Y) are highlighted to illustrate this point.
Figure 6.1: Relationship between school-level reading score and school intake characteristics, Sixth class
Schools A and B have different intake characteristics, but similar average test scores. While A has an enrolment composition score of –1.5 (i.e., quite disadvantaged), B is about +.5. Thus, for example, 80% of pupils in school A are in receipt of the Books Grant, compared to 19% in school B, and over one-third of school A’s pupils are from lone parent families, compared to 5% in school B (Table 6.1). However, despite their very different enrolments, the mean reading test scores for Schools A and B differ by only two points. In contrast, schools X and Y have similar enrolment composition
16 “Enrolment composition” is a scale based on school- and pupil-level data. The scale has a mean of 0 and a standard deviation of 1. It is developed from a factor analysis of school SSP (DEIS) score, pupil scores on the SES scale, percentage of pupils from lone parent families, and percentage from the Traveller community.
The 2009 National Assessments of Mathematics and English Reading
78
Similar intake, different means
Y
B
X
A
Fit Lin
e
Different intake, similar means
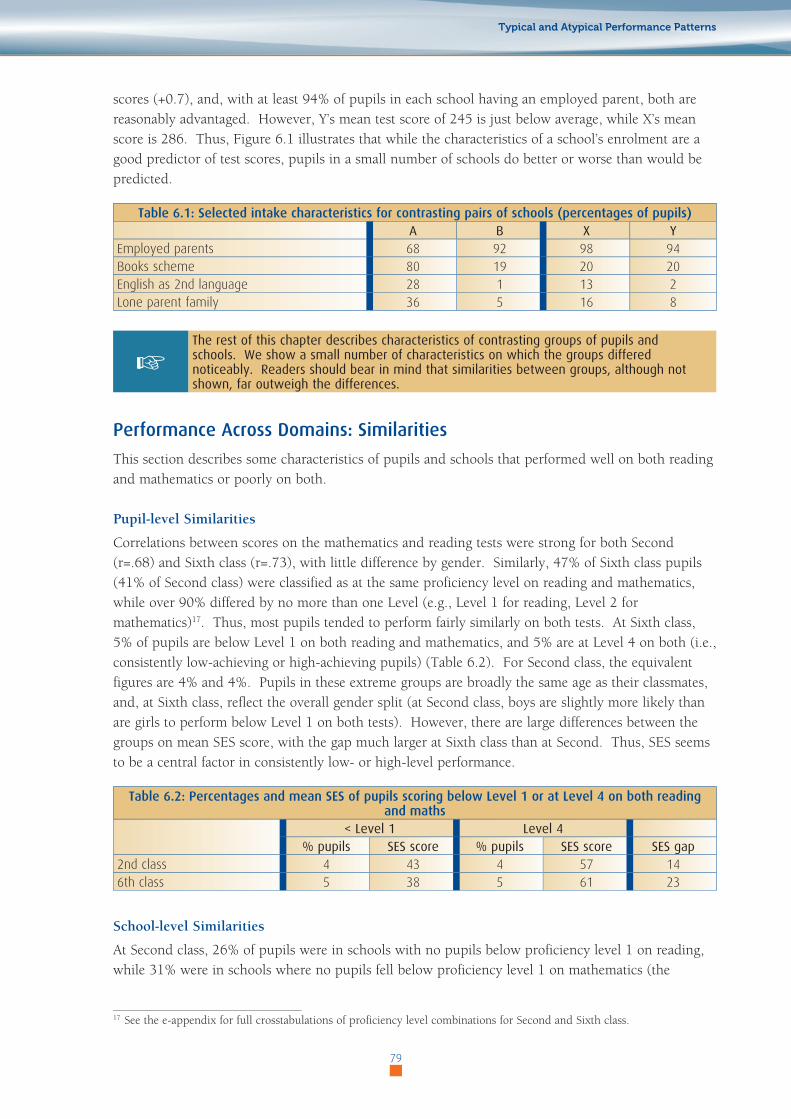
scores (+0.7), and, with at least 94% of pupils in each school having an employed parent, both are reasonably advantaged. However, Y’s mean test score of 245 is just below average, while X’s mean score is 286. Thus, Figure 6.1 illustrates that while the characteristics of a school’s enrolment are a good predictor of test scores, pupils in a small number of schools do better or worse than would be predicted.
Table 6.1: Selected intake characteristics for contrasting pairs of schools (percentages of pupils)A B X Y
Employed parents 68 92 98 94Books scheme 80 19 20 20English as 2nd language 28 1 13 2Lone parent family 36 5 16 8
+Therestofthischapterdescribescharacteristicsofcontrastinggroupsofpupilsandschools .Weshowasmallnumberofcharacteristicsonwhichthegroupsdifferednoticeably .Readersshouldbearinmindthatsimilaritiesbetweengroups,althoughnotshown,faroutweighthedifferences .
Performance Across Domains: Similarities
This section describes some characteristics of pupils and schools that performed well on both reading and mathematics or poorly on both.
Pupil-level Similarities
Correlations between scores on the mathematics and reading tests were strong for both Second (r=.68) and Sixth class (r=.73), with little difference by gender. Similarly, 47% of Sixth class pupils (41% of Second class) were classified as at the same proficiency level on reading and mathematics, while over 90% differed by no more than one Level (e.g., Level 1 for reading, Level 2 for mathematics)17. Thus, most pupils tended to perform fairly similarly on both tests. At Sixth class, 5% of pupils are below Level 1 on both reading and mathematics, and 5% are at Level 4 on both (i.e., consistently low-achieving or high-achieving pupils) (Table 6.2). For Second class, the equivalent figures are 4% and 4%. Pupils in these extreme groups are broadly the same age as their classmates, and, at Sixth class, reflect the overall gender split (at Second class, boys are slightly more likely than are girls to perform below Level 1 on both tests). However, there are large differences between the groups on mean SES score, with the gap much larger at Sixth class than at Second. Thus, SES seems to be a central factor in consistently low- or high-level performance.
Table 6.2: Percentages and mean SES of pupils scoring below Level 1 or at Level 4 on both reading and maths
<Level1 Level4%pupils SESscore %pupils SESscore SESgap
2nd class 4 43 4 57 146th class 5 38 5 61 23
School-level Similarities
At Second class, 26% of pupils were in schools with no pupils below proficiency level 1 on reading, while 31% were in schools where no pupils fell below proficiency level 1 on mathematics (the
17 See the e-appendix for full crosstabulations of proficiency level combinations for Second and Sixth class.
Typical and Atypical Performance Patterns
79

equivalent figures for Sixth class are 29% for reading and 32% for mathematics) (Table 6.3). At the other extreme, a large minority were in schools with no pupils at Level 4 for reading (22% of Second and 25% of Sixth class pupils) or for mathematics (28% for Second and 27% for Sixth class). Table 6.3 also shows combined school-level performance on both tests. Eighteen percent of Second class pupils were in schools where no pupil scored below proficiency level 1 on either test, while 10% were in schools where no pupil scored at Level 4 on either. For Sixth class, 21% were in schools with no pupil below Level 1 and 13% with no pupil at Level 4.
Table 6.3: Percentages of pupils in schools where there are no pupils below Proficiency Level 1, or at Proficiency Level 4, Second and Sixth classes
2ndclass 6thclass0pupils<PL1 0pupilsatPL4 0pupils<PL1 0pupilsatPL4
Reading 26 22 29 25Maths 31 28 32 27Either Reading or Maths 18 10 21 13
As might be expected, most schools with no pupils below Level 1 on either test (i.e., no very low achievers) were relatively advantaged while most with no pupils at Level 4 (i.e., no very high achievers) were relatively disadvantaged. For example, at Sixth class, in schools with no pupils below Level 1, 18% of the enrolment were in receipt of the Books Grant, compared to 39% in schools where no pupil was at Level 4. Data for Second class follow a similar pattern. For this reason, Table 6.4 shows only characteristics not directly linked to SES. Rural schools are unusual as they compose a majority of both groups, despite only 34% of all Sixth class pupils being enrolled in rural schools. The two groups of schools also differ on time allocated to English and mathematics lessons. Schools with no pupils at Level 4 on either domain allocated roughly 30 minutes more time per week to teaching English and to teaching mathematics than did schools with no pupils below Level 1. Teachers in schools with no pupils below Level 1 were slightly more experienced than those in schools with no pupils at Level 4, but both sets of schools had teachers who were more experienced than the overall average.
Thus, as at pupil-level, SES is an important correlate of consistently high- or low-scoring schools. Rural schools appear to be less likely to have pupils performing at either extreme of the performance continuum, and schools with no Level 4 pupils tend to allocate more time to teaching English and to mathematics. However, this may just reflect a greater focus on core subjects in schools with few higher-achieving pupils.
Table 6.4: Characteristics of pupils in schools where no pupils are below proficiency level 1 / at proficiency level 4 for either reading or maths, Sixth class
Nopupils<Level1(N=820)
All(N=3832)
NopupilsatLevel4(N=533)
% by location
City 34 34 15Big town 6 13 <1Town 5 20 23Rural 54 34 62
Average forMinutes teaching English 263 275 295Minutes teaching Maths 247 258 273Years teacher experience 22 16 19
The 2009 National Assessments of Mathematics and English Reading
80

Performance Across Domains: Differences
In this section, we examine pupils whose scale score on one domain exceeded their score on the other by a minimum of 50 points (i.e., one full standard deviation). We also examine schools where mean scores on the two tests differed by at least 20 points.
Pupil-level Differences
A minority of pupils (10% at Second and 8% at Sixth class) were categorised as “reading-advantage” because they obtained a reading score that was at least 50 points higher than their mathematics test score. Conversely, 12% of Second and 8% of Sixth class were maths-advantage pupils, as they obtained a mathematics score that was at least 50 points higher than their reading score. Table 6.5 presents selected characteristics of Sixth class pupils with a 50-point advantage on one or other test. Similar data for Second class are included in the e-appendix.
Table 6.5: Selected characteristics of pupils whose test scores on the two domains differed by at least 50 points (one standard deviation), Sixth class
Reading50+(N=296)
Overall(N=3636)
Maths50+(N=286)
%Girls 59 48 32Boys 41 52 68
%
Home language not English / Irish < 1 5 18Read stories or novels at least 1-2 weekly 75 58 5250 or fewer books at home 24 35 39Disagree / strongly disagree ‘I like reading’ 12 30 43
Average Maths self-concept score -0.4 0.0 +0.6
Most reading-advantage pupils were girls (59%), while most in the maths-advantage group were boys (68%). For Second class, the equivalent percentages were 62% and 71%, respectively. Less than 1% of pupils in the reading-advantage group normally spoke a language other than English or Irish at home, compared to 18% of the maths-advantage group. A larger percentage of pupils in the reading- than maths-advantage group (75% versus 52%, respectively) regularly read stories and novels. In contrast, larger percentages of the maths-advantage group had 50 or fewer books in the home, and disagreed or strongly disagreed with the statement “I like reading”. The maths-advantage group also had a higher mean score on the mathematics self-concept scale (+0.6 versus -0.4 for the reading-advantage group).
Many characteristics that distinguished between the two groups were as might be expected and are therefore reported in the e-appendix only – e.g., maths-advantage pupils were more likely to receive positive ratings (parent, teacher, or self-rating) for mathematics than for reading, while reading-advantage pupils were more likely to receive positive ratings for reading. Also, proportionally fewer pupils were in receipt of additional support for the domain in which they performed best, and proportionally more received help for their weaker domain.
Thus, pupils showing an advantage on a domain were likely to be rated as good at it and to enjoy engaging in related activities. In their home, maths-advantage pupils were more likely to have few books and to speak a language other than English/Irish.
Typical and Atypical Performance Patterns
81

School-level Differences
At Sixth class, there were 18 reading-advantage schools (mean score for reading was at least 20 points higher than for mathematics) in which 11% of all pupils were enrolled, and 32 maths-advantage schools, in which 12% of all pupils were enrolled. In maths-advantage schools, 68% of pupils were in a rural school (typically small), only 6% were in schools in receipt of additional support under SSP, and 28% were in schools where there was a post of responsibility for library duties (Table 6.6). In contrast, only 30% of pupils in reading-advantage schools were in rural schools, while 31% were in SSP schools, and 66% were in schools where there was a post of responsibility for library duties (perhaps reflecting the larger size of reading-advantage schools).
Table 6.6: Selected structural characteristics of reading- versus maths-advantage schools, percentages of Sixth class pupils in each type
Reading20+(N=409)
Overall(N=3832)
Maths20+(N=462)
Mean enrolment 253 271 183Post of resp. library 66 66 28Irish-medium 12 6 0
Location
City 24 34 11Large town 18 13 7Town 28 20 14Rural 30 34 68
DEIS/SSP Band 1 or 2, SSP rural 31 21 6
Gender CompositionMixed 71 71 81Single-sex boys 7 13 19Single-sex girls 22 13 0
% pupils LS/RTEnglish 13 15 18Maths 10 10 9
English was the main language of instruction in all maths-advantage schools, while 12% of pupils in reading-advantage schools were taught through Irish. Most pupils in each group were in mixed-sex schools. However, 22% of pupils in reading-advantage school were in all-girls schools, compared to none of the pupils in maths-advantage schools. Conversely, 19% of pupils in maths-advantage schools were in all-boys schools, compared to just 7% among reading-advantage schools. In maths-advantage schools, twice as many pupils were in receipt of support for English as for mathematics (18% versus 9%). However, in reading-advantage schools, the percentages of pupils receiving support for English also exceeded the percentages receiving support for mathematics (13% versus 10%). Thus, reading-advantage schools were more likely to be all-girls schools, and to be in SSP/DEIS, while maths-advantage schools were more likely to be rural, and to be all-boys schools.
Performance Within Domains: Differences
This section examines performance variation within domains. As few schools had significant within-domain differences – e.g., only 2% of Sixth class pupils were in schools with 20-point advantage on the Implement over the Apply & Problem-solve subscale – only pupil-level differences are described.
Pupil-level Differences: Reading
A small minority of pupils (7% at Second and 6% at Sixth class) had a 50-point advantage on Vocabulary (over Comprehension). Conversely, 6% of pupils at each grade had a 50-point advantage on Comprehension. Most Vocabulary-advantage pupils were boys (56-63%) (Table
The 2009 National Assessments of Mathematics and English Reading
82

6.7). Slightly more than half (56%) of Sixth class Comprehension-advantage pupils were girls, but there were no gender differences at Second class. At Second class, pupils who did not normally speak English or Irish at home composed a slightly larger percentage of the Vocabulary-advantage than the Comprehension-advantage group, but the reverse was true at Sixth class. At each grade level, the percentages agreeing that they liked reading were slightly higher among pupils in the Comprehension-advantage than Vocabulary-advantage groups. At Sixth, but not Second class, proportionally more pupils in the Vocabulary-advantage group were in receipt of additional support for English. At each grade, pupils in the Comprehension-advantage group had slightly higher SES scores than those in the Vocabulary-advantage group, with the gap largest at Sixth class.
Table 6.7: Selected characteristics of pupils whose reading vocabulary and comprehension scale scores differed by at least 50 points, Second and Sixth class
%ofpupils…2ndclass 6thclass
Vocab .50+(N=258)
Comp .50+(N=222)
Vocab .50+(N=238)
Comp .50+(N=183)
Boys 63 50 56 44Girls 37 50 44 56Home language not English / Irish 13 9 3 5“I like reading” 77 93 67 74Receipt of LS/RT for English 14 14 13 7Mean SES 50 53 48 53
In sum, relative to Comprehension-advantage, Vocabulary-advantage pupils were more likely to be boys, to not like reading, and to have a slightly lower SES score.
Pupil-level Differences: Mathematics
This section compares Implement-advantage pupils (Second class: 9%; Sixth: 6%) and Problem-solve-advantage pupils (Second: 7%; Sixth: 6%) – i.e., pupils who scored at least 50 points more on the Implement subscale than on Apply & Problem-solve, and vice-versa. These subscales were selected because of their curricular importance: being able to implement procedures can be seen as a prerequisite for mastering problem-solving skills, which represent higher order skills pupils are expected to acquire through the curriculum.
Most pupils with an advantage on Problem-solving were boys (62% in both Second and Sixth), while most Implement-advantage pupils were girls (61%) (Table 6.8). At Sixth class, similar percentages of pupils in each group were rated by their teacher as performing at or above Sixth class level on mathematics and reading. However, at Second class, 90% of Implement-advantage pupils were rated as at or above Second class level on mathematics, versus 80% of Problem-solve-advantage pupils. This is surprising, given that pupils with an advantage on Problem-solving did far better on the overall mathematics (and reading) test. In Second class, the Problem-solve-advantage pupils had a slightly higher mean SES score than Implement-advantage pupils. Pupils in the Problem-solve-advantage group also scored marginally higher on engagement with mathematics or mathematics self-concept than did pupils in the Implement-advantage group.
Typical and Atypical Performance Patterns
83

Table 6.8: Selected characteristics of Second and Sixth class pupils whose problem-solving and implement scale scores differed by at least 50 points
2ndclass 6thclassProblem-solve
50+(N=286)
Implement50+
(N=346)
Problem-solve50+
(N=230)
Implement50+
(N=241)
%
Boys 62 39 62 39Girls 38 61 38 61At or above grade level in maths: Teacher rating 80 90 65 65
At or above grade level in English: Teacher rating 83 85 65 61
Mean
Overall maths score 266 239 256 236Overall reading score 260 250 256 238SES score 53 48 49 48Engagement with maths 0.0 – 0.2 – –Maths self-concept – – +0.1 – 0.1
In sum, compared to Implement-advantage pupils, those showing a significant advantage on Problem-solving were more likely to be boys, and to do well on both the mathematics and reading tests. At Second class only, they were more likely to be from slightly higher SES families, and slightly less likely to be rated by their teacher as at or above Second class level on mathematics.
The 2009 National Assessments of Mathematics and English Reading
84
7

Summary and RecommendationsThis chapter is divided into three main sections. Section one summarises some of the main findings from the present study. Section two outlines some trends in non-achievement data since the last National Assessments in 2004, while section three discusses some of the findings and provides a number of related recommendations.
Summary of National Assessments 2009
Although the 2009 National Assessments are the latest in a series of assessments conducted over the past 38 years, this was the first year in which the present tests were administered, and the first time in recent years in which Second and Sixth classes were the target grades. Thus, trend data are available for non-achievement variables only.
Test Results
As baseline data, the test results were scored and scaled to have a mean of 250 and a standard deviation of 50. As well as overall scales for reading and mathematics, subscales were developed for reading (Vocabulary, Comprehension, Retrieve, Infer, Interpret & Integrate, and Examine & Evaluate) and mathematics (Number & Algebra, Shape & Space, Measures, Data, Recall, Implement, Integrate & Connect, Reason, and Apply & Problem-solve).
For mathematics, the overall percent correct scores were 57% for Second class and 55% for Sixth class. The percent correct by subscale ranged from 49% (Measures) to 73% (Shape & Space) in Second class, and from 38% (Measures) to 64% (Data) in Sixth class. No gender differences emerged on the overall mathematics scales, although, at Sixth class, boys significantly outperformed girls on Measures. For reading, the mean percent correct score at Second class was 63%, overall, and for Vocabulary and Comprehension. At Sixth class, overall percent correct was 65% (64% for Vocabulary and 66% for Comprehension). At Second class, girls performed significantly better than boys overall, and in each content area, while at Sixth class there were no significant gender differences overall, or for any subscale.
Factors Related to Achievement
Pupil characteristics associated with higher test scores included high attendance rates, positive ratings (by teachers, parents and self) on the domain, positive mathematics self-concept (for mathematics performance), enjoyment of reading (for reading performance), and not being in receipt of additional support in school. Lower pupil achievement was linked to a number of demographic characteristics, including low familial socioeconomic status (SES), parental unemployment, membership of the Traveller community, speaking a first language other than English or Irish, living in a lone-parent household, or being part of a large family. Aspects of the home environment positively related to achievement included parents reading for enjoyment, the availability of resources such as books in the home, parental confidence in their ability to assist their child with homework, pupils not having a
85
7
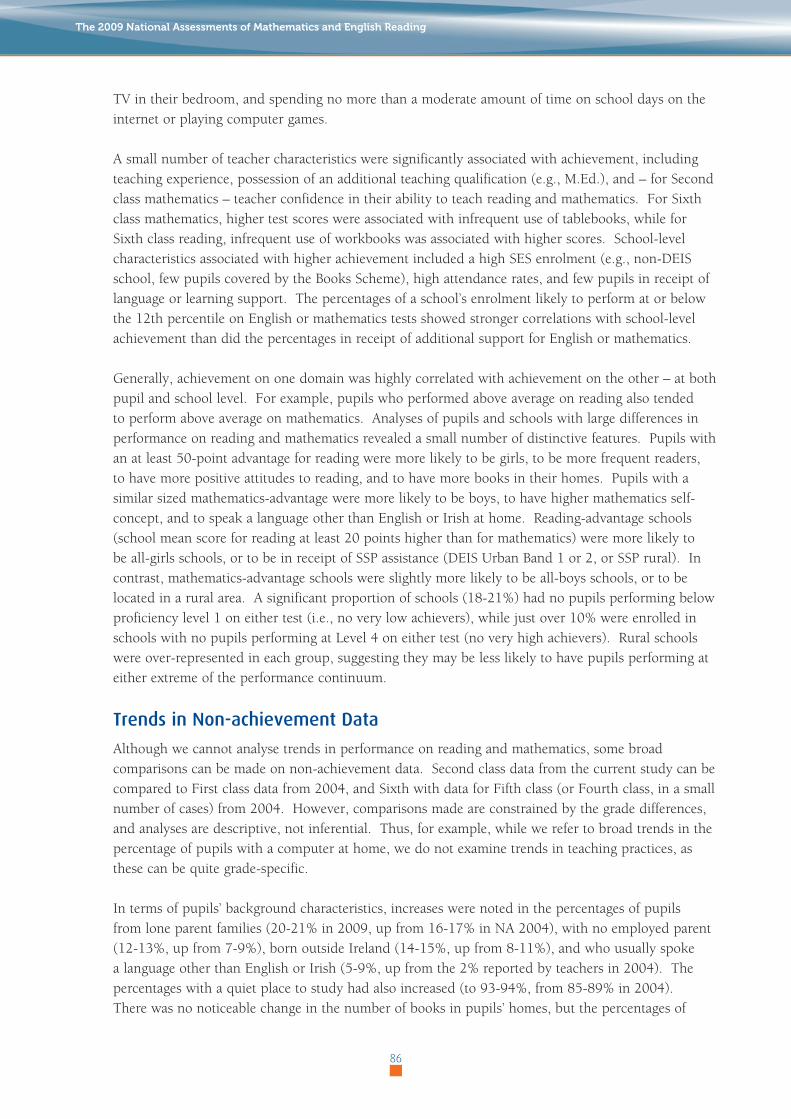
TV in their bedroom, and spending no more than a moderate amount of time on school days on the internet or playing computer games.
A small number of teacher characteristics were significantly associated with achievement, including teaching experience, possession of an additional teaching qualification (e.g., M.Ed.), and – for Second class mathematics – teacher confidence in their ability to teach reading and mathematics. For Sixth class mathematics, higher test scores were associated with infrequent use of tablebooks, while for Sixth class reading, infrequent use of workbooks was associated with higher scores. School-level characteristics associated with higher achievement included a high SES enrolment (e.g., non-DEIS school, few pupils covered by the Books Scheme), high attendance rates, and few pupils in receipt of language or learning support. The percentages of a school’s enrolment likely to perform at or below the 12th percentile on English or mathematics tests showed stronger correlations with school-level achievement than did the percentages in receipt of additional support for English or mathematics.
Generally, achievement on one domain was highly correlated with achievement on the other – at both pupil and school level. For example, pupils who performed above average on reading also tended to perform above average on mathematics. Analyses of pupils and schools with large differences in performance on reading and mathematics revealed a small number of distinctive features. Pupils with an at least 50-point advantage for reading were more likely to be girls, to be more frequent readers, to have more positive attitudes to reading, and to have more books in their homes. Pupils with a similar sized mathematics-advantage were more likely to be boys, to have higher mathematics self-concept, and to speak a language other than English or Irish at home. Reading-advantage schools (school mean score for reading at least 20 points higher than for mathematics) were more likely to be all-girls schools, or to be in receipt of SSP assistance (DEIS Urban Band 1 or 2, or SSP rural). In contrast, mathematics-advantage schools were slightly more likely to be all-boys schools, or to be located in a rural area. A significant proportion of schools (18-21%) had no pupils performing below proficiency level 1 on either test (i.e., no very low achievers), while just over 10% were enrolled in schools with no pupils performing at Level 4 on either test (no very high achievers). Rural schools were over-represented in each group, suggesting they may be less likely to have pupils performing at either extreme of the performance continuum.
Trends in Non-achievement Data
Although we cannot analyse trends in performance on reading and mathematics, some broad comparisons can be made on non-achievement data. Second class data from the current study can be compared to First class data from 2004, and Sixth with data for Fifth class (or Fourth class, in a small number of cases) from 2004. However, comparisons made are constrained by the grade differences, and analyses are descriptive, not inferential. Thus, for example, while we refer to broad trends in the percentage of pupils with a computer at home, we do not examine trends in teaching practices, as these can be quite grade-specific.
In terms of pupils’ background characteristics, increases were noted in the percentages of pupils from lone parent families (20-21% in 2009, up from 16-17% in NA 2004), with no employed parent (12-13%, up from 7-9%), born outside Ireland (14-15%, up from 8-11%), and who usually spoke a language other than English or Irish (5-9%, up from the 2% reported by teachers in 2004). The percentages with a quiet place to study had also increased (to 93-94%, from 85-89% in 2004). There was no noticeable change in the number of books in pupils’ homes, but the percentages of
The 2009 National Assessments of Mathematics and English Reading
86
pupils with internet access showed large increases (from 42-55% in 2004 to 77-84% with internet broadband access in 2009). Pupils’ academic aspirations were similar to 2004 (when 71% of Fifth class pupils wanted to attend Third level, compared to 74% of Sixth class pupils in 2009). However, pupil academic expectations had increased in the interim, with 69% expecting to attend Third level, compared to 54% in 2004.
The amount of time that teachers reported allocating to English lessons decreased since the last National Assessments, particularly in the junior grades (265 minutes per week in Second class, compared to the 304 minutes reported by First class teachers in 2004). As a corollary, time allocated to mathematics lessons had increased, from an average of 216 minutes (Fourth class in 2004) to 225 minutes (Second) and 258 minutes (Sixth) in the present assessment. The percentages of pupils in schools offering parents courses to assist with English reading dropped slightly from 70-78% in 2004 to 65-69% in 2009. In contrast, the percentages of pupils in schools offering mathematics courses for parents increased slightly, from 20% (Fourth class pupils) to 36% for Second and 29% for Sixth class.
The books-to-pupil ratio in class libraries deteriorated slightly, from roughly 14 or 16 books per pupil in 2004 to roughly 10 or 11 in NA 2009, but this was offset somewhat by a slight increase in the total number of books in the school (i.e., including those in a central school library). There was also a slight improvement in the ratio of computers to pupils, up from one per 14-16 pupils to one per 12 pupils. However, despite the improved ratio, the percentages rarely or never using computers in mathematics or English lessons increased slightly (e.g., teacher reports indicate that 47-50% of pupils rarely or never used computers for mathematics lessons). The most basic form of technology asked about was the calculator, which was rarely or never used by 22% of Sixth class pupils, a slight improvement on 33% (Fourth class pupils) in 2004. In 2009, 49% of pupils were in schools with at least one interactive whiteboard (not referred to in the 2004 questionnaires, due to their rarity).
Conclusions and Recommendations
In this section, we comment on 10 broad themes that arose from the National Assessments, and propose a number of recommendations. The themes (not in order of importance) are: the Primary School Curriculum; assessment; additional support; professional development; Information and Communication Technologies; problem-solving in mathematics; difference in school performance; performance of subgroups of pupils; parents; and, limitations of the study and future directions.
Although this section focuses on the education system, we note that schools do not work in a vacuum. Schools cannot influence many important factors (e.g., familial socioeconomic status, deprivation in the local area). However, as a report commissioned by the DES, and aimed at those working in the education system in Ireland, it is appropriate that educators remain our focus.
Summary and Recommendations
87

The Primary School Curriculum
English and mathematics are two core subjects whose status is reflected in the relatively large amount of teaching time allocated to them in the Primary School Curriculum (DES/NCCA, 1999a). In practice, most schools and teachers allocate more time to the subjects than the guidelines set out in the curriculum, perhaps reflecting the importance attached to the subjects and the amount of content to be covered. Nonetheless, our data indicate that principals view curriculum overload as a significant challenge in teaching each subject. The NCCA has also identified curriculum overload as an issue (NCCA 2005a, 2010b) and has released a number of web-based resources to facilitate teachers in following a progression of learning from class to class. However, these resources mainly re-organise existing material, and, in the case of mathematics, tend to focus on content more than process. Hence, they may not address concerns about overload as directly as might be done by highlighting ways to integrate key content areas and teaching processes within and across curriculum areas.
The English and mathematics curricula are essentially unchanged since the current Primary School Curriculum was introduced in 1999, yet information on their strengths and weaknesses is available from multiple sources (e.g., DES, 2005a; Eivers et al., 2005; NCCA, 2005a), and may soon be augmented by the outcomes of the achievement and curriculum components of PIRLS and TIMSS in 2011. While the NCCA has restructured the English curriculum (NCCA, 2005b) and published Bridging Documents for Mathematics (NCCA, 2010a) designed to link content knowledge across primary and post-primary levels, these essentially re-package existing content, and no changes in process are proposed.
NA 2009 provides some insights that could inform ongoing review and revision of the Primary School Curriculum – including the current NCCA review focusing on language. For English, the weaker performance of Second class pupils on the process of Infer relative to Retrieve suggests that a stronger emphasis on and additional support in explicitly teaching higher-order reading comprehension skills and strategies may be warranted (see Collins Block & Lacina, 2009). Future curriculum revision might also draw on emerging trends in the reading field. These include “balanced” reading instruction (where an appropriate balance is achieved between teaching basic skills such as phonics and engaging children in reading “real books” – e.g., Cowen, 2003), teaching pupils strategies to acquire information from multi-genre text sets (Blachowicz & Ogle, 2008), strategies to understand electronic texts (Coiro, Knobel, Lankshear & Leu, 2009), strategies that combine self-regulated learning (“metacognition”), pupil choice of texts and strategy knowledge (Souvignier & Mokhlesgerami, 2006) and strategies that establish strong connections between reading and writing (Hall & Harding, 2003).
Teacher reports from NA 2009 suggest a strong emphasis on problem-solving in mathematics lessons, yet we found relatively poor pupil performance on problem-solving. This suggests a need to focus on process as well as content, and to clarify the implications of social constructivism18 for teaching and learning (Lampert 1990; Lesh & Zawojewski, 2007). Greater teacher understanding in this area might also serve to reduce dependence on textbooks when planning instruction. Trends in the international literature on mathematics teaching point to the value of problem-based learning,
18 The PSMC is based on social constructivist principles, whereby teachers eschew a traditional explain-demonstrate approach in favour of “experimentation, together with discussion among peers, and between the teacher and the child, [which] may lead to general agreement, or to the re-evaluation of ideas and mathematical relationships. New ideas or concepts may then be constructed” (DES/NCCA, 1999a, p. 5).
The 2009 National Assessments of Mathematics and English Reading
88

where pupils discuss and solve problems in order to extract a knowledge of concepts (Lampert 1990; Lesh & Zawojewski, 2007), and of a greater focus on generalisation and algebraic reasoning (Mason, Graham & Johnston-Wilder, 2005).
Recommendation:
1. Future changes to the English curriculum should promote use of self-regulated comprehension strategies at all class levels, across a range of paper and digital texts. Changes to mathematics should promote a stronger social constructivist perspective, including using problems to develop mathematical thinking, teach mathematical concepts and problem-solving strategies. Generally, clearer identification of key cross-curricular skills and processes might help teachers to address curriculum overload.
Assessment
Assessment is a key component of the teaching and learning process, and may be conceptualised in terms of assessment of learning and assessment for learning (Black & Wiliam, 1998; NCCA, 2007). In addition to NA data on classroom assessment practices, which are based on teacher and principal self-reports, this section also draws on observational data from Whole School Evaluation (WSE) reports for May 2009 and May 2010, published on the DES website (www.education.ie).
Our data show that standardised tests are widely, but not universally, used in the assessment of learning in English reading and mathematics. In line with Circular 138/2006, such tests were typically completed near the end of the school year. There are advantages to testing at the end of the school year, but the value is diminished if the information is not shared at the school-level. While principals’ reports suggest that aggregated results of standardised tests were widely discussed at staff meetings, the use of such data to establish school-level learning targets was less common. A related theme, highlighted in WSE reports, is that outcomes of standardised tests should have a stronger role in identifying pupils’ strengths and weaknesses, and informing greater differentiation in classroom instruction. In NA 2009, not even one-third of pupils were in schools where standardised test results were used to provide individual feedback to pupils. Were appropriate software available, it is likely that schools would make greater use of test outcomes, at both pupil- and school-level.
As well as standardised tests, NA 2009 examined use of other forms of assessment. Almost all pupils were taught by teachers who reported regularly using teacher questioning as an assessment strategy. However, there was limited use of documented observations, of strategies that enable planning of instruction related to pupils’ learning needs (e.g., teacher-made checklists), of pupil-centred strategies (e.g., portfolio assessment), of reflective journals, or of pupil-self assessment. WSE reports also highlight some shortcomings in these areas, noting that assessment for learning strategies are not used in all classrooms, and suggesting that the information derived from such assessments could contribute usefully to teacher planning. Regarding assessment for learning strategies – such as described by the NCCA (2007) and Shulman (2007) – few teachers have attended related courses or received ongoing support, and may be unfamiliar with web-based materials to help them implement such strategies.
Recommendations:
2. In all schools, the results of standardised English and mathematics tests should be shared at least annually. Individual outcomes should be used to inform pupils and parents about progress, to plan learning programmes around key objectives, and to inform differentiated classroom
Summary and Recommendations
89
instruction. Pooled outcomes should be used to identify school-level targets. To facilitate these activities, schools and teachers should have access to appropriate supports, including software.
3. Principals and teachers should ensure that assessment for learning is a feature of every classroom, with good practice shared at school-level. Both cross-curricular and subject-specific strategies should be used – e.g., using miscue analysis (reading), observing pupil response methods, ability to connect modes of representation, and use of problem-solving strategies (mathematics).
Additional Support
Circulars 24/03 and 02/05 encourage the in-class provision of additional support where possible, and caution that an over-reliance on withdrawing pupils for additional support is contrary to general principles of inclusion. Further, a recent Inspectorate report noted that Irish primary schools with particularly effective literacy and numeracy practices tended not to withdraw pupils from class for additional support (DES, 2009). Instead, in-class models such as station teaching, literacy centres, and small group teaching are used.
Nonetheless, our study found that additional support was normally provided by withdrawing pupils from their classrooms, either in groups or individually. In-class provision was the approach least likely to be used, which may explain why fewer than half of class teachers felt there was a great deal of cohesion between class and LS/RT programmes. Where in-class support was provided, it was more likely to be for mathematics. Whether this is a by-product of the more limited allocation for mathematics, or because mathematics is perceived to lend itself better to in-class support is unclear. What is clear is that the model of LS/RT as an add-on, rather than an integral part, of the school remains the norm in Irish schools. To move towards an in-class, integrated model requires a cultural shift by class teachers, led by principals, but supported by SEN staff who can share their expertise with their colleagues.
Recommendation:
4. Schools, led by principals, need to develop a more integrated approach to LS/RT. Where possible, provision needs to be restructured to increase in-class provision, and to support collaboration between class teachers and SEN personnel.
Professional Development
Teacher professional development can be broadly split into two phases: initial teacher education (ITE), and continuing professional development (CPD), with the induction/beginning teaching phase straddling both. As the Teaching Council is currently engaged in a comprehensive review of ITE, we will focus mainly on CPD. However, our findings that 50-60% of teachers are only somewhat
confident or not very confident teaching reading or mathematics to lower achieving pupils (for higher achieving pupils, the figures are almost as high) suggests that a greater focus in ITE on the two core subjects of reading and mathematics might be beneficial.
With regard to CPD, Irish schools tend to be small, and teacher mobility between schools fairly limited. Further, classrooms are relatively isolated work environments. Thus, Irish primary teachers have relatively few colleagues with whom they can discuss practice, have limited exposure to different school settings, and can be isolated in their daily work. CPD is therefore particularly important. However, 28%-35% of pupils were taught by teachers who had not experienced any form of CPD
The 2009 National Assessments of Mathematics and English Reading
90
for either English or mathematics in the three years prior to the study. Unlike in many European countries, teacher participation in CPD is unrelated to ongoing professional certification. A very limited amount of CPD – e.g., to prepare for the introduction of a new curriculum – is prescribed, yet according to the DES (2007), roughly 10-15% of teachers do not attend such courses. We suggest that, as in many other professions, participation in CPD should be a professional requirement, not an optional activity.
Mathematics and reading are not the only topics on which teachers might engage in CPD. A review of Education Centre websites19 conducted in early May 2010 found that although up-to-date information was not universally available, the most common course topics related to PE, music, SPHE, visual arts, conflict resolution and ICT. There were also a very small number of topics not obviously linked to pedagogy – e.g., aromatherapy, enneagrams – though these were typically “local” courses (i.e., not requiring approval by the Teacher Education Section (TES)). Only a small minority of summer courses for either 2009 or 2010 related to teaching reading/English or mathematics, an issue also noted by the 2007 report cited above. It may be argued that courses are not offered due to lack of perceived need or interest. However, a minimum of 85% of teachers in our study identified at least one topic for English and for mathematics on which they wanted CPD. Given that these were self-generated open responses, this indicates a very high level of demand. Teacher interest aside, literacy and numeracy are key elements of the curriculum, so it seems inappropriate that most of the resources for CPD available are targeted elsewhere.
Recommendations:
5. Organisations providing CPD should ensure that each course offered adheres fully to the TES guidelines, is of high quality, and directly relevant to teaching. The suite of courses they offer should provide adequate coverage of literacy and numeracy.
6. Each school should have a CPD plan that identifies key school- and individual-level CPD needs. Those identified needs should be the criteria on which participation in CPD is based.
7. For mathematics, additional CPD is needed on developing mathematical thinking, problem-solving skills and on incorporating calculator use into lessons. For reading/English, additional CPD is needed on developing pupils’ writing skills, teaching comprehension strategies, and using multi-genre texts (including digital texts) to explore a common theme.
Information and Communication Technologies
The use of technology pervades everyday life, the number of computers available in schools has increased considerably over the past few years, and over 90% of Sixth class pupils reported spending time on schooldays using the internet or playing computer games. Given these findings, the relatively low use of ICTs in English and mathematics lessons is surprising. While teachers who have in-class access to an interactive whiteboard reported regular use for English and mathematics lessons, reported usage of computers and calculators was less common. Limited use of ICTs for teaching may be due to factors such as obsolescence or maintenance problems (DES, 2008). However, lack of confidence in using ICT may also play a role, explaining why the more-familiar textbook remains
19 As we did not have the capacity to conduct a full review of CPD, the review was limited to face-to-face courses run in Education Centres. Such courses are familiar to most teachers, the Centres operate on behalf of the DES, and information about courses is easily accessible. Other (potentially very effective) modes of delivery of CPD – e.g., in-school, or online courses – were simply beyond the scope of the review.
Summary and Recommendations
91
the predominant tool used in teaching English and mathematics. Only about one-fifth of pupils in Second and Sixth classes were taught by teachers who said they felt very confident in their ability to use computers to teach English or mathematics. Further, ICT was the most commonly cited personal priority topic for CPD in mathematics, while for English it was in the top three for teachers at each grade level.
Failure to integrate ICTs into the teaching and learning of core subjects, particularly in Senior classes, may lead to the school curriculum being perceived as isolated and disconnected from learning outside of the school. Inspection of national educational websites such as NCTE, Scoilnet and Teachnet indicate that they provide considerable material and resources for supporting existing practices in schools. The sites provide information on new software and hardware, and contain tutorial, practice and information packages enhanced by features designed to motivate pupils (e.g., animation, colour and sound). However, the sites seem to reference few resources or courses that might facilitate exploration by teachers and pupils of innovative open-ended learning environments for developing higher order thinking and problem-solving in either English (e.g., web-based tutoring systems that provide elaborative feedback and incorporate pupil choice) or mathematics (e.g. microworlds, simulations, spreadsheets, graphics packages).
Calculators are an example of basic technology, and all teachers should be sufficiently confident to incorporate calculators into lessons without recourse to additional training. Calculators are recommended by the PSMC for use from Fourth class onwards, yet few Sixth class pupils (about 10%) report often or always using a calculator in mathematics class. Even if the more positive teacher reports are used, only 43% of pupils use calculators at least once or twice a week. Limited usage may be linked to the structure of mathematics textbooks (calculator usage is often “covered” in a standalone chapter, with little reference elsewhere) or to the belief that calculators harm rather than enhance a pupil’s mathematical skills. The latter point is not supported by research evidence – e.g., Close, Oldham, Surgenor, Shiel, Dooley and O’Leary (2008) reported that, correctly used, calculators can improve performance on more complex mathematical concepts and skills and on problem-solving.
Recommendations:
8. ICT is an area in which many teachers feel they need additional skills. Therefore, in the context of our earlier recommendations for CPD, teachers should have greater access to courses and packages that support innovative and constructivist methods of teaching and learning in English and maths.
9. In line with the curriculum and with international best practice, calculators should be an integral part of the teaching and learning of mathematics in all classrooms from Fourth class onwards.
Problem-solving in Mathematics
About one-third of the items on the Second and Sixth class mathematics tests assess Apply & Problem-solve process skills, defined as mathematics embedded in a practical context which pupils have to interpret and reason with in order to work out a solution. Most of the items are relatively routine word problems with familiar contexts and easily identified solutions. A smaller number are considered non-routine, i.e., have a less familiar context, involve more reading and interpretation, more steps, and require considerable reasoning to produce a correct solution procedure. At each
The 2009 National Assessments of Mathematics and English Reading
92
grade level, Apply & Problem-solve was the most difficult of the five process skills tested. Further, most of the items in the content strand Measures – the most difficult of the four content strands tested – predominantly involve the process skill of Apply & Problem-solve. Performance on word problems had been identified as a weakness in national surveys as far back as 1977, at Second, Fourth and Sixth classes (Department of Education 1977, 1980, 1985; Shiel & Kelly 2001; Shiel et al. 2006). The continuing weak performance of pupils in problem-solving is of concern, not least because both the PSMC and the recently introduced Project Maths – at post-primary level – view problem-solving as a core skill (DES/NCCA, 1999b; NCCA, 2009).
Pupils who displayed a 50-point advantage (over Implement) on Apply & Problem-solve scored significantly higher on the overall test than pupils who displayed a 50-point advantage on Implement (over Apply & Problem-solve). Nonetheless, teachers in Second class rated the Implement-advantage group higher than the Problem-solve-advantage group. This may suggest that these teachers rate speed and accuracy in computation more highly than ability to solve problems, reflecting a traditional view of mathematics as predominantly about procedural knowledge rather than conceptual understanding and problem-solving ability (Philipp, 2007).
The achievement data suggest that pupils are not getting sufficient experience in solving problems or opportunities to develop strategies for solving them, yet a majority of teachers reported being very confident in their teaching of real-life problem-solving. The apparent conflict may arise because some teachers view problem-solving as routine applications (as per the treatment of the topic in the textbook they are using). Such a view can lead to an over-emphasis on teaching isolated facts and procedural skills using teaching examples and practice, with word problems being used mainly to apply the concept or procedure just taught. As a result, the cognitive demands of the problems are limited and it is easier for pupils to identify a solution method. Many teachers may be unfamiliar with advances in teaching mathematical problem-solving and in the range of resources available. If such advances are to be reflected in typical classroom practice, teachers should become familiar with resources such as Problem-Solving (www.nzmaths.co.nz), Mathematics in Context (www.mmmproject.org/micS.htm), and Nrich Mathematics (www.nrich.maths.org), with approaches such as Lesson Study (e.g., Corcoran, 2008; Lewis, Perry, & Hurd, 2009); and with practical examples, in an Irish context, of good practice in teaching problem-solving (e.g., Cassidy, 2009; Greene, 2007; O’Shea, 2009).
Recommendation:
10. Classroom practice should reflect advances in the teaching of problem-solving. Pupils should spend more time solving substantial problems, analysing and discussing problems with other pupils and their teacher, and acquiring improved understanding of the concepts and skills involved. Teachers should ensure that pupils meet a range of problems across curriculum strands, including complex problems embedded in real-life contexts and those of a non-routine nature.
Differences in School Performance
As noted in the previous chapter, most schools performed as might be expected. A good test score on one domain tended to be accompanied by a good score on the other, and high performing schools tended to be those with a high-SES intake. However, a number of schools demonstrated atypical performance. For example, a significant number of SSP/DEIS schools performed noticeably better
Summary and Recommendations
93

on reading than on mathematics, perhaps indicating that in many such schools, additional energies (and resources) have been targeted at the teaching of reading. Chapter 6 also showed that although school-level SES is usually a good predictor of school-level performance, there are a small number of schools that have an unexpected performance profile.
NA 2009 provides an overview of performance, nationally, and identifies broad general characteristics associated with test performance. The study design does not lend itself to an examination of the within-school factors contributing to unexpectedly good or unexpectedly poor school-level performance. To do so would require a detailed analysis of school characteristics, coupled with observational data. However, internationally, school effectiveness research20, largely supported by the Inspectorate’s 2009 report “Effective literacy and numeracy practices in DEIS schools” provides indicators of effective schools. Strong leadership, collaborative whole-school planning and collaborative teaching (with additional support incorporated into classroom teaching and a consistency of approach across classrooms), sharing of good practice, and using aggregated assessment data are a few of the factors most commonly reported as features of effective schools.
Many SSP/DEIS schools aggregate assessment data, using it to monitor school-level trends in performance across curricular areas and to establish strengths and weaknesses. In other schools, this effective and low-cost approach remains underused. A significant minority of pupils were enrolled in schools where performance on one domain was significantly better than performance on the other. Aggregating data (e.g., results from standardised tests, or from tests accompanying textbook schemes) facilitates identification of school-level strengths and weakness, which can then be addressed in school plans. At least one-quarter of pupils were in schools where aggregated data from standardised tests were not used to establish targets either for English or for mathematics, suggesting that aggregating for cross-curricular targets is even less common.
Recommendation:
11. Schools should make greater use of aggregated data (particularly from standardised tests) to identify strengths and weaknesses across grade levels and curricular areas. The resultant planning and actions should be grounded in what research indicates are characteristics of effective schools – e.g., strong leadership, collaborative and consistent approaches to teaching, and ongoing appraisal of teaching and learning.
Performance of Subgroups of Pupils
In this section, we consider the implications of the performance of some different subgroups of interest (pupils split by school SSP/DEIS status, mother tongue, and gender). On average, pupils in Urban Band 1 SSP/DEIS schools performed considerably poorer on the reading and maths tests than did pupils in all types of schools other than Urban Band 2 schools. Although pupils in rural SSP/DEIS schools performed relatively well, particularly at Second class, the aggregate percentage of pupils in such schools is small and thus subject to large measurement error, meaning that we cannot draw any substantive conclusions about their performance. Among the subset of schools with a significantly better performance on reading than mathematics, SSP/DEIS schools are over-represented. This ties in with anecdotal evidence that many such schools have targeted literacy as their priority area for improvement. Another point to note is that while roughly 20% of pupils in such schools
20 Interested readers are referred to the work of researchers such as Pam Sammons, Bert Creemers, the joint work of Charles Teddlie and David Reynolds, or the journal School Effectiveness and School Improvement.
The 2009 National Assessments of Mathematics and English Reading
94
do not reach proficiency level 1 on the mathematics or the reading tests, another 2-5% (depending on grade and test) reach Level 4. Thus, while overall performance levels are poor, there is diversity within SSP/DEIS schools. The ongoing SSP/DEIS programme evaluation provides far more detail on implementation and outcomes than we can provide here. Thus, we refer readers to Weir, Archer and Millar (2009) for the first in a series of reports.
Those in the second subgroup of interest are often described as “newcomer” pupils – in this study, the 14-15% of pupils who were not born in Ireland. However, the term newcomer is perhaps of more socio-political than educational relevance. For educational outcomes, the language spoken may be the most relevant variable. As noted in Chapter 4, English was the usual home language for most newcomer pupils. While newcomer pupils had slightly lower mean scores than Irish-born pupils, the differences are significant only for reading. Differences become larger if we examine the smaller group (5-9%) of pupils who normally speak a language other than English or Irish at home. However, even within this group, there is considerable variation in performance, particularly in relation to mathematics (e.g., as in the overall pupil population, 10% of those in Sixth class demonstrate proficiency level 4 skills). Thus, some newcomer pupils will require considerable additional support, particularly in relation to language. However, others – not least those whose parents are either native or fluent English speakers – may encounter some cultural and curricular differences, but may adapt relatively quickly to the language demands of the curriculum.
Finally, analyses of test performance by gender provided mixed results. For reading, Second class girls outperformed boys on the overall test and subscales, but there were no significant gender differences at Sixth class. For mathematics, there were no significant gender differences in overall performance at either grade, although boys did better than girls on the Measures subscale at Sixth class. However, the attitudinal data suggest that boys’ attitudes to the importance of reading could be targeted, as could girls’ mathematics self-concept. Teachers themselves identified a need for advice on “selling” reading as an interesting activity in the face of competing interests such as technology and computer games (both stereotypically male interests). Class libraries are an obvious way to “sell” reading to pupils. At both grades, they were typically heavily biased towards fiction texts. A better balance of text types, especially at Senior grades, might appeal to more diverse interests. In relation to girls’ maths self-concept, it is interesting that while the attitudinal differences reflect stereotypically gendered views of maths, they are not reflected in actual test performance. Girls performed as well as boys on the mathematics and reading tests, but they had less confidence in their maths skills than did boys (although the positive relationship between self-concept in mathematics and mathematics performance was evident for both boys and girls). At Second class, girls were at least as willing as boys to engage with mathematics, suggesting that they do not begin with lower mathematics self-concept than boys, but that the perception develops over time. As there is evidence to suggest that a more collaborative, project-based approach to mathematics appeals to girls (Boaler, 1997; Forman, 2003), adoption of such approaches might help.
Recommendations:
12. Pupils should be encouraged to engage with reading and mathematics to the best of their ability, unconstrained by gendered notions about the value of either. To this end, class libraries should contain a balance of text types, rather than the current strong bias towards fiction texts, while mathematics lessons should incorporate a greater focus on collaborative problem-solving and discussion.
Summary and Recommendations
95

Parents
As in previous National Assessments, the results of NA 2009 show that the home environment is strongly linked to pupil achievement, and that the number of books in the home showed one of the strongest links with test performance. However, the number of books remains largely unchanged since 1998, when, as now, 11% of senior class pupils had 10 or fewer non-school books at home. Lack of books may, in some cases, be a financial matter. However, at both grades, 81% of pupils with 10 or fewer books at home nonetheless had a TV in their own bedroom. This suggests that for most, money is not the main issue. It also suggests that some parents are not fully aware of how they can support their child’s academic development. In a related vein, principals identified limited home support as one of the main challenges to teaching English and mathematics– e.g., few educational resources, little exposure to numbers, or parental use of “old maths”. Perhaps to address this, most schools provided courses for parents on helping with English homework, while a minority provided similar for mathematics. Parents’ own reports suggest that while almost all helped with homework at Second class, and most did at Sixth, they felt more confident helping with English than with mathematics. Thus, targeting mathematics might be fruitful.
In Chapter 3 we noted that while ratings supplied by pupils, parents and teachers were all broadly linked with achievement, parental ratings tended to be overly positive. For example, just over half of the Sixth class pupils rated as good at reading by their parents were at or below proficiency level 1 – i.e., could display only the most basic reading skills. This indicates that many parents lack a clear understanding of how their child is performing in school, which, in turn, has implications for the amount of support a child will receive at home. A recent survey provides some context. In 21% of schools, the results of standardised tests were not reported to parents, while in 56%, only verbal feedback was given (INTO, 2010). This is counter to the advice of Circular 138/06 (that schools provide information to parents about performance on standardised tests and other related assessment outcomes) and to the legal right of parents (under the Education Act (1998)) to access information relating to the progress of their child. Further, while it is good practice to discuss test results with parents, it is best practice to accompany the discussion with a written report. The use of resources such as the NCCA’s report card templates and guides to understanding test scores (downloadable from www.ncca.ie) can assist in providing parents with comprehensive and understandable feedback on how their child is getting on in school.
The limited feedback that some schools give to parents may reflect a low level of general parental involvement in those schools. Although the Primary School Curriculum proposes an active role for parents in curriculum implementation, anecdotally, fundraising seems to be the main function of some Parent Associations. We suggest that a more useful view of the role of parents and Parent Associations is outlined in Supporting Each Other. This joint (2010) publication from the National Parents Council-Primary and Irish Primary Principals’ Network sets out a number of ways in which parents and schools can be active partners in children’s education.
Recommendations:
13. The DES should initiate a public information campaign to advise parents about practices that help their child’s general academic development (e.g., discussing books, estimating sizes or costs), and about practices that do not (e.g., unmonitored access to a TV in the bedroom). It should be supported at school level by advice to parents on specific curricular areas, particularly mathematics.
The 2009 National Assessments of Mathematics and English Reading
96

14. Schools should recognise that parents are entitled to information about their child’s performance relative to classmates and to national standards. Parents should be provided with written and verbal feedback on performance – including, but not limited to, the results of standardised tests.
Limitations and Future Directions
There are three main limitations associated with the present study, and all tend to be reflected in educational research in Ireland, generally. First, pupil skills are assessed with paper-and-pencil tests. This means that some core skills – e.g., Expressing & Communicating for mathematics, oral language skills for English – are not measured. Second, National Assessments do not track pupil achievement over time. When we relate pupil performance to teaching practices, it is to the practices of the pupil’s current teacher. No account is taken of previous teachers’ practices. Third, the study does not include any observational data. Almost all reports of teaching practices are based on teacher self-report, which can be biased by socially desirable response patterns. A small number of self-report questionnaire items are a crude tool with which to assess the complex nature and quality of classroom discourse. Observational data describing teaching practices in Irish classrooms are required, as are longitudinal data. The latter would not only allow an examination of trends in performance, but would allow identification of the individual, home, and school factors associated with improved or disimproved pupil performance over a period of time.
Finally, a key finding was that not only were textbooks used on most days in most lessons, but they were also by far the most common resource used to plan lessons. Thus, it could be argued that textbooks mediate interpretation and implementation of the curriculum in almost every classroom, yet their contents and the underlying implications for teaching remain largely unexamined. In the past, the Inspectorate had a role in reviewing textbook content and quality. Currently, no agency does, suggesting an area on which research is needed.
Recommendation:
15. Future research needs include both longitudinal and observational educational research (particularly classroom discourse around reading comprehension and problem-solving), a review of textbooks, and research to build on the initial analyses of atypical performance contained in Chapter 6 of this report.
Summary and Recommendations
97

The 2009 National Assessments of Mathematics and English Reading
98
ReferencesBeaton, A., Mullis, V., Martin, M., Gonzalez, E., Kelly, D., & Smith, T. (1996). Mathematics
achievement in the middle-school years: IEA’s Third International Mathematics and Science Study. Chestnut Hill, MA: TIMSS International Study Center.
Blachowicz, C. & Ogle, D. (2008). Reading comprehension: Strategies for independent learners. New York: Guilford Press.
Black, P., & Wiliam, D. (1998). Inside the black box: Raising standards through classroom assessment. Phi Delta Kappan, 80, 139-148.
Boaler, J. (1997). Experiencing school mathematics: teaching styles, sex and setting. Buckingham UK: Open University Press.
Borman, G., Hewes, G., Overman, L., & Brown, S. (2003). Comprehensive school reform and achievement: A meta-analysis. Review of Educational Research, 73, 125-230.
Cassidy, P. (2009). Realistic mathematics education in an Irish primary classroom. In D. Corcoran, T. Dooley, S. Close, & R. Ward (Eds.), Proceedings of the Third National Conference on Research in Mathematics Education – Mathematics for all: Extending mathematics capacity (pp. 67-76). Dublin: St. Patrick’s College.
Close, S., Millar, D., & Shiel, G. (2009). Characteristics and curriculum validity of test items for the national assessment of mathematics achievement in 6th class. In D. Corcoran, T. Dooley, S. Close, & R. Ward (Eds.), Proceedings of the Third National Conference on Research in Mathematics Education – Mathematics for all: Extending mathematics capacity (pp. 77-89). Dublin: St Patrick’s College.
Close, S., Oldham, E., Surgenor, P., Shiel, G., Dooley, T., & O’Leary, M. (2008). The effects of calculator use on mathematics in schools and in certificate examinations: Final report on phase II. Dublin: St. Patrick’s College.
Close, S., & Shiel, G. (2009). Gender and PISA mathematics: Irish results in context. European Educational Research Journal. 8, 20-33.
Coiro, J., Knobel, M., Lankshear, C., & Leu, D. (Eds.). (2009). Handbook of research on the new literacies. New York: Routledge.
Collins Block, C., & Lacina, J. (2009). Comprehension instruction in kindergarten through grade 3. In S. Israel & G. Duffy (Eds.), Handbook of research on reading comprehension (pp. 494-509). New York: Routledge.
Corcoran, D. (2008). Developing mathematical knowledge in teaching: A three-tiered study of Irish pre-service primary teachers. Unpublished doctoral dissertation, University of Cambridge.
Cosgrove, J., Kellaghan, T., Forde, P., & Morgan, M. (2000). The 1998 National Assessment of English Reading. Dublin: Educational Research Centre.
Cosgrove, J., Milis, L., Shiel, G., Forde, P., & Wardle, H. (2004). Assessment framework for the 2004 National Assessment of English Reading (NAER): First and Fifth classes. Dublin: Educational Research Centre.
99

Cosgrove, J., Shiel, G., Sofroniou, N., Zastrutzki, S., & Shortt, F. (2005). Education for life: The achievements of 15-year-olds in Ireland in the second cycle of PISA. Dublin: Educational Research Centre.
Cowen, J. (2003). A balanced approach to beginning reading instruction: A synthesis of six major U.S. research studies. Newark, DE: International Reading Association.
Darling-Hammond, L. (1999). Teacher quality and student achievement: A review of state policy evidence. Seattle: University of Washington, Center for Teaching and Policy.
Darling-Hammond, L. (2000). Teacher quality and student achievement: A review of state policy evidence. Education Policy Analysis Archives, 8. Retrieved March 8, 2010 from http://epaa.asu.edu/epaa/v8n1/ .
Delaney, S. (2010). Knowing what counts: Irish primary teachers’ mathematical knowledge for teaching. Dublin: Coláiste Mhuire, Marino Institute of Technology.
Department of Education. (1971). Curaclam na bunscoile – Lámhleabhar an oide, Cuid 1. [Primary school curriculum – Teacher’s handbook, Part 1]. Dublin: Stationery Office.
Department of Education, Curriculum Unit. (1977). Turaisc ar theagasc na matamaitice sna bunscoileanna. [Report on the teaching of mathematics in primary school]. Dublin: Author.
Department of Education, Curriculum Unit. (1980). Turaisc ar theagasc na matamaitice sna bunscoileanna (an dara eagrán). [Report on the teaching of mathematics in primary schools, second edition]. Dublin: Author.
Department of Education, Curriculum Unit. (1982). English in the primary school. Dublin: Author.
Department of Education, Curriculum Unit. (1985). Turaisc ar an mhatamaitic i rang VI (1984). [Report on the mathematics in sixth standard (1984)]. Dublin: Author.
Department of Education, Curriculum Unit. (1991). Report on the national survey of English reading in Irish primary schools 1988. Unpublished report. Dublin: Author.
DES (Department of Education and Science). (2007). A value for money assessment of programmes managed by the Teacher Education Section. Retrieved April 30, 2010 from http://www.education.ie/servlet/blobservlet/vfm_review_tes_programmes.pdf?language=EN
DES, Inspectorate. (2005a). An evaluation of curriculum implementation in primary schools: English, mathematics and visual arts. Dublin: Stationery Office.
DES, Inspectorate. (2005b). Literacy and numeracy in disadvantaged schools. Challenges for teachers and learners. An evaluation by the Inspectorate of the Department of Education and Science. Dublin: Stationery Office.
DES, Inspectorate. (2008). ICT in schools: Inspectorate evaluation series. Dublin: Stationery Office.
DES, Inspectorate. (2009). Effective literacy and numeracy practices in DEIS schools. Dublin: Stationery Office.
DES/NCCA (National Council for Curriculum and Assessment). (1999a). Primary school curriculum. Introduction. Dublin: Stationery Office.
DES/NCCA. (1999b). Primary school curriculum. Mathematics. Dublin: Stationery Office.
The 2009 National Assessments of Mathematics and English Reading
100

Duffy, G., & Roehler, L. (1987). Teaching reading as strategies. Reading Teacher, 40, 414-418.
Educational Research Centre. (1977). Drumcondra Attainment Tests. Manual. Dublin: Author.
Educational Research Centre. (1995). Report on the National Survey of English Reading. Unpublished report. Dublin: Author.
Eivers, E., Shiel, G., & Cunningham, R. (2008). Ready for tomorrow’s world? The competencies of Ireland’s 15-year-olds in PISA 2006. Dublin: Educational Research Centre.
Eivers, E., Shiel, G., Perkins, R., & Cosgrove, J. (2005). The 2004 National Assessment of English Reading. Dublin: Educational Research Centre.
Eivers, E., Shiel, G., & Shortt, S. (2004). Reading literacy in disadvantaged primary schools. Dublin: Educational Research Centre.
Forman, E. (2003). A sociocultural approach to mathematics reform: Speaking, inscribing, and doing mathematics within communities of practice. In J. Kilpatrick, W. Martin, & D. Schifter (Eds.), A research companion to principles and standards for school mathematics (pp. 333-352). Reston VA: National Council of Teachers of Mathematics.
Ganzeboom, H., DeGraaf, P., & Trieman, D. (1992). A standard international socio-economic index of occupational status. Social Science Research, 21, 1-56.
Greaney, V., & Kellaghan, T. (1996). Monitoring the learning outcomes of education systems. Washington DC: World Bank.
Greene, C. (2007). The problem-solving strategies of fourth class children in a designated disadvantaged school. In S. Close, T. Dooley, & D. Corcoran (Eds.), Proceedings of the Second National Conference on Research in Mathematics Education (pp. 67-76). Dublin: St. Patrick’s College.
Guthrie, J., Schafer, W., Von Secker, C., & Alban, T. (2000). Contributions of instructional practices to reading achievement in a statewide improvement . Journal of Educational Research, 93, 211-225.
Hall, K., & Harding, A. (2003). A systematic review of effective literacy teaching in the 4 to 14 age range of mainstream schooling. Research evidence in education library. London: EPPI-Centre, Social Science Research Unit, Institute of Education.
Hiebert, J., Gallimore, R., Garnier, H., Givvin, K., Hollingsworth, H., Jacobs, J., et al. (2003). Teaching mathematics in seven countries: Results from the TIMSS 1999 Video Study (NCES 2003-013). Washington, DC: National Center for Education Statistics, U.S. Department of Education.
Hiebert, J. & Grouws, D. (2007). The effects of classroom teaching on students’ learning. In F. Lester (Ed.), Second handbook of research on mathematics teaching and learning (pp. 371-404). Charlotte, NC: Information Age Publishing.
INTO (Irish National Teachers’ Organisation). (2010). Assessment in the primary school. Dublin: Author.
Kellaghan, T., Sloane, K., Alvarez, B., & Bloom, B. (1993). The home environment and school learning. Promoting parental involvement in the education of children. San Francisco: Jossey Bass.
Kelly, S., & McGee, P. (1967). Survey of reading comprehension. New Research in Education, 1, 131-134.
References
101

Kennedy, E. & Shiel, G. (2010). Raising literacy levels with collaborative on-site professional development in an urban disadvantaged school. The Reading Teacher, 63, 372-383.
Kirsch, I. (2001). The International Adult Literacy Survey (IALS): Understanding what was measured. ETS Research Report RR-01-25. Princeton, NJ: Education Testing Service.
Lampert, M. (1990). When the problem is not the question and the solution is not the answer: Mathematical knowing and teaching. American Education Research Journal, 27, 29-63.
Lapointe, A, Mead, N, & Askew, J. (1992). Learning mathematics. Princeton, NJ: Educational Testing Service’s Center for the Assessment of Educational Progress
Lapointe, A., Mead, N., & Phillips, G. (1989). A world of difference: An international assessment of mathematics and science. Princeton, NJ: Educational Testing Service.
Lesh, R., & Zawojewski, J. (2007). Problem solving and modeling. In F. Lester (Ed.), Second handbook of research on mathematics teaching and learning (pp. 763-804). Charlotte, NC.: Information Age Publishing.
Lewis C., Perry R., & Hurd, J. (2009). Improving mathematics instruction through lesson study: a theoretical model and North American case. Journal for Mathematics Teacher Education. 12, 285-304.
Lynch , K., Close, S., & Oldham, E. (1994). Chapter 6: The Republic of Ireland. In L. Burton (Ed.), Who counts? Assessing mathematics in Europe. Stoke-on-Trent: Trentham Books.
Lyons, M., Lynch, K., Close, S., Sheerin, E., & Boland, P. (2003). Inside classrooms: The teaching and learning of mathematics in social context. Dublin: Institute of Public Administration.
McDonagh, D. (1973). A survey of reading comprehension in Dublin city schools. Irish Journal of Education, 7, 5-10.
MacNamara, J. (1966). Bilingualism and primary education. Edinburgh: University Press.
Martin, M., Hickey, B., & Murchan, D. (1992). The Second International Assessment of Educational Progress: Mathematics and science findings in Ireland. Irish Journal of Education, 26, 3-146.
Martin, M., & Morgan, M. (1994). Reading literacy in Irish schools: A comparative analysis. Irish Journal of Education, 28, 3-101.
Martin, M., Mullis, I., & Foy, P. (2008). TIMSS 2007 international mathematics report. Findings from IEA’s Trends in International Mathematics and Science Study at the fourth and eighth grades, 319-323. Chestnut Hill, MA: TIMSS & PIRLS International Study Center, Boston College.
Mason, J., Graham, A., & Johnston-Wilder, S. (2005). Developing thinking in algebra. London: Paul Chapman.
Medwell, J., Strand, S., & Wray, D. (2007). The role of handwriting in composing for Y2 children. Journal of Reading, Writing and Literacy, 2, 10-21.
Medwell, J., Strand, S., & Wray, D. (2009). The links between handwriting and composing for Y6 children. Cambridge Journal of Education, 39, 329-344.
Mullis, I., Kennedy, A., Martin, M., & Sainsbury, M. (2006). PIRLS 2006. Assessment framework and specifications. Chestnut Hill MA: International Study Center, Boston College.
The 2009 National Assessments of Mathematics and English Reading
102
Mullis, I., Martin, M., Kennedy, A., Foy, F. (2007). IEA’s Progress in International Reading Literacy Study in primary school in 40 countries. Chestnut Hill, MA: TIMSS & PIRLS International Study Center, Boston College.
Mulrooney, V. (1986). National surveys of reading attainment in primary schools in Ireland. In V. Greaney (Ed.), Irish papers presented at the Fourth European Reading Conference and the Tenth RAI Annual Conference (pp. 187-200). Dublin: Reading Association of Ireland.
National Mathematics Advisory Panel. (2008). Foundations for success: The final report of the National Mathematics Advisory Panel. Washington, DC: U.S. Department of Education. Retrieved April 30 2010 from www.ed.gov/pubs/edpubs.html .
National Parents Council (Primary) & Irish Primary Principal’s Network. (2010). Supporting each other. A guide to best practice for the effective partnership between principals and parent associations. Dublin: Authors.
NCCA. (2005a). Primary curriculum review. Phase 1. Dublin: Author.
NCCA. (2005b). Primary school curriculum. English. Additional support material. Dublin: Author.
NCCA. (2007). Assessment in the primary school curriculum: Guidelines for schools. Dublin: Author.
NCCA. (2009). Junior Certificate mathematics. Draft syllabus for schools involved in Project Maths. Dublin: Author. Retrieved June 10, 2010 from http://www.ncca.ie/en/Curriculum_and_Assessment/Post-Primary_Education/Review_of_Mathematics/Project_Maths/Project_Maths_syllabuses/Junior_Certificate_Draft_Syllabus_Strands_1_-_4_.pdf.
NCCA. (2010a). Bridging documents for mathematics: 5th/6th class, primary – Junior cycle, post-primary. Dublin: Author. Retrieved June 10, 2010 from http://www.ncca.ie/en/Curriculum_and_Assessment/Early_Childhood_and_Primary_Education/Primary_School_Curriculum/Working_with_schools/PSN_Curriculum_Overload/Bridging_documents_for_Maths.pdf.
NCCA. (2010b). Curriculum overload in primary schools. From the learning site: Teachers’ voices, phases 1 and 2. Dublin: NCCA. Retrieved June 10, 2010 from http://www.ncca.ie/en/Publications_-_SEARCH/Reports/Curriculum_Overload_in_primary_schools_Teachers’_voices_Phases_1_2.pdf.
OECD (Organisation for Economic Co-operation and Development). (1995). Education at a glance. OECD indicators. Paris: Author.
OECD. (2001). Knowledge and skills for life: First results of PISA 2000. Paris: Author.
OECD. (2004). Learning for tomorrow’s world: First results from PISA 2003. Paris: Author.
OECD. (2007). PISA 2006: Science competencies for tomorrow’s world – Volume 1: Analysis. Paris: Author.
OECD/Statistics Canada. (2000). Literacy in the information age: Final report of the International Adult Literacy Survey. Paris: Authors.
O’Shea, J. (2009). Endeavouring to teach mathematical problem solving from a constructivist perspective (2009). In D. Corcoran, T. Dooley, S. Close, & R. Ward (Eds.), Proceedings of the Third National Conference on Research in Mathematics Education – Mathematics for all: Extending mathematics capacity (pp. 185-193). Dublin: St. Patrick’s College.
References
103
Philipp, R. (2007). Mathematics teachers’ beliefs and affect. In F. Lester (Ed.), Second handbook on research on mathematics teaching and learning (pp. 257-318). Charlotte, NC. Information Age Publishing Inc.
Pong, S., & Pallas, A. (2001). Class size and eighth-grade math achievement in the United States and abroad. Educational Evaluation and Policy Analysis, 23, 251-73.
Sammons, P., Hillman, L. and Mortimore, P. (1995) Key characteristics of effective schools: A review of school effectiveness research. London: Institute of Education.
Schoenfeld, A. (1992). Learning to think mathematically: Problem solving, metacognition and sense making in mathematics. In D. Grouws (Ed.), Handbook of research on mathematics teaching and learning (pp. 334-370). New York: Macmillan.
Shiel, G., Cosgrove, J., Sofroniou, N., & Kelly, A. (2001). Ready for life: The literacy achievements of Irish 15-year olds with comparative international data. Dublin: Educational Research Centre.
Shiel, G., & Kelly, D. (2001). The 1999 National Assessment of Mathematics Achievement. Dublin: Educational Research Centre.
Shiel, G., Morgan, M., & Larney, R. (1998). Study of remedial education in primary schools. Summary report. Dublin: Stationery Office.
Shiel, G., Surgenor, P., Close, S., & Millar, D. (2006). The 2004 National Assessment of Mathematics Achievement. Dublin: Educational Research Centre.
Shulman, L. (2007). Counting and recounting: Assessment and the quest for accountability. Change, 39, 20-25.
Souvignier, E., & Mokhlesgerami, J. (2006). Using self-regulation as a framework for implementing strategy instruction to foster reading comprehension. Learning and Instruction, 16, 57-71.
Stigler, J., Gonzales, P., Kawanaka, T., Knoll, S., & Serrano, A. (1999). The TIMSS Videotape Classroom Study: methods and findings from an exploratory research project on eighth-grade mathematics instruction in Germany, Japan, and the United States. (NCES 1999-074). Washington, DC: National Center for Education Statistics, U.S. Department of Education.
Taylor, B., Pressley, M., & Pearson, P. (2002). Research-supported characteristics of teachers and schools that promote reading achievement. Washington, DC: National Education Association.
Travers, M. (1976). A second replication of a survey of reading comprehension in Dublin national schools. Irish Journal of Education, 10, 18-22.
Ward, N. (1982). A fourth survey of reading comprehension in Dublin city national schools. Irish Journal of Education, 16, 56-61.
Weir, S., Archer, P., & Millar, D. (2009). Analysis of English reading and mathematics achievement in schools in the rural dimension of the School Support Programme. Retrieved May 10, 2010 from www.erc.ie/documents/educ_dis_primary_rural_report1.pdf .
Weir, S., & Milis, L. (2001). The relationship between the achievements of 6th class pupils from disadvantaged backgrounds and their attitudes to school. Irish Journal of Education, 32, 63-83.
Wray, D., Medwell, J., Poulson, L., & Fox, R. (2001). Teaching literacy effectively in the primary school. London: Routledge Falmer.
The 2009 National Assessments of Mathematics and English Reading
104


The 2009 National Assessmentsof Mathematics and English Reading
Eemer Eivers, Seán Close, Gerry Shiel,
David Millar, Aidan Clerkin, Lorraine Gilleece & Joanne Kiniry
Prepared for the Department of Education and Skills
by the Educational Research Centre
www.erc.ie/NA2009
Th
e 20
09
Natio
nal A
ssessmen
ts of M
athem
atics and
En
glish
Read
ing
E
ivers et al.