THE 2005 SUMMER WATER TEMPERATURE AND … · Cheslatta Falls and at Vanderhoof, July 10 to...
48
THE 2005 SUMMER WATER TEMPERATURE AND FLOW MANAGEMENT PROJECT NECHAKO FISHERIES CONSERVATION PROGRAM Technical Report No. RM05-1 Prepared by: Triton Environmental Consultants Ltd. January, 2006
Transcript of THE 2005 SUMMER WATER TEMPERATURE AND … · Cheslatta Falls and at Vanderhoof, July 10 to...
THE 2005 SUMMER WATER TEMPERATURE AND FLOW MANAGEMENT PROJECT
NECHAKO FISHERIES CONSERVATION PROGRAMTechnical Report No. RM05-1
Prepared by:
Triton Environmental Consultants Ltd.January, 2006

Contents
List of Figures ...................................................................................................................i
List of Tables ................................................................................................................... ii
List of Appendices ....................................................................................................... iii
ABSTRACT ...................................................................................................................... 1
INTRODUCTION ............................................................................................................. 1
METHODS ...................................................................................................................... 1
RESULTS .......................................................................................................................... 9
DISCUSSION ................................................................................................................ 10 Recorded Data
Volume of Water Used
Application of the Summer Water Temperature and Flow Management Project Release Criteria
REFERENCES .................................................................................................................12
APPENDICES


i
List of Figures
FIGURE 1 Nechako River Study Area 2
FIGURE 2 Recorded Mean Daily Temperatures in the Nechako River Above the Stuart River Confluence, July 10 to August 20, 2005 8
FIGURE 3 Skins Lake Spillway Releases and Flows in the Nechako River Below Cheslatta Falls and at Vanderhoof, July 10 to September 8, 2005 8
FIGURE 4 Flows in the Nechako River below Cheslatta Falls Resulting from Skins Lake Spillway Releases, July 10 to August 20, 2005 11

ii
List of Tables
TABLE 1 Daily Operations to Manage Water Temperatures in the Nechako River above the Stuart River Confluence 4
TABLE 2 Predicted and Recorded Water Temperatures in the Nechako River at Finmoore July 10 to August 20, 2005 6
TABLE 3 Recorded Mean Daily Water Temperatures in the Nechako River above the Stuart River Confluence, July 10 to August 20, 2005 9
TABLE 4 Rationale for Skins Lake Spillway Release Changes, July 10 to September 7, 2005 10

iii
List of Appendices
APPENDIX A Numerical Example of Water Temperature Trend Calculation
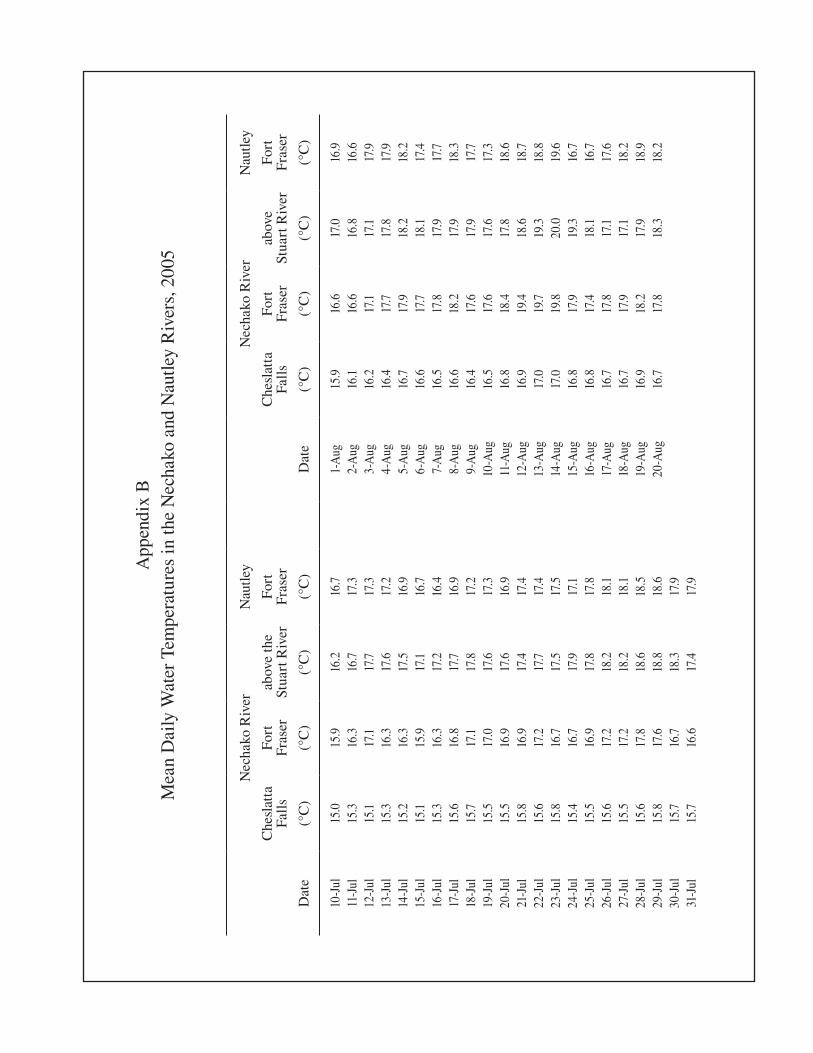
APPENDIX B Mean Daily Water Temperatures in the Nechako and Nautley Rivers, 2005
APPENDIX C Mean Daily Skins Lake Spillway Releases and Flows in the Nechako and Nautley Rivers, 2005
APPENDIX D Recorded and Forecast Meteorological Data
APPENDIX E Summer Water Temperature and Flow Management Project Reservoir Release Volume Calculations for July 10 to August 20, 2005


Page 1
ABSTRACT
The 2005 Nechako River Summer Water Temperature and Flow Management Project (the Project) was undertaken to attempt to prevent mean daily water temperatures in the Nechako River above the Stuart River confluence (at Finmoore) from exceeding 20.0°C (68.0°F) between July 20 and August 20. Water temperatures were managed by regulat-ing Skins Lake Spillway releases to control flows in the Nechako River below Cheslatta Falls and at Vanderhoof. In 2005, mean daily water temperatures in the Nechako River above the Stuart River confluence did not exceed 20.0°C (68.0°F) between July 20 and August 20.
Over the duration of the 2005 Summer Water Temperature and Flow Management Project (July 10 to August 20), the total volume of water released was 6,896.5 m³/s-d, (243,549 cfs-d), and the average release during the Project was 164.2 m³/s (5,800 cfs).
INTRODUCTION
The Nechako River Summer Water Temperature and Flow Management Project (the Project) currently in place was designed and developed in 1982 and has been successfully implemented by Triton Environ-mental Consultants Ltd. (Triton) since 1983. Since 1988, water temperature and flow management proj-ects (Triton 1995a through Triton 1995h, Triton 1996 through Triton 2004) have been carried out under the auspices of the Nechako Fisheries Conservation Program (NFCP).
The objective of the Project is to attempt to prevent mean daily water temperatures in the Nechako River above the Stuart River confluence (at Fin-moore in Figure 1) from exceeding 20.0°C (68.0°F). This objective is met by regulating releases from the Skins Lake Spillway to control flows in the Nechako River below Cheslatta Falls and at Van-derhoof. The Project is operated from July 10 to August 20 (the operational period) with the goal of managing water temperatures in the Nechako River at Finmoore between July 20 and August 20 (the water temperature control period, hereafter referred to as the control period). These dates may vary as directed by the NFCP in accordance with the timing of sockeye runs in the system. Flows in the Nechako River at Cheslatta Falls are also to be reduced to fall spawning flows by early September.
The Project study area is shown in Figure 1. Unless otherwise stated, references to water temperatures, flows (including releases) and meteorological data are mean daily values. As well, the location of the Nechako River above the Stuart River confluence refers to the Nechako River at Finmoore for tem-perature measurements and at Vanderhoof for river discharge measurements..
This report reviews the 2005 Summer Water Temperature and Flow Management Project and includes an outline of the method of determining Skins Lake Spillway releases, a summary of the 2005 Skins Lake Spillway release recommenda-tions for the period July 10 to September 6 inclu-sive, and a summary of recorded flows (July 10 to September 6) and water temperatures (July 10 to August 20) at various locations along the Nechako River. Also discussed is the volume of cooling water used in the 2005 Summer Water Tempera-ture and Flow Management Project.
METHODS
Management of the Nechako River flows and water temperatures in 2005 used water temperature pre-dictions based on five-day meteorological forecasts to determine the schedule of Skins Lake Spill-way releases required to meet project objectives.

FIG
UR
E1
.N
EC
HA
KO
RIV
ER
STU
DY
AR
EA
Ne
ch
ako
Fish
erie
sC
on
serv
atio
nPr
og
ram
Ma
p#
RM
03
-1
N
BR
ITIS
HC
OLU
MB
IA
ALB
ER
TA
PACIF ICOCEAN
Ú
Pri
nc
eG
eo
rge
F raser R.
Va
nc
ou
ve
r
INS
ET
Ú
N
We
stTa
hts
a
Inta
keN
EC
HA
KO
RE
SER
VO
IRK
en
ne
y
Da
m
Ch
esl
att
a
Fall
s
PR
INC
E
GE
OR
GE
FO
RT
FR
ASE
R
VA
ND
ER
HO
OFS tu
ar t
Riv
er
Nechako
Fraser
Riv
er
Ch
esl
att
a
Lake
Mu
rra
y
Lake
Skin
sLa
ke
Spil
lwa
y
Na
utl
ey
Riv
er W
SCSt
ati
on
-N
ec
ha
koR
ive
rb
elo
wC
he
sla
tta
Fall
s
WSC
Sta
tio
n-
Na
utl
ey
Riv
er
ne
ar
Fort
Fra
ser
WSC
Sta
tio
n-
Ne
ch
ako
Riv
er
at
Va
nd
erh
oo
f
FIN
MO
OR
E
(Ne
ch
ako
Riv
er
ab
ov
eSt
ua
rtR
ive
r)
Ri v
er
(Be
rtIr
vin
e's
Lod
ge
)
Stu
dy
Are
a=
050
km(a
pp
rox.
)
Ma
p #
RM
05-1

Page 3
The Summer Water Temperature and Flow Man-agement Project uses an unsteady-state flow rout-ing model and an unsteady-state water temperature prediction model to compute flows and water tem-peratures in the Nechako River daily during the entire operational period.
Daily operations followed the protocol referenced in the Settlement Agreement (Anon. 1987), and involved collection of water temperature and river stage data from several locations in the study area, as well as development of five-day meteorological forecasts. Water temperatures were obtained daily from recorders maintained in the Nechako River below Cheslatta Falls (at Bert Irvine’s Lodge), in the Nechako River at Fort Fraser (upstream of the Nautley River), in the Nechako River above the Stuart River confluence and in the Nautley River. River stages were obtained daily from recorders maintained in the Nechako River below Cheslatta Falls, in the Nechako River at Vanderhoof and from a staff gauge in the Nautley River. Five-day meteo-rological forecasts were provided by World Weath-erwatch as a subconsultant to Triton.
River stage and minimum and maximum water tem-perature data were obtained daily for each identified location except the Nechako River below Cheslatta Falls. At that location, recorded hourly water tem-perature and river stage data were obtained from the data collection platform via computer link to Water Survey of Canada (WSC), Vancouver. Water levels recorded hourly by WSC in Cheslatta Lake at West End were also obtained (via computer link) from the station’s data collection platform. These lake level data were used to assist in the analysis of daily pre-dictions of flow produced by the flow routing model for the Nechako River below Cheslatta Falls, and to account for local inflow to the Cheslatta/Murray Lakes system.
In addition, spot and corresponding recorded water temperatures were collected at each location visited daily and used to adjust the recorded water tem-peratures. The spot data enabled an ongoing check
of each thermograph. If the spot temperature was higher than the thermograph record, the thermograph record was adjusted to agree with the recorded spot temperature for that day. If the thermograph record was higher than the spot temperature, the thermo-graph record was not adjusted. This procedure was implemented as a conservative measure.
The first 10 days of the operational period, July 10 to July 19, were utilized for system start up, for initialization of the database required to sched-ule Skins Lake Spillway releases and to increase flows in the Nechako River from spring flows to the minimum cooling flow of 170 m³/s (6,000 cfs) below Cheslatta Falls. The 2005 Skins Lake Spill-way spring base release as directed by the NFCP was 49.0 m³/s (1,730 cfs). Upon commencement of the operational period on July 10, the recorded flow in the Nechako River below Cheslatta Falls was 141 m³/s (4,980 cfs). This flow was higher than typical for this period, and resulted from a spring spill at Skins Lake Spillway necessary to manage reser-voir water levels. On July 13 and July 14, 2005, the Skins Lake Spillway release was increased to 150 m³/s (5,300 cfs) and 210 m³/s (7,420 cfs), respec-tively to ensure flows in the Nechako River below Cheslatta Falls reached the minimum cooling flow of 170 m³/s (6,000 cfs) by July 20 (the beginning of the water temperature control period).
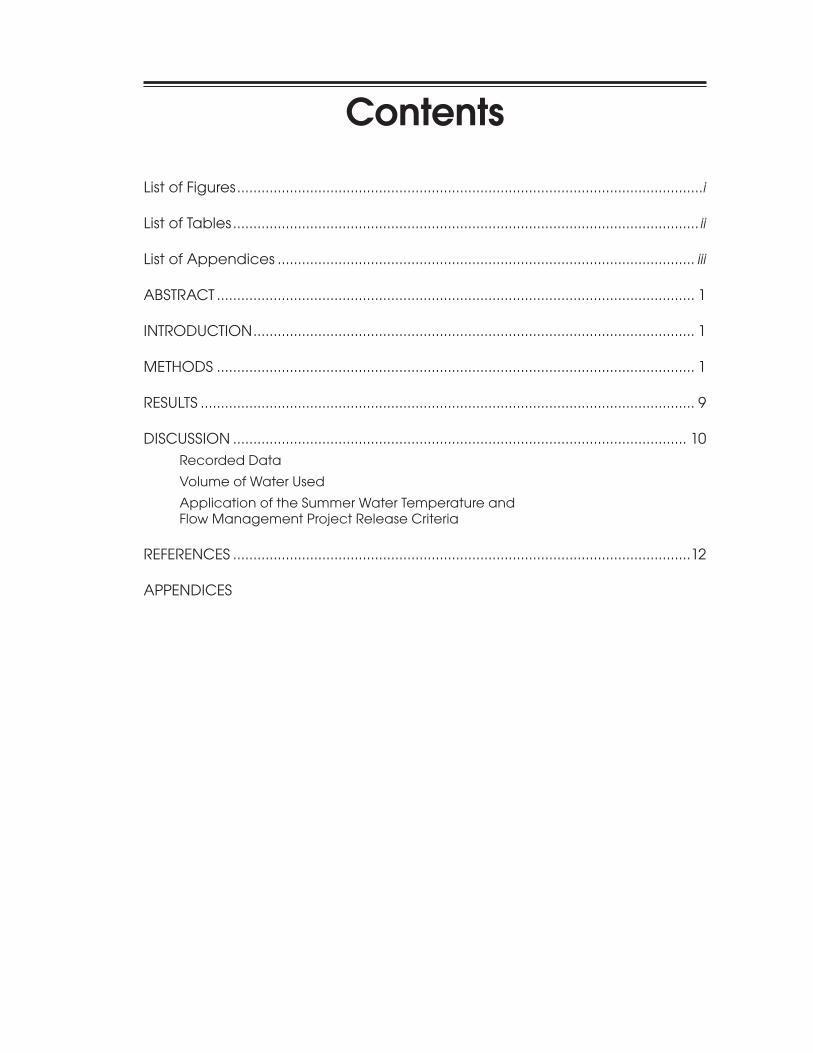
Throughout the operational period, water tempera-tures in the Nechako River were calculated daily for the previous day, the current day and each of the next four days using the unsteady-state flow routing and water temperature prediction models. These calculations were based on recorded and five-day forecast meteorological data, recorded water temperature and computed flow data. Forecast water temperature predictions were tabulated and reviewed daily to identify trends in water tempera-ture changes. These trends are the same as those used in the water temperature and flow management projects since 1984 (Envirocon Ltd. 1985), and are best explained through reference to Table 1.
Page 4
Table 1Daily Operations to Manage Water Temperatures in the Nechako River above the Stuart River Confluence
Date 11-Jul 12-Jul 13-Jul 14-Jul 15-Jul 16-Jul* 17-Jul 18-Jul 19-Jul 20-Jul
Fifth Day’s Predicted a5 b5 c5 Water Temperature
@ Date + 4 Days
Fourth Day’s Predicted a4 b4 c4 Water Temperature
@ Date + 3 Days
Third Day’s Predicted a3 b3 c3 Water Temperature
@ Date + 2 Days
Second Day’s Predicted a2 b2 c2 Water Temperature
@ Date + 1 Day
Current Day’s Predicted a1 b1 c1 Water Temperature @ Date
Previous Day’s Calculated as bs cs observed trend
Water Temperature
@ Date - 1 Day predicted trend
Previous Day’s Recorded ao bo co forecast trend
Water Temperature
@ Date - 1 Day
Current Day’s Release ra rb rc @ Date
* The current day (i.e., the day of operation) for this example is July 16.

Page 5
Assuming the current day is July 16, entries cor-responding to the current day’s operation are rep-resented by the letter c. Entries co and cs represent the recorded and calculated water temperatures, respectively, for the previous day (July 15). Entries c1 through c5 represent predicted water tempera-tures computed using the current day’s five-day meteorological forecast and an assumed current day’s flow regime. The entry rc represents the cur-rent day Skins Lake Spillway release required to meet project objectives.
The following three trends in water temperature changes were reviewed on a day-by-day basis:1. Observed trend; developed from recorded
mean daily water temperatures measured in the Nechako River above the Stuart River conflu-ence each day (bo and co in Table 1). The dif-ference in recorded water temperatures for the previous two days is extrapolated over the next five days to determine the observed water tem-perature trend.
2. Predicted trend; developed from the predicted water temperatures for the previous day and the following five days (cs, c1, c2, c3, c4, c5, in Table 1). These data represent the predicted trend.
3. Forecast trend; developed from the difference between the current five-day and previous five-day predictions for the same calendar days (c3 and b4, c2 and b3, c1 and b2 in Table 1). Dif-ferences between forecasted data on coincident dates for the current day and the next two days only are averaged and added to the fifth day predicted temperature to determine the trend in forecasted temperatures.
A numerical example of how the trends are calcu-lated is presented in Appendix A.
Each day predicted water temperatures for the five-day forecast period were checked and the three trends calculated. If two of the three trends indi-cated that the water temperature in the Nechako River above the Stuart River confluence could
potentially exceed 19.4°C (67.0°F) then an increase in the Skins Lake Spillway release was required. When this occurred the current day’s release was revised and the flow and temperature models were rerun using the modified flow regime. Results of each day’s final computer run were subsequently used to initialize water temperatures for the follow-ing day’s computations. Entries in Table 1 represent each day’s final cooling water release and resultant predicted water temperatures.
The following release criteria were used with the three trends identified above to determine the timing and magnitude of Skins Lake Spillway releases:1. When two of the three trends show an increase
in water temperature in the Nechako River above the Stuart River confluence, and these trends show that potentially the water tempera-ture could exceed 19.4°C (67.0°F), increase the Skins Lake Spillway release according to crite-ria 2 and 3 below.
2. Operate Skins Lake Spillway such that flow in the Nechako River below Cheslatta Falls ranges between 170 m³/s (6,000 cfs) and 283 m³/s (10,000 cfs) as required, and flow in the Nechako River above the Stuart River confluence (as measured at Vanderhoof) does not exceed 340 m³/s (12,000 cfs). It is understood that the flow in the Nechako River below Cheslatta Falls is to be not less than 170 m³/s (6,000 cfs) by the beginning of the control period, and is to be reduced to approximately 31.2 m³/s (1,100 cfs) by September 6.
3. At any time, increase the Skins Lake Spill-way release from the current level to 453 m³/s (16,000 cfs) to achieve the flow changes in the Nechako River as fast as possible.
4. During cooling periods when two of three trends in forecasted water temperatures are decreasing and these trends indicate that poten-tially the water temperature could drop below 19.4°C (67.0°F) within the forecast period (five days), reduce the Skins Lake Spillway release from the current level to 14.2 m³/s (500 cfs).

Tab
le 2
Pre
dict
ed a
nd R
ecor
ded
Wat
er T
empe
ratu
res
in th
e N
echa
ko R
iver
at F
inm
oore
Jul
y 10
to A
ugus
t 20,
200
5(D
ata
Ent
ered
In
Fahr
enhe
it. S
ee B
elow
For
Cel
sius
)
JULY
Dat
e10
1112
1314
1516
1718
1920
2122
2324
2526
2728
2930
31
5th
Day
’s P
redi
cted
W
ater
Tem
pera
ture
at D
ate
+ 4
Day
s62
.262
.763
.363
.164
.365
.164
.063
.563
.563
.762
.963
.363
.463
.564
.164
.363
.963
.8
4th
Day
’s P
redi
cted
Wat
er T
empe
ratu
reat
Dat
e +
3 D
ays
62.2
62.4
62.2
61.8
63.2
64.2
64.4
63.7
63.4
64.0
63.4
63.3
62.9
63.2
64.2
64.5
63.7
63.3
63.5
3rd
Day
’s P
redi
cted
Wat
er T
empe
ratu
reat
Dat
e +
2 D
ays
62.2
62.8
62.1
61.4
62.4
62.3
63.9
64.5
63.5
63.6
63.5
63.6
63.2
62.3
63.6
64.7
64.0
63.2
63.5
64.0
2nd
Day
’s P
redi
cted
Wat
er T
empe
ratu
reat
Dat
e +
1 D
ay62
.263
.163
.162
.362
.861
.462
.764
.964
.463
.763
.963
.864
.762
.563
.065
.064
.763
.864
.265
.764
.6
Cur
rent
Day
’s P
redi
cted
Wat
er T
empe
ratu
reat
Dat
e62
.162
.664
.063
.963
.862
.662
.464
.665
.464
.564
.664
.265
.263
.763
.265
.365
.164
.865
.166
.565
.963
.7
Prev
ious
Day
’s C
alcu
late
dW
ater
Tem
pera
ture
at D
ate
- 1 D
ay62
.263
.264
.264
.463
.862
.763
.264
.865
.364
.864
.464
.764
.664
.064
.265
.364
.965
.265
.866
.665
.463
.6
Prev
ious
Day
’s R
ecor
ded
Wat
er T
empe
ratu
reat
Dat
e - 1
Day
61.2
62.1
63.8
63.6
63.5
62.8
62.9
63.9
64.0
63.7
63.6
63.4
63.9
63.5
64.3
64.0
64.8
64.8
65.5
65.8
64.9
63.4
Cur
rent
Day
’sSk
ins
Lak
e Sp
illw
ayR
elea
se a
t Dat
e(c
fs)
3178
3178
3178
3178 to 5297 @ 1400 hrs
5297 to 7416 @ 1400 hrs
7416
7416
7416
7416
7416
7416
7416
7416
7416
7416
7416 to 1000 @ 1600 hrs
1000 to
6000 @ 1600 hrs
6000
6000
6000
6000
6000

TTa
ble
2 (c
ontin
ued)
Pre
dict
ed a
nd R
ecor
ded
Wat
er T
empe
ratu
res
in th
e N
echa
ko R
iver
at F
inm
oore
Jul
y 10
to A
ugus
t 20,
200
5(D
ata
Ent
ered
In
Fahr
enhe
it. S
ee B
elow
For
Cel
sius
)
A
UG
UST
Dat
e1
23
45
67
89
1011
1213
1415
1617
1819
2021
22
5th
Day
’s P
redi
cted
W
ater
Tem
pera
ture
at D
ate
+ 4
Day
s63
.463
.263
.564
.664
.864
.564
.563
.964
.265
.665
.565
.564
.866
.566
.566
.364
.764
.664
.563
.668
.066
.7
4th
Day
’s P
redi
cted
Wat
er T
empe
ratu
reat
Dat
e +
3 D
ays
63.1
63.1
63.8
64.2
65.2
65.4
64.3
64.7
65.5
65.6
65.6
64.7
65.9
66.2
67.4
65.5
64.5
64.3
63.4
63.6
67.9
66.0
3rd
Day
’s P
redi
cted
Wat
er T
empe
ratu
reat
Dat
e +
2 D
ays
63.5
63.0
63.0
64.8
65.9
64.7
67.2
65.4
65.6
65.6
65.0
65.0
65.7
67.8
67.5
65.6
64.3
62.5
64.0
64.0
67.7
65.7
2nd
Day
’s P
redi
cted
Wat
er T
empe
ratu
reat
Dat
e +
1 D
ay62
.962
.463
.565
.465
.067
.466
.265
.265
.965
.864
.665
.867
.369
.168
.066
.262
.364
.064
.765
.667
.8
Cur
rent
Day
’s P
redi
cted
Wat
er T
empe
ratu
reat
Dat
e62
.662
.963
.964
.866
.566
.964
.366
.165
.964
.765
.266
.568
.168
.868
.464
.463
.764
.365
.365
.9
Prev
ious
Day
’s C
alcu
late
dW
ater
Tem
pera
ture
at D
ate
- 1 D
ay62
.963
.063
.665
.966
.865
.964
.466
.065
.264
.865
.366
.567
.768
.767
.864
.763
.763
.965
.3
Prev
ious
Day
’s R
ecor
ded
Wat
er T
empe
ratu
reat
Dat
e - 1
Day
62.6
62.3
62.8
64.1
64.8
64.6
64.3
64.2
64.3
63.6
64.0
65.5
66.7
68.0
66.7
64.6
62.8
62.8
64.2
65.0
see
Cur
rent
Day
’sSk
ins
Lak
e Sp
illw
ayR
elea
se a
t Dat
e(c
fs)
6000
6000
6000
6000
6000 to
1600
0@ 1600 hrs
1600
0to 50
0@ 1600 hrs
500
to
6000 @ 1600 hrs
6000
6000
Not
e 2
6000
6000
6000
6000
6000
6000
6000
6000
6000 to
500
@ 1600 hrs
500
500
Page 8
Figure 2Recorded Mean Daily Temperatures in the Nechako River Above the Stuart River Confluence,
July 10 to August 20, 2003
Figure 3Skins Lake Spillway Releases and Flows in the Nechako River Below Cheslatta Falls and at Vanderhoof,
July 10 to September 8, 2005
15.0
16.0
17.0
18.0
19.0
20.0
21.0
22.0
10 15 20 25 30 4 9 14 19
Date
Tem
pe
ratu
re (
°C)
Operational Period (July 10 to August 20)
Control Period (July 20 to August 20)
July August
0
50
100
150
200
250
300
350
400
450
500
10 15 20 25 30 4 9 14 19 24 29 3 8
Date
Flo
w (
m/s
)
July August
453 m /s
340 m /s
283 m /s
170 m /s
Skins Lake Spillway Release
Vanderhoof
Cheslatta Falls
September
14.2

Page 9
RESULTS
Predicted and recorded mean daily water tem-peratures for the Nechako River above the Stuart River confluence, Skins Lake Spillway releases and changes in Skins Lake Spillway releases over the duration of the Project operational period are sum-marized in Table 2. Note that Skins Lake Spillway releases reported are as requested by Triton. All Nechako River and Nautley River flow data reported are preliminary data, and are part of the database utilized in the daily operation of the Summer Water Temperature and Flow Management Project. These flow data are not updated as it is the preliminary data that was used in real-time modelling of the Nechako River system. Therefore, values presented may differ slightly from those reported by WSC.
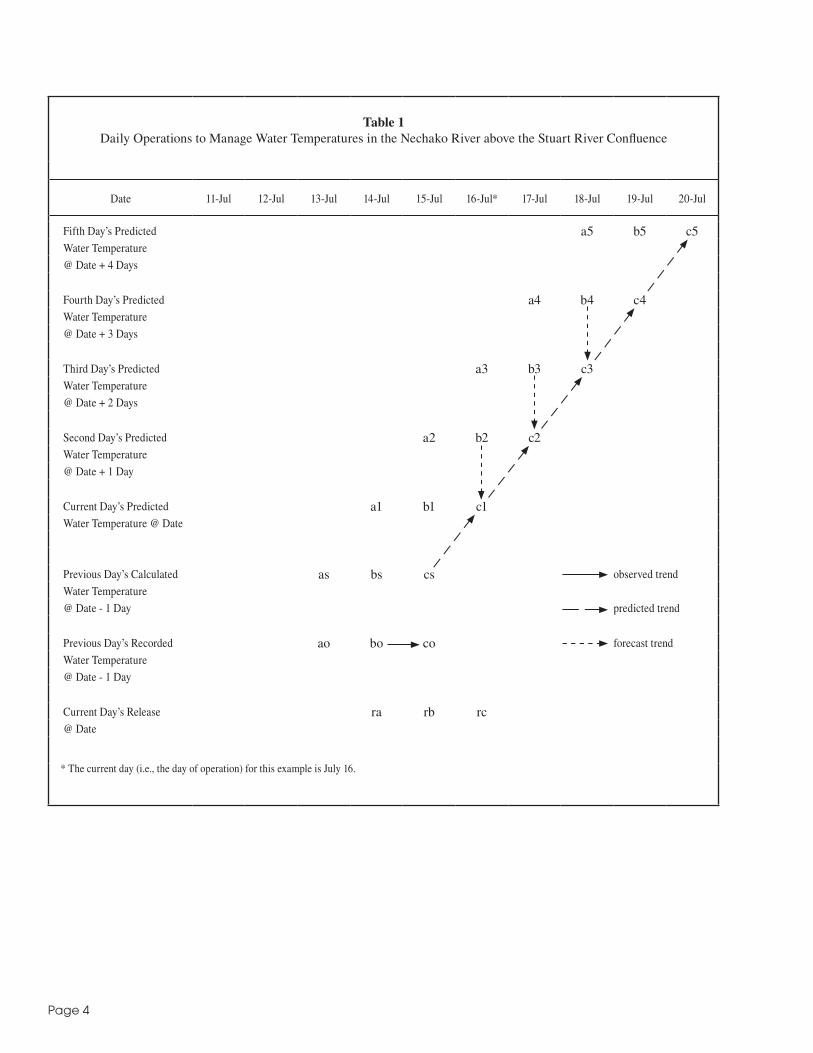
Mean daily water temperatures recorded during the control period in the Nechako River above the Stu-art River confluence (Figure 2 and Table 3) did not exceed 20.0°C (68.0°F). The respective minimum and maximum mean daily water temperatures recorded during the control period were 16.8°C (62.2°F) on August 2 and 20.0°C (68.0°F) on August 14. Mean daily water temperatures recorded during the summer of 2005 in the Nechako River below Cheslatta Falls, near Fort Fraser and above the Stu-art River confluence, and in the Nautley River near Fort Fraser is presented in Appendix B.
As outlined in the Methods section, Skins Lake Spillway releases required for water temperature control were regulated during the control period with the objective of maintaining flows in the Nechako River below Cheslatta Falls between 170 m³/s (6,000 cfs) and 283 m³/s (10,000 cfs) and flows at Vanderhoof at or below 340 m³/s (12,000 cfs).
Skins Lake Spillway releases and their correspond-ing flows in the Nechako River below Cheslatta Falls and at Vanderhoof are plotted in Figure 3. Daily Skins Lake Spillway releases, flows in the Nechako River below Cheslatta Falls and at Vanderhoof, and Nautley River flows are tabulated in Appendix C.
A record of Skins Lake Spillway release changes during the Project and the reasoning behind them is presented in Table 4.
During the control period, mean daily flows mea-sured in the Nechako River below Cheslatta Falls (based on preliminary WSC data from the WSC data collection platform at Bert Irvine’s Lodge) ranged between a maximum of 213 m³/s (7,520 cfs) on August 7 and a minimum of 153 m³/s (5,400 cfs) on August 20. Mean daily flows measured in the Nechako River at Vanderhoof ranged between a maximum of 290 m³/s (10,240 cfs) on August 9 and a minimum of 244 m³/s (8,620 cfs) on August 19. Following the control period, the mean daily flow in the Nechako River below Cheslatta Falls was reduced to 43.4 m³/s (1,530 cfs) by September 6.
Table 3
Recorded Mean Daily Water Temperatures in the Nechako River above the Stuart River Confluence,
July 10 to August 20, 2005
DateWater
Temperature(°C)
DateWater
Temperature(°C)
10-Jul 16.2 1-Aug 17.0
11-Jul 16.7 2-Aug 16.8
12-Jul 17.7 3-Aug 17.1
13-Jul 17.6 4-Aug 17.8
14-Jul 17.5 5-Aug 18.2
15-Jul 17.1 6-Aug 18.1
16-Jul 17.2 7-Aug 17.9
17-Jul 17.7 8-Aug 17.9
18-Jul 17.8 9-Aug 17.9
19-Jul 17.6 10-Aug 17.6
20-Jul 17.6 11-Aug 17.8
21-Jul 17.4 12-Aug 18.6
22-Jul 17.7 13-Aug 19.3
23-Jul 17.5 14-Aug 20.0
24-Jul 17.9 15-Aug 19.3
25-Jul 17.8 16-Aug 18.1
26-Jul 18.2 17-Aug 17.1
27-Jul 18.2 18-Aug 17.1
28-Jul 18.6 19-Aug 17.9
29-Jul 18.8 20-Aug 18.3
30-Jul 18.3
31-Jul 17.4

Page 10
DISCUSSION
The discussion of the 2005 Summer Water Tem-perature and Flow Management Project has been divided into four sections. The first section reviews the collection and use of recorded field data. Vari-ables measured include water temperature, flow, and meteorological data (recorded and forecast). The second section discusses the volume of water used during the 2005 Summer Water Temperature and Flow Management Project. The third section provides a brief discussion of the application of the Project release criteria.
Recorded Data
The modelling procedure is based on the premise that the best way to forecast water temperatures is to initialize computations with recorded conditions. For this reason, the quality of the field data used in the modelling process directly affects the accuracy of the computed water temperatures. Therefore, data must be collected accurately and consistently to ensure that random errors are kept to a minimum. Further,
consistency in data collection techniques also ensures that, if a bias exists in the data, it remains relatively constant throughout the project.
In 2005, flow data obtained from gauging stations in the Nechako River below Cheslatta Falls, in the Nechako River at Vanderhoof and in the Naut-ley River near Fort Fraser appeared to be accu-rate. Flows in the Nechako River below Cheslatta Falls and at Vanderhoof responded as expected in response to Skins Lake Spillway releases. The Naut-ley River flow regime was below average throughout the Project operational period. The ability to obtain hourly stage data from the gauging stations located on the Nechako River below Cheslatta Falls and at the west end of Cheslatta Lake proved very useful in verifying the daily predictions of the flow rout-ing model and accounting for changes in the local inflow to the Cheslatta/Murray Lakes system.
As previously stated, spot and corresponding recorder (thermograph) water temperatures were collected in the Nechako River at Fort Fraser (upstream of the Nautley River), in the Nechako River above the Stu-art River confluence and in the Nautley River during
Table 4Rationale for Skins Lake Spillway Release Changes, July 10 to September 7, 2005
Date2005
OldSetting(m³/s)
NewSetting(m³/s)
Time ofChange
(hrs)Reason for Changing SLS Release Setting
13-Jul 90.0 150 1400 Spring spill used to attain a flow of 170 m³/s in the Nechako River below Cheslatta Falls by July 20
14-Jul 150 210 1400 Spring spill used to attain a flow of 170 m³/s in the Nechako River below Cheslatta Falls by July 20
25-Jul 210 28.3 1600 Flow control
26-Jul 28.3 170 1600 Flow control
5-Aug 170 453 1600 In response to a predicted warming trend
6-Aug 453 14.2 1600 In response to a predicted cooling trend
7-Aug 14.2 170 1600 Flow control
18-Aug 170 14.2 1600 To achieve spawning flow in the Nechako River below Cheslatta Falls by early September
1-Sep 14.2 32.0 1100 To achieve spawning flow in the Nechako River below Cheslatta Falls

Page 11
each site visit. The thermograph water temperatures were not consistently higher or lower than their associated spot temperatures. These data were used to adjust water temperatures following the method outlined in the Methods section of this report.
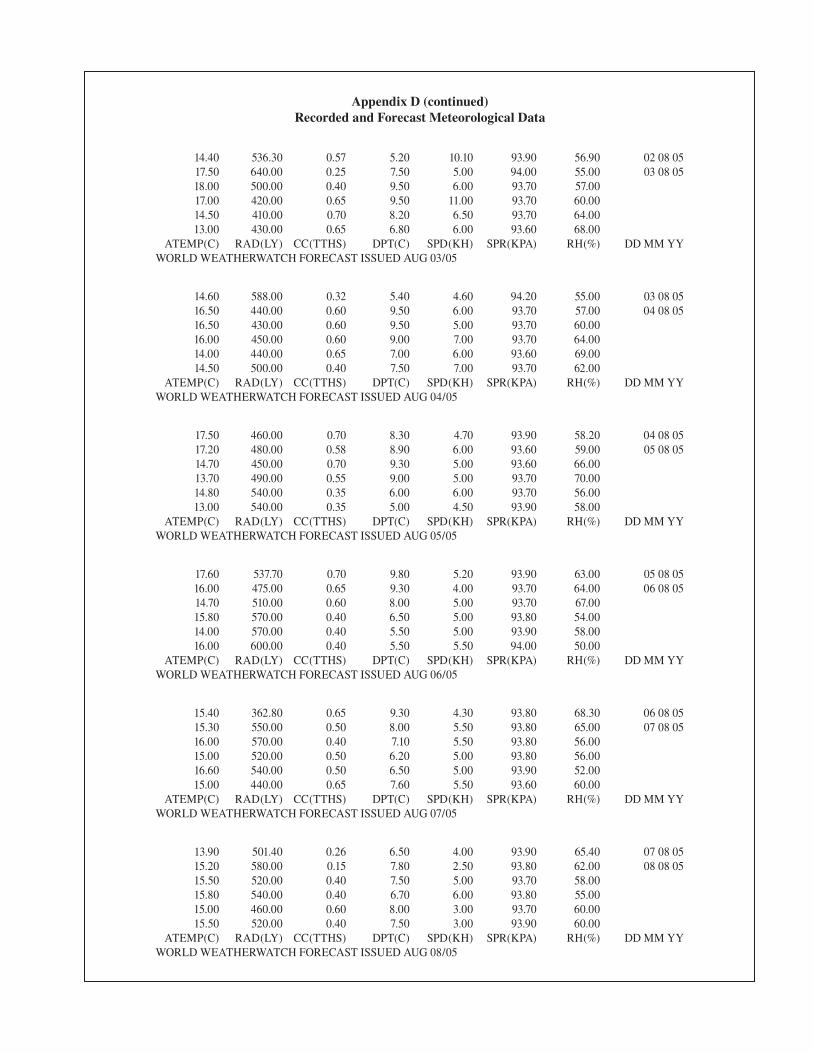
Recorded and forecast meteorological data were obtained daily from World Weatherwatch, a sub-consultant to Triton. The forecast weather data were developed using recorded weather data acquired from the Atmospheric Environmental Service (AES) station at Prince George Airport and from the meteorological monitoring station installed by
Triton at Fort Fraser. The recorded and forecast weather data were used to estimate water tempera-tures in the Nechako River below Cheslatta Falls and in the Nautley River for the current day and following four days. A listing of the recorded and forecast meteorological data is provided in Appen-dix D.
Volume of Water Used
Figure 4 presents the recorded flows in the Nechako River below Cheslatta Falls for the 2005 Summer
0
50
100
150
200
250
300
350
10 15 20 25 30 4 9 14 19
Date
Flo
w (
m/s
)
Recorded Cooling Water Volume Above the SLS Spring Base Release Volume
Skins Lake Spillway Spring Base Release Volume (including spring spill)
July August
Skins Lake Spillway Spring Base Release (49.0 m /s)
Minimum Cooling Flow Required by Project Guidelines (170 m /s)(July 20 to August 20, 2005)
Figure 4Flows in the Nechako River below Cheslatta Falls Resulting from Skins Lake Spillway Releases,
July 10 to August 20, 2005

Page 12
Water Temperature and Flow Management Proj-ect. Also indicated is the minimum cooling flow of 170 m³/s (6,000 cfs) in the Nechako River below Cheslatta Falls, and the Skins Lake Spillway spring base release of 49.0 m³/s (1,730 cfs) as determined by the NFCP Technical Committee as part of the “Annual Water Allocation” defined in the 1987 Set-tlement Agreement (Anon. 1987).
The total volume of water released during the 2005 Summer Water Temperature and Flow Manage-ment Project operational period was 6,896.5 m³/s-d, (243,549 cfs-d). The volume released for cooling purposes was 4,908.1 m³/s-d (173,331 cfs-d), and is based on an assumed Skins Lake Spillway release of 49.0 m³/s (1,730 cfs) for the period July 10 to August 18, inclusive, with a reduction to 14.2 m³/s (500 cfs) until August 20. The average release during the operational period was 164.2 m³/s (5,800 cfs). Vol-ume calculations are presented in Appendix E.
Application of the Summer Water Temperature and Flow Management Project Release Criteria
The Summer Water Temperature and Flow Man-agement Project is very sensitive to the accuracy of meteorological forecasting. If an increase or decrease in temperature occurs over a prolonged period of time (three or four days), inaccurate meteorological forecasts may predict the reversal of the temperature change prematurely. In these instances, it may be required to exercise judgment when applying the Summer Water Temperature and Flow Management Project release criteria used with the three water temperature trends. This judgment is based on experience gained in the operation of the Summer Water Temperature and Flow Manage-ment Project since 1984 and may result in excep-tions to the decision based on strict adherence to the release criteria. No exceptions were made to the application of the release criteria during the entire 2005 operational period.
REFERENCES
Anon. 1987. The 1987 Settlement Agreement between Alcan Aluminium Ltd. and Her Majesty the Queen in Right of Canada, represented by the Minister of Fisheries and Oceans, and her Majesty the Queen in Right of the Province of British Columbia, represented by the Ministry of Energy, Mines and Petroleum Resources.
Envirocon Limited. 1985. Review of the 1984 Nechako River Hydrothermal Monitoring and Control Program. Technical Memorandum 1941/C. Chapter 2.0, Methods. Prepared for Alcan Smelters and Chemicals Ltd.
Triton Environmental Consultants Ltd. 1995a. The 1988 Summer Water Temperature and Flow Management Project. Nechako Fisheries Conservation Program Technical Report No. RM88-5.
Triton Environmental Consultants Ltd. 1995b. The 1989 Summer Water Temperature and Flow Management Project. Nechako Fisheries Conservation Program Technical Report No. RM89-2.
Triton Environmental Consultants Ltd. 1995c. The 1990 Summer Water Temperature and Flow Management Project. Nechako Fisheries Conservation Program Technical Report No. RM90-2.
Triton Environmental Consultants Ltd. 1995d. The 1991 Summer Water Temperature and Flow Management Project. Nechako Fisheries Conservation Program Technical Report No. RM91-2.
Triton Environmental Consultants Ltd. 1995e. The 1992 Summer Water Temperature and Flow Management Project. Nechako Fisheries Conservation Program Technical Report No. RM92-2.

Page 13
Triton Environmental Consultants Ltd. 1995f. The 1993 Summer Water Temperature and Flow Management Project. Nechako Fisheries Conservation Program Technical Report No. RM93-2.
Triton Environmental Consultants Ltd. 1995g. The 1994 Summer Water Temperature and Flow Management Project. Nechako Fisheries Conservation Program Technical Report No. RM94-1.
Triton Environmental Consultants Ltd. 1995h. The 1995 Summer Water Temperature and Flow Management Project. Nechako Fisheries Conservation Program Technical Report No. RM95-2.
Triton Environmental Consultants Ltd. 1996. The 1996 Summer Water Temperature and Flow Management Project. Nechako Fisheries Conservation Program Technical Report No. RM96-1.
Triton Environmental Consultants Ltd. 1997. The 1997 Summer Water Temperature and Flow Management Project. Nechako Fisheries Conservation Program Technical Report No. RM97-1.
Triton Environmental Consultants Ltd. 1998. The 1998 Summer Water Temperature and Flow Management Project. Nechako Fisheries Conservation Program Technical Report No. RM98-1.
Triton Environmental Consultants Ltd. 1999. The 1999 Summer Water Temperature and Flow Management Project. Nechako Fisheries Conservation Program Technical Report No. RM99-1.
Triton Environmental Consultants Ltd. 2000. The 2000 Summer Water Temperature and Flow Management Project. Nechako Fisheries Conservation Program Technical Report No. RM00-1.
Triton Environmental Consultants Ltd. 2001. The 2001 Summer Water Temperature and Flow Management Project. Nechako Fisheries Conservation Program Technical Report No. RM01-1.
Triton Environmental Consultants Ltd. 2002. The 2002 Summer Water Temperature and Flow Management Project. Nechako Fisheries Conservation Program Technical Report No. RM02-1.
Triton Environmental Consultants Ltd. 2003. The 2003 Summer Water Temperature and Flow Management Project. Nechako Fisheries Conservation Program Technical Report No. RM03-1. In preparation.
Triton Environmental Consultants Ltd. 2004. The 2004 Summer Water Temperature and Flow Management Project. Nechako Fisheries Conservation Program Technical Report No. RM04-1. In preparation.

APPENDIX ANumerical Example of Water
Temperature Trend Calculation


Appendix ANumerical Example of Water Temperature Trend Calculation
From data for July 16 date of operation (Table A1).
1. Observed Trend
The observed trend is up by 1.4°C from 20.4°C (J14) to 21.8°C (J15). Take the previ-ous day’s recorded temperature 21.8°C (J15) and extrapolate the trend for five days at 1.4°C. The observed trend shows that the water temperature could potentially reach 21.8°C + 5(1.4°C) = 28.8°C.
2. Predicted Trend
The predicted trend is the difference between the previous day’s calculated water temperature (J15) and the fifth day predicted water temperature (J20). The predicted trend is down from 22.2°C to 19.2°C with the potential to reach 19.2°C.
3. Forecast Trend
The forecast trend for the current day of July 16 is based on the first, second and third day forecasts.
July 16 22.3 to 22.8 = up 0.5°C July 17 21.6 to 21.9 = up 0.3°C uly 18 20.6 to 20.8 = up 0.2°C Mean of 3 differences = up 0.3°C
This mean of 0.3°C is added to the fifth day predicted water temperature to give 19.2°C + (0.3°C) = 19.5°C.

Appendix A (continued)Numerical Example of Water Temperature Trend Calculation
Table A1: Predicted and Recorded Mean Daily Water Temperatures in the Nechako River above the Stuart River Confluence, 2005
JULY
Date 10 11 12 13 14 15 16 17 18 19 20
5th Day’s Predicted Water Temperature
at Date + 4 Days16.8 17.0 17.4 17.3 18.0 18.4 17.8
4th Day’s PredictedWater Temperature
at Date + 3 Days16.8 16.9 16.8 16.6 17.3 17.9 18.0
3rd Day’s PredictedWater Temperature
at Date + 2 Days16.8 17.1 16.7 16.4 16.9 16.9 17.7
2nd Day’s PredictedWater Temperature
at Date + 1 Day16.8 17.3 17.2 16.8 17.1 16.4 17.0
Current Day’s PredictedWater Temperature
at Date16.7 17.0 17.8 17.7 17.7 17.0 16.9
Previous Day’s CalculatedWater Temperature
at Date - 1 Day16.8 17.3 17.9 18.0 17.7 17.1
Previous Day’s RecordedWater Temperature
at Date - 1 Day16.2 16.7 17.7 17.6 17.5 17.1
Current Day’sSkins Lake Spillway
Release at Date(m³/s)
90.0 90.0 90 90to
149.993@
1400hrs
150to
209.996@
1400hrs
210 210
APPENDIX BMean Daily Water Temperatures in the Nechako
and Nautley Rivers, 2005

App
endi
x B
Mea
n D
aily
Wat
er T
empe
ratu
res
in th
e N
echa
ko a
nd N
autle
y R
iver
s, 2
005
Nec
hako
Riv
erN
autle
yN
echa
ko R
iver
Nau
tley
Che
slat
taFa
lls
Fort
Fras
erab
ove
the
Stua
rt R
iver
Fort
Fras
erC
hesl
atta
Fall
sFo
rtFr
aser
abov
eSt
uart
Riv
erFo
rtFr
aser
Dat
e(°
C)
(°C
)(°
C)
(°C
)D
ate
(°C
)(°
C)
(°C
)(°
C)
10-J
ul15
.015
.916
.216
.71-
Aug
15.9
16.6
17.0
16.9
11-J
ul15
.316
.316
.717
.32-
Aug
16.1
16.6
16.8
16.6
12-J
ul15
.117
.117
.717
.33-
Aug
16.2
17.1
17.1
17.9
13-J
ul15
.316
.317
.617
.24-
Aug
16.4
17.7
17.8
17.9
14-J
ul15
.216
.317
.516
.95-
Aug
16.7
17.9
18.2
18.2
15-J
ul15
.115
.917
.116
.76-
Aug
16.6
17.7
18.1
17.4
16-J
ul15
.316
.317
.216
.47-
Aug
16.5
17.8
17.9
17.7
17-J
ul15
.616
.817
.716
.98-
Aug
16.6
18.2
17.9
18.3
18-J
ul15
.717
.117
.817
.29-
Aug
16.4
17.6
17.9
17.7
19-J
ul15
.517
.017
.617
.310
-Aug
16.5
17.6
17.6
17.3
20-J
ul15
.516
.917
.616
.911
-Aug
16.8
18.4
17.8
18.6
21-J
ul15
.816
.917
.417
.412
-Aug
16.9
19.4
18.6
18.7
22-J
ul15
.617
.217
.717
.413
-Aug
17.0
19.7
19.3
18.8
23-J
ul15
.816
.717
.517
.514
-Aug
17.0
19.8
20.0
19.6
24-J
ul15
.416
.717
.917
.115
-Aug
16.8
17.9
19.3
16.7
25-J
ul15
.516
.917
.817
.816
-Aug
16.8
17.4
18.1
16.7
26-J
ul15
.617
.218
.218
.117
-Aug
16.7
17.8
17.1
17.6
27-J
ul15
.517
.218
.218
.118
-Aug
16.7
17.9
17.1
18.2
28-J
ul15
.617
.818
.618
.519
-Aug
16.9
18.2
17.9
18.9
29-J
ul15
.817
.618
.818
.620
-Aug
16.7
17.8
18.3
18.2
30-J
ul15
.716
.718
.317
.931
-Jul
15.7
16.6
17.4
17.9

APPENDIX CMean Daily Skins Lake Spillway Releases and Flows
in the Nechako and Nautley Rivers, 2005


Date
Skins Lake SpillwayRelease(m³/s)
Nechako River Nautley RiverFort
Fraser(m³/s)
Cheslatta Falls(m³/s)
At Vanderhoof
(m³/s)
10 90.0 141.0 254.0 46.5
11 90.0 133.0 245.0 47.1
12 90.0 125.0 234.0 44.6
13 90.0 to 150@ 1400 hrs
120.0 222.0 44.1
14 150 to 210@ 1400 hrs
116.0 215.0 43.6
15 210 119.0 209.0 43.1
16 210 131.0 208.0 42.7
17 210 142.0 216.0 42.2
18 210 151.0 230.0 41.7
19 210 161.0 242.0 40.7
20 210 167.0 252.0 40.3
21 210 174.0 261.0 39.3
22 210 179.0 264.0 38.4
23 210 185.0 269.0 37.9
24 210 189.0 277.0 37.0
25 210 to 28.3@ 1600 hrs
193.0 280.0 36.3
26 28.3 to 170@ 1600 hrs
193.0 287.8 35.5
27 170 190.0 280.0 34.7
28 170 169.0 283.6 34.3
29 170 169.0 283.6 33.6
30 170 169.0 283.6 32.4
31 170 169.0 283.6 32.0
1 170 171.0 283.6 34.0
2 170 171.0 283.6 31.8
3 170 171.0 266.0 30.3
4 170 171.0 263.0 29.9
5 170 to 453@ 1600 hrs
170.0 262.0 29.1
6 453 to 14.2@ 1600 hrs
173.0 263.0 30.9
7 14.2 to 170@ 1600 hrs
213.0 263.0 30.5
8 170 193.0 286.0 29.7
Appendix CMean Daily Skins Lake Spillway Releases and Flows
in the Nechako and Nautley Rivers, 2005

Date
Skins Lake SpillwayRelease(m³/s)
Nechako River Nautley RiverFort
Fraser(m³/s)
Cheslatta Falls(m³/s)
At Vanderhoof
(m³/s)
9 170 185.0 290.0 27.8
10 170 182.0 276.0 27.4
11 170 180.0 266.0 26.5
12 170 177.0 264.0 25.8
13 170 176.6 261.0 25.8
14 170 175.6 257.0 24.8
15 170 174.0 257.0 24.1
16 170 172.0 249.0 23.8
17 170 173.0 251.0 23.5
18 170 to 14.2@ 1600 hrs
170.0 250.0 24.0
19 14.2 169.0 244.0 22.2
20 14.2 153.0 249.0 23.7
21 14.2 133.0 215.0
22 14.2 118.0 212.0
23 14.2 105.0 193.0
24 14.2 93.0 176.0
25 14.2 83.3 160.0
26 14.2 74.8 146.0
27 14.2 69.2 135.0
28 14.2 65.0 129.0
29 14.2 61.2 124.0
30 14.2 57.1 119.0
31 14.2 53.4 114.0
1 14.2 to 32.0@ 1100 hrs
49.9 108.0
2 32.0 47.9 104.0
3 32.0 46.5 101.0
4 32.0 45.3 97.8
5 32.0 44.2 95.4
6 32.0 43.4 93.3
7 32.0 42.8 90.9
8 32.0 42.4 89.3
Appendix C (continued)Mean Daily Skins Lake Spillway Releases and Flows
in the Nechako and Nautley Rivers, 2005

APPENDIX DRecorded and Forecast Meteorological Data


Appendix DRecorded and Forecast Meteorological Data
12.10 443.82 0.79 7.60 10.80 92.80 75.50 9 07 0513.00 400.00 0.70 7.40 7.00 93.30 65.00 10 07 0514.20 550.00 0.30 5.50 5.00 93.50 60.0015.50 390.00 0.60 8.50 5.00 93.40 68.0014.50 420.00 0.70 9.50 12.00 93.50 70.0014.30 480.00 0.40 7.00 6.00 93.30 62.00
ATEMP(C) RAD(LY) CC(TTHS) DPT(C) SPD(KH) SPR(KPA) RH(%) DD MM YYWORLD WEATHERWATCH FORECAST ISSUED JUL 10/05
12.70 484.50 0.65 6.50 6.70 93.30 67.60 10 07 0513.80 590.00 0.25 6.00 5.00 93.40 62.00 11 07 0515.40 420.00 0.55 8.50 5.00 93.40 65.0014.80 400.00 0.65 9.50 13.00 93.50 68.0014.30 490.00 0.40 7.20 7.00 93.40 65.0014.50 570.00 0.30 6.00 6.00 93.50 60.00
ATEMP(C) RAD(LY) CC(TTHS) DPT(C) SPD(KH) SPR(KPA) RH(%) DD MM YYWORLD WEATHERWATCH FORECAST ISSUED JUL 11/05
14.60 690.70 0.33 5.90 6.30 93.40 61.10 11 07 0513.50 180.00 0.95 10.00 8.00 93.50 75.00 12 07 0515.00 440.00 0.71 9.00 17.50 94.00 65.0014.00 350.00 0.75 7.00 6.50 94.00 60.0014.30 420.00 0.75 9.50 5.50 93.30 70.0016.70 590.00 0.40 7.00 3.00 93.20 55.00
ATEMP(C) RAD(LY) CC(TTHS) DPT(C) SPD(KH) SPR(KPA) RH(%) DD MM YYWORLD WEATHERWATCH FORECAST ISSUED JUL 12/05
14.30 283.20 0.88 10.90 7.30 93.60 81.30 12 07 0514.80 380.00 0.75 9.00 11.60 93.90 68.00 13 07 0514.50 330.00 0.77 7.30 12.10 93.70 65.0014.50 315.00 0.80 9.70 5.20 93.10 71.0015.60 480.00 0.62 8.30 10.10 93.40 60.0016.60 560.00 0.46 7.50 9.80 93.70 58.00
ATEMP(C) RAD(LY) CC(TTHS) DPT(C) SPD(KH) SPR(KPA) RH(%) DD MM YYWORLD WEATHERWATCH FORECAST ISSUED JUL 13/05
14.90 422.10 0.73 9.30 10.60 93.90 71.80 13 07 0513.90 440.00 0.65 6.90 11.00 93.70 63.00 14 07 0513.80 320.00 0.85 8.70 9.50 93.10 72.0015.50 460.00 0.71 8.20 7.80 93.20 62.0016.40 545.00 0.42 8.30 7.20 93.50 59.0014.90 560.00 0.45 6.10 8.60 92.90 52.00
ATEMP(C) RAD(LY) CC(TTHS) DPT(C) SPD(KH) SPR(KPA) RH(%) DD MM YYWORLD WEATHERWATCH FORECAST ISSUED JUL 14/05
14.50 391.20 0.64 6.90 9.20 94.00 60.60 14 07 0512.40 210.00 0.95 9.20 4.70 93.40 84.00 15 07 0515.00 450.00 0.66 8.80 11.50 93.40 65.0017.10 570.00 0.35 9.00 8.10 93.70 57.0015.70 580.00 0.39 6.80 9.10 93.10 54.0015.00 540.00 0.44 6.20 7.10 93.10 52.00
ATEMP(C) RAD(LY) CC(TTHS) DPT(C) SPD(KH) SPR(KPA) RH(%) DD MM YYWORLD WEATHERWATCH FORECAST ISSUED JUL 15/05

Appendix D (continued)Recorded and Forecast Meteorological Data
12.00 187.10 0.96 9.80 3.60 93.40 87.10 15 07 0514.20 390.00 0.84 9.60 6.70 93.40 68.00 16 07 0518.10 540.00 0.41 8.50 9.90 93.60 55.0015.60 510.00 0.46 7.20 8.70 93.00 58.0014.50 490.00 0.51 6.00 6.50 93.10 53.0014.60 420.00 0.48 5.80 3.50 93.20 55.00
ATEMP(C) RAD(LY) CC(TTHS) DPT(C) SPD(KH) SPR(KPA) RH(%) DD MM YYWORLD WEATHERWATCH FORECAST ISSUED JUL 16/05
14.80 397.60 0.81 9.80 5.50 93.60 73.80 16 07 0517.80 540.00 0.45 9.50 9.00 93.70 62.00 17 07 0515.00 500.00 0.55 8.00 8.00 93.00 65.0014.20 490.00 0.50 6.50 6.00 93.00 50.0014.20 450.00 0.50 6.00 4.00 93.20 55.0015.50 570.00 0.30 5.50 3.00 93.40 52.00
ATEMP(C) RAD(LY) CC(TTHS) DPT(C) SPD(KH) SPR(KPA) RH(%) DD MM YYWORLD WEATHERWATCH FORECAST ISSUED JUL 17/05
17.90 518.40 0.51 10.30 12.00 93.80 63.90 17 07 0514.80 530.00 0.45 6.00 11.00 93.10 52.00 18 07 0514.20 490.00 0.50 6.50 6.50 93.00 50.0014.50 460.00 0.50 6.50 8.00 92.90 55.0015.50 570.00 0.30 5.80 6.50 93.40 50.0013.00 410.00 0.60 3.50 6.00 93.00 55.00
ATEMP(C) RAD(LY) CC(TTHS) DPT(C) SPD(KH) SPR(KPA) RH(%) DD MM YYWORLD WEATHERWATCH FORECAST ISSUED JUL 18/05
16.40 525.80 0.48 5.40 11.80 93.20 48.90 18 07 0514.10 510.00 0.50 6.40 8.50 93.10 55.00 19 07 0514.20 480.00 0.55 6.30 8.50 93.00 58.0015.50 570.00 0.35 5.60 5.50 93.55 51.0015.00 440.00 0.60 5.00 6.50 93.00 53.0014.00 350.00 0.80 9.00 10.00 93.10 72.00
ATEMP(C) RAD(LY) CC(TTHS) DPT(C) SPD(KH) SPR(KPA) RH(%) DD MM YYWORLD WEATHERWATCH FORECAST ISSUED JUL 19/05
13.20 576.70 0.39 6.00 5.50 93.20 64.00 19 07 0513.20 400.00 0.70 7.80 8.50 93.40 65.00 20 07 0515.00 560.00 0.40 6.40 6.50 93.60 53.0016.00 480.00 0.50 6.00 7.00 93.10 51.0014.70 370.00 0.75 9.40 10.80 93.25 72.0014.00 400.00 0.70 7.80 9.80 93.70 66.00
ATEMP(C) RAD(LY) CC(TTHS) DPT(C) SPD(KH) SPR(KPA) RH(%) DD MM YYWORLD WEATHERWATCH FORECAST ISSUED JUL 20/05
12.10 351.57 0.64 8.00 4.80 93.50 76.40 20 07 0514.00 570.00 0.35 7.00 3.50 93.80 60.00 98145.45216.00 480.00 0.50 7.00 7.00 93.10 55.0015.00 360.00 0.75 9.00 10.00 93.30 70.0014.30 420.00 0.65 6.90 8.80 93.70 63.0015.00 550.00 0.40 7.00 4.80 93.90 59.00
ATEMP(C) RAD(LY) CC(TTHS) DPT(C) SPD(KH) SPR(KPA) RH(%) DD MM YYWORLD WEATHERWATCH FORECAST ISSUED JUL 21/05

Appendix D (continued)Recorded and Forecast Meteorological Data
13.40 657.70 0.32 6.10 3.40 93.90 66.30 21 07 0516.00 540.00 0.50 8.00 10.00 93.10 58.00 22 07 0514.30 330.00 0.80 9.50 11.00 93.30 72.0014.30 420.00 0.70 7.30 7.80 93.80 63.0015.40 550.00 0.40 6.50 4.70 94.00 57.0014.20 410.00 0.65 7.80 4.00 94.10 65.00
ATEMP(C) RAD(LY) CC(TTHS) DPT(C) SPD(KH) SPR(KPA) RH(%) DD MM YYWORLD WEATHERWATCH FORECAST ISSUED JUL 22/05
15.70 389.09 0.63 8.90 9.40 93.10 65.30 22 07 0514.00 320.00 0.85 8.50 11.00 93.50 70.00 23 07 0514.50 420.00 0.70 6.80 8.80 94.00 60.0015.40 530.00 0.45 6.00 5.20 94.10 54.0015.20 440.00 0.60 7.00 5.00 94.20 61.0015.00 350.00 0.80 9.00 10.60 93.60 67.00
ATEMP(C) RAD(LY) CC(TTHS) DPT(C) SPD(KH) SPR(KPA) RH(%) DD MM YYWORLD WEATHERWATCH FORECAST ISSUED JUL 23/05
12.80 442.30 0.90 8.50 9.20 93.70 75.80 23 07 0514.10 380.00 0.65 7.40 8.00 94.00 67.00 24 07 0514.50 580.00 0.40 6.80 6.00 94.10 60.0015.00 480.00 0.70 8.00 5.00 93.90 64.0015.20 350.00 0.85 9.00 4.00 93.50 66.0015.30 350.00 0.88 9.20 8.00 93.10 67.00
ATEMP(C) RAD(LY) CC(TTHS) DPT(C) SPD(KH) SPR(KPA) RH(%) DD MM YYWORLD WEATHERWATCH FORECAST ISSUED JUL 24/05
13.60 560.00 0.64 8.30 7.90 94.10 72.10 24 07 0514.70 660.00 0.28 6.80 4.00 94.10 60.00 25 07 0515.00 480.00 0.70 8.00 6.00 93.90 65.0015.20 400.00 0.85 9.00 4.00 93.50 68.0015.30 400.00 0.88 9.20 5.00 93.10 69.0014.50 450.00 0.70 8.50 10.00 93.20 67.00
ATEMP(C) RAD(LY) CC(TTHS) DPT(C) SPD(KH) SPR(KPA) RH(%) DD MM YYWORLD WEATHERWATCH FORECAST ISSUED JUL 25/05
14.80 617.00 0.34 6.70 4.50 94.20 63.10 25 07 0516.00 480.00 0.75 8.00 4.00 93.90 62.00 26 07 0515.80 400.00 0.80 8.60 4.00 93.50 65.0015.50 380.00 0.85 9.00 5.00 93.10 68.0015.00 520.00 0.60 8.00 10.00 93.20 63.0014.50 480.00 0.70 8.20 7.00 93.30 67.00
ATEMP(C) RAD(LY) CC(TTHS) DPT(C) SPD(KH) SPR(KPA) RH(%) DD MM YYWORLD WEATHERWATCH FORECAST ISSUED JUL 26/05
16.60 374.50 0.84 8.90 4.60 94.10 62.90 26 07 0516.00 300.00 0.90 10.50 4.80 93.80 69.00 27 07 0515.80 350.00 0.87 9.70 7.50 93.10 65.0014.20 420.00 0.75 7.80 4.80 93.30 61.0015.00 510.00 0.50 7.60 6.70 93.80 62.0015.50 530.00 0.48 5.00 3.50 93.50 51.00
ATEMP(C) RAD(LY) CC(TTHS) DPT(C) SPD(KH) SPR(KPA) RH(%) DD MM YYWORLD WEATHERWATCH FORECAST ISSUED JUL 27/05

Appendix D (continued)Recorded and Forecast Meteorological Data
17.40 354.40 0.75 11.60 5.60 93.70 69.50 27 07 0515.00 420.00 0.60 10.70 4.20 93.20 71.00 28 07 0515.50 390.00 0.70 8.10 9.50 93.20 62.0014.80 400.00 0.80 9.20 7.20 93.40 69.0015.80 310.00 0.85 10.00 4.50 93.30 67.0014.70 440.00 0.65 8.50 8.00 93.50 65.00
ATEMP(C) RAD(LY) CC(TTHS) DPT(C) SPD(KH) SPR(KPA) RH(%) DD MM YYWORLD WEATHERWATCH FORECAST ISSUED JUL 28/05
16.70 502.60 0.54 10.70 4.70 93.30 70.80 28 07 0516.50 480.00 0.65 8.10 7.50 93.20 57.00 29 07 0515.10 390.00 0.78 9.50 8.00 93.40 67.0016.00 260.00 0.94 10.50 8.70 92.90 69.0014.50 420.00 0.80 9.00 9.50 93.10 68.0013.80 550.00 0.42 6.50 9.10 93.70 57.00
ATEMP(C) RAD(LY) CC(TTHS) DPT(C) SPD(KH) SPR(KPA) RH(%) DD MM YYWORLD WEATHERWATCH FORECAST ISSUED JUL 29/05
17.00 501.10 0.72 7.80 6.20 93.30 55.80 29 07 0514.20 410.00 0.85 11.00 6.50 93.30 81.00 30 07 0515.50 290.00 0.90 11.00 8.20 93.00 74.0013.90 390.00 0.85 8.50 10.00 93.00 69.0014.00 530.00 0.35 5.80 8.50 93.70 55.0015.10 590.00 0.18 6.10 3.50 93.80 52.00
ATEMP(C) RAD(LY) CC(TTHS) DPT(C) SPD(KH) SPR(KPA) RH(%) DD MM YYWORLD WEATHERWATCH FORECAST ISSUED JUL 30/05
13.70 283.20 0.86 10.80 4.40 93.40 83.50 30 07 0514.50 320.00 0.88 12.20 5.50 93.20 85.00 31 07 0514.20 400.00 0.80 9.00 12.00 93.20 71.0013.70 520.00 0.43 6.70 8.10 93.80 60.0014.60 600.00 0.24 6.50 4.80 93.80 57.0016.00 470.00 0.62 9.00 4.50 93.70 61.00
ATEMP(C) RAD(LY) CC(TTHS) DPT(C) SPD(KH) SPR(KPA) RH(%) DD MM YYWORLD WEATHERWATCH FORECAST ISSUED JUL 31/05
14.80 239.95 0.91 12.20 5.20 93.20 85.70 31 07 0513.70 415.00 0.68 7.80 13.00 93.10 67.00 01 08 0513.80 480.00 0.48 6.90 10.00 93.90 61.0015.50 610.00 0.30 7.50 5.40 93.90 52.0016.50 430.00 0.60 9.50 5.30 93.60 60.0016.30 410.00 0.65 10.00 8.50 93.50 66.00
ATEMP(C) RAD(LY) CC(TTHS) DPT(C) SPD(KH) SPR(KPA) RH(%) DD MM YYWORLD WEATHERWATCH FORECAST ISSUED AUG 01/05
14.80 513.80 0.63 6.10 14.40 93.20 60.50 01 08 0515.10 500.00 0.30 6.90 12.00 93.90 60.00 02 08 0516.60 620.00 0.25 8.20 5.10 94.00 55.0017.60 460.00 0.40 10.50 8.00 93.60 61.0015.00 410.00 0.65 8.00 9.00 93.80 62.0015.00 410.00 0.65 8.00 8.00 93.80 62.00
ATEMP(C) RAD(LY) CC(TTHS) DPT(C) SPD(KH) SPR(KPA) RH(%) DD MM YYWORLD WEATHERWATCH FORECAST ISSUED AUG 02/05
Appendix D (continued)Recorded and Forecast Meteorological Data
14.40 536.30 0.57 5.20 10.10 93.90 56.90 02 08 0517.50 640.00 0.25 7.50 5.00 94.00 55.00 03 08 0518.00 500.00 0.40 9.50 6.00 93.70 57.0017.00 420.00 0.65 9.50 11.00 93.70 60.0014.50 410.00 0.70 8.20 6.50 93.70 64.0013.00 430.00 0.65 6.80 6.00 93.60 68.00
ATEMP(C) RAD(LY) CC(TTHS) DPT(C) SPD(KH) SPR(KPA) RH(%) DD MM YYWORLD WEATHERWATCH FORECAST ISSUED AUG 03/05
14.60 588.00 0.32 5.40 4.60 94.20 55.00 03 08 0516.50 440.00 0.60 9.50 6.00 93.70 57.00 04 08 0516.50 430.00 0.60 9.50 5.00 93.70 60.0016.00 450.00 0.60 9.00 7.00 93.70 64.0014.00 440.00 0.65 7.00 6.00 93.60 69.0014.50 500.00 0.40 7.50 7.00 93.70 62.00
ATEMP(C) RAD(LY) CC(TTHS) DPT(C) SPD(KH) SPR(KPA) RH(%) DD MM YYWORLD WEATHERWATCH FORECAST ISSUED AUG 04/05
17.50 460.00 0.70 8.30 4.70 93.90 58.20 04 08 0517.20 480.00 0.58 8.90 6.00 93.60 59.00 05 08 0514.70 450.00 0.70 9.30 5.00 93.60 66.0013.70 490.00 0.55 9.00 5.00 93.70 70.0014.80 540.00 0.35 6.00 6.00 93.70 56.0013.00 540.00 0.35 5.00 4.50 93.90 58.00
ATEMP(C) RAD(LY) CC(TTHS) DPT(C) SPD(KH) SPR(KPA) RH(%) DD MM YYWORLD WEATHERWATCH FORECAST ISSUED AUG 05/05
17.60 537.70 0.70 9.80 5.20 93.90 63.00 05 08 0516.00 475.00 0.65 9.30 4.00 93.70 64.00 06 08 0514.70 510.00 0.60 8.00 5.00 93.70 67.0015.80 570.00 0.40 6.50 5.00 93.80 54.0014.00 570.00 0.40 5.50 5.00 93.90 58.0016.00 600.00 0.40 5.50 5.50 94.00 50.00
ATEMP(C) RAD(LY) CC(TTHS) DPT(C) SPD(KH) SPR(KPA) RH(%) DD MM YYWORLD WEATHERWATCH FORECAST ISSUED AUG 06/05
15.40 362.80 0.65 9.30 4.30 93.80 68.30 06 08 0515.30 550.00 0.50 8.00 5.50 93.80 65.00 07 08 0516.00 570.00 0.40 7.10 5.50 93.80 56.0015.00 520.00 0.50 6.20 5.00 93.80 56.0016.60 540.00 0.50 6.50 5.00 93.90 52.0015.00 440.00 0.65 7.60 5.50 93.60 60.00
ATEMP(C) RAD(LY) CC(TTHS) DPT(C) SPD(KH) SPR(KPA) RH(%) DD MM YYWORLD WEATHERWATCH FORECAST ISSUED AUG 07/05
13.90 501.40 0.26 6.50 4.00 93.90 65.40 07 08 0515.20 580.00 0.15 7.80 2.50 93.80 62.00 08 08 0515.50 520.00 0.40 7.50 5.00 93.70 58.0015.80 540.00 0.40 6.70 6.00 93.80 55.0015.00 460.00 0.60 8.00 3.00 93.70 60.0015.50 520.00 0.40 7.50 3.00 93.90 60.00
ATEMP(C) RAD(LY) CC(TTHS) DPT(C) SPD(KH) SPR(KPA) RH(%) DD MM YYWORLD WEATHERWATCH FORECAST ISSUED AUG 08/05

Appendix D (continued)Recorded and Forecast Meteorological Data
14.20 567.70 0.14 6.60 2.90 93.90 64.00 08 08 0514.00 500.00 0.57 7.60 6.00 93.80 67.00 09 08 0514.80 580.00 0.15 6.80 8.00 93.90 60.0015.00 460.00 0.60 8.00 6.00 94.00 65.0015.50 480.00 0.55 7.80 7.00 94.20 62.0015.80 550.00 0.40 7.40 7.00 94.10 59.00
ATEMP(C) RAD(LY) CC(TTHS) DPT(C) SPD(KH) SPR(KPA) RH(%) DD MM YYWORLD WEATHERWATCH FORECAST ISSUED AUG 09/05
13.90 361.00 0.57 7.70 7.60 94.00 68.30 09 08 0514.90 600.00 0.17 6.80 9.00 94.10 60.00 10 08 0516.00 500.00 0.45 7.60 6.00 94.10 60.0016.50 550.00 0.40 7.80 4.00 94.10 58.0016.80 550.00 0.40 8.00 3.00 93.90 58.0016.50 500.00 0.50 8.40 4.00 93.50 62.00
ATEMP(C) RAD(LY) CC(TTHS) DPT(C) SPD(KH) SPR(KPA) RH(%) DD MM YYWORLD WEATHERWATCH FORECAST ISSUED AUG 10/05
14.80 598.70 0.16 5.90 8.20 94.20 58.60 10 08 0515.60 550.00 0.26 6.50 5.00 94.10 58.00 11 08 0517.00 500.00 0.45 7.50 4.00 94.00 58.0017.50 500.00 0.40 8.40 3.00 93.70 58.0017.50 550.00 0.40 8.50 3.00 93.40 57.0016.50 450.00 0.60 9.00 6.00 93.10 63.00
ATEMP(C) RAD(LY) CC(TTHS) DPT(C) SPD(KH) SPR(KPA) RH(%) DD MM YYWORLD WEATHERWATCH FORECAST ISSUED AUG 11/05
15.80 567.90 0.26 7.00 4.50 94.30 59.30 11 08 0518.00 580.00 0.43 10.00 6.00 94.20 63.00 12 08 0518.50 550.00 0.50 9.50 6.00 93.60 58.0018.00 580.00 0.40 9.00 4.00 93.20 59.0016.50 400.00 0.65 8.50 8.00 93.40 63.0015.00 550.00 0.40 7.00 8.00 93.70 61.00
ATEMP(C) RAD(LY) CC(TTHS) DPT(C) SPD(KH) SPR(KPA) RH(%) DD MM YYWORLD WEATHERWATCH FORECAST ISSUED AUG 12/05
17.70 573.40 0.39 9.80 5.60 94.30 64.20 12 08 0517.80 630.00 0.18 9.00 3.00 93.70 59.00 13 08 0518.00 550.00 0.45 9.50 6.00 93.30 60.0016.50 400.00 0.65 8.50 15.00 93.50 62.0015.00 450.00 0.50 7.00 10.00 93.80 61.0013.50 580.00 0.30 6.00 6.00 93.60 60.00
ATEMP(C) RAD(LY) CC(TTHS) DPT(C) SPD(KH) SPR(KPA) RH(%) DD MM YYWORLD WEATHERWATCH FORECAST ISSUED AUG 13/05
18.20 535.10 0.14 8.80 5.00 93.90 59.70 13 08 0519.30 530.00 0.40 11.00 5.00 93.20 65.00 14 08 0515.80 380.00 0.65 8.80 12.00 93.40 62.0014.50 460.00 0.40 6.50 10.00 93.70 62.0013.00 580.00 0.25 5.50 6.00 93.70 58.0015.00 500.00 0.45 5.00 5.00 93.50 55.00
ATEMP(C) RAD(LY) CC(TTHS) DPT(C) SPD(KH) SPR(KPA) RH(%) DD MM YYWORLD WEATHERWATCH FORECAST ISSUED AUG 14/05

Appendix D (continued)Recorded and Forecast Meteorological Data
18.50 498.30 0.39 11.10 7.80 93.40 64.80 14 08 0514.50 390.00 0.65 8.00 12.00 93.50 60.00 15 08 0514.00 440.00 0.45 6.80 9.00 93.60 60.0013.00 560.00 0.30 6.00 7.00 93.50 58.0014.50 520.00 0.40 5.50 5.00 93.40 55.0015.00 350.00 0.70 9.00 4.00 93.10 60.00
ATEMP(C) RAD(LY) CC(TTHS) DPT(C) SPD(KH) SPR(KPA) RH(%) DD MM YYWORLD WEATHERWATCH FORECAST ISSUED AUG 15/05
14.50 304.00 0.71 7.80 10.60 93.70 64.50 15 08 0511.20 280.00 0.75 6.50 4.50 93.50 70.00 16 08 0512.50 550.00 0.30 5.50 8.00 93.50 60.0014.00 550.00 0.30 5.00 6.00 93.50 55.0015.00 330.00 0.70 8.00 5.00 93.20 65.0015.50 400.00 0.55 7.00 6.00 93.30 60.00
ATEMP(C) RAD(LY) CC(TTHS) DPT(C) SPD(KH) SPR(KPA) RH(%) DD MM YYWORLD WEATHERWATCH FORECAST ISSUED AUG 16/05
12.00 281.00 0.77 7.00 4.00 93.60 72.50 16 08 0514.50 600.00 0.25 5.00 11.50 93.50 65.00 17 08 0514.70 550.00 0.25 6.00 7.00 93.50 55.0016.00 330.00 0.70 7.50 6.00 93.20 65.0015.50 350.00 0.70 7.50 6.50 93.10 62.0015.00 400.00 0.60 6.00 6.00 93.20 60.00
ATEMP(C) RAD(LY) CC(TTHS) DPT(C) SPD(KH) SPR(KPA) RH(%) DD MM YYWORLD WEATHERWATCH FORECAST ISSUED AUG 17/05
13.00 571.00 0.34 3.10 10.10 93.60 53.60 17 08 0515.00 510.00 0.55 5.00 9.00 93.50 55.00 18 08 0516.00 380.00 0.65 7.80 6.00 93.20 62.0015.50 400.00 0.65 7.20 6.50 93.20 65.0014.00 430.00 0.60 5.50 5.00 93.20 62.0013.70 500.00 0.30 5.50 5.00 93.30 60.00
ATEMP(C) RAD(LY) CC(TTHS) DPT(C) SPD(KH) SPR(KPA) RH(%) DD MM YYWORLD WEATHERWATCH FORECAST ISSUED AUG 18/05
12.50 411.00 0.49 3.80 6.10 93.50 59.00 18 08 0517.50 567.00 0.16 7.00 8.00 93.00 58.00 19 08 0516.00 450.00 0.30 7.30 6.50 93.30 60.0014.50 470.00 0.40 6.00 6.00 93.30 62.0013.90 490.00 0.30 5.50 6.00 93.30 60.0014.20 500.00 0.40 6.00 6.00 93.20 58.00
ATEMP(C) RAD(LY) CC(TTHS) DPT(C) SPD(KH) SPR(KPA) RH(%) DD MM YYWORLD WEATHERWATCH FORECAST ISSUED AUG 19/05
19.00 440.00 0.40 9.00 10.00 92.20 46.00 19 08 0516.20 410.00 0.80 9.00 9.50 92.50 60.00 20 08 0514.20 450.00 0.50 6.00 6.50 93.00 60.0014.00 480.00 0.35 5.50 6.20 92.50 61.0014.20 490.00 0.20 5.00 6.00 93.20 60.0015.00 510.00 0.20 6.00 7.00 93.30 55.00
ATEMP(C) RAD(LY) CC(TTHS) DPT(C) SPD(KH) SPR(KPA) RH(%) DD MM YYWORLD WEATHERWATCH FORECAST ISSUED AUG 20/05


APPENDIX ESummer Water Temperature and Flow Management Project
Reservoir Release Volume Calculations for July 10 to August 20, 2005


Appendix ESummer Water Temperature and Flow Management Project Reservoir Release
Volume Calculations for July 10 to August 20, 2005
Summer Water Temperature and Flow Management Project Base Release Volume = (JD 230 - JD 190) * 49.0 + (JD 232 - JD 230) * 14.16 = 1,988.3 m³/s*days
Time period (Julian Day) Time(hrs)
Flow Rate(m³/s)
Volume(m³/s*hrs)
July 10 (191) @ 2400 hrs to July 13 (194) @ 1400 hrs 86.0 90.0 7,740
July 13 (194) @ 1400 hrs to July 14 (195) @ 1400 hrs 24.0 150.0 3,600
July 14 (195) @ 2400 hrs to July 25 (206) @ 1600 hrs 266.0 210.0 55,860
July 25 (206) @ 1600 hrs to July 26 (207) @ 1600 hrs 24.0 28.3 679
July 26 (207) @ 2000 hrs to August 5 (217) @ 1600 hrs 240.0 169.9 40,776
August 05 (217) @ 1600 hrs to August 06 (218) @ 1600 hrs 24.0 453.1 10,874
August 06 (218) @ 1600 hrs to August 07 (219) @ 1600 hrs 24.0 14.2 340
August 07 (219) @ 1600 hrs to August 18 (230) @ 1600 hrs 264.0 169.9 44,854
August 18 (230) @ 1600 hrs to August 20 (232) @ 2400 hrs 56.0 14.2 793
Total 1,008(42.0 days)
165,515
Total Release Volume ===
165,515 m³/s*hrs6,896.5 m³/s*days243,549 cfs*days
Volume Released for Cooling Purposes ====
Total Volume - Base Volume6,896.5 - 1,988.34,908.1 m³/s*days173,331 cfs*days
Average Release over Summer Management Period (July 10 to August 20)
===
6,896.5 m³/s*days / 42 days164.2 m³/s5,798.8 cfs