
The 10 Most Critical Trends that will Shape the Global Power Energy Industry till 2020
22
Annual Global Power and Energy Outlook 2011 Top 10 Market Trends and Their Impact
-
Upload
frost-sullivan -
Category
Education
-
view
3.904 -
download
0
Transcript of The 10 Most Critical Trends that will Shape the Global Power Energy Industry till 2020

Annual Global Power and Energy Outlook 2011
Top 10 Market Trends and Their Impact

2
The 10 Most Critical Trends
that Will Shape the Global Power
Energy Industry till 2020
The 10 Most Critical Trends
that Will Shape the Global Power
Energy Industry till 2020
Source: Frost & Sullivan
Power Demand Growth
Annual Power and Energy Outlook: Top 10 Market Trends (World), 2011
New Age for Natural Gas
Clean Coal Commercial-
isation
Power Plant Decommissioning
Smart Energy
Nuclear Power
Energy Efficiency
Energy Storage
Continued Investment in Renewables
Market Liberalisation
Annual Power and Energy Outlook Top 10 Market Trends for the Decade

3
Annual Power and Energy Outlook Top 10 Trends for the Decade - 1. Power Demand Growth
Power Demand Growth
2010 20202015
Why is this important?Electricity demand growth is one of the key indicators in determining likely power plant investment. Exceptional or high growth leads to a build up in pressure on the power generation infrastructure, as reserve margins fall, and countries can ultimately face electricity shortages or rationing, but more usually in mature regions such as Europe, they become dependent on imports, which are usually expensive.
Why is this important?Electricity demand growth is one of the key indicators in determining likely power plant investment. Exceptional or high growth leads to a build up in pressure on the power generation infrastructure, as reserve margins fall, and countries can ultimately face electricity shortages or rationing, but more usually in mature regions such as Europe, they become dependent on imports, which are usually expensive.
Key Impact/Opportunities
1) The investment focus in Europe and North America is on replacing/retrofitting the existing installed base; capacity expansion will largely be driven by investment in renewables. The demand for retrofits and refurbishments, as well as replacement capacity, means that there are still attractive opportunities in the conventional power sector for established participants.
2) Although European and North American electricity demand will continue to increase at approximately 1% p.a., the industrial demand is likely to be stable overall and will decline in some countries. This is due to the continuing trend for companies to relocate labour-intensive and energy-intensive production to lower cost countries/regions. Once this demand is gone, it is rarely replaced.
3) China and India will be the key markets in terms of volume of power equipment orders, but opportunities for Western manufacturers in both markets will be limited due to the presence of competitive local participants. Joint ventures, licencing and partial acquisition of local participants will continue to be the routes for Western manufacturers to play a role in the market.
Annual Power and Energy Outlook: Growth inElectricity Demand (World), 2010-2030
Low demand in West offset by boom in the Middle East
Big expansion of electric/hybrid vehicles
Global electrification reaches 80%
Non-OECD countries surpass OECD China becomes
largest consumer
11
Source: International Energy Agency, Frost & Sullivan
0
5,000
10,000
15,000
20,000
25,000
30,000
35,000
2010 2015 2020 2025 2030
Ele
ctri
city
Gen
erat
ion
(T
Wh
)
4
Annual Power and Energy Outlook Top 10 Trends for the Decade - 1. Power Demand Growth (Contd…)
Power Demand Growth
2010 20202015
Key Impact/Opportunities (Contd …)
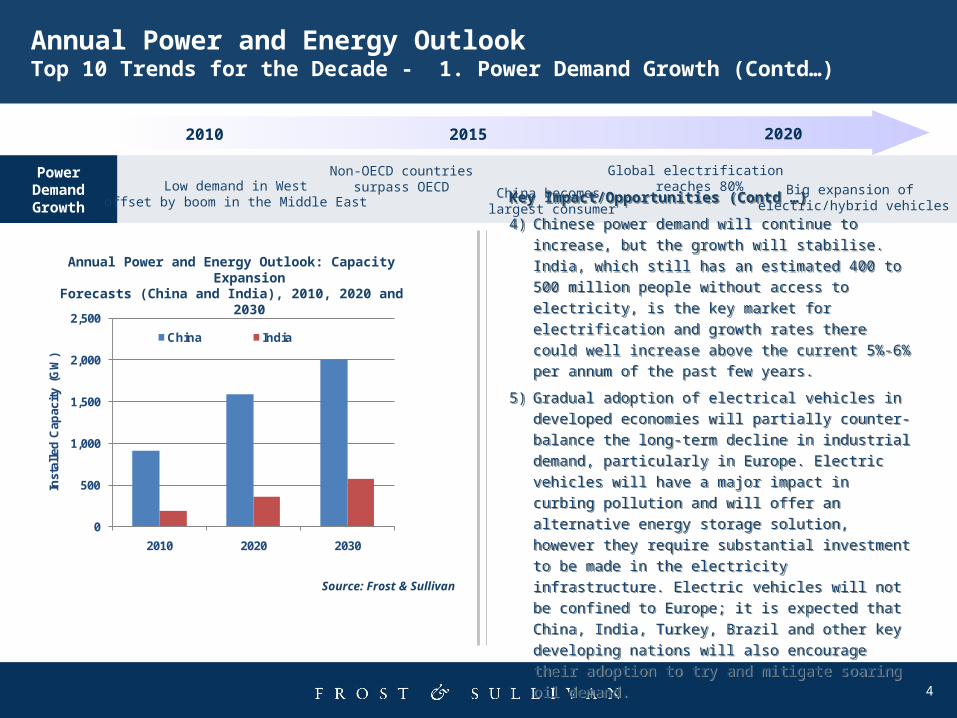
4) Chinese power demand will continue to increase, but the
growth will stabilise. India, which still has an estimated
400 to 500 million people without access to electricity, is
the key market for electrification and growth rates there
could well increase above the current 5%-6% per annum
of the past few years.
5) Gradual adoption of electrical vehicles in developed
economies will partially counter-balance the long-term
decline in industrial demand, particularly in Europe.
Electric vehicles will have a major impact in curbing
pollution and will offer an alternative energy storage
solution, however they require substantial investment to
be made in the electricity infrastructure. Electric vehicles
will not be confined to Europe; it is expected that China,
India, Turkey, Brazil and other key developing nations will
also encourage their adoption to try and mitigate soaring
oil demand.
Key Impact/Opportunities (Contd …)
4) Chinese power demand will continue to increase, but the
growth will stabilise. India, which still has an estimated
400 to 500 million people without access to electricity, is
the key market for electrification and growth rates there
could well increase above the current 5%-6% per annum
of the past few years.
5) Gradual adoption of electrical vehicles in developed
economies will partially counter-balance the long-term
decline in industrial demand, particularly in Europe.
Electric vehicles will have a major impact in curbing
pollution and will offer an alternative energy storage
solution, however they require substantial investment to
be made in the electricity infrastructure. Electric vehicles
will not be confined to Europe; it is expected that China,
India, Turkey, Brazil and other key developing nations will
also encourage their adoption to try and mitigate soaring
oil demand.
Annual Power and Energy Outlook: Capacity ExpansionForecasts (China and India), 2010, 2020 and 2030
Low demand in West offset by boom in the Middle East
Big expansion of electric/hybrid vehicles
Global electrification reaches 80%
Non-OECD countries surpass OECD China becomes
largest consumer
Source: Frost & Sullivan
0
500
1,000
1,500
2,000
2,500
2010 2020 2030
Inst
alle
d C
apac
ity
(GW
)
China India

5
Annual Power and Energy Outlook Top 10 Trends for the Decade - 2. New Age for Natural Gas
New Age for Natural Gas
2010 20202015
Why is this important?
The growth in unconventional gases, particularly shale gas and specifically in the United States, will continue to have a massive impact on the demand and supply balance, driving new investment in gas-fired generation and creating demand for equipment suppliers, exploration companies and project developers.
Key Impact/Opportunities
1) The growth in unconventional gas creates interesting
opportunities for exploration equipment companies and, at a
later stage, for infrastructure equipment companies, as the
new gas finds will need to be connected to the existing gas
network. It will also create demand for exploration project
development expertise, which will be a particular boost for
those companies that operate in markets with few new oil &
gas finds, such as the North Sea.
2) Transporting gas through pipelines will continue to be
important, with new investment to link population centres
with gas fields. In Europe, there are several mega pipeline
projects that would generate billions of dollars in orders for
raw material suppliers such as steel pipe manufacturers, as
well as construction workers and project developers.
Smaller-scale projects to link neighbouring countries will
also lead to greater tradability of gas and therefore more
transparency in pricing.
CCGT favourite generation technology
Shale gas boom in the United States
Growth in global pipeline network
Massive boost in LNG availability
Gas demand peaks in OECD but keeps growing elsewhere
22
Annual Power and Energy Outlook: Shale GasReserves (Selected Regions), 2011
Source: Lambert Energy
Country/RegionShale Gas Reserves (Barrels
of Oil Equivalent)
Canda 20
United States 100
Latin America 50-100
Europe 90
China 50-100
6
Annual Power and Energy Outlook Top 10 Trends for the Decade - 2. New Age for Natural Gas (Contd …)
New Age for Natural Gas
2010 20202015
Key Impact/Opportunities (Contd …)
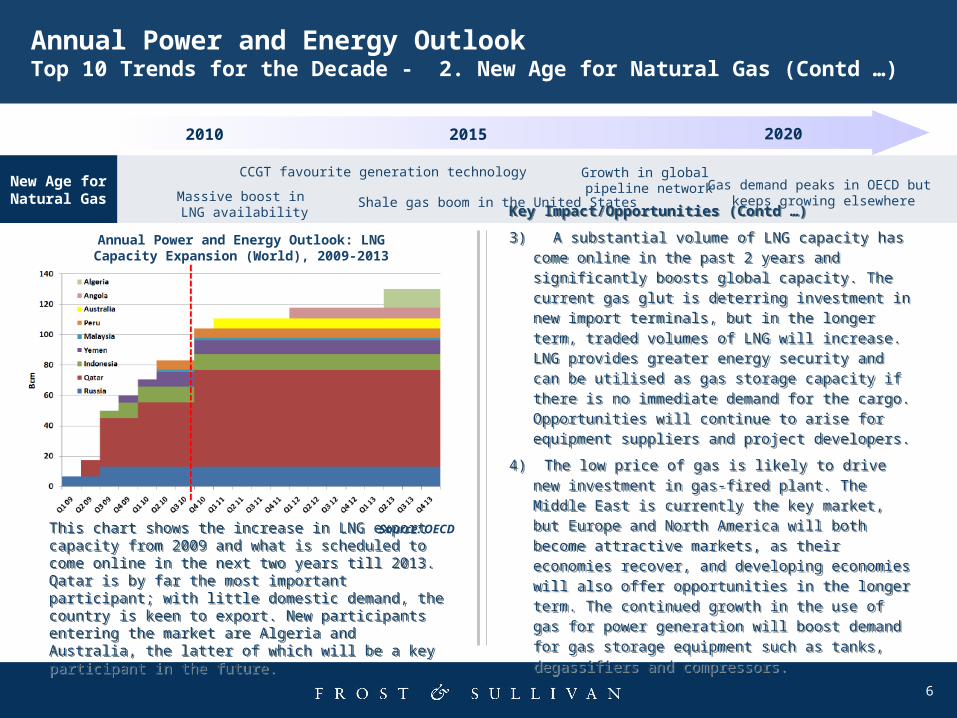
3) A substantial volume of LNG capacity has come online in the past 2 years and significantly boosts global capacity. The current gas glut is deterring investment in new import terminals, but in the longer term, traded volumes of LNG will increase. LNG provides greater energy security and can be utilised as gas storage capacity if there is no immediate demand for the cargo. Opportunities will continue to arise for equipment suppliers and project developers.
4) The low price of gas is likely to drive new investment in gas-fired plant. The Middle East is currently the key market, but Europe and North America will both become attractive markets, as their economies recover, and developing economies will also offer opportunities in the longer term. The continued growth in the use of gas for power generation will boost demand for gas storage equipment such as tanks, degassifiers and compressors.
Key Impact/Opportunities (Contd …)
3) A substantial volume of LNG capacity has come online in the past 2 years and significantly boosts global capacity. The current gas glut is deterring investment in new import terminals, but in the longer term, traded volumes of LNG will increase. LNG provides greater energy security and can be utilised as gas storage capacity if there is no immediate demand for the cargo. Opportunities will continue to arise for equipment suppliers and project developers.
4) The low price of gas is likely to drive new investment in gas-fired plant. The Middle East is currently the key market, but Europe and North America will both become attractive markets, as their economies recover, and developing economies will also offer opportunities in the longer term. The continued growth in the use of gas for power generation will boost demand for gas storage equipment such as tanks, degassifiers and compressors.
CCGT favourite generation technology
Shale gas boom in the United States
Growth in global pipeline network
Massive boost in LNG availability
Gas demand peaks in OECD but keeps growing elsewhere
Annual Power and Energy Outlook: LNGCapacity Expansion (World), 2009-2013
This chart shows the increase in LNG export capacity from 2009 and what is scheduled to come online in the next two years till 2013. Qatar is by far the most important participant; with little domestic demand, the country is keen to export. New participants entering the market are Algeria and Australia, the latter of which will be a key participant in the future.
This chart shows the increase in LNG export capacity from 2009 and what is scheduled to come online in the next two years till 2013. Qatar is by far the most important participant; with little domestic demand, the country is keen to export. New participants entering the market are Algeria and Australia, the latter of which will be a key participant in the future.
Source: OECD

7
Annual Power and Energy Outlook Top 10 Trends for the Decade - 3. Clean Coal Commercialisation
Clean Coal Commercial-
isation
2010 20202015
Key Impact/Opportunities
1) The average efficiency rate of coal-fired plants globally is set
to increase significantly over the next five years, as ultra
supercritical technology becomes the standard, replacing
older sub critical coal-fired units. A large volume of capacity
will also be refurbished and upgraded, with boiler-related
equipment such as economisers, reheaters and
superheaters installed to maximise the potential efficiency,
creating further opportunities for these equipment sub-
suppliers.
2) The commercial viability of carbon capture is yet to be
conclusively determined, but the technology is proven in the
oil & gas sector and there is a general agreement that it is
feasible for the power generation sector. The focus for the
next decade will be on demonstration projects, including
construction of utility-scale projects. Scottish Power, owned
by Iberdrola, remains committed to constructing a 300MW
unit at the Longannet power station.
Annual Power and Energy Outlook: The Developmentof Coal Technology (World), 2010, 2020 and 2030
Time2010 2020
CO
2 E
mis
sio
ns
per
KW
h Average worldwide
EU averageState of the artTechnology
700°C Technology
CCStechnology
Efficiency
32%-35% 38% 45% 50%
CO2 emissions
1,116g CO2/KW 881g CO2/KWh 743g CO2/KWh 669g CO2/KWh
Fuel consumption
480g coal/KWh 379g coal/KWh 320g coal/KWh 288g coal/KWh
Why is this important?
Coal’s long-term future in many global markets depends on reducing the carbon emissions released during the combustion process. Technological advancement will increase the efficiency and cut emissions, but carbon capture and storage is the solution that can have a dramatic impact.
Commercial CCS viability established and large-scale development commences
Ultra supercritical technologybecomes prevalent globally
Carbon capture and storage pilot plants
33
Source: Frost & Sullivan
2030
8
Annual Power and Energy Outlook Top 10 Trends for the Decade - 3. Clean Coal Commercialisation (Contd …)
Clean Coal Commercial-
isation
2010 20202015
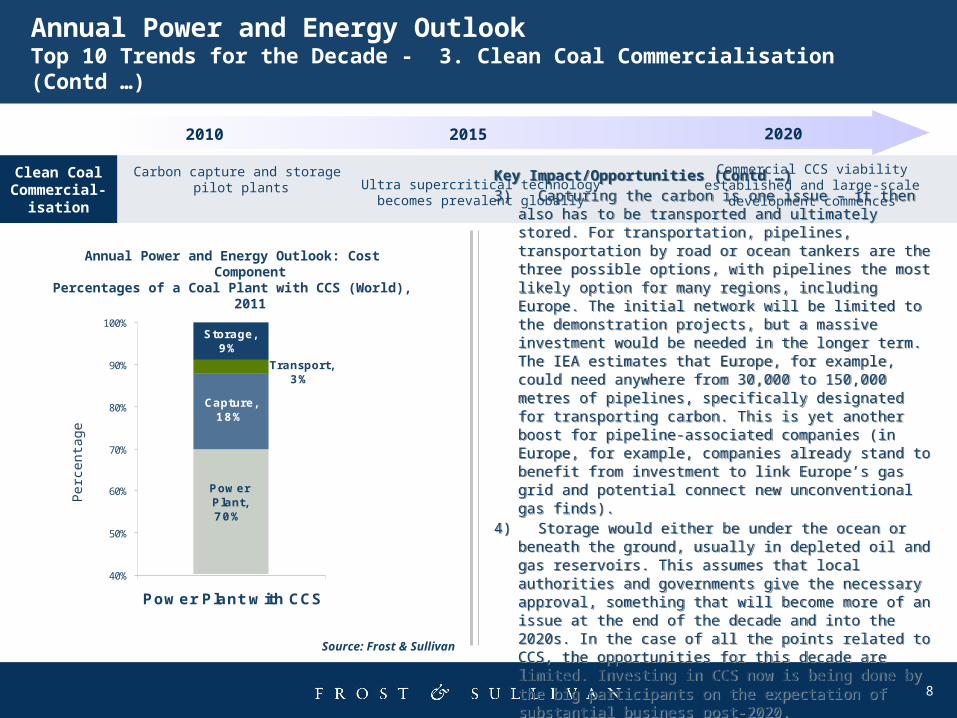
Key Impact/Opportunities (Contd …) 3) Capturing the carbon is one issue – it then also has to be
transported and ultimately stored. For transportation, pipelines, transportation by road or ocean tankers are the three possible options, with pipelines the most likely option for many regions, including Europe. The initial network will be limited to the demonstration projects, but a massive investment would be needed in the longer term. The IEA estimates that Europe, for example, could need anywhere from 30,000 to 150,000 metres of pipelines, specifically designated for transporting carbon. This is yet another boost for pipeline-associated companies (in Europe, for example, companies already stand to benefit from investment to link Europe’s gas grid and potential connect new unconventional gas finds).
4) Storage would either be under the ocean or beneath the ground, usually in depleted oil and gas reservoirs. This assumes that local authorities and governments give the necessary approval, something that will become more of an issue at the end of the decade and into the 2020s. In the case of all the points related to CCS, the opportunities for this decade are limited. Investing in CCS now is being done by the big participants on the expectation of substantial business post-2020.
Annual Power and Energy Outlook: Cost ComponentPercentages of a Coal Plant with CCS (World), 2011
Source: Frost & Sullivan
Power Plant, 70%
Capture, 18%
Transport, 3%
Storage, 9%
40%
50%
60%
70%
80%
90%
100%
Power Plant with CCS
Commercial CCS viability established and large-scale development commences
Ultra supercritical technologybecomes prevalent globally
Carbon capture and storage pilot plants
Per
cent
age

9
Annual Power and Energy Outlook Top 10 Trends for the Decade - 4. Power Plant Decommissioning
Power Plant Decommissioning
2010 20202015
Key Impact/Opportunities
1) The obvious impact of decommissioning is that it creates a need for new plants. Frost & Sullivan estimates that approximately 200GW of installed plant in Europe, the Middle East and Africa will be closed between 2011 and 2020, and this has to be replaced. In Europe gas-fired plant is expected to account for the largest percentage, given the short-to-medium term challenges faced by coal in relation to carbon emissions and pricing. New nuclear is expected to partially fill the gap left behind by coal station closures and also to replace existing nuclear plants. In light of the events in Japan (occurring as this document is being finalised), the level of new nuclear may be less than anticipated at the start of 2011, but this will become clearer when the full impact of the Fukushima situation is known. If the result is countries scaling back their nuclear investment programmes, this would result in more coal-fired plant equipment sales in Asia and gas-fired plant sales in Europe. For example, if Germany decides to proceed with its 2002 shutdown programme, this will likely provide a boost to gas plant equipment suppliers in particular, as gas accounts for a relatively small percentage of the German installed base (15 %). The key point is that closed thermal and nuclear plants will need replacing with similar plants to guarantee baseload power.
Annual Power and Energy Outlook: Likely Decommissioning(Selected Regions), 2010-2020
Why is this important?
A substantial number of plants in Europe and North America will reach the end of their operating lifetime over the next decade, and there will also be closures of some plants in other regions. This creates not only demand for new plants and therefore new equipment sales, but also demand related to safely decommissioning sites in some cases restoring the land or use for other purposes.
First of substantial wave of gas-fired plant closures
Closure of substantial coal-fired capacity in Europe to comply with the
Large Combustion Plant Directive
Gradual closure of nuclear-fired power stations in Europe
and North America
44
Source: Frost & Sullivan
0 20 40 60 80 100
Europe
Eastern Europe &Russia
Middle East
Africa
Capacity Decommissioned (GW)

10
Annual Power and Energy Outlook Top 10 Trends for the Decade - 4. Power Plant Decommissioning (Contd …)
Power Plant Decommissioning
2010 20202015
Key Impact/Opportunities (Contd …)
2) Decommissioning a plant can be a complex and expensive
process; in the case of coal and gas-fired plants, the plants
would generally be dismantled and then the site would either
be returned to greenfield or more likely be used again for a
new thermal plant. It does depend on country and local
regulations. The most expensive by far for decommissioning is
nuclear; nuclear.info.net estimates that in the United States, it
costs $300 million (€214 million) per reactor. For France and
Sweden, the estimates are 10 to 15 % of the construction cost
(approximately €300 to €450 million). Given the complex
nature of nuclear projects, the reality could be far higher than
both of these. The money to carry out this work is supposed to
be set aside in a fund over the course of the plants lifetime,
but there is concern that these funds will not be sufficient
when the time comes. These decommissioning projects will
create good opportunities for waste disposal firms and EPC
contractors that specialise in plant shutdowns or have the
capabilities to enter this segment of the market.
Annual Power and Energy Outlook: EstimatedDecommissioning Costs for Nuclear
Power Plants (Selected Regions), 2011
First of substantial wave of gas-fired plant closures
Closure of substantial coal-fired capacity in Europe to comply with the
Large Combustion Plant Directive
Gradual closure of nuclear-fired power stations in Europe
and North America
Source: nuclearinfo.net
0
50
100
150
200
250
300
350
400
France Sweden United States
Est
imat
ed D
eco
mm
issi
on
ing
Co
st (
€ M
illi
on
)
11
55
Annual Power and Energy Outlook Top 10 Trends for the Decade - 5. Smart Energy
Smart Energy
2010 20202015
Key Impact/Opportunities1) The smart energy concept has re-invigorated mature segments
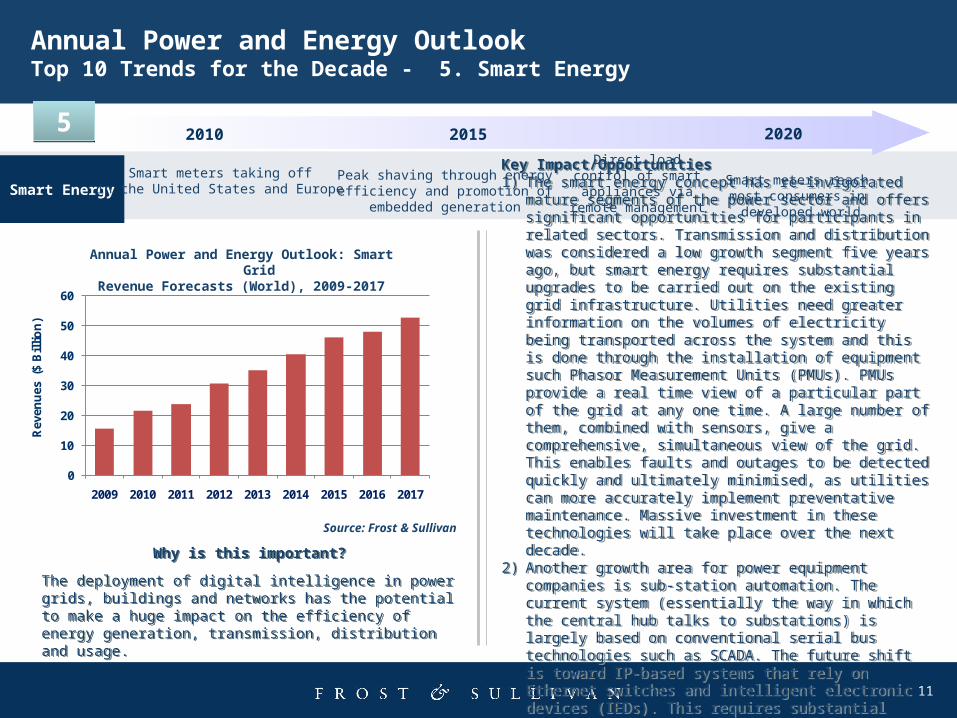
of the power sector and offers significant opportunities for participants in related sectors. Transmission and distribution was considered a low growth segment five years ago, but smart energy requires substantial upgrades to be carried out on the existing grid infrastructure. Utilities need greater information on the volumes of electricity being transported across the system and this is done through the installation of equipment such Phasor Measurement Units (PMUs). PMUs provide a real time view of a particular part of the grid at any one time. A large number of them, combined with sensors, give a comprehensive, simultaneous view of the grid. This enables faults and outages to be detected quickly and ultimately minimised, as utilities can more accurately implement preventative maintenance. Massive investment in these technologies will take place over the next decade.
2) Another growth area for power equipment companies is sub-station automation. The current system (essentially the way in which the central hub talks to substations) is largely based on conventional serial bus technologies such as SCADA. The future shift is toward IP-based systems that rely on Ethernet switches and intelligent electronic devices (IEDs). This requires substantial investment in new technology.
Key Impact/Opportunities1) The smart energy concept has re-invigorated mature segments
of the power sector and offers significant opportunities for participants in related sectors. Transmission and distribution was considered a low growth segment five years ago, but smart energy requires substantial upgrades to be carried out on the existing grid infrastructure. Utilities need greater information on the volumes of electricity being transported across the system and this is done through the installation of equipment such Phasor Measurement Units (PMUs). PMUs provide a real time view of a particular part of the grid at any one time. A large number of them, combined with sensors, give a comprehensive, simultaneous view of the grid. This enables faults and outages to be detected quickly and ultimately minimised, as utilities can more accurately implement preventative maintenance. Massive investment in these technologies will take place over the next decade.
2) Another growth area for power equipment companies is sub-station automation. The current system (essentially the way in which the central hub talks to substations) is largely based on conventional serial bus technologies such as SCADA. The future shift is toward IP-based systems that rely on Ethernet switches and intelligent electronic devices (IEDs). This requires substantial investment in new technology.
Annual Power and Energy Outlook: Smart GridRevenue Forecasts (World), 2009-2017
Why is this important?
The deployment of digital intelligence in power grids, buildings and networks has the potential to make a huge impact on the efficiency of energy generation, transmission, distribution and usage.
Why is this important?
The deployment of digital intelligence in power grids, buildings and networks has the potential to make a huge impact on the efficiency of energy generation, transmission, distribution and usage.
Smart meters taking off in the United States and Europe
Smart meters reach most consumers in
developed world
Direct load control of smart appliances via remote management
Peak shaving through energy efficiency and promotion of
embedded generation
Source: Frost & Sullivan
0
10
20
30
40
50
60
2009 2010 2011 2012 2013 2014 2015 2016 2017
Rev
enu
es (
$ B
illi
on
)
12
0
5
10
15
20
25
North America Europe Rest of World
Rev
enu
es (
$ B
illi
on
) 2010 2017
Annual Power and Energy Outlook Top 10 Trends for the Decade - 5. Smart Energy (Contd …)
Smart Energy
2010 20202015
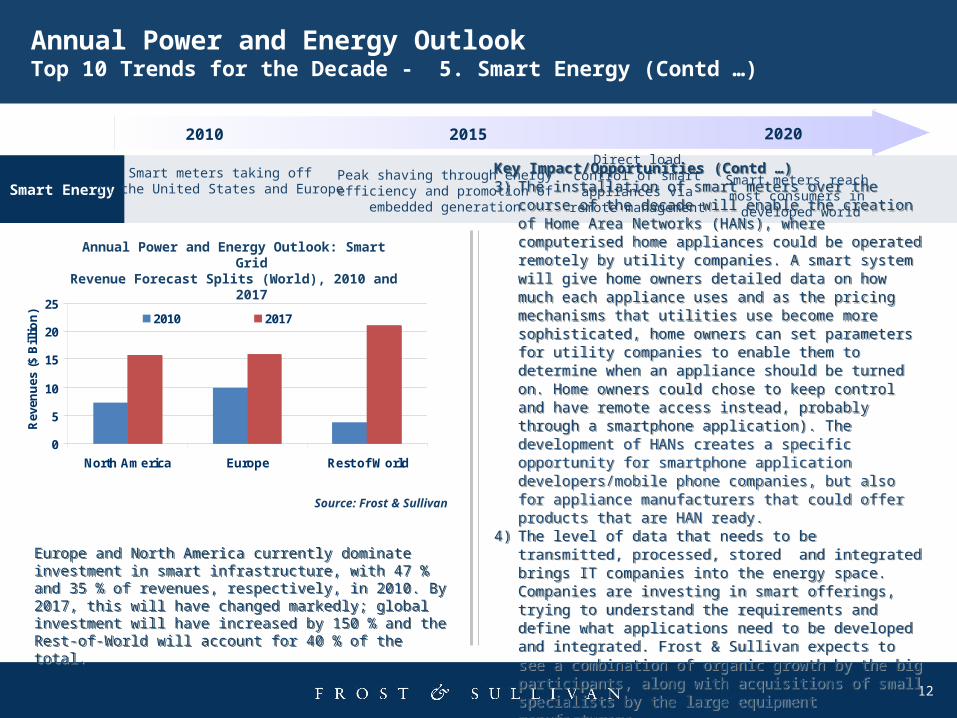
Key Impact/Opportunities (Contd …)3) The installation of smart meters over the course of the decade
will enable the creation of Home Area Networks (HANs), where computerised home appliances could be operated remotely by utility companies. A smart system will give home owners detailed data on how much each appliance uses and as the pricing mechanisms that utilities use become more sophisticated, home owners can set parameters for utility companies to enable them to determine when an appliance should be turned on. Home owners could chose to keep control and have remote access instead, probably through a smartphone application). The development of HANs creates a specific opportunity for smartphone application developers/mobile phone companies, but also for appliance manufacturers that could offer products that are HAN ready.
4) The level of data that needs to be transmitted, processed, stored and integrated brings IT companies into the energy space. Companies are investing in smart offerings, trying to understand the requirements and define what applications need to be developed and integrated. Frost & Sullivan expects to see a combination of organic growth by the big participants, along with acquisitions of small specialists by the large equipment manufacturers.
Annual Power and Energy Outlook: Smart GridRevenue Forecast Splits (World), 2010 and 2017
Europe and North America currently dominate investment in smart infrastructure, with 47 % and 35 % of revenues, respectively, in 2010. By 2017, this will have changed markedly; global investment will have increased by 150 % and the Rest-of-World will account for 40 % of the total.
Europe and North America currently dominate investment in smart infrastructure, with 47 % and 35 % of revenues, respectively, in 2010. By 2017, this will have changed markedly; global investment will have increased by 150 % and the Rest-of-World will account for 40 % of the total.
Smart meters taking off in the United States and Europe
Smart meters reach most consumers in
developed world
Direct load control of smart appliances via remote management
Peak shaving through energy efficiency and promotion of
embedded generation
Source: Frost & Sullivan
13
Annual Power and Energy Outlook Top 10 Trends for the Decade - 6. Nuclear Power
Nuclear Power
2010 20202015
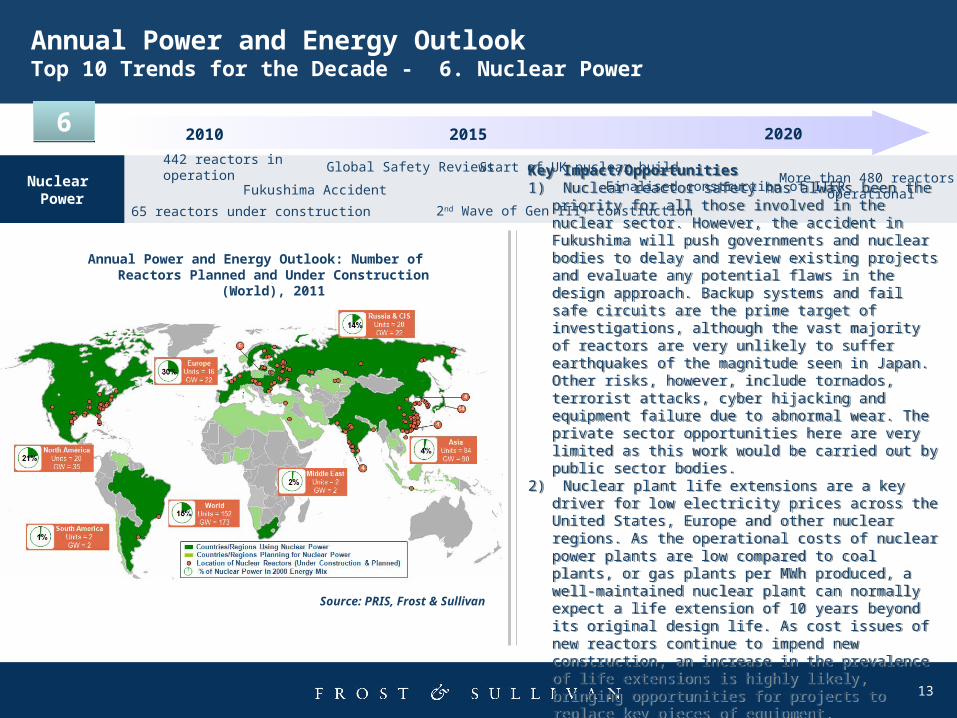
Key Impact/Opportunities1) Nuclear reactor safety has always been the priority for all
those involved in the nuclear sector. However, the accident in Fukushima will push governments and nuclear bodies to delay and review existing projects and evaluate any potential flaws in the design approach. Backup systems and fail safe circuits are the prime target of investigations, although the vast majority of reactors are very unlikely to suffer earthquakes of the magnitude seen in Japan. Other risks, however, include tornados, terrorist attacks, cyber hijacking and equipment failure due to abnormal wear. The private sector opportunities here are very limited as this work would be carried out by public sector bodies.
2) Nuclear plant life extensions are a key driver for low electricity prices across the United States, Europe and other nuclear regions. As the operational costs of nuclear power plants are low compared to coal plants, or gas plants per MWh produced, a well-maintained nuclear plant can normally expect a life extension of 10 years beyond its original design life. As cost issues of new reactors continue to impend new construction, an increase in the prevalence of life extensions is highly likely, bringing opportunities for projects to replace key pieces of equipment.
Annual Power and Energy Outlook: Number of Reactors Planned and Under Construction (World), 2011
Fukushima Accident
Start of UK nuclear build
2nd Wave of Gen III+ construction
442 reactors in operationMore than 480 reactors
operational
Source: PRIS, Frost & Sullivan
Global Safety Reviews
65 reactors under construction
Finalised construction of ITER
66
14
Annual Power and Energy Outlook Top 10 Trends for the Decade - 6. Nuclear Power (Contd …)
2010 20202015
Key Impact/Opportunities (Contd …)
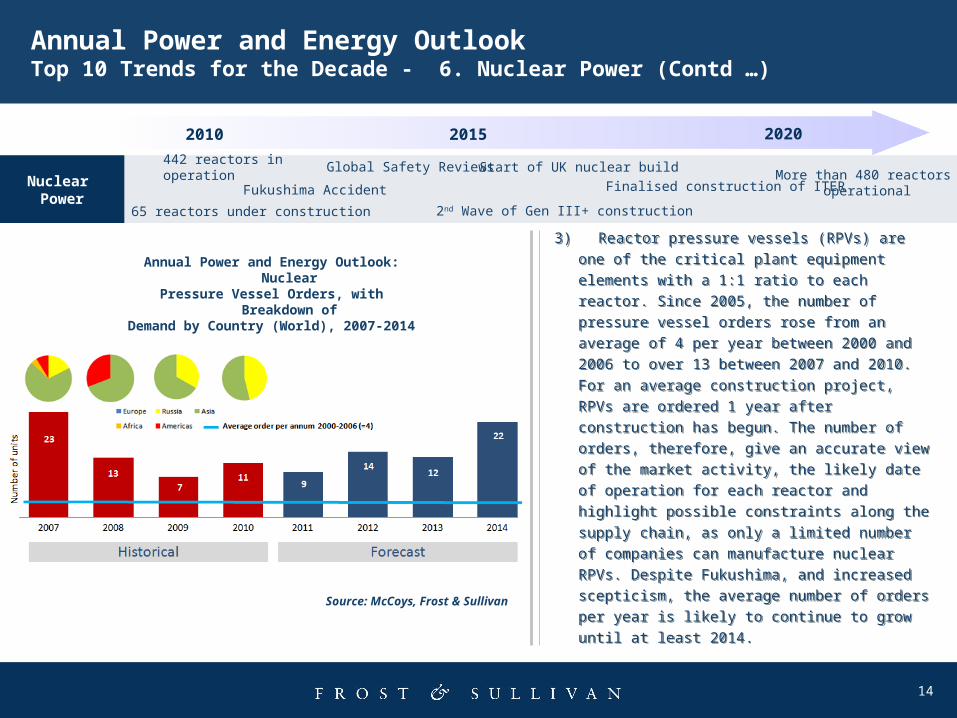
3) Reactor pressure vessels (RPVs) are one of the
critical plant equipment elements with a 1:1 ratio to
each reactor. Since 2005, the number of pressure
vessel orders rose from an average of 4 per year
between 2000 and 2006 to over 13 between 2007 and
2010. For an average construction project, RPVs are
ordered 1 year after construction has begun. The
number of orders, therefore, give an accurate view of
the market activity, the likely date of operation for
each reactor and highlight possible constraints along
the supply chain, as only a limited number of
companies can manufacture nuclear RPVs. Despite
Fukushima, and increased scepticism, the average
number of orders per year is likely to continue to grow
until at least 2014.
Key Impact/Opportunities (Contd …)
3) Reactor pressure vessels (RPVs) are one of the
critical plant equipment elements with a 1:1 ratio to
each reactor. Since 2005, the number of pressure
vessel orders rose from an average of 4 per year
between 2000 and 2006 to over 13 between 2007 and
2010. For an average construction project, RPVs are
ordered 1 year after construction has begun. The
number of orders, therefore, give an accurate view of
the market activity, the likely date of operation for
each reactor and highlight possible constraints along
the supply chain, as only a limited number of
companies can manufacture nuclear RPVs. Despite
Fukushima, and increased scepticism, the average
number of orders per year is likely to continue to grow
until at least 2014.
Annual Power and Energy Outlook: NuclearPressure Vessel Orders, with Breakdown of
Demand by Country (World), 2007-2014
Source: McCoys, Frost & Sullivan
Nuclear Power
Fukushima Accident
Start of UK nuclear build
2nd Wave of Gen III+ construction
442 reactors in operationMore than 480 reactors
operational
Global Safety Reviews
65 reactors under construction
Finalised construction of ITER

15
Annual Power and Energy Outlook Top 10 Trends for the Decade – 7. Energy Efficiency
Energy Efficiency
2010 20202015
Key Impact/Opportunities1) Green buildings have a vital role to play in the reduction of
carbon emissions and improving the environment. A smart and green building can conserve resources, use energy efficiently and create a healthy occupied environment. Green buildings essential bring together a range of home efficiency concepts, along with a greater use of micro-generation technologies such as solar thermal, photovoltaic cells and heat pumps. There is also better monitoring and control of energy-intensive systems such as HVAC and lighting. Green buildings create opportunities for manufacturers of building automation systems, energy-efficient lighting, green HVAC systems and integrated security solutions. It should be noted that this does not just apply to new buildings; some of these technologies can be incorporated into the existing housing stock.
2) Large-scale deployment of compact fluorescent lights (CFLs) can help reduce peak electricity demand and improve power shortages in developing nations. High-quality CFLs are four to five times more efficient than incandescent bulbs and last substantially longer. Other technologies such as organic light emitting diode (OLED) lighting will further improve energy efficiency in the lighting sector.
Annual Power and Energy Outlook: ConceptualDrawing of a Green Building (World), 2011
Why is this important?
Increasing energy efficiency is vital for reducing consumption, because if done well, it enables people to continue acting close to their normal behaviour and yet per capita consumption falls. Government efforts to increase energy efficiency in the past have not always been successful, but the technology now exists to make improvements easier to achieve.
77
Global coverage for energy-efficient lighting
Green buildings become norm in developed world Grid investments lay foundations for
supergrids and reduce T&D losses
Global penetration of micro-renewables and micro-CHP
Source: Frost & Sullivan

16
Annual Power and Energy Outlook Top 10 Trends for the Decade – 7. Energy Efficiency (Contd …)
Energy Efficiency
2010 20202015
Key Impact/Opportunities (Contd …)
3) Increased investment in grid infrastructure, as part of the
smart energy concept, will boost the growth of more energy-
efficient distributed generation (DG) technologies such as
micro-generation, micro-combined heat and power (CHP)
plants, biomass boilers, solar thermal panels, geothermal
energy and heat pumps. Micro-CHP is expected to expand
strongly in Europe and Asian countries such as Japan and
South Korea in the near term; however, North America also
holds good opportunities. Besides the increased efficiencies,
DG has the advantage that transmission losses are
minimised, because the electricity is generated close to
where it is ultimately used by the consumer.
Source: splendidaparna.com
Global coverage for energy-efficient lighting
Green buildings become norm in developed world Grid investments lay foundations for
supergrids and reduce T&D losses
Global penetration of micro-renewables and micro-CHP
Annual Power and Energy Outlook: Energy-efficient Micro-Grid (World), 2011

17
Annual Power and Energy Outlook Top 10 Trends for the Decade – 8. Energy Storage
Energy Storage
2010 20202015
Key Impact/Opportunities
1) With increasing cost reductions in advanced battery
technologies and storage solutions, systems are starting to
provide attractive returns when taking into account the
benefits they bring. Examples include allowing renewable
energy generated off-peak to be sold on-peak, increasing
capacity credit, peak-shaving, increasing T&D asset utilisation,
deferring costs of upgrades and so on. With these monetised
advantages becoming clearer, utility/grid-scale energy
storage deployment is inevitable.
2) New participants will enter the market with new ideas and
new business models. Expect the arrival of spotters of
strategic energy storage locations that will study best locations
for energy storage deployment and develop energy storage
projects in the same way as developers did in the wind and
solar renewable energy markets. New business concepts will
also emerge with storage-as-a-service being offered to utilities
that do not want to invest in their own storage assets.
Annual Power and Energy Outlook: Forecast RevenueGrowth of the Energy Storage Market (World), 2001-2017
Why is this important?
Energy storage is a rising star in tomorrow’s electricity generation and distribution landscape. It is a key enabling component of the future smart electricity grid as it allows intermittent renewable energy deployment, helps ease bottlenecks on the grid, improves power quality, provides back-up power supply and defers the cost of upgrading or expanding generation capacity and transmission systems.
88
Grid-scale energy storage such as pumped storage and CAES takes offImproved existing battery technologies emerge
such as Li-ion, Nickel-Zinc and Molten Salt
Energy storage market reaches $50 billion
0
10
20
30
40
50
60
0
100
200
300
400
500
600
2010 2011 2012 2013 2014 2015 2016 2017Gr
owth
Rat
e (%
)
Reve
nue
($ M
illio
n)
Year
Battery Revenue ($ Million) Growth Rate (%)

18
Global Power and Energy Outlook Top 10 Trends for the Decade – 8. Energy Storage (Contd …)
Energy Storage
2010 20202015
Key Impact/Opportunities (Contd …)
3) With alternative vehicles fast increasing penetration of the
automotive market, lithium-ion battery manufacturers will
witness tremendous opportunities arising for their products. By
2016, approximately 50 % of revenues will come from this
application. This will spur accelerated developments in lithium-
based batteries (for example, lithium-manganese) and will
most likely spill and benefit other applications, possibly notably
through battery re-use/recycling schemes.
4) With such impending transformations in store for the battery
markets, the market participants will re-think their strategies,
and lots of momentum is expected in the form of industry
consolidation, alliances, price pressures, shifts in bargaining
power and so on. Exciting times ahead for the energy storage
market!
Annual Power and Energy Outlook: Energy StorageMarket Size by Technology (World), 2016
Grid-scale energy storage such as pumped storage and CAES takes offImproved existing battery technologies emerge
such as Li-ion, Nickel-Zinc and Molten Salt
Energy storage market reaches $50 billion
Why is this important?
For the first time in 2016, revenues from lithium-ion batteries will outstrip lead-acid battery revenues leading to profound transformations in the competitive landscape, supply chain, as well as application markets.
Why is this important?
For the first time in 2016, revenues from lithium-ion batteries will outstrip lead-acid battery revenues leading to profound transformations in the competitive landscape, supply chain, as well as application markets.
19
Annual Power and Energy Outlook Top 10 Trends for the Decade – 9. Continued Investment in Renewables
Continued Investment in Renewables
2010 20202015
Key Impact/Opportunities
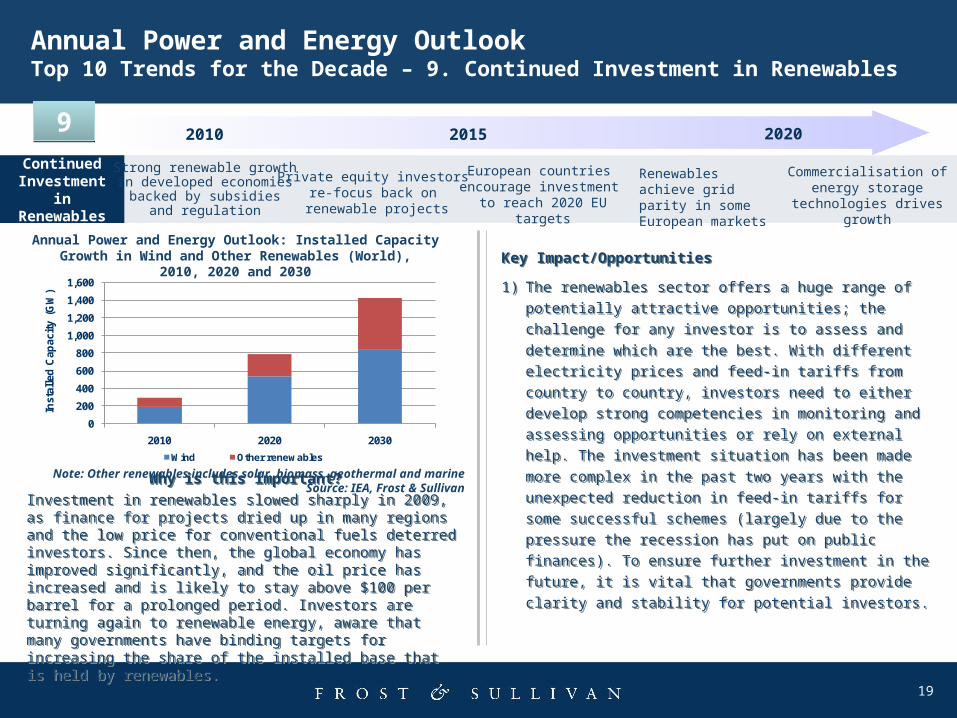
1) The renewables sector offers a huge range of potentially
attractive opportunities; the challenge for any investor is to
assess and determine which are the best. With different
electricity prices and feed-in tariffs from country to country,
investors need to either develop strong competencies in
monitoring and assessing opportunities or rely on external
help. The investment situation has been made more complex
in the past two years with the unexpected reduction in feed-in
tariffs for some successful schemes (largely due to the
pressure the recession has put on public finances). To ensure
further investment in the future, it is vital that governments
provide clarity and stability for potential investors.
Key Impact/Opportunities
1) The renewables sector offers a huge range of potentially
attractive opportunities; the challenge for any investor is to
assess and determine which are the best. With different
electricity prices and feed-in tariffs from country to country,
investors need to either develop strong competencies in
monitoring and assessing opportunities or rely on external
help. The investment situation has been made more complex
in the past two years with the unexpected reduction in feed-in
tariffs for some successful schemes (largely due to the
pressure the recession has put on public finances). To ensure
further investment in the future, it is vital that governments
provide clarity and stability for potential investors.
Annual Power and Energy Outlook: Installed CapacityGrowth in Wind and Other Renewables (World),
2010, 2020 and 2030
Why is this important?
Investment in renewables slowed sharply in 2009, as finance for projects dried up in many regions and the low price for conventional fuels deterred investors. Since then, the global economy has improved significantly, and the oil price has increased and is likely to stay above $100 per barrel for a prolonged period. Investors are turning again to renewable energy, aware that many governments have binding targets for increasing the share of the installed base that is held by renewables.
99
Renewables achieve grid parity in some European markets
European countries encourage investment
to reach 2020 EU targets
Strong renewable growth in developed economies
backed by subsidies and regulation
Private equity investors re-focus back on
renewable projects
Commercialisation of energy storage
technologies drives growth
Note: Other renewables includes solar, biomass, geothermal and marineSource: IEA, Frost & Sullivan
0
200
400
600
800
1,000
1,200
1,400
1,600
2010 2020 2030
Inst
alle
d C
apac
ity
(GW
)
Wind Other renewables
20
Annual Power and Energy Outlook Top 10 Trends for the Decade – 9. Continued Investment in Renewables (Contd …)
Continued Investment in Renewables
2010 20202015
Key Impact/Opportunities (Contd …)
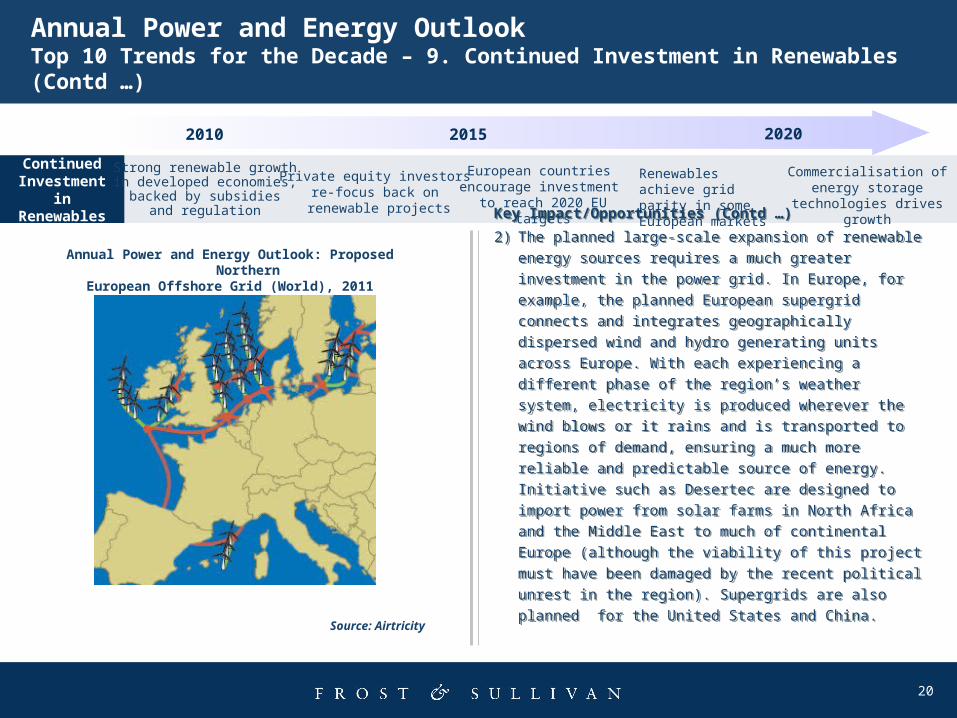
2) The planned large-scale expansion of renewable energy
sources requires a much greater investment in the power grid.
In Europe, for example, the planned European supergrid
connects and integrates geographically dispersed wind and
hydro generating units across Europe. With each experiencing
a different phase of the region’s weather system, electricity is
produced wherever the wind blows or it rains and is
transported to regions of demand, ensuring a much more
reliable and predictable source of energy. Initiative such as
Desertec are designed to import power from solar farms in
North Africa and the Middle East to much of continental
Europe (although the viability of this project must have been
damaged by the recent political unrest in the region).
Supergrids are also planned for the United States and China.
Key Impact/Opportunities (Contd …)
2) The planned large-scale expansion of renewable energy
sources requires a much greater investment in the power grid.
In Europe, for example, the planned European supergrid
connects and integrates geographically dispersed wind and
hydro generating units across Europe. With each experiencing
a different phase of the region’s weather system, electricity is
produced wherever the wind blows or it rains and is
transported to regions of demand, ensuring a much more
reliable and predictable source of energy. Initiative such as
Desertec are designed to import power from solar farms in
North Africa and the Middle East to much of continental
Europe (although the viability of this project must have been
damaged by the recent political unrest in the region).
Supergrids are also planned for the United States and China.
Renewables achieve grid parity in some European markets
European countries encourage investment
to reach 2020 EU targets
Strong renewable growth in developed economies,
backed by subsidies and regulation
Private equity investors re-focus back on
renewable projects
Commercialisation of energy storage
technologies drives growth
Annual Power and Energy Outlook: Proposed NorthernEuropean Offshore Grid (World), 2011
Source: Airtricity
21
Annual Power and Energy Outlook Top 10 Trends for the Decade – 10. Market Liberalisation
Market Liberalisation
2010 20202015
Key Impact/Opportunities
1) Liberalised markets demand flexible power generation
infrastructure capable of responding to electricity price
changes on traded exchanges in the shortest possible time
frame. This will benefit gas turbine technology, which is the
most flexible in terms of its short start-up times and ability to
respond to load changes. There is also a boost for the
service market as equipment suffers greater strain from
flexible generating modes.
2) As the EU completes its liberalised power market and as
market liberalisation expands from the developed countries to
the developing regions, such countries will also develop a
more diverse fuel mix. Electricity market liberalisation tends
to go hand in hand with liberalisation of energy markets in
general, with gas market liberalisation for instance acting as
a driver for lower gas prices and better fuel availability, thus
again spurring the growth of gas-fired power generation.
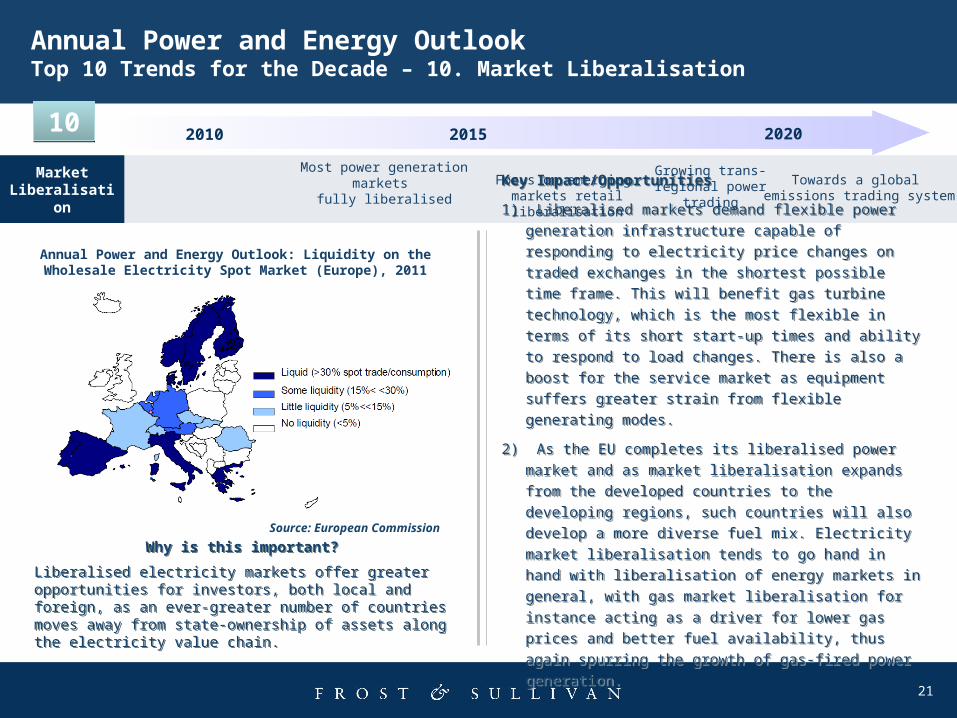
Annual Power and Energy Outlook: Liquidity on theWholesale Electricity Spot Market (Europe), 2011
Why is this important?
Liberalised electricity markets offer greater opportunities for investors, both local and foreign, as an ever-greater number of countries moves away from state-ownership of assets along the electricity value chain.
Why is this important?
Liberalised electricity markets offer greater opportunities for investors, both local and foreign, as an ever-greater number of countries moves away from state-ownership of assets along the electricity value chain.
1010
Focus on emerging markets retail liberalisation
Growing trans-regional power trading
Most power generation markets fully liberalised
Towards a global emissions trading system
Source: European Commission

22
Annual Power and Energy Outlook Top 10 Trends for the Decade – 10. Market Liberalisation (Contd …)
Market Liberalisation
2010 20202015
Key Impact/Opportunities (Contd …)
3) Electricity markets are becoming increasingly interconnected,
with the pioneering development of multi-country power
exchanges such as Nordpool paving the way for other such
exchanges around the world. Over the longer term, the market
liberalisation will also boost interconnection with far-off regions
such as the Sahara desert to export solar-generated power to
Europe.
4) The market liberalisation also boosts a more efficient
operation of emissions trading schemes. The operational
schemes are the Kyoto Protocol, the European Emissions
Trading System (EU ETS) as well as smaller schemes in New
Zealand, parts of the United States and Japan’s capital of
Tokyo. Future schemes are planned for areas such as
Australia, Western United States and South Korea. All these
schemes will become increasingly interlinked and integrated
over time.
Annual Power and Energy Outlook: Priority Corridorsfor Electricity and Gas (Europe), 2011
Focus on emerging markets retail liberalisation
Growing trans-regional power trading
Most power generation markets fully liberalised
Towards a global emissions trading system
Source: EC DG Energy