
Thatcher’s Children, Blair’s Babies, political...
38
1 Forthcoming in the British Journal of Political Science (accepted 21 March 2016) Thatcher’s Children, Blair’s Babies, political socialisation and trickle-down value-change: An age, period and cohort analysis 1 Dr Maria Grasso University of Sheffield, Department of Politics [email protected] Prof Stephen Farrall University of Sheffield, School of Law [email protected] Dr Emily Gray University of Sheffield, School of Law [email protected] Prof Colin Hay Sciences Po, Paris, Centre d’Études Européennes [email protected] Prof Will Jennings University of Southampton, Department of Politics and International Relations [email protected] 1 The authors would like to thank Stephen Fisher, Charles Pattie and James Tilley as well as three anonymous reviewers and Rob Johns for comments and suggestions. We would also like to acknowledge the support of the UK Economic and Social Research Council (Award no: ES/K006398/1). The usual disclaimers apply.
Transcript of Thatcher’s Children, Blair’s Babies, political...

1
Forthcoming in the British Journal of Political Science (accepted 21 March 2016)
Thatcher’s Children, Blair’s Babies,
political socialisation and trickle-down value-change:
An age, period and cohort analysis1
Dr Maria Grasso University of Sheffield, Department of Politics
Prof Stephen Farrall University of Sheffield, School of Law
Dr Emily Gray University of Sheffield, School of Law
Prof Colin Hay Sciences Po, Paris, Centre d’Études Européennes
Prof Will Jennings University of Southampton, Department of Politics and International Relations
1 The authors would like to thank Stephen Fisher, Charles Pattie and James Tilley as well as three anonymous
reviewers and Rob Johns for comments and suggestions. We would also like to acknowledge the support of
the UK Economic and Social Research Council (Award no: ES/K006398/1). The usual disclaimers apply.
2
Abstract (120 words)
To what extent are new generations ‘Thatcherite’? Using British Social Attitudes data for
1985-2012 and applying age-period-cohort (APC) analysis and generalized additive models
(GAMs) this paper investigates whether Thatcher’s Children hold more right-authoritarian
political values compared to other political generations. We further examine the extent to
which the generation that came of age under New Labour – Blair’s Babies – share these
values. Our findings for generation effects indicate that this political generation is even
more right-authoritarian, including with respect to attitudes to redistribution, welfare and
crime. We support this view through evidence of cohort effects. Our results show the
legacy of Thatcherism for left-right and libertarian-authoritarian values is to be found in its
long-term shaping of public opinion through political socialisation.
3
As early as January 1979, Stuart Hall, who coined the term ‘Thatcherism’, wrote:
“No one seriously concerned with political strategies in the current situation can now afford
to ignore the ‘swing to the Right’” . That year, as was later shown2, marked the high point
of the British electorate’s rightward movement – and the ‘sea-change’ (as Jim Callaghan
called it) in public opinion that was marked by election of the Thatcher government. For
many, Thatcher’s ‘authoritarian populism’ captured the nation’s anxious mood in the
economic crisis of the mid-to-late 1970s, in the aftermath of the upswing in industrial
militancy and the cultural radicalism of the ‘permissive society’ of the 1960s and early
1970s.3 The Left was divided in Britain and unable to exploit the social liberalism of the
previous decade to articulate a relevant progressive political discourse. Thatcher was still in
office when Ivor Crewe4 posed the question of whether the British electorate had ‘become
Thatcherite’. Subsequent studies analysed Thatcher’s Children and the extent to which this
generation was more right-wing relative to predecessors, finding mixed evidence.5
In this paper we aim to examine the question of political generations by analysing
the extent to which a political context marked by a right-authoritarian zeitgeist influenced
the values of new cohorts. While this wider theoretical question is applicable to other
comparative contexts such as the U.S. under Reagan and the rise of the Moral Majority, in
this paper we draw on British data since the prolonged period of Conservative rule in
2 Bartle, Dellepiane-Avellaneda, and Stimson 2011.
3 Hay 1996.
4 Crewe 1988.
5 See for e.g. Russell, Johnston and Pattie 1992; Heath and Park 1997; Tilley 2002.

4
Britain between 1979 and 1997 provides an excellent test case for examining the theory of
political generations and formative experiences. Normally we would expect younger
generations to be more leftist and liberal than older generations. Therefore the protracted
period with the Conservative Party in office allows us to test whether younger cohorts
coming of age in this political context came to adopt political attitudes in line with this
party’s at a greater rate than would be expected given their young age. Further, our
investigation builds on this traditional question by also examining whether the generation
that came of age under New Labour, ‘Blair’s Babies’, can be better identified as
‘Thatcher’s Grand-children’, in reinforcing the rightward shift in social values that had
occurred under the previous generation. We postulate a ‘trickle-down’6 theory of social
change: during the first phase of Conservative government (normative neoliberalism) there
was deeper ideological contestation, while in the following phase (normalised
neoliberalism) even political opponents and rival partisans had internalised its market
precepts as ‘the rules of the game’. The 1980s were marked by a concentrated political shift
towards neo-liberal market economies across many Western democracies.7 The rise of the
New Right signalled a rightward shift in opinion in the US, UK and other Anglo-American
democracies in the 1980s. As such we seek to gauge whether those who came of age under
6 The term ‘trickle-down’ has been employed in popular political commentary/critiques, particularly of
President Reagan’s administration and other laissez-fair capitalist economies. The concept originated in the
U.S.; Democratic presidential candidate, William Bryan referred to the idea in a speech in 1896 where he
compared promoting economic prosperity via either ‘top-down’ or ‘bottom-up’ strategies (Sowell 2012).
7 Braedley and Luxton 2010; Duménil and Lé́vy 2011; Kotz 2015.

5
Thatcher, and subsequent Prime Ministers are more politically conservative than those
coming of age in the earlier period in which such values were more contested. In short, the
question addressed in this paper is: To what extent did the generations coming of age in the
protracted period of Conservative government come to exhibit more conservative values?
What were the differences between the generation coming of age in the first phase (during
Thatcher’s time in office) relative to the second phase (after she left office, during the time
of New Labour)? We theorise that ‘Thatcher’s Children’ may be less Thatcherite than
‘Blair’s Babies’ as Thatcherite values became entrenched across society – as signalled also
by New Labour’s emergence – during the period after Thatcher left office.8
The remainder of the paper is organised as follows. We first discuss theories of
generational replacement and value change and develop our hypotheses. We then discuss
the data and methods used in this study of attitudinal change in Britain: specifically, a
newly combined longitudinal dataset built from repeated cross-sectional sweeps of the
British Social Attitudes survey for the period from 1985 to 2012.9 These are used to
identify and isolate the different effects of age, period and cohort on social values. We next
present our results concerning the degree to which those generations socialised during and
after the time of Thatcher differ in their attitudes to redistribution, welfare and authority.
Finally, we conclude with a discussion of the implications of these findings for our
understanding of the Thatcher years and their legacy, also reflecting on their wider
8 Hay 2004.
9 See Jennings, Gray, Hay and Farrall 2015.

6
significance for the study of the evolution of social and political attitudes and long-term
processes of socialisation.
Political Generations
Generational theories share the idea that values are formed early on, influenced by
the specific historical and political contexts within which each new cohort of citizens is
socialised, and remain stable throughout the life-course, so that aggregate value change
occurs as older cohorts with certain value-sets die and are replaced by younger cohorts with
different values.10 One such type of account is modernization theory.11 However, while
modernization theory allows for some short-term shifts in values, the global trajectory
remains one where social liberalism becomes incerasingly more widespread at the
aggregate level.12 In contrast, political generations theory takes a historicised perspective
that emphasises the importance of political events and experiences taking place during the
impressionable “formative years” for the differentiation of cohorts.13 According to this line
of thinking, it is not so much affluence and security in childhood that shapes the values and
political commitments of new cohorts, but rather the political experiences and historical
events occuring during one’s young adulthood. Various studies have shown that diverse
political contexts can produce generations with distinct value-sets and patterns of
10 Mannheim 1928; Erikson and Stoker 2011.
11 Inglehart 1977; Inglehart 1990.
12 Inglehart 1977; Inglehart 1990; Inglehart and Welzel 2005.
13 Mannheim 1928.

7
behaviour.14 Critical historical moments such as the world-wide student protests of 1968 or
the fall of the Berlin Wall, a prolonged period over which the same party holds power, and
other types of major external events during a cohort’s coming of age are understood to
explain why socialisation in diverse political contexts creates distinct ‘political
generations’. While members of a given political generation are divided by social cleavages
such as gender and class (Mannheim calls called these ‘generation units’) nonetheless, as a
generation, they are understood to share values and the conceptions of the world because
they emerged from the same temporal/spatial location. Mannheim15 thus likens generations
to social classes arising from distinct positions in the economic or material realm.16
Supporting this, studies of macro-level preferences have shown how publics react
thermostatically against the government of the day.17 Others argue that parties in
government are able to shape the preferences of the electorate,18 which would be consistent
with the effect of socialisation on political values during certain periods.
14 Tilley 2002; Grasso 2011; Bartels and Jackman 2014; Grasso 2014; Neundorf and Niemi 2014; Tilley and
Evans 2014; Grasso 2016.
15 Mannheim 1928.
16 While inter- and not intra- generational differences are the focus of this article of course generations are
also heterogeneous within. Mannheim (1928) recognises this through the concept of ‘generation units’. It is
thus important to control, as we do in this paper, for a wide variety of factors that could result in inter-
generational differences that are not necessarily linked to political socialisation, that is, historical experiences.
17 Erikson, Mackuen and Stimson 2002; Bartle, Dellepiane-Avellaneda, and Stimson 2011.
18 Dunleavy and Ward 1981; Curtice and Fisher 2003.

8
‘Thatcher’s Children’
Gamble19 characterises Thatcherism as a marriage of ‘the free economy and the
strong state’ – a flexible synthesis, in other words, of market liberalisation (support for a
smaller state, deregulation of financial markets, privatisation of public owned industries
and assets, the sale of council houses) and social conservatism with a strengthened law and
order agenda (Clause 28, extending police powers, facing down trade unions as ‘the enemy
within’, a tougher rhetorical stance on sentencing, Cold War rearmament). In this
conception, Thatcherism sought to establish a hegemonic project involving “ideology,
economics and politics, a politics of support and a politics of power”20. Hall21 saw
‘Thatcherism’ as more than simply “the corresponding political bedfellow of a period of
capitalist recession” but as a dramatic rupture from the politics of the social-democratic
post-war consensus. Gilroy and Simm22 pointed out how the main innovation with respect
to ‘law and order’ during the Thatcher governments was to politicise and present the
repressive institutions of the state as necessary instruments in the fight against certain
‘subversive’ elements in society and winning the support for this from large sections, if not
the majority, of the British public. The politicisation of ‘law and order’ was a crucial break
brought forth by the Thatcher governments and the appeal of populism was understood as a
key reason for why almost a third of trade unionists voted for the Conservatives in May
19 Gamble 1988.
20 Gamble 1988, 223.
21 Hall 1979.
22 Gilroy and Simm 1985.

9
1979.23 Thatcher’s emphasis upon the politics of confrontation and the pitting of different
social sectors against each other to garner social support was most commonly associated
with the Miners’ Strike in 1981, and the reaction to the inner-city riots. In many ways, the
Thatcher governments of this period were quite distinctive and presented themselves as
breaking from the post-war consensus. The Conservatives were in office continuously for
18 years between 1979 and 1997 (under Margaret Thatcher until 1990, and then under John
Major), the longest unbroken period of rule by one party in the UK since 1830. These
factors combined would suggest a strong impact on the values of young people coming of
age in this political context.
Early research on the impact of Thatcherism on British public attitudes begun by
looking at straightforward over time change. Studies such as the one by Crewe24 had
looked at whether the electorate had become more focused on self-reliance and showed
decreasing enthusiasm for this idea. The turning point in the research on the attitudinal
impact of Thatcherism came with Russell et al.’s25 study which was pioneering in that it
was the first to study ‘Thatcher's Children’ and examine generational effects. They showed
that while ageing did show a tendency to increase Conservative identification, the
formative experiences of electoral generations resulted in persistent cohort differences.
Russell et al.26 concluded that socialization during Thatcher's term in office meant that first-
23 Hobsbawm 1979.
24 Crewe 1989.
25 Russell, Johnston and Pattie 1992.
26 Russell, Johnston and Pattie 1992.
10
time electors in the 1979 and 1987 elections were more Conservative than would have been
expected given their young age. By examining socialisation effects, this study showed that
the verdict was still out on whether Thatcherism had an influence on the electorate’s values.
Later, Heath and Park27 showed some signs of a Thatcherite shift finding evidence
that the 1980s generation was more materialistic than previous generations. Examining
cohort differences in British Election Study data, Tilley28 showed that the trend to move
away from the Conservatives amongst younger cohorts was reversed in the 1980s and
1990s. Later, Tilley and Heath29 showed how Thatcher was able to arrest the decline in
feelings of national pride and the trend towards more liberal young generations.30 Tilley
and Evans31 recently showed how the generations coming of age in periods of Conservative
ascendancy (the 1930s, 1950s and 1980s) were all more likely to support this party.
It was not until the late 1990s that aggregate studies of public opinion begun to
show a Thatcherite shift, supporting the idea of a process of underlying generational
replacement at play. Curtice and Jowell32 provide evidence that between 1985 and 1996
fewer people agreed that government should provide healthcare, pensions, control prices,
help industry grow, help poor families send their children to university, provide shelter for
27 Heath and Park 1997.
28 Tilley 2002.
29 Tilley and Heath 2007.
30 Tilley 2005.
31 Tilley and Evans 2014.
32 Curtice and Jowell 1997.
11
the poor, reduce inequality, provide jobs or help the unemployed. Evidence from the British
Social Attitudes Survey showed that the proportion of the electorate agreeing that
‘governments ought to redistribute income’ had fallen over time, from 45 percent in 1987
to 36 percent in 2009, while the proportion saying ‘government ought to spend more on
benefits’ fell from 55 percent in 1987 to 27 percent in 2009.33
‘Thatcher’s Grand-Children’ ?
Since Major did not set out to openly challenge Thatcher’s policies, we expect that
the socialisation experiences of young people coming of age during his time in office
should not have differed substantially from those coming of age under Thatcher’s
governments. The emergence of New Labour under Tony Blair, signalled that while
internally divided, Labour had also moved closer to the Thatcher agenda primarily as a
result of an ideological move dictated by the party leadership.34 Particularly from the
inception of New Labour in 1994, all three main parties were converging on a recognisably
Thatcher-influenced ‘middle ground’, so that the primacy of the market became the
accepted wisdom35 and Thatcherite polices were consolidated by Blair.36 Since New
Labour has been widely come to be understood as ‘Thatcherism by another name’37 and its
33 Curtice 2010.
34 Evans and Tilley 2012.
35 Heffernan 2000.
36 Curtice and Fisher 2003; Curtice 2009.
37 Hay 1996; Coates 2005; Shaw 2008; Faucher-King and Le Gales 2010.

12
values even less contested than was previously the case while she was in office, we test the
proposition that the values of the generation coming of age between 1997 and 2010 will be
even more right-wing and authoritarian than those of previous generations. Based on the
discussion above, we test the following two hypotheses:
H1: The cohort that came of age between 1979 and 1996 will be more right-wing
and more authoritarian than cohorts that came of age prior to this prolonged period
of Conservative rule.
H2: The cohort that came of age under New Labour between 1997 and 2010 will be
more right-wing and more authoritarian than cohorts that came of age before them.
Data and Methods
The analysis in this paper relies on British Social Attitudes survey data for the
period between 1985 and 2012. These are repeated cross-sectional surveys where
respondents were asked the same attitudinal and other questions at different points in time.
The dataset was constructed specifically for the purposes of this type of analysis.38 It thus
provides rich individual-level data on social attitudes and political values relevant to
Thatcherism as well as all the necessary control variables over a sufficiently long time span
to separate age, period and cohort effects.
38 Jennings, Gray, Hay and Farrall 2015.
13
Dependent Variables
While most studies on the generation politically socialised under Thatcher have
examined partisanship or just a few available indicators of left-right and libertarian-
authoritarian values, in this study we examine nine different indicators of right-
authoritarian values side-by-side. In each case the survey item has been recoded so that a
value of 1 indicates agreement with the Thatcherite position and a value of 0 indicates
disagreement.39 This allows direct comparison across indicators and means that in the
results an increasing trend suggests greater agreement with the Thatcherite stance in the
same way across all indicators. The variables tap into both left-right economic and
libertarian-authoritarian social values. More specifically, the following nine dependent
variables are analysed in this study:
1. What do you think about the income gap between the rich and the poor in the UK
today? 1 ‘About right’ or ‘Too small’; 0 ‘Too large’
2. Government should redistribute from the better off to the less well off.
1 Disagree/Strongly Disagree; 0 Neither, Agree/Strongly Agree
3. Government should spend more money on the poor even if it leads to higher taxes.
1 Disagree/Strongly Disagree; 0 Neither, Agree/Strongly Agree
39 While we run logistic models on dummy dependent variables for the age-period-cohort models, where it
was possible, we also ran the models as ordered logistic regression on the full scale as robustness checks.

14
4. Opinions differ about the level of benefits for the unemployed. Which of these best
reflects your opinion? 1 Benefits are too high and discourage people from finding
jobs; 0 Other response categories (i.e. Benefits are too low and cause hardship;
Neither; Both cause hardship; Some people benefit, some people suffer; About
right; Other)
5. Unemployed could find a job if they wanted to. 1 Agree/Strongly Agree; 0 Neither,
Disagree/Strongly Disagree
6. People should learn to stand on their own feet. 1 Agree/Strongly Agree; 0 Neither,
Disagree/Strongly Disagree
7. The death penalty is appropriate for some crimes. 1 Agree/Strongly Agree; 0
Neither, Disagree/Strongly Disagree
8. People who break the law should be given stiffer sentences. 1 Agree/Strongly
Agree; 0 Neither, Disagree/Strongly Disagree
9. Schools should teach children to obey authority. 1 Agree/Strongly Agree; 0 Neither,
Disagree/Strongly Disagree
APC Modelling Strategy
Generational theories, such as those discussed earlier, tend to argue that the context
of one’s socialisation is the most important factor for understanding differences in values

15
relative to ageing or period effects. However, research on cohort effects needs to address
the potentially confounding influences of age and period effects when estimating the
models. Age effects suggest that values change with social ageing and indeed research has
found that older people tend to be more conservative than younger people. Moreover,
certain periods signal a rightward shift for all individuals in society, such as for example
was expected of the period of Thatcher’s ascendancy in Britain. As such, in order to
identify cohort effects we will need to control also for both age and period, or year of
survey, in our models. This is issue is known as the age-period-cohort ‘identification
problem’ in the literature. It emerges since the three effects are in a linear relationship with
each other. As soon as we know two values we simultaneously know the third:
Year of Birth = Year - Age
In order to ‘identify’ the model and capture net effects it is necessary to apply
certain restrictions. This methodological hurdle has meant that a rich statistical literature
has emerged over the years presenting methods to ‘solve’ the ‘identification problem’ (see
for example the special symposium of 2014 in Electoral Studies for recent advances in
political science.)40 In this paper, we follow the method presented in Grasso41 which
consists in applying generalised additive models (GAMs) to plot the identified, smoothed
cohort effect and as well as testing for intergenerational differences with constrained age-
period-cohort models and post-estimation Wald tests. Since the data employed are from a
40 Neundorf and Niemi 2014.
41 Grasso 2014.
16
single country we do not need to apply generalised additive mixed models (GAMMs) in
this context but can safely rely on non-hierarchical generalized additive models (GAMs),
using the continuous year of birth variable for plotting the smoothed cohort effect to
overcome the identification problem. Moreover, to test for cohort differences we apply
Wald tests after estimating age-period-cohort regression models with a categorised cohort
variable reflecting the theoretical distinctions based on the historical period of socialisation.
The GAMs allow us to plot the nonlinear smoothed cohort effect since year of birth
is estimated as smoothly changing. There are different smoothing functions which could be
applied; smoothing splines are used here and the software package selected the smoothing
parameter by generalized cross-validation. This allows us to plot the non-parametric
smoothed curve for the effect of year of birth.42 The utility of the application of the GAMs
is that it permits us to visually check whether cohort effects are what we would expect
based on the categorised generations variable from the APC models. Arriving at the same
results with two different methods applying different types of restrictions give us greater
confidence in our results. This combined method for dealing with the identification
problem is particularly appropriate here as it has been developed specifically for research
questions examining political generations with repeated cross-sectional attitudinal data
typical in political science.43 GAMs are particularly useful for examining the non-linear
components of generational effects. Other approaches such as the intrinsic estimator (IE)
42 Tilley 2001; Tilley 2002; Tilley 2003; Neundorf 2010; Grasso 2011; Grasso 2014; Shorrocks 2016.
43 Grasso 2014.
17
and hierarchical APC (HAPC) models developed in demography and epidemiology are not
employed here since they are less suited to the current type of data structure and research
questions.44 Simulation studies have shown these methods run the risk of incorrectly
attributing trends in one of age, period and cohort to the other two terms. 45 Moreover,
Luo46 shows that IE relies on arbitrary and unjustified constraints. On the other hand, the
combined technique with constrained age-period-cohort models and GAMs applied in this
paper allows us to clearly test our hypotheses by applying the theoretically-derived cohort
groupings as well as checking the results for robustness.
Given that we are interested in cohort differences, year of birth is the main
independent variable. This ranges from 1910 to 1990. The idea of a ‘Thatcher effect’
implies that those generations socialised during the period of her ascendancy will be
particularly right-authoritarian. The key period of socialisation will largely depend on the
mechanism implied in theory.47 Given that here we are examining the formation of political
attitudes as a result of the ascendancy of a party in government we would expect that
socialisation should occur during the mid-teens to the mid-to late 20s. We use the method
presented in Grasso48 to assign individuals to different political generations based on the
historical phase in which they have spent the majority of their formative years. As such, we
44 Yang and Land 2006; Yang and Land 2008; Yang et al. 2008.
45 Bell and Jones 2014a; Bell and Jones 2014b.
46 Luo 2013.
47 Inglehart 1977; Inglehart 1990; Bartels and Jackman 2014.
48 Grasso 2014.
18
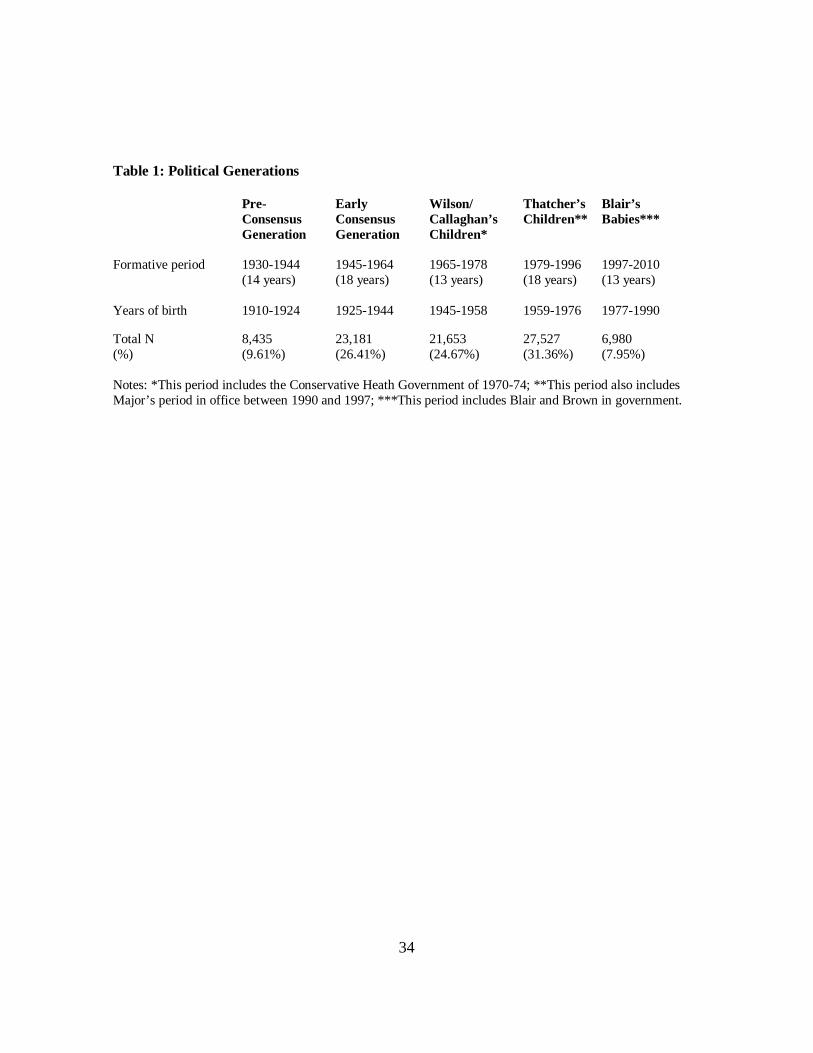
define Thatcher’s Children as those born between 1959 and 1976 and coming of age in the
protracted period of Conservative rule between 1979 and 1996 (we include1997 in the
following period). Thatcher’s Children and the other political generations analysed in this
study are presented in Table 1.
This method of categorising generations has the advantage that it places emphasis
on the historical period of a generation’s socialisation. The years of birth of the political
generations are then derived from this information. We include the categorised political
generations variable in the age-period-cohort models in order to (1) cross-check the
robustness of the results from the GAMs and (2) use Wald tests to test for cohort
differences. In the GAMs we use the continuous year of birth variable to derive the
smoothed cohort effects. Other than year of birth/cohort we also include age and period to
identify the age-period-cohort models. The description of variables henceforth applies to
both the GAMs and the age-period-cohort models. Age is coded as a three-level factor: (1)
under 34 years; (2) 35-59 year; (3) over 60 years. Year of survey is included as a
continuous variable. To test for robustness of the cohort effects, we ran the age-period-
cohort models with a number of alternative possible configurations of age and period.
INSERT TABLE 1 ABOUT HERE
Other Variables
We control for gender as well as education level, marital status, employment status,
household income, whether the respondent attended private school, home ownership, union
membership and Conservative party identification. In each case we use the most detailed

19
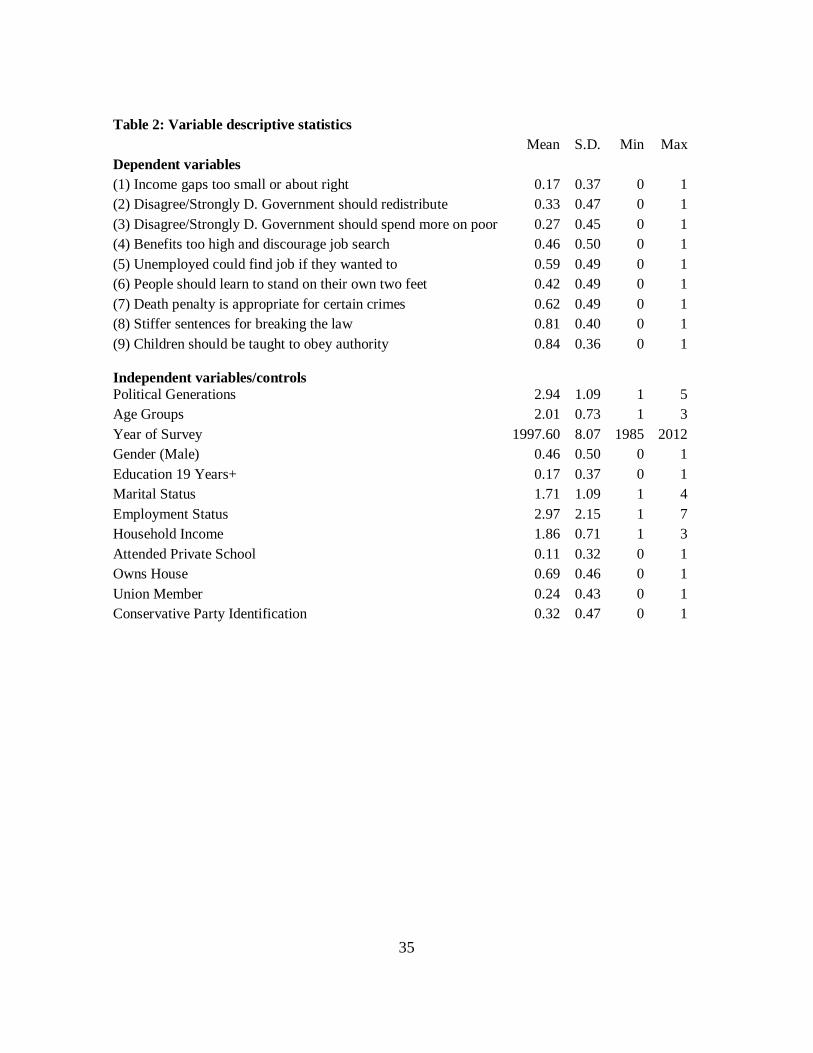
measures available in the over-time longitudinal file.49 Descriptive statistics for all these
variables are presented in Table 2.
INSERT TABLE 2 ABOUT HERE
Other than generation, younger age and also higher education levels tend to be
linked to greater liberalism.50 Younger cohorts are more likely to be highly educated and as
such more liberal than older cohorts. The expansion of education is one of the processes
mentioned by modernization theorists as leading to greater liberalism amongst younger
cohorts and therefore society as a whole through inter-generational replacement. As such
controlling for education and also student status should allow us to capture the generational
differences resulting from socialisation as opposed to the fact that younger cohorts have
other sorts of characteristics which should tendentially make them more socially liberal.51
While modernization theory implies that the shift from materialist to post-materialist values
is one that occurs primarily due to cohort replacement over time, in this way we can also
control for some compositional changes.
Controls for marital status (three categories: married, previously married and
single/never married) and employment status (seven categories: full time employment, part
time employment, unemployed/waiting for work, retired, student, taking care of the home
and other employment situation) are included to account for aspects of social ageing and
structural position. They also deal with the issue that married people tend to be more
49 Jennings, Gray, Hay and Farrall 2015.
50 Evans and De Graaf 1996.
51 Grasso 2013; Grasso and Giugni 2016.
20
conservative but that younger generations are less likely to settle into conventional family
arrangements than previous generations. Moreover, since some of the items pertain to
unemployed benefits, controlling for whether someone is seeking work is necessary.
Students and women are also generally more liberal groups whereas those retired from
employment tend to be more conservative, and as such including gender and employment
status in the models are helpful controls.
Class is an important variable for understanding social differences in political
values. Traditionally, the middle classes have tended to associate with, in Britain, the
Conservative Party, whereas the working classes have tended to support Labour. This
picture has become more complex with class dealignment and the waning relevance of
values concerning inequality and redistribution in political discourse, which traditionally
translated class divisions into party choice.52 In any case, we would expect individuals in
the middle class to be generally more likely to hold right-wing economic values,53 though
the picture for authoritarianism is less clear. We also include three additional measures of
privilege and social staus – household income (low, mid, high), whether the respondent
attended private school, and home ownership – since more privileged individuals are more
likely to defend inequality for obvious reasons and this might be reflected in the
composition of different cohorts. We also include controls for union membership and
Conservative party identification to deal with compositional differences between cohorts.
52 Evans and Tilley 2012.
53 Dunleavy’s sectoral cleavage suggests public vs private sector are likely to distinguish the middle classes in
their politcal values
21
INSERT TABLE 3 ABOUT HERE
Analysis
First we estimate age-period-cohort models with our categorised cohort variable (as
presented in Table 1). Next, in order to formally test whether certain political generations
are more Thatcherite than others, we ran Wald tests .While the age-period-cohort logistic
regression models presented in Table 3 allow us to see whether differences between each
cohort included in the model and the reference category (‘Wilson/Callaghan’s Children’)
are significant, Wald tests allow us to test for coefficient differences between the cohort
categories included in the model. The results for the Wald tests are presented in Table 4.
INSERT TABLE 4 ABOUT HERE
Turning first quickly to the controls, they generally exhibit the expected effects but
contrary to this gender does not have a consistent effect either on economic or social
values. As expected, married individuals are more conservative than both previously
married and single individuals. The same is true of individuals in full time employment
relative to all the other employment categories. As expected, individuals in the higher
income categories are more Thatcherite with respect to redistribution, inequality, benefits
and attitudes towards the unemployed. However, they are also less authoritarian than those
with low incomes. Having a private education makes one more Thatcherite with respect to
redistribution and inequality. However, it also makes one less likely to agree with the
negative sentiments about benefits and the unemployed as well as making one less
authoritarian. As expected, home ownership tends to predict Thatcherism as
(unsurprisingly) does party identification whereas union membership decreases the

22
likelihood that one will agree with Thatcherite values. Class is an interesting variable.
Relative to the middle class, all lower classes are less likely to agree that the income gap is
too small or about right. The working class is more likely relative to the middle class to
agree that government should redistribute. However, there are no class differences for the
survey item that suggests a trade-off between redistribution and taxation. Interestingly, all
three items on benefits and all three items on authoritarianism show that all other classes
are more likely to agree with the Thatcherite tendency than the higher middle class,
controlling for all the other variables in the models, supporting the populist story-line.
Turning to the age-period-cohort results, first it should be noted that there are some
small age effects with the middle aged group more likely than the younger age group to
support redistribution in the face of higher taxes, to express more positive views of the
unemployed and to disagree that the death penalty is appropriate for some crimes. Those in
the oldest age group are less likely to agree with the Thatcherite position on redistribution
than the youngest age group but are more likely to think poorly of benefit seekers and to
want children to be taught to obey authority. The effects for year of survey show that with
the exception of the inequality item there are significant period effects with increasing
support for the Thatcherite position in all cases bar support for the death penalty. This in
itself suggests that, slowly, over 20 or more years, the electorate was indeed becoming
more Thatcherite, particularly with respect to negative attitudes towards the benefits
system, the unemployed, benefit recipients and the welfare system more generally.
The coefficients for political generations in the age-period-cohort models presented
in Table 3 in conjunction with the results from the Wald tests presented in Table 4 show

23
that across eight of nine indicators, Thatcher’s Children are more right-wing and
authoritarian than the generation preceding them: i.e. Wilson/Callaghan’s Children. This
provides support to our first hypothesis (H1). Blair’s Babies are also more right-wing and
authoritarian than this political generation, confirming that Thatcherite values were
reproduced under New Labour, have strengthened and become embedded in the generation
coming of age after Thatcher’s time in office. This is consistent with H2. Thatcher’s
Children and Blair’s Babies are even more right-wing economically than the generation that
came of age before the Post-War Consensus. Blair’s Babies in particular are almost as
negative about benefits and the welfare system as the generation that came of age before it
was created. They also are about as authoritarian as the oldest generations, showing that the
trend toward modernization and greater social liberalism was at least slowed down in
Britain under the Thatcher governments.
As explained in the data and methods section, in order to provide robustness tests
for the results from the age-period-cohort models, next we examine the visual results from
the generalized additive models (GAMs). In particular, we examine the plots of the
smoothed cohort effect from the full model (not shown) with all the same controls included
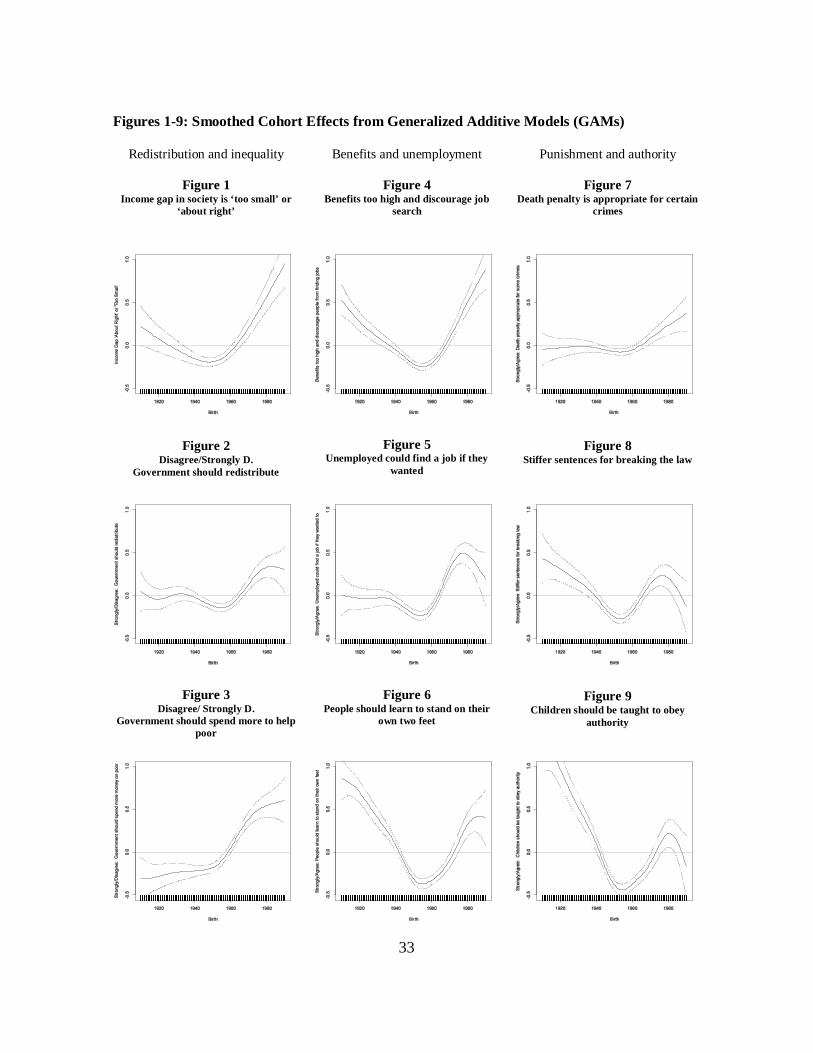
just as in the age-period-cohort models. These plots are as presented in Figures 1-9.54
The patterns are striking and consistent. Across all nine indicators, there is an
upward swing in right-authoritarian values from around the start of the political generation
54 The smoothed term is always highly significant. As standard, we judge the significance through the edf
value. A value greater than 1 suggests significance and that the smoothing should be applied.
24
(i.e. those born in 1959) at least up into the end of it (i.e. those born in 1976), and in several
cases lasting well beyond. This suggests Thatcherite values were growing in strength
among the cohort who became political adults during the Thatcher years. With the
exception of two out of nine figures one can see an upswing over the years of birth of
Thatcher’s Children, thus reversing a trend towards greater support for redistribution and
social egalitarianism observed for previous political generations (i.e. the cohorts born
before 1959). This provides clear support for the theoretical expectation of a ‘Thatcher
effect’ (H1). It is especially noticeable that the curve bends upwards and commences the
increasing trend precisely at the end of the 1950s (i.e. the years of birth of the oldest of
Thatcher’s Children).
INSERT FIGURES 1-9 ABOUT HERE
While the curve over the years of birth of Thatcher’s Children does not always rise
back to the levels of the Pre- and Early Consensus generations, there is clearly a tendency
towards greater conservatism that starts with Thatcher’s Children (i.e. those born during the
period 1959 to 1978) across all nine indicators. With respect to the political generation born
between 1977 and 1990, i.e. Blair’s Babies (or Thatcher’s Grand-Children), we find that in
some cases the upward trend continues, for example on the income gap between rich and
poor (Figure 1), that benefits are too high (Figure 4) and that the death penalty is
appropriate for some crimes (Figure 7). In other cases, however, there is a counter-tendency
and it looks like the trend might level off or even reverse, such as for whether people who
break the law should be given stiffer sentences (Figure 9), although the confidence intervals
are typically too wide to be able to know for sure at the time of writing. More years of data

25
are needed to clarify trends in social values amongst the youngest members of this new
political generation. Regardless, with respect to attitudes on redistribution (Figures 1-3) the
curve ends at a higher point than its level over the years of birth of the Pre- and Early
Consensus Generations providing evidence that Blair’s Babies are a distinctly right-wing
cohort in their economic values, consistent with our second hypothesis (H2). Moreover,
with respect to authoritarian values, Thatcher’s Children exhibit a clear slowing down and
reversal of the modernization tendency towards greater social liberalism, consistent with
H1. In particular, with respect to support for inequality, redistribution, and particularly
redistribution versus taxation, but also attitudes to the unemployed/benefits, Thatcher’s
Children and Blair’s Babies are more right-wing than any of the three older generations.
This provides considerable support for our theoretical expectations.
We thus find mixed support for each hypothesis. With respect to the first
hypothesis, the results confirm that Thatcher’s Children are indeed more right-wing and
authoritarian than the generation preceding them, the more liberal Wilson/Callaghan’s
Children. This is true when we examine eight out of nine attitudinal variables capturing
different dimensions of Thatcherite beliefs. Thatcher’s period in office reversed the
generational trend in social values. With respect to the second hypothesis, we find evidence
that Blair’s Babies are, indeed, also more right-wing and authoritarian than Wilson/
Callaghan’s Children. They are also more economically right-wing than both the Pre- and
Early Consensus Generations, but not more socially authoritarian than either. Overall then,
Blair’s Babies, stand out as the most economically right-wing generation; they are also
more authoritarian than Thatcher’s Children. Our models thus show that the generation
26
coming of age in the aftermath of the Cold War, once Thatcher had left office, stands out as
the most economically conservative, net of both period and age effects. Overall, the results
provide some support for the idea of a political generation of ‘Thatcher’s Children’, in the
fact that with this cohort we see a reversal of the trend towards greater social liberalism and
support for redistribution. These results also suggest that rendering Thatcherite values
uncontentious (under Blair) was more significant for ensuring their long-term endurance.
To test whether it was Labour party identifiers in particular who moved to the right
under Blair,55 we included an interaction effect of Labour party identification with Blair’s
Babies. This interaction effect was significant for the three redistribution and inequality
indicators as well as for the three welfare items. However, this was not the case for the
three authoritarian values indicators. These results therefore show that it was in the
particular the generation coming of age under New Labour and identifying with this party
that moved to the right. This further strengthens the conclusion that Blair achieved more
than Thatcher had done in terms of cementing her principles in British society and that in
particular this was achieved through Labour supporters themselves embracing more right-
wing positions as these became mainstream and uncontested in society.56 Additionally, we
also ran a series of interaction tests with various socio-demographic and regional variables
which showed that the generational differences were generally consistent across groups.57
55 Curtice and Fisher 2003.
56 Curtice and Fisher 2003.
57 We tested interaction effects with class and union membership across models but could not find any
systematic patterns and our overall results are robust to these additional analyses. There was limited evidence

27
Conclusions
The results presented in this paper offer strong evidence of cohort effects. We have
shown that generations coming of age under sustained periods of Conservative government
absorb these values, offsetting the tendency towards social liberalism which is normally
characteristic of youth. More specifically, since we examined British data we showed that
the generation that came of political age during Thatcher and Major’s time in office is a
particularly conservative generation, deserving of the epithet ‘Thatcher’s Children’. But we
have not just found more evidence of ‘Thatcher’s Children’ – we have also discovered her
‘Grand-children’ in ‘Blair’s Babies’.
We analysed indicators of Thatcherite values across three dimensions: redistribution
and inequality, benefits and unemployment, punishment and authority and found that this
generation – born between 1959 and 1976 – reversed the cohort trend towards greater
support for redistribution and more social liberalism. This pattern is largely continued in the
for the survey items ‘Government should spend more money to help poor’ and ‘Benefits too high and
discourage job search’ that the generation gap was smaller amongst individuals in unskilled manual
occupations relative to individuals in the highest professional class. Similarly, being a union member amongst
Blair’s Babies narrowed the gap in values with the Wilson-Callaghan generation. The only items for which
there was variation across regions were those on unemployment and benefits: ‘Benefits too high and
discourage job search’, ‘Unemployed could find a job if they wanted’ and ‘People should learn to stand on
their own two feet’ with all other regions being more right-wing than Scotland, but results for generation
effects remained unchanged. Testing further with interaction effects between region and generation showed
that this regional gap was narrower for younger cohorts.
28
subsequent generation of Thatcher’s Grand-Children, supporting the idea that Thatcherite
values were reproduced, not challenged, under New Labour. Our analyses showed that
Blair’s Babies are even more right-authoritarian. It seems that the trend towards ever-
greater social liberalism was halted and even reversed, supporting the idea that Thatcherism
has served fundamentally to change British social attitudes in an enduring way. The timing
of the upward trend in the GAM smoothed cohort effect plots coincide precisely with the
years of birth of Thatcher’s Children. This occurs at precisely the same time across all
indicators. By disentangling age-period-cohort effects through new statistical techniques
and the analysis of a long time series of attitudinal data we have shown that Thatcher’s
crusade was not a failure but rather a success both with respect to the promotion and
consolidation of economic but also social values. Thatcher’s moral crusade was extremely
successful both in terms of changing the values of the new generation coming of age at that
time, but also in terms of influencing society to such an extent that New Labour came to
accept these as the setting the ideational parameters of political completion.
How these trends in social values unfold will also be enlightening, and only time
will tell whether fragmentation of the British party system, fallout from the economic crisis
and the era of austerity will influence these trajectories. While our data are British these
results may also have relevance for countries who have experienced protracted periods of
conservative rule and where the New Right was popular, such as Canada, Australia, New
Zealand and the United States.58 It is likely that comparable political environments will
have had similarly formative impacts on newer political generations. There are implications
58 Duménil and Lé́vy 2011; Swarts 2013; Kotz 2015.

29
for modernization theory as well in terms of what sorts of events might provide counter-
tendencies to the inexorable logic of greater tolerance and social liberalism.
Most importantly, this paper shows that particularly significant events such as the
protracted rule of one party followed by a centrist shift towards that parties position from
the opposition are important “formative experiences” for new generations. Moreover, we
have also shown that such changes can have spill-over effects through the reproduction of
certain values when subsequent governments or parties in power do not challenge the
values that formed that generation. This trickle-down theory of social change can explain
why Thatcherite attitudes are more prevalent still in ‘Blair’s Babies’ or ‘Thatcher’s Grand-
Children’. This is a clear sign that Thatcher changed the course of British politics and social
attitudes. Her values (or the values that have come to be associated with her name)
permeate British society today as subsequent governments have not challenged her
ideology. For better or worse, it seems that we still live in ‘Thatcher’s Britain’.
30
References
Bartels, Larry, and Simon Jackman. 2014. "A generational model of political learning." Electoral Studies 33:7-18.
Bartle, John, Sebastian Dellepiane-Avellaneda, and James A. Stimson. 2011. "The Moving Centre: Preferences for Government Activity in Britain, 1950–2005." British Journal of Political Science 41:259–85.
Bell, Andrew, and Kelvyn Jones. 2014a. "Another 'futile quest'? A Simulation Study of Yang and Land's hierarchical age-period-cohort model." Demographic Research 30:333–60.
———. 2014b. "Don’t Birth Cohorts Matter? A commentary and simulation exercise on Reither, Hauser, and Yang's (2009) age-period-cohort study." Social Science & Medicine 101:176–80.
Braedley, Susan, and Meg Luxton, eds. 2010. Neoliberalism and Everyday Life. Montreal: McGill-Queens University Press.
Coates, David. 2005. Prolonged Labour: The Slow Birth of New Labour Britain. Basingstoke: Palgrave.
Crewe, Ivor. 1988. "Has the electorate become Thatcherite?" In Thatcherism, ed. R. Skidelsky. London: Chatto and Windus.
———. 1989. "Values: The Crusade that Failed " In The Thatcher Effect, ed. D. Kavanagh and A. Seldon. Oxford: The Clarendon Press.
Curtice, John. 2009. "Were British Voters Transformed by Thatcherism?" British Politics Review 4 (1):7.
———. 2010. "Thermostat or weathervane: public reactions to spending and redistribution under New Labour." In British Social Attitudes: The 26th Report, ed. A. Park, J. Curtice, K. Thomson and M. Phillips. London: Sage.
Curtice, John, and Stephen Fisher. 2003. "The Power to Persuade? A Tale of Two Prime Ministers." In British Social Attitudes: the 20th Report, ed. A. Park. London: Sage.
Curtice, John, and Roger Jowell. 1997. "Trust in the Political System." In British Social Attitudes: the 14th Report. The End of Conservative Values?, ed. R. Jowell, J. Curtice, A. Park and L. Brook. Ashgate: Aldershot.
Duménil, Gérard, and Dominique Lé́vy. 2011. The Crisis of Neo-liberalism. Cambridge, MA: Harvard University Press.
Dunleavy, Patrick, and Hugh Ward. 1981. "Exogenous Voter Preferences and Parties with State Power: Some Internal Problems of Economic Theories of Party Competition." British Journal of Political Science 11 (3):351-80.
Erikson, Robert S., Michael B. Mackuen, and James A. Stimson. 2002. The Macro Polity. Cambridge: Cambridge University Press.
Erikson, Robert, and Laura Stoker. 2011. "Caught in the Draft: The Effects of Vietnam Draft Lottery Status on Political Attitudes." American Political Science Review 105:221-37.
Evans, Geoff, and Nan Dirk De Graaf. 1996. "Why are the young more postmaterialist? A Cross-National Analysis of Individual and Contextual Influences on Postmaterial Values." Comparative Political Studies 28 (4):608-35.
31
Evans, Geoff, and James Tilley. 2012. "The Depoliticization of Inequality and Redistribution: Explaining the Decline of Class Voting." The Journal of Politics 74 (4):963-76.
Faucher-King, Florence, and Patrick Le Galés. 2010. The New Labour Experiment: Change and Reform Under Blair and Brown Stanford, CA: Stanford University Press.
Gamble, Andrew. 1988. The Free Economy and the Strong State: The Politics of Thatcherism. Basingstoke Palgrave Macmillan.
Gilroy, Paul, and Joe Simm. 1985. "Law, Order and the State of the Left." Capital & Class 9 (1):15-55.
Grasso, Maria Teresa. 2011. Political Participation in Western Europe, D.Phil. Thesis, Nuffield College, University of Oxford.
———. 2013. "The Differential Impact of Education on Young People’s Political Activism: Comparing Italy and the United Kingdom." Comparative Sociology 12:1-30.
———. 2014. "Age-period-cohort analysis in a comparative context: Political generations and political participation repertoires." Electoral Studies 33 63-76.
———. 2016. Generations, Political Participation and Social Change in Western Europe. London: Routledge.
Grasso, Maria Teresa, and Marco Giugni. 2016. "Do Issues Matter? Anti-Austerity Protests’ Composition, Values, and Action Repertoires Compared." Research in Social Movements, Conflicts and Change 39.
Hall, Stuart. 1979. "The Great Moving Right Show." Marxism Today. Hay, Colin. 1996. Re-stating Social and Political Change Milton Keynes: Open University
Press ———. 2004. "The normalizing role of rationalist assumptions in the institutional
embedding of neoliberalism." Economy and society 33 (4):500-27. Heath, Anthony, and Alison Park. 1997. "Thatcher's Children?" In British Social Attitudes:
The end of Conservative values? (the 14th Report), ed. R. Jowell. London: Sage. Heffernan, Richard. 2000. New Labour and Thatcherism Basingstoke: Macmillan. Hobsbawm, Eric. 1979. "The Forward March of Labour Halted? – A Response." Marxism
Today. Inglehart, Ronald. 1977. The silent revolution: changing values and political styles among
Western publics. Princeton: Princeton University Press. ———. 1990. Culture Shift in Advanced Industrial Society. Princeton: Princeton
University Press. Inglehart, Ronald, and Christian Welzel. 2005. Modernization, cultural change and
democracy: The human development sequence. Cambridge, UK: Cambridge University Press.
Jennings, Will, Emily Gray, Colin Hay, and Stephen Farrall. 2015. "Collating longitudinal data on crime, victimization and social attitudes in england and wales: a new resource for exploring long-term trends in crime." British Journal of Criminology Advance Access doi:10.1093/bjc/azv006.
Kotz, David M. 2015. The Rise and Fall of Neoliberal Capitalism. Cambridge, MA: Harvard University Press.

32
Mannheim, Karl. 1928. "The Problem of Generations " In Essays on the Sociology of Knowlegde London: Routledge.
Neundorf, Anja. 2010. "Democracy in Transition: A Micro perspective on System Change in Post-Socialist Societies." Journal of Politics 72 (4):1096-108.
Neundorf, Anja, and Richard G. Niemi. 2014. "Beyond political socialization: New approaches to age, period, cohort analysis." Electoral Studies 33:1-6.
Russell, Andrew T., Ron J. Johnston, and Charles J. Pattie. 1992. "Thatcher's Children: Exploring the Links between Age and Political Attitudes." Political Studies 40 (4):742-56.
Shaw, Eric. 2008. Losing Labour's Soul?: New Labour and the Blair Government 1997-2007. London: Routledge.
Shorrocks, Rosalind 2016. "Modernisation and government socialisation: Considering explanations for gender differences in cohort trends in British voting behaviour." Electoral Studies 42:237-48.
Sowell, Thomas. 2012. Trickle down theory and tax cuts for the rich. Stanford: Hoover Institution Press.
Swarts, Jonathan. 2013. Constructing Neoliberalism: Economic Transformation in Anglo-American Democracies. Toronto: University of Toronto Press.
Tilley, James. 2001. Social and Political Generations in Contemporary Britain, D.Phil. Thesis, Nuffield College, University of Oxford.
———. 2002. "Political Generations and Partisanship in the UK, 1964-1997." Journal of the Royal Statistical Society, Series A (Statistics in Society) 165 (1):121-35.
———. 2003. "Party Identification in Britain: Does Length of Time in the Electorate Affect Strength of Partisanship?" British Journal of Political Science 33 (2):332–44.
———. 2005. "Libertarian-Authoritarian Value Change in Britain, 1974-2001." Political Studies 53:442-53.
Tilley, James, and Geoff Evans. 2014. "Ageing and Generational Effects on Vote Choice " Electoral Studies 33:19-27.
Tilley, James, and Anthony Heath. 2007. "The Decline of British National Pride." British Journal of Sociology 58 (4):661-78.
Yang, Yang, and Kenneth Land. 2008. "Age-Period-Cohort Analysis of Repeated Cross-Section Surveys: Fixed or Random Effects?" Sociological Methods & Research 36 (3):297-326.
Yang, Yang, and Kenneth Land. 2006. "A mixed models approach to the age-period-cohort analysis of repeated cross-section surveys, with an application to data on trends in verbal test scores." Sociological methodology 36:75-97.
Yang, Yang, Sam Schulhofer-Wohl, Wenjiang Fu, and Kenneth Land. 2008. "The Intrinsic Estimator for Age-Period-Cohort Analysis: What it is and how to use it." American Journal of Sociology 113 (6):1697-736.
33
Figures 1-9: Smoothed Cohort Effects from Generalized Additive Models (GAMs)
Redistribution and inequality Benefits and unemployment Punishment and authority
Figure 1 Income gap in society is ‘too small’ or
‘about right’
Figure 4 Benefits too high and discourage job
search
Figure 7 Death penalty is appropriate for certain
crimes
Figure 2 Disagree/Strongly D.
Government should redistribute
Figure 5
Unemployed could find a job if they wanted
Figure 8
Stiffer sentences for breaking the law
Figure 3 Disagree/ Strongly D.
Government should spend more to help poor
Figure 6
People should learn to stand on their own two feet
Figure 9
Children should be taught to obey authority
34
Table 1: Political Generations Pre-
Consensus Generation
Early Consensus Generation
Wilson/ Callaghan’s Children*
Thatcher’s Children**
Blair’s Babies***
Formative period 1930-1944 (14 years)
1945-1964 (18 years)
1965-1978 (13 years)
1979-1996 (18 years)
1997-2010 (13 years)
Years of birth 1910-1924 1925-1944 1945-1958 1959-1976 1977-1990
Total N (%)
8,435 (9.61%)
23,181 (26.41%)
21,653 (24.67%)
27,527 (31.36%)
6,980 (7.95%)
Notes: *This period includes the Conservative Heath Government of 1970-74; **This period also includes Major’s period in office between 1990 and 1997; ***This period includes Blair and Brown in government.
35
Table 2: Variable descriptive statistics
Mean S.D. Min Max
Dependent variables (1) Income gaps too small or about right 0.17 0.37 0 1
(2) Disagree/Strongly D. Government should redistribute 0.33 0.47 0 1 (3) Disagree/Strongly D. Government should spend more on poor 0.27 0.45 0 1 (4) Benefits too high and discourage job search 0.46 0.50 0 1 (5) Unemployed could find job if they wanted to 0.59 0.49 0 1 (6) People should learn to stand on their own two feet 0.42 0.49 0 1 (7) Death penalty is appropriate for certain crimes 0.62 0.49 0 1 (8) Stiffer sentences for breaking the law 0.81 0.40 0 1 (9) Children should be taught to obey authority 0.84 0.36 0 1 Independent variables/controls Political Generations 2.94 1.09 1 5 Age Groups 2.01 0.73 1 3 Year of Survey 1997.60 8.07 1985 2012 Gender (Male) 0.46 0.50 0 1 Education 19 Years+ 0.17 0.37 0 1 Marital Status 1.71 1.09 1 4 Employment Status 2.97 2.15 1 7 Household Income 1.86 0.71 1 3 Attended Private School 0.11 0.32 0 1 Owns House 0.69 0.46 0 1 Union Member 0.24 0.43 0 1 Conservative Party Identification 0.32 0.47 0 1

Table 3: Age-Period-Cohort Models: Right-Authoritarian Values (1) (2) (3) (4) (5) (6) (7) (8) (9)
Political Generations
Income gap in
society is too small or about
right
Disagree/ Strongly D. Government
should redistribute
Disagree/ Strongly D. Government should spend more to help
poor
Benefits too high and
discourage job search
Unemployed could find a job if they
wanted
People should learn to stand on their own two feet
Death penalty is
appropriate for certain
crimes
Stiffer sentences for breaking the
law
Children should be taught to
obey authority
(ref.: Wilson/Callaghan’s Children) Pre-Consensus Generation 0.30*** 0.13* 0.03 0.52*** 0.24*** 0.87*** 0.10 0.55*** 1.20*** (0.09) (0.06) (0.08) (0.06) (0.06) (0.06) (0.06) (0.08) (0.10) Early Consensus Generation 0.14** 0.14*** 0.04 0.24*** 0.17*** 0.44*** 0.09* 0.27*** 0.56*** (0.05) (0.04) (0.05) (0.04) (0.04) (0.04) (0.04) (0.05) (0.05) Thatcher’s Children 0.27*** 0.09** 0.35*** 0.15*** 0.19*** 0.11** 0.06 0.19*** 0.13*** (0.05) (0.03) (0.04) (0.03) (0.04) (0.04) (0.03) (0.04) (0.04) Blair’s Babies 0.72*** 0.32*** 0.47*** 0.64*** 0.34*** 0.50*** 0.17** 0.21** 0.41*** (0.09) (0.06) (0.07) (0.06) (0.07) (0.07) (0.06) (0.07) (0.08) Age Groups (ref.: Under 34 Years) 35-59 Years 0.08 -0.05 -0.19*** -0.02 -0.21*** -0.06 -0.07* -0.10* 0.09* (0.05) (0.04) (0.04) (0.03) (0.04) (0.04) (0.04) (0.04) (0.04) Over 60 Years 0.03 -0.17** -0.30*** 0.20*** -0.07 0.25*** -0.10 -0.04 0.18* (0.09) (0.06) (0.07) (0.06) (0.07) (0.07) (0.06) (0.08) (0.08) Year of Survey 0.00 0.02*** 0.04*** 0.07*** 0.07*** 0.07*** -0.02*** 0.04*** 0.01*** (0.00) (0.00) (0.00) (0.00) (0.00) (0.00) (0.00) (0.00) (0.00) Gender (Male) 0.15*** -0.13*** 0.01 -0.21*** -0.16*** -0.03 0.33*** -0.16*** 0.14*** (0.04) (0.02) (0.03) (0.02) (0.03) (0.03) (0.02) (0.03) (0.03) Education 19 Years+ -0.15** -0.28*** -0.12*** -0.40*** -0.49*** -0.48*** -0.89*** -0.81*** -0.50*** (0.04) (0.03) (0.03) (0.03) (0.03) (0.03) (0.03) (0.03) (0.03) Marital Status (ref.: Married) Previously Married 0.13** -0.03 -0.08* -0.07** -0.04 -0.09** -0.18*** -0.25*** -0.20*** (0.04) (0.03) (0.03) (0.03) (0.03) (0.03) (0.03) (0.03) (0.04) Single (Never Married) 0.05 -0.04 -0.08* -0.31*** -0.15*** -0.18*** -0.42*** -0.46*** -0.35*** (0.05) (0.03) (0.04) (0.03) (0.03) (0.03) (0.03) (0.03) (0.04) Employment Status (ref.: Employed FT) Employed PT -0.05 -0.03 -0.03 -0.10** -0.18*** -0.17*** -0.16*** -0.18*** -0.12** (0.05) (0.04) (0.04) (0.03) (0.04) (0.04) (0.03) (0.04) (0.04) Unemployed/Waiting for Work 0.18* -0.16** -0.48*** -1.04*** -0.93*** -0.92*** -0.26*** -0.47*** -0.29*** (0.07) (0.06) (0.07) (0.06) (0.06) (0.06) (0.05) (0.06) (0.06) Education -0.34 -0.17 -0.41** -0.45*** -0.47*** -0.36** -0.63*** -0.74*** -0.62***

(0.23) (0.13) (0.15) (0.12) (0.13) (0.13) (0.11) (0.12) (0.12) Retired 0.09 0.05 -0.19*** -0.21*** -0.41*** -0.26*** -0.17*** -0.12* -0.05 (0.07) (0.05) (0.06) (0.04) (0.05) (0.05) (0.05) (0.06) (0.07) Looking after Home 0.22*** -0.10* -0.34*** -0.40*** -0.53*** -0.42*** -0.11** -0.19*** -0.14** (0.06) (0.04) (0.05) (0.04) (0.04) (0.04) (0.04) (0.05) (0.05) Other Employment Situation -0.08 -0.21*** -0.62*** -0.77*** -0.67*** -0.79*** -0.03 -0.13* -0.03 (0.08) (0.05) (0.07) (0.05) (0.05) (0.06) (0.05) (0.06) (0.07) Household Income (ref.: Low) Mid 0.12** 0.30*** 0.26*** 0.22*** 0.16*** 0.14*** -0.18*** -0.17*** -0.18*** (0.04) (0.03) (0.04) (0.03) (0.03) (0.03) (0.03) (0.04) (0.04) High 0.68*** 0.71*** 0.32*** 0.28*** 0.36*** 0.16*** -0.35*** -0.38*** -0.33*** (0.06) (0.04) (0.05) (0.04) (0.04) (0.04) (0.04) (0.05) (0.05) Attended Private School 0.16*** 0.11*** -0.05 -0.11*** -0.11** -0.20*** -0.30*** -0.38*** -0.07 (0.04) (0.03) (0.04) (0.03) (0.04) (0.04) (0.03) (0.04) (0.04) Owns House -0.02 0.30*** 0.26*** 0.25*** -0.02 0.15*** -0.11*** 0.01 0.17*** (0.04) (0.03) (0.03) (0.02) (0.03) (0.03) (0.03) (0.03) (0.03) Union Member -0.28*** -0.19*** -0.09** -0.19*** -0.29*** -0.18*** -0.10*** -0.06* -0.21*** (0.04) (0.03) (0.03) (0.02) (0.03) (0.03) (0.03) (0.03) (0.03) Social Class (ref. Class I) Class II -0.20** 0.14** -0.05 0.14** 0.15** 0.16** 0.11* 0.22*** -0.04 (0.07) (0.05) (0.05) (0.05) (0.05) (0.06) (0.05) (0.05) (0.06) Class IIIM -0.29*** 0.03 -0.01 0.23*** 0.30*** 0.35*** 0.42*** 0.62*** 0.31*** (0.07) (0.05) (0.06) (0.05) (0.06) (0.06) (0.05) (0.05) (0.06) Class III NM -0.38*** -0.09 -0.02 0.26*** 0.51*** 0.52*** 0.76*** 0.82*** 0.41*** (0.07) (0.05) (0.06) (0.05) (0.06) (0.06) (0.05) (0.06) (0.07) Class IV -0.20* -0.26*** -0.06 0.20*** 0.45*** 0.48*** 0.61*** 0.81*** 0.32*** (0.08) (0.06) (0.06) (0.05) (0.06) (0.06) (0.05) (0.06) (0.07) Class V -0.00 -0.30*** -0.14 0.17** 0.49*** 0.56*** 0.72*** 0.75*** 0.32*** (0.09) (0.07) (0.08) (0.06) (0.07) (0.07) (0.07) (0.08) (0.09) Conservative Party Identification 0.93*** 1.12*** 0.84*** 0.86*** 0.63*** 0.80*** 0.60*** 0.71*** 0.78*** (0.03) (0.02) (0.03) (0.02) (0.02) (0.02) (0.02) (0.03) (0.03) Constant -9.02 -46.50*** -89.69*** -131.83*** -149.17*** -148.89*** 48.78*** -71.78*** -24.82*** (5.16) (3.87) (4.80) (3.65) (4.34) (4.48) (3.92) (4.65) (5.09) N 33848 48399 39029 48817 39052 39036 46613 46651 46596 Pseudo R2 0.054 0.089 0.069 0.095 0.072 0.093 0.083 0.085 0.068 Log lik. -14775.56 -28119.20 -21080.37 -30145.42 -24963.98 -23846.78 -28395.55 -21595.10 -18872.24 Standard errors in parentheses * p < 0.05, ** p < 0.01, *** p < 0.001

Table 4: Wald Tests for Intergenerational Differences from the Age-Period-Cohort Models (1) (2) (3) (4) (5) (6) (7) (8) (9)
Income
gap in society is too small or about
right
Disagree/ Strongly D. Government
should redistribute
Disagree/ Strongly D. Government should spend more to help
poor
Benefits too high and
discourage job search
Unemployed could find a job if they
wanted
People should learn to stand on their own two feet
Death penalty is
appropriate for certain
crimes
Stiffer sentences for breaking the
law
Children should be taught to
obey authority
Pre-Consensus Generation= Early Consensus Generation
**
ns ns ***
ns ***
ns ***
***
Pre-Consensus Generation = Thatcher’s Children
ns ns ***
***
ns ***
ns ***
***
Early Consensus Generation= Thatcher’s Children
ns ns ***
ns ns ***
ns ns ***
Thatcher’s Children = Blair’s Babies
***
***
ns ***
**
***
**
ns ***
Pre-Consensus Generation = Blair’s Babies
**
ns ***
ns ns ***
ns *
***
Early Consensus Generation= Blair’s Babies
***
*
***
***
*
ns ns ns ns
A significant result implies cohort differences between each given pair in the rows for each of the dependent variables in the columns. See coefficients in Table 3 for direction of effects. * p < 0.05, ** p < 0.01, *** p < 0.001


![Death of Dr David Kelly [Damning New Evidence Points to a Cover-up by Tony Blair’s Government] [2010]](https://static.fdocuments.us/doc/165x107/577cc0ed1a28aba71191a1d1/death-of-dr-david-kelly-damning-new-evidence-points-to-a-cover-up-by-tony.jpg)


