Thatcherism-01-c.qxd 4/12/13 15:12 Page 240 · being offered to people after more than three...
33
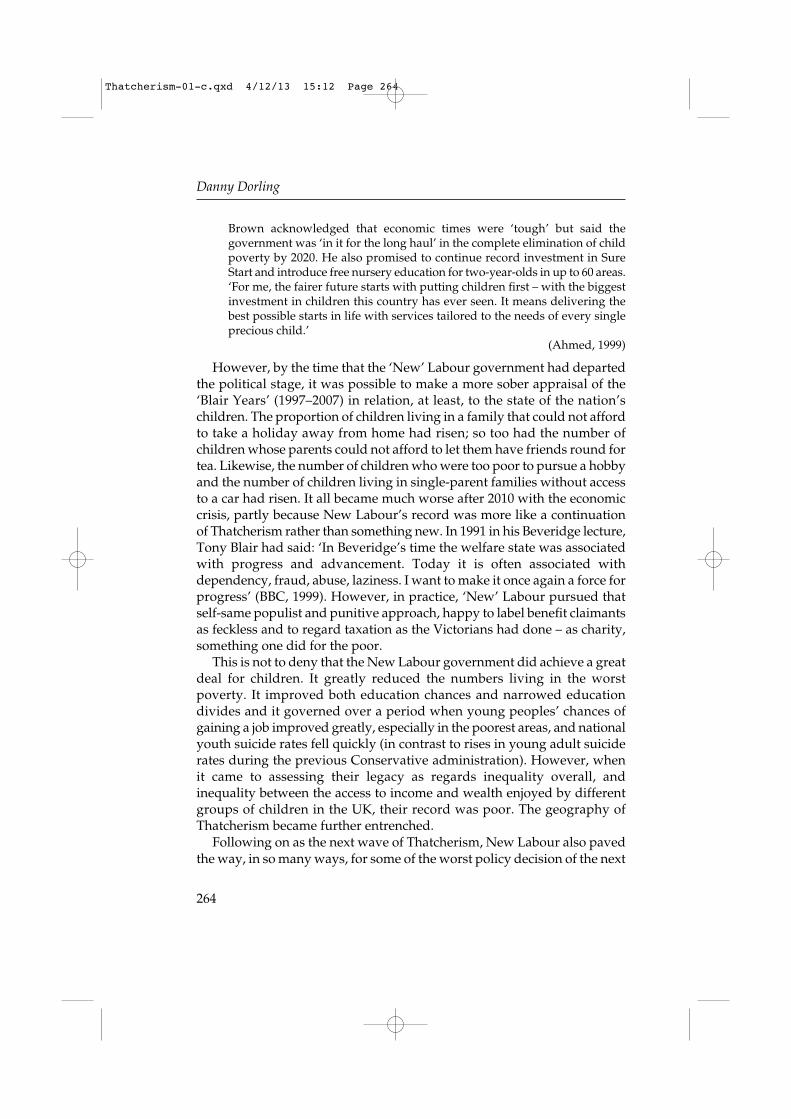
8 Mapping the Thatcherite legacy: the human geography of social inequality in Britain since the 1970s DANNY DORLING Introduction British academics of my generation, and some a great deal younger, are often fascinated by Thatcherism and its legacy. When reviewing Peter Dorey’s book, British Conservatism: The Politics and Philosophy of Inequality, Emily Robinson (2011) explained that the book helped answer Kevin Hickson’s plea for more work to be done on the Conservatives’ attitudes to inequality: As both Hickson and Dorey point out, Conservative positions on inequality have often been mistaken for an offshoot of pragmatism: given that inequality exists, an acceptance of it can easily be seen as simply realistic. However, as both go on to demonstrate, the defence – and even promotion – of inequality are core tenets of Conservative thinking. In fact, as Dorey’s title suggests, this could be seen as the defining feature of British Conservatism, uniting the party across the lines of moderation and radicalism, paternalism and laissez- faire. (Robinson, 2011: 307) The promotion of inequality, mostly as an indirect result of policy but also as a direct result of the belief that ‘tall poppies’ should not be cut down, was one of the main Thatcherite legacies (see Walker, Chapter 9 in this collection). Not just the inequality that grew under Thatcher’s actual years in office, but the beginnings of the promotion of the idea that growing inequalities were a ‘good thing’ and should be encouraged (see Figure 8.1). Following 1997, as the legacy continued, if a little muted, this led to New 1 2 3 4 5 6 7 8 9 10 11 12 13 14 15 16 17 18 19 20 21 22 23 24 25 26 27 28 29 30 31 32 33 34 35 36 37 38 39 240 Thatcherism-01-c.qxd 4/12/13 15:12 Page 240
Transcript of Thatcherism-01-c.qxd 4/12/13 15:12 Page 240 · being offered to people after more than three...
8Mapping the Thatcherite legacy: the human geography of socialinequality in Britain since the 1970s
DANNY DORLING
Introduction
British academics of my generation, and some a great deal younger, areoften fascinated by Thatcherism and its legacy. When reviewing PeterDorey’s book, British Conservatism: The Politics and Philosophy of Inequality,Emily Robinson (2011) explained that the book helped answer KevinHickson’s plea for more work to be done on the Conservatives’ attitudesto inequality:
As both Hickson and Dorey point out, Conservative positions on inequalityhave often been mistaken for an offshoot of pragmatism: given that inequalityexists, an acceptance of it can easily be seen as simply realistic. However, asboth go on to demonstrate, the defence – and even promotion – of inequalityare core tenets of Conservative thinking. In fact, as Dorey’s title suggests, thiscould be seen as the defining feature of British Conservatism, uniting theparty across the lines of moderation and radicalism, paternalism and laissez-faire.
(Robinson, 2011: 307)
The promotion of inequality, mostly as an indirect result of policy butalso as a direct result of the belief that ‘tall poppies’ should not be cut down,was one of the main Thatcherite legacies (see Walker, Chapter 9 in thiscollection). Not just the inequality that grew under Thatcher’s actual yearsin office, but the beginnings of the promotion of the idea that growinginequalities were a ‘good thing’ and should be encouraged (see Figure 8.1).Following 1997, as the legacy continued, if a little muted, this led to New
123456789101112131415161718192021222324252627282930313233343536373839
240
Thatcherism-01-c.qxd 4/12/13 15:12 Page 240

Labour politicians suggesting that it was equality of opportunity thatmattered most, not equality of outcomes. Equality of outcomes coulddiverge, or so these former (New) sons and daughters of toil (Labour)suggested, with life-chances becoming progressively more unequal, just aslong as the more immeasurable ‘opportunities’ or ‘capabilities’ people hadto prosper were apparently being made available and presented upon aslightly more level playing field.
Figure 8.1, and many other similar diagrams, suggest to me that therising, and then high, period of inequality synonymous with Thatcherismbegan shortly after 1977 and has continued largely unabated to the presentday (on periodization see Hay and Farrall, 2011). Following the coalitionvictory of 2010 the Thatcherite legacy of promoting inequality was renewedwith extra vigour. The Health and Social Care Act 2012 was passed allow-ing up to half of NHS hospital beds to be privatized, for other parts of the legislation researchers later found that ‘it is not possible to do in thereal world that which the bill purports to achieve’ (Jones, 2012). The statechecks on the market mechanisms that the Bill proposed would not workbecause of random variation in short-term health outcomes. What was
Mapping the Thatcherite legacy
123456789101112131415161718192021222324252627282930313233343536373839
241
Gin
i coe
ffici
ent
0.20
1961
1963
1965
1967
1969
1971
1973
1975
1977
1979
1981
1983
1985
1987
1989
1991
1993
–94
1995
–96
1997
–98
1999
–200
0
2001
–2
2003
–4
2005
–6
2007
–8
0.25
0.30
0.35
0.40
GB UK
Figure 8.1 Gini coefficient of equivalized inequality in income after tax and beforehousing costs, 1961 to 2007–8
Source: Institute for Fiscal StudiesNote: Data are for Great Britain before 2002–3 and for UK subsequently.
Thatcherism-01-c.qxd 4/12/13 15:12 Page 241

being offered to people after more than three decades of Thatcherism wasan increased ‘opportunity’ to be lucky, win the lottery, or an inheritance,and secure access to healthcare on the basis of their economic circum-stances. In education reintroductions of old-fashioned school examinationswere announced to increase the opportunity children had to fail to gainany qualification from school. At the same time, social housing rules werechanged to make it harder for young people in expensive cities to findshelter. In health, education and housing outcomes were becoming moreunequal, but in each area it could be said that opportunities to succeed orfail were widening. To the generation that grew up under Thatcher’s initialterms of office (the ones when she was prime minister), it felt a little asthough we had been here before, but this was not automatically the case.Figure 8.2 shows one view from those times.
Figure 8.2 shows an old computer graphic of unemployment rates asthey stood two years after Thatcher was swept to power in 1979. Thealtitude of areas on the map, which itself is an equal population cartogram,is drawn in proportion to the proportion of jobless people. As area on themap is drawn in proportion to people the volume being shown is thevolume of unemployed jobseekers in 1981. Note how high unemploymentwas in Scotland and in the far north, how a low-lying ring of relativeprosperity encircled London, but how also, in general, areas around thecoast often faired badly.
The recession of the early 1980s was like a social storm which sweptsouth from the north of the UK and which, in particular, reduced men’schances of gaining employment and of living into old age. It blewsouthwards, round the coasts, into inner London and the cores of someother southern cities but it was a social wind which went strangely stillover the more rural parts of the Home Counties – places that never felt theeconomic cold. The 1980s recession had begun earlier, in the late 1970salong the Clyde and a little later on the Tyne and Mersey, but Thatcherismallowed its progress to be both encouraged and exacerbated (see figure 8.1in Dorling, 2012, and figure 14b in Dorling, 1996).
Where there were small signs of economic weakness, in any communityat any particular time, the doctrine of Thatcherism, of not ‘supporting theweak’, prised open the cracks to grow. Elsewhere in Europe industries werenot repeatedly decimated so often. In Britain where there was a littlediscord in communities, for instance between police and other groups,these tensions were stoked to grow to hatred during the Thatcher years.Miners, football supporters, urban adolescents: all would fight pitched
123456789101112131415161718192021222324252627282930313233343536373839
Danny Dorling
242
Thatcherism-01-c.qxd 4/12/13 15:12 Page 242

Mapping the Thatcherite legacy
123456789101112131415161718192021222324252627282930313233343536373839
243
The Distribution ofUnemployment inBritain 1981
Rate shown as surface height,volume in proportion to the
number of unemployed uponthe population cartogram.
Resolution 300 by 450,based on ward figures.
Figure 8.2 1980s style computer mapping of 1980s unemployment
Source: Dorling, 2012, figure 7.13
Thatcherism-01-c.qxd 4/12/13 15:12 Page 243

battles at some point as the authorities were egged on by the doctrine ofeconomic efficiency.
Where error or injury had been done to communities during the initialearly 1980s recession, subsequent neglect led to doubt over the futureviability of poorer neighbourhoods and ensured despair among manyinhabitants as levels of depression rose quickly. A kind of Victoriandarkness settled in many inner-city and industrial neighbourhoods, and anew kind of sadness, but only in some places, only in some parts of Britain.Elsewhere in affluent Britain, in the places which profited, the living wasmore often easy and becoming easier. And, elsewhere in Europe, as Figure8.3 shows, people shared what they had more fairly. There were fewer
123456789101112131415161718192021222324252627282930313233343536373839
Danny Dorling
244
Per
cent
age
inco
me
shar
e
20
18
16
14
12
10
8
6
4
2France
0
Year
1920
1925
1930
1935
1940
1945
1950
1955
1960
1965
1970
1975
1980
1985
1990
1995
2000
2005
2010
UK
Figure 8.3 Income Inequality the UK and France compared. Income share of thebest-off 1%, France and UK
Note: For the UK, until 1974, the estimates relate to income net of certain deductions; from1975, estimates relate to total income. Until 1989 estimates relate to tax units but, from 1990,estimates relate to adults. Data for the UK is patchy prior to 1951.Source: The World Top Incomes Database
Thatcherism-01-c.qxd 4/12/13 15:12 Page 244

winners and fewer losers. The inequality trends in Britain were notrepeated nearby, especially not just across the channel in France. Lookingexactly when the trend in Figure 8.3 in the UK changed – 1977/78, Francehas a flatter trend line.
If you were a young man brought up in relative affluence outside theurban cores of the North, Wales, Scotland or Northern Ireland, you mightthink that the 1980s had been a period of great economic success. The 1980sand 1990s were not bad places to be for those in London and the South-East, or the ‘Home Counties’ and some of the commuter towns in them.For the residents of many of the smaller southern towns, increases inapparent social harmony, the reinforcement of what they saw as ‘hometruths’, of their faiths and of hope in a Greater Britain in the future werecommon. Other places saw crime and murder rates more than double (seeFarrall and Jennings, Chapter 7 in this collection; Dorling, 2005), unemploy-ment soar (see Thompson, Chapter 2 in this collection), drug use becomeendemic, and the new misery set in, but that was not among ‘our people’as Margaret Thatcher used to describe those she saw as worthy of anyrespect.
Mrs Thatcher
May I just thank you very much. And I would just like to remember somewords of Saint Francis of Assisi . . .
Where there is discord, may we bring harmony.
Where there is error may we bring truth.
Where there is doubt, may we bring faith.
And where there is despair, hope.(Margaret Thatcher, on taking office, 4 May 1979)
It is important not to conflate Thatcher with Thatcherism. For example,the name ‘Charles Darwin’ will now forever on be synonymous withDarwinism, a name which is now mostly an empty vessel to fill with whatwe now think about his ideas (Powell, 2012). So, too, Mrs Thatcher’scorporeal existence is now subsumed within others’ ideas of what it is she stood for. But it is worth looking back a little more closely at her. After misquoting St Francis, she then talked in some detail of her father.Margaret rarely mentioned having had a mother. She was an admirer of
Mapping the Thatcherite legacy
123456789101112131415161718192021222324252627282930313233343536373839
245
Thatcherism-01-c.qxd 4/12/13 15:12 Page 245

Ronald Reagan (see Figure 8.4). It can also be useful to look back on theprecursors to the rise of Thatcherism by using points in the life of the leadactor in the drama herself.
Margaret Hilda Roberts was born in 1925 during the end of an era ofaristocratic inequality. When Margaret Hilda was a child she saw thatadults would doff their hats in her Lincolnshire market town as their betterspassed by (Waugh, 1945). Young Margaret first attended grammar school,and was then separated from most local children, just as unemploymentreached new heights in 1936. After the age of 11 she would not have mixedat school with the majority of the children of her town but mostly with thedaughters of the more affluent residents, which included her parents whoowned two shops. Because she did not quite get the grades, it was onlyafter one student dropped out, in 1943, that she arrived at Oxford to begin
123456789101112131415161718192021222324252627282930313233343536373839
Danny Dorling
246
Per
cent
age
inco
me
shar
e
20
18
16
14
12
10
8
6
4
2Canada
0
Year
1920
1925
1930
1935
1940
1945
1950
1955
1960
1965
1970
1975
1980
1985
1990
1995
2000
2005
2010
USA UK
Figure 8.4 Trends in Britain were similar to those seen in the USA and Canada.Income share of the best-off 1%, USA and Canada
Note: For both Canada and the USA the estimates exclude incomes from capital gains.Source: The World Top Incomes Database
Thatcherism-01-c.qxd 4/12/13 15:12 Page 246

a degree in chemistry, which she completed in 1947 (Margaret ThatcherFoundation, 2012). She became a mother in 1953 and an MP in 1959. Earlyon she was most noticed for getting in a little trouble after voting for therestoration of birching in 1961 and for helping to ensure her party was notfashionable during the swinging Sixties (Campbell, 2007). The ‘youngfemale Member for Finchley had joined with five other Tories on theStanding Committee in support of an amendment to restore floggingmoved by the 74-year-old Member for Ayr, Sir Thomas Moore. (The otherfive were all much older than Mrs Thatcher, three of them military or navalmen)’ (2007: 134).
At age 36, in 1961, Mrs Thatcher was far from being an ordinary woman.She preferred the company and attitudes of older men from another era –she married one of those – but the reason for reeling out all these dates andreminding you that she was in favour of flogging, and hanging too, andracist anti-immigration policies (2007: 437) is not to show that she wasabout as politically incorrect as it is was possible to be, even by the stan-dards of those times, but to illustrate just how quickly the world aroundher was changing. The figures quoted below are for the UK, but consideralso Figure 8.4 from 1925 to 1961 and what was occurring at the same timein the USA where Friedrich Hayek, one of Thatcherism’s architects (andone of her favourite authors), lived from 1950 to 1962 and complainedabout the social progress he saw.
In 1925 the richest 1 per cent of people in the UK took home 22 per centof all income; by 1936, as Margaret Hilda first walked to her grammarschool, that grossly unfair share had fallen to 18 per cent; by 1941 as shetook (and initially failed) her exams to allow her to later enter her Oxfordcollege, the income share of the richest 1 per cent fell to ‘just’ 13 per cent;by the time she left Oxford, in 1947, that share was 11 per cent; when shefirst became MP (in 1953) the income share of the richest 1 per cent hadfallen just below 10 per cent and, by the time she was voting with the oldnaval men to bring back flogging, in 1961, the richest 1 per cent weretaking home less than 9 per cent of all income, nearer to 8 per cent the year after. These are very low rates of inequality for the UK, but are ratesthat have been enjoyed by the citizens of Japan and Germany since 1945(Figure 8.5).
Almost every year of Margaret Roberts’s formative years, privilege andpower was rapidly ebbing away from the rich in Britain. Later moreequitable Germany and Japan would begin to economically supersedeBritain (Thatcherites never understood the key reasons were those two
Mapping the Thatcherite legacy
123456789101112131415161718192021222324252627282930313233343536373839
247
Thatcherism-01-c.qxd 4/12/13 15:12 Page 247

countries’ greater levels of post-war economic equality). To a youngwoman so rapidly social climbing, so quickly removing herself from thosebelow her, it must has felt as if the country she was so very patrioticallyproud of was on a road to some kind of serfdom. The faster she rose up theranks and climbed up the greasy pole of school and entrance exam success,with her financially appropriate marriage to Denis Thatcher, that muchwealthier, older, divorcee; the faster she secured political success. However,throughout the 1960s and early 1970s the monies she and those around herwere gaining – by getting ahead of others, by rent-seeking and profiteering– was rapidly ebbing way. And the Germans and Japanese were movingahead. No wonder she and ‘her people’ were angry.
123456789101112131415161718192021222324252627282930313233343536373839
Danny Dorling
248
Per
cent
age
inco
me
shar
e
20
18
16
14
12
10
8
6
4
2Japan
0
Year
1920
1925
1930
1935
1940
1945
1950
1955
1960
1965
1970
1975
1980
1985
1990
1995
2000
2005
2010
GermanyUK
Figure 8.5 Comparitive levels of inequality in Germany and Japan. Income shareof the best-off 1% Germany and Japan
Note: In Japan the estimates exclude incomes from capital gains. In Germany the estimatesare excluding capital gains apart from 1925–1938 and are only for the Federal Republic from1960 to 1991.Source: The World Top Incomes Database
Thatcherism-01-c.qxd 4/12/13 15:12 Page 248

In 1975, when Margaret became leader of her party, the annual incomesof the richest 1 per cent in the UK had fallen to just 6 per cent of nationalincome for the first time in British history. The very rich, on average in thatyear ‘only’ received six times the arithmetic mean income of the country.Imagine a well-paid top London banker ‘only’ receiving six times what afactory worker got. You might think that was six times too much, but thatwas almost the lowest the UK richest 1 per cent ever reached. They reachedtheir precise historic minima in 1978, the year before she became primeminster, the first year after which income inequality again began to
Mapping the Thatcherite legacy
123456789101112131415161718192021222324252627282930313233343536373839
249
Per
cent
age
inco
me
shar
e
20
18
16
14
12
10
8
6
4
2Netherlands
0
Year
1920
1925
1930
1935
1940
1945
1950
1955
1960
1965
1970
1975
1980
1985
1990
1995
2000
2005
2010
SwitzerlandUK
Figure 8.6 Falls in the share of the top 1% in the Netherlands and Switzerlandsince 1940. Income share of the best-off 1%, Netherlands and Switzerland
Note: In the Netherlands, up to 1946, the series is based on tabulated income tax data; between1950 and 1975, estimates are based on tabulated data produced by the Central Bureau ofStatistics; from 1977 they are estimated based on micro-data from the Income Panel Survey(IPO) and using tax and other administrative data. Swiss estimates do not include capitalgains.
Source: The World Top Incomes Database
Thatcherism-01-c.qxd 4/12/13 15:12 Page 249

relentlessly rise. And there was no need for that inequality to rise. Figure8.6 shows what else could have been possible.
The rising tide of inequality
Approaching the issues along these lines allows one to appreciate just howclosely the declining fortunes of the richest 1 per cent in the UK correlatedwith Thatcher’s political education and then turned as she took office. Herascendancy was the precise point at which these inequalities began againto increase. Of course it was not just her. She was mostly a symbol for themen behind her, those who backed her and thrust her forward, and of the ideas of men like Hayek, von Mises (1975), and others so shattered by the events of the Second World War that they though that almost anygovernment, planning or sharing was evil.
Thatcherism is not about a woman but about a trend that the politicsassociated with this surname gave rise to. It was a trend she was part of, atrend which began before she was born and which carried on long aftershe had left office. It is a historically interesting question to ask just howmuch this politician, brought up in a remote market town, trained inchemistry (not PPE) and married into the class she would later benefit most,understood of what was happening to British society before she gainedpower or even became Education Secretary, but she rallied against thestatus quo and was the Thatcherites’ symbol of a powerful force for change.
Figure 8.7 shows just how important Thatcherism was for fundamen-tally changing UK society and, key here, that society’s human geography.It is a more detailed version of one of the lines in Figure 8.3, but showingmore than just the best-off 1 per cent. The top graph is dominated by theblack line, which is the average income of the very richest of all, of the best-off 0.01 per cent of all people in the UK. Around 1912, the richest, onaverage, each received over 400 times mean average incomes (much moreagain than the median average). Today the very richest see their shareheading back up towards 150 times the mean. We might even be temptedto a little speculation as to whether Thatcherism might be ending now (seethe blip at the end of Figure 8.7), but it is too early to tell. The economiccrises of 2008–12 could be its death throes. To paraphrase what the Chinesepremier Zhou Enlai said in commenting on changes in France in 1968, orin the UK 2008, ‘It is too early to say.’ What we can be sure of is the temporalcoincidence between the all-time low in the incomes of the very richest,
123456789101112131415161718192021222324252627282930313233343536373839
Danny Dorling
250
Thatcherism-01-c.qxd 4/12/13 15:12 Page 250

Mapping the Thatcherite legacy
123456789101112131415161718192021222324252627282930313233343536373839
251
Mul
tiple
s of
mea
n av
erag
e in
com
e
0
50
100
150
200
250
300
350
400
450
1910 1920 1930 1940 1950 1960 1970 1980 1990 2000
Mul
tiple
s of
mea
n av
erag
e in
com
e
1
10
100
1000
1910 1920 1930 1940 1950 1960 1970 1980 1990 2000
Top 0.01% by incomeRest of top 0.1%Rest of top 1%Rest of top 10%
Top 0.01% by incomeRest of top 0.1%Rest of top 1%Rest of top 10%
Figure 8.7 Incomes of the best-off in the UK 1910–2009 (top half). Incomes of thebest-off in the UK 1910–2009 (compared to average, on linear & log scales) (bottomhalf)
Source: The World Top Incomes Database, missing data interpolated, original source: Atkinson,2007, http://g-mond.parisschoolofeconomics.eu/topincomes/as accessed 11th June 2012; fordetails to the interpolation see Dorling, D. 2013, figure 2
Thatcherism-01-c.qxd 4/12/13 15:12 Page 251

and Mrs Thatcher’s elevation to power just after 1978. In terms of defininga pivot point, few graphs showing social changes are as clear as Figure 8.7.
Figure 8.7 shows the most basic set of consistent measures we have ofeconomic inequalities in Britain that span almost a century in time. Missingvalues have been interpolated here (for details of that process and similartrends in other social measures see Dorling, 2013). They are interpolatedto present a picture that is simpler than it would otherwise look. However,the overall trend is clear: inequalities were huge, fell consistently for 70years and then rose consistently for 30 years. The pivot point was 1978. Thelater parting of the ways between ‘the 9 per cent’ and ‘the 1 per cent’ after1990 is the other major feature of note and the very recent falls in theremuneration of the very best-off of all will require careful and closeattention in the immediate years to come. Thatcherism could be endingnow, even with arch-Thatcherites in power.
It is this graphic (Figure 8.7) which best explains the importance ofThatcherism. In other countries the same graph shows a different trendwhich behaves in very different ways. In many countries inequalities carryon falling throughout the 1980s and 1990s, just as earlier in this chapter thecase of the Netherlands and Switzerland was described (see Figure 8.6).There is almost nothing at all ‘international’ in the temporal trends revealedin Figure 8.7. In fact, nowhere else in Europe is the same as the UK whenit comes to inequality profiles and projections. Only the USA and, to a lesserextent, Canada have similar trajectories, and in both of those casesequalization was not progressing throughout the 1920s and 1930s, as wasthe case in the UK, but only began with the advent of the Second WorldWar. Because the graphs in Figure 8.7 show how many times averageincomes members of the richest tenth, 1 per cent, 0.1 per cent and 0.01 percent of society receive in income a year, greater changes in the futures ofjust one group can be overshadowed by larger changes for others. For ‘the1 per cent’ their multiple of average income is identical to their share ofnational income. If the top 1 per cent received ten times average incomesthen they receive 10 per cent of all income. Groups above the top 1 per centcan enjoy incredible incomes because there are fewer of them. The top 1per cent can never enjoy much more than 25 per cent of all income as, abovethat, those at the very bottom begin to starve.
As Thatcher came to power the UK share of the top 1 per cent rose to 6per cent in 1979, 7 per cent by 1984, 8 per cent by 1988, 9 per cent by 1990,and then there followed a very brief dip (when John Major became primeminister), then a rise following Major’s 1992 election victory to 10 per cent
123456789101112131415161718192021222324252627282930313233343536373839
Danny Dorling
252
Thatcherism-01-c.qxd 4/12/13 15:12 Page 252

by 1993, rising quickly to nearer 11 per cent by 1995, 12 per cent by 1997,rising a little slower in the first years of the New Labour government, butstill to almost reach 13 per cent by 2001. Thatcherism continued after NewLabour came to power, that was part of what made it ‘New’. Liberal LeaderNick Clegg would complain of this in the 2010 election campaign, but he did little while in office as Deputy Prime Minister to tackle incomeinequality. In office Nick Clegg was just as Thatcherite as New Labour hadbeen.
It is true that there was a brief dip in the upwards inequality trendduring Gordon Brown’s ‘progressive brief pause’ (2001–2 – blink and youmissed it), before the share of the top 1 per cent began quickly rising againto 13 per cent by 2004, 14 per cent by 2005, jumping to nearer 15 per centby 2006, 15.4 per cent by 2007 and then a third dip, to just under 14 per centby 2009. The third dip was associated with the immediate impact ofeconomic crash, with factors such as initially falling income from intereston stocks and shares, but we know that fall was quickly reversed, withinequality rising again in 2010 and 2011 from other reports of the incomeof top financiers bouncing back (the bulk of the top 1 per cent work inbanking and similar services). However, by 2012 there were again signs ofrestraint at the top. We are currently in a period of oscillation, possibly athird tipping point after those in 1912 and 1978. Those two tipping pointscould only be clearly seen long after most of the events if their respectiveyears had been forgotten. If 2008 turns out to have been the tipping point,the end of Thatcherism, which precise prime minister or political party wasin power that year will no longer be seen to have been of much importance.
A geographical perspective
What is so geographical about any of this? Why go into so much detailabout what appear to be historical social and economic changes in a chapterabout geography? Initially, these trends appear to be purely about fallingand then rising economic inequalities, but ‘the 1 per cent’ were and are notevenly spread across the country. Only slightly more evenly spread are the‘next best-off 9 per cent’ beneath them. Those well above the bulk of thetop 1 per cent are far more geographically concentrated, almost solely inand near London, which is where almost all of the 0.1 per cent and 0.01 percent reside (see Hennig and Dorling, 2012 on the geography of 0.01 percent). It is possible to chart how the 1 per cent became a little more evenly
Mapping the Thatcherite legacy
123456789101112131415161718192021222324252627282930313233343536373839
253
Thatcherism-01-c.qxd 4/12/13 15:12 Page 253

spread geographically as their share of income falls and how they rapidlygeographically segregated into exclusive enclaves and southern towns,villages and cities as they became richer again. However, it is with politicalpatterns and voting that the geography becomes clearer quickest, so let usturn to that and to some more social graphics from the 1980s on geo-graphical swings in voting to try to illustrate the effect that Thatcher’s riseto power had.
The polarization of voting
A simple geographical measure of polarization is the segregation index(Simpson, 2004). When applied to Conservative voters by parliamentaryconstituency this index is the measure of the minimum number ofConservative voters who would have to move constituency were allconstituencies to return an identical share of Conservative votes. (Thatpolitical party is used here because it is the most consistently defined overthis period as well as being Thatcher’s party). Table 8.1 illustrates thatpeople voted Conservative in remarkably similar numbers in mostconstituencies between 1931 and early 1974. Elections were decided muchmore by the national swing than by issues of tactical voting and politicalgeography. During those years one would have only had to move as fewas 4 per cent of Conservative voters, and never more than 8 per cent, tohave exactly the same number/proportion voting in each area. Six yearsafter economic inequalities began to fall (in 1912), the 1918 ‘Khaki’ electionsaw the greatest political polarization, exacerbated by the politicalmachinations of the time and Liberals not standing against Tories in manyseats. As a result, as Table 8.1 shows, polarization as indicated by votersegregation shot up to almost 20 per cent, dropping only to 14 per cent in1922, but then fell gently downwards to almost 6 per cent by 1959 beforerising up to 8 per cent by the February election of 1974 and then suddenlyjumping to almost 11 per cent in the October election of that year.
If you want a moment when everything changed, when Thatcherismwas conceived, it was during the spring and summer months of 1974 (seealso Hay, 1996; Heffernan, 2000; and Jessop et al., 1990 on similar attemptsto identify a ‘starting point’). The economic tipping point might have been1978, but the political tilt occurred earlier. It was then that people in theSouth-east of England swung rightwards, voting polarized sharply and, ayear later, Margaret’s party would elect her as leader. Political polarization
123456789101112131415161718192021222324252627282930313233343536373839
Danny Dorling
254
Thatcherism-01-c.qxd 4/12/13 15:12 Page 254

dropped a fraction during the 1979 election itself but then rose relentlessly,subsequently to reach the post-First World War maxima in 2010. Table 8.1above of voting polarization turns out to be a good indicator of when socialdivisions in general were also widening and falling.
The proportions in the table above might appear modest but you reallyneed to see what was involved in these rises in polarization, or recognizewhy even the slight rise from 9.2 per cent in 1979 to 10.6 per cent in 1983and 11.8 per cent by 1987 was shocking. Figure 8.8 shows how a politicalvacuum opened up in the centre of politics in Britain as voters in con-stituencies swung away from the political centre during these years. Labourareas became more Labour, Tory more Tory, and hence the numbers ofvoters rose who would have had to be moved across a political boundaryto ever achieve a more even geographical distribution rose election afterelection.
To understand Figure 8.8 you need to know that each triangle containsthe space of all possible election results in any one election. Within eachtriangle every constituency is placed as a dot. The precise location of thedot depends on the share of the vote between the three main parties. If most
Mapping the Thatcherite legacy
123456789101112131415161718192021222324252627282930313233343536373839
255
Table 8.1 Segregation of Conservative voters 1885 to 2010 – all general elections
Election Concentration Election Concentration
1885 7.11% 1951 6.77%1886 5.53% 1955 6.93%1892 5.81% 1959 6.24%1895 4.70% 1964 6.51%1900 4.39% 1966 7.69%1906 6.67% 1970 8.04%1910 Jan 7.91% 1974 Feb 8.01%1910 Dec 6.24% 1974 Oct 10.72%1918 19.30% 1979 9.17%1922 14.44% 1983 10.59%1923 11.57% 1987 11.84%1924 10.62% 1992 11.88%1929 9.24% 1997 13.94%1931 9.23% 2001 15.05%1935 9.65% 2005 15.69%1945 7.21% 2010 16.40%1950 6.74%
Source: Dorling 2010. See also: http://www.sasi.group.shef.ac.uk/injustice/files/Figure13.xlsand Norman Tebbit’s objection to the measure only being shown for Conservatives (letter New Statesman, 5 July 2010: http://www.readperiodicals.com/201007/2073707111.html)
Thatcherism-01-c.qxd 4/12/13 15:12 Page 255

123456789101112131415161718192021222324252627282930313233343536373839
Danny Dorling
256
General Election Constituency DistributionBy Movement of Vote
(Triangle Divisions Represent 10%)
Liberal(or Nationalist)
Labour Conservative
’79–’83
Alliance(or Nationalist)
Labour Conservative
’83–’87
Alliance(or Nationalist)
Labour Conservative
’79–’87
Figure 8.8 Westminster Constituency swings on the Electoral Triangle 1979–87.
Source: Dorling 2012, figure 1.8Note: Each constituency is represented by an arrow showing how voting there changed.
Thatcherism-01-c.qxd 4/12/13 15:12 Page 256

of the vote is to Labour then the dot is drawn towards the bottom left ofthe triangle. If most of the vote is to the Conservatives then it is drawntowards the bottom right, and if most of the vote is to the various groupingsof Liberal parties (SDP/Liberal/Alliance) then it is drawn further up. Thevote share decides the precise position. Between any pair of elections thedot for a constituency changes position as the vote share changes withinthe constituency. The change on the diagram between the two dots can beshown by an arrow. The arrowhead is draw at the later election point toshow the overall direction of change over time. Groups of politically similarconstituencies can be seen to be ‘flocking’ as they swing in similar direc-tions, or ‘scattering’ when there is less of a pattern to the flow of votes invoting space.
Over the 1979–87 period as a whole, Labour areas became more Labour,arrows to the left swung to the left, Conservative areas become moreConservative and, in many, the main opposition became the Liberals, SDPand later the Liberal Democrats (known at the time as ‘The Alliance’). Thehole that appeared in the middle of British politics, in the middle of thetriangles in Figures 8.8 and 8.9 was a political vacuum, a fall in moderationand that itself was one initial result of Thatcherism. Later on the hole filledup again as Labour moved to the right to fill it.
Trends in local election results show even more clearly the schisms thatopened up under Thatcher’s period of immediate tenure. In Figure 8.9 adot is drawn to show the vote share in every county division in England,the areas used to elect county councillors in the years 1981, 1985 and 1989.The net of an electoral tetrahedron is also shown for Scotland to illustratehow polarization within a four-party system can be visualized and howthere too evidence of a political vacuum opening up could be seen by theend of this period of initial change, by 1988.
In 1981 in England the distribution of county councillors was quite evenacross voting space. A great many seats are shown as dots in a histogrambeneath the electoral triangle as in these no Liberal Party (or Alliance)candidates stood. The size of the dots is proportional to the electorate. Thereis a hint of white space in the centre of the triangle as there are slightlyfewer seats in which all three main parties gain a near identical share of thevote than might be expected if there were no geographical issue to voting.
By 1985 the white space in the centre has opened up a little more. Countycouncil seats were beginning to move away from the political centre of theimage, at least those that were ever anywhere near that centre. The entiredistribution in fact shifted a little to the edges (see original source for more
Mapping the Thatcherite legacy
123456789101112131415161718192021222324252627282930313233343536373839
257
Thatcherism-01-c.qxd 4/12/13 15:12 Page 257

123456789101112131415161718192021222324252627282930313233343536373839
Danny Dorling
258
1981 County Council Elections:English Voting Composition
Every electoral division won by oneof the three major parties is shownby a circle on the diagram.
The area of the circle is inproportion to the total vote.
Independent candidatesare counted asConservative whereno Conservativeopposed Labour orLiberal nominees.
The positon of the circleindicates the composition
of votes in that division.
Distance from each apexmeasures the support for a
part from total to none.
Divisions falling on thesides of the triangle are
projected as a histogramof two party support.
1985 County Council Elections:English Voting Composition
Every electoral division won by oneof the three major parties is shownby a circle on the diagram.
The area of the circle is inproportion to the total vote.
Independent candidatesare counted asConservative whereno Conservativeopposed Labour orLiberal nominees.
The positon of the circleindicates the composition
of votes in that division.
Distance from each apexmeasures the support for a
part from total to none.
Divisions falling on thesides of the triangle are
projected as a histogramof two party support.
1989 County Council Elections:English Voting Composition
1988 District Elections:Scottish Voting Composition
Every electoral division won by oneof the three major parties is shownby a circle on the diagram.
The area of the circle is inproportion to the total vote.
Independent candidatesare counted asConservative whereno Conservativeopposed Labour orLiberal nominees.
The positon of the circleindicates the composition
of votes in that division.
Distance from each apexmeasures the support for a
part from total to none.
Divisions falling on thesides of the triangle are
projected as a histogramof two party support.
Liberal100%
Labour100%
Conservative100%
Alliance100%
Labour100%
Conservative100%
Democrat100%
Labour100%
Conservative100%
SNP100%
SNP100%
Labour100%
Conservative100%
SNP 100%
Liberal/Alliance/SLD100%
The triangles show the projections of a regular tetrahedron encom- passing electoral ward competitions involving as many as four separate candidates. Every ward won by one of the major parties is shown as a circle on the diagram, its area in proportion to the total vote. The position of the circle indicates the composition of votes in that ward. Circles are when on the side of the tetrahedron they lie closest to. Wards falling on the edges of the tetrahedron are projected as histograms of two party support on the sides of the triangles. Distance from each apex measures the support for a party from total to none.
Figure 8.9 Local voting in England 1981–9 and in Scotland in 1988
Source: Dorling, 2012; figures 7.4, 7.5, 7.6 and 9.16 (of the electoral tetrahedron)
Thatcherism-01-c.qxd 4/12/13 15:12 Page 258

diagrams showing this, albeit in tedious detail, but using early three-dimensional surface visualization techniques). After 1985, as all the threemain parties tried to ensure that their voters had a chance to vote for them,everywhere, there were fewer seats placed around the edges of the triangleand also fewer where there is a single unopposed candidate (illustrated bythe strings of seats drawn at the corners of the triangle).
What began as a shift between 1981 and 1985 became a rout between1985 and 1989. The political centre can be seen in Figure 8.9 to almostcompletely hollow out in just those four years. In hindsight, it is lesssurprising that one response to the growing vacuum was the splitting ofthe SDP from Labour and then its alliance with the Liberals. By 1989 countydivisions, county council seats, are either Liberal/Alliance–Tory contestsor Tory–Labour battles, and this was only if there was much of a fight tobe had at all. More areas became safe local or even very safe national seats.The country had polarized politically, faster in the late 1980s than the early1980s and ever since then this polarization has continued. It continued tosuch an extent and degree that the Conservative party failed to gain amajority at the 2010 national general election because so many of the extravotes they won were piled up in areas they had already secured by 2005(Dorling, 2010).
The final quarter of the diagram in Figure 8.9 shows how, in Scotlandand by 1988, the hole in the middle of politics was also very clear to seenorth of the border, the dots representing local councillors forming a ringaround places that no longer existed, such as places where roughly aquarter of voters each voted Tory, Liberal, Labour and SNP. In hindsightthese diagrams show when the schism was formed. They were first drawnbetween 1989 and 1991 using data from just a few years before. Back thenit was far from clear just how important and semi-permanent what had justoccurred would be. The political ground shifted in the 1980s and it is stillmoving in the same directions it first shuddered out towards then. Lookingat these diagrams is a little like looking at an electoral autopsy. They showwhen the break first occurred.
I include all these diagrams (and Table 8.1) because if you lived throughthose years as a youngster it is easy to think that your times were specialand something very unusual was occurring. However, viewed both inhindsight and in context, something very odd, even unprecedented, interms of voting was occurring. Whole places were moving towards politicalpoles and away from the centre ground. Viewed conventionally andgeographically this is now known as the north/south divide widening; a
Mapping the Thatcherite legacy
123456789101112131415161718192021222324252627282930313233343536373839
259
Thatcherism-01-c.qxd 4/12/13 15:12 Page 259

divide widening in voting as well as wealth, health, educational changesand employment fortunes. Viewed in detail in political space it is clear thatthe drifts were near universal, they were found both within the north andsouth as well as between them.
The new geographies of England
Thatcherism did not suddenly create a new political map. Long before MrsThatcher’s three governments were put in power England dominatedBritain, Northern Ireland was marginalized and London reigned supreme.And this is all despite many decades of population decline within thecapital. However, in the early 1970s there were a few years when thepopulation centre of the country moved north (see Dorling and Atkins,1995: 34, figure 16). By the 1980s that had ended. Figure 8.10 provides asingle image to illustrate how dominant London was five years before the‘Big Bang’ of financial deregulation in 1986.
After Mrs Thatcher left office the legacy of her tenure continued. Figure8.11 shows how, during those following ten years of the 1990s, there wasactual population decline in the North-west of England and around therivers Clyde, Tyne and Tees. In contrast, the South-east, and especiallyLondon, boomed. There was, in effect ‘managed decline’ outside the corezone. This managed decline began with Michael Heseltine but continuedunder first John Major, and then Tony Blair, both contemporaries ofThatcher.
There was no slow-down under Tony Blair’s tenure in the economic andsocial polarization of the country. Table 8.2 shows how mortality ratescontinued to polarize – if anything a little faster under Blair than Thatcher– between areas of the country. It was migration which drove thesechanges. Those who could, moved. They moved towards more prosperousareas. Years later this internal migration became apparent when measuredin terms of the numbers of people dying per year in each place at each age.
New Labour as ‘Thatcherism continued’
Thatcherism changed how we thought, what we aspired to. It dumbeddown collective social aspiration while building up individual senses of entitlement. Towards the end of New Labour’s period of office even
123456789101112131415161718192021222324252627282930313233343536373839
Danny Dorling
260
Thatcherism-01-c.qxd 4/12/13 15:12 Page 260

Mapping the Thatcherite legacy
123456789101112131415161718192021222324252627282930313233343536373839
261
Daily Commuting Flows BetweenEnglish and Welsh Wards in 1981
All flows which satisfy the followinginequality are drawn as thin lines
Flows of over 1000 peopledrawn as thick lines
Where –
125000
mijsl
pispjs>
mijsl
pis
: The number of people moving from place i to j between times s and t
: The number of people at place i time s
i : Place of residence
j : Place of work
s : Nighttime
l : Daytime
Figure 8.10 London 1981 – all absorbing (the other ‘spider’ was Manchester)
Source: Dorling, 2012, figure 6.14
Thatcherism-01-c.qxd 4/12/13 15:12 Page 261

123456789101112131415161718192021222324252627282930313233343536373839
Danny Dorling
262
Change inpopulation potential
in Britainin 1991–2001
≥ 105 to 100 to 5< 0
Figure 8.11 During the 1990s Thatcherism continued on the ground, if not name.London and the Home Counties grew while Merseyside, Tyneside and Clydesidecontinued to decline.
Source: UK population Censuses 1991 and 2001, population potential calculated for this bookby local authority (see figure 9.3); 1991 statistics subtracted from 2001 and population –weighted mean shown.
Thatcherism-01-c.qxd 4/12/13 15:12 Page 262

The Guardian, then its staunchest backer, was listing the basic achievementsof that government as if they were greater achievements, as if repairingand rebuilding schools was some kind of rocket science:
Invited to embrace five more years of a Labour government, and of GordonBrown as Prime Minister, it is hard to feel enthusiasm. Labour’s kneejerkcritics can sometimes sound like the People’s Front of Judea asking what theRomans have ever done for us. The salvation of the health service, majorrenovation of schools, the minimum wage, civil partnerships and the exten-sion of protection for minority groups are heroic, not small, achievements.
(The Guardian, 30 April 2010)
However, the key and reiterated undertaking by the ‘New’ Labouradministration that governed Britain in the early years of the twenty-firstcentury was not honoured. This undertaking had been announced byPrime Minister Tony Blair in the annual Beveridge lecture of 1999: beingpoor, he said, ‘should not be a life sentence’: it was a ‘20 year mission – butI believe it can be done’ (BBC News, 1999). This pledge was reaffirmed byhis successor Gordon Brown at the Labour Party conference of 2008:
Mapping the Thatcherite legacy
123456789101112131415161718192021222324252627282930313233343536373839
263
Table 8.2 Geographical inequalities in health in Britain 1921–2007
SMR 0-64 1921–30 1931–39 1950–53 1959–63 1969–73 1981–89 1990–98 1999–2007
Tenth of standardised mortality ratio
1 (worst) 138 136 131 136 131 137 149 1492 122 120 118 123 116 120 123 1233 113 112 112 117 112 114 114 1154 108 106 107 111 108 108 108 1095 104 103 103 105 103 102 99 1016 97 97 99 97 97 96 94 957 90 89 93 91 92 92 91 908 83 85 89 88 89 89 86 839 78 81 86 83 87 84 78 7710 72 73 82 77 83 79 73 70
Ratio of 1.91 1.85 1.60 1.76 1.58 1.74 2.04 2.12worst to best
Rll 2.50 2.35 1.96 2.25 1.92 2.17 2.64 2.79
* Data series is not continuous, with no data for the 1940s and gaps in mid-1950s, mid-1960s, and fromearly 1970s to early 1980s; nor are time periods always of wqual duration. For 1980, we used theharmonic mean of decile SMRs for the two periods of which it was composed (1981–85 and 1986–89).
Note: Confidence interval in original paper
Thatcherism-01-c.qxd 4/12/13 15:12 Page 263
Brown acknowledged that economic times were ‘tough’ but said thegovernment was ‘in it for the long haul’ in the complete elimination of childpoverty by 2020. He also promised to continue record investment in SureStart and introduce free nursery education for two-year-olds in up to 60 areas.‘For me, the fairer future starts with putting children first – with the biggestinvestment in children this country has ever seen. It means delivering thebest possible starts in life with services tailored to the needs of every singleprecious child.’
(Ahmed, 1999)
However, by the time that the ‘New’ Labour government had departedthe political stage, it was possible to make a more sober appraisal of the‘Blair Years’ (1997–2007) in relation, at least, to the state of the nation’schildren. The proportion of children living in a family that could not affordto take a holiday away from home had risen; so too had the number ofchildren whose parents could not afford to let them have friends round fortea. Likewise, the number of children who were too poor to pursue a hobbyand the number of children living in single-parent families without accessto a car had risen. It all became much worse after 2010 with the economiccrisis, partly because New Labour’s record was more like a continuationof Thatcherism rather than something new. In 1991 in his Beveridge lecture,Tony Blair had said: ‘In Beveridge’s time the welfare state was associatedwith progress and advancement. Today it is often associated withdependency, fraud, abuse, laziness. I want to make it once again a force forprogress’ (BBC, 1999). However, in practice, ‘New’ Labour pursued thatself-same populist and punitive approach, happy to label benefit claimantsas feckless and to regard taxation as the Victorians had done – as charity,something one did for the poor.
This is not to deny that the New Labour government did achieve a greatdeal for children. It greatly reduced the numbers living in the worstpoverty. It improved both education chances and narrowed educationdivides and it governed over a period when young peoples’ chances ofgaining a job improved greatly, especially in the poorest areas, and nationalyouth suicide rates fell quickly (in contrast to rises in young adult suiciderates during the previous Conservative administration). However, whenit came to assessing their legacy as regards inequality overall, andinequality between the access to income and wealth enjoyed by differentgroups of children in the UK, their record was poor. The geography ofThatcherism became further entrenched.
Following on as the next wave of Thatcherism, New Labour also pavedthe way, in so many ways, for some of the worst policy decision of the next
123456789101112131415161718192021222324252627282930313233343536373839
Danny Dorling
264
Thatcherism-01-c.qxd 4/12/13 15:12 Page 264

(Coalition) government. They introduced student fees, which the nextgovernment would increase to £9,000 a year – the most expensive inEurope. They began the privatization of the National Health Service whichthe next government would then expand upon. And they allowed lifechances between groups of young adults to diverge rapidly, which is whyyoung parents today are bringing their children up in such widely differentcircumstances, often without knowing much of each others’ lives – less thantheir parents’ knew.
A heroic Labour government from 1997 to 2010 would have achieved somuch more. It would have been heroic to have reduced income and wealthinequalities (and, by doing so, bring down rates of poverty towards normalwestern European levels). It would have been heroic to have refused totake part in America’s wars (as Labour refused when in power from 1964to 1970). It would have been heroic to have reigned in the bankers beforethe crash. That kind of a government would have been comparable withother contemporary governments in other countries, with progressivepolitics in Britain’s past, and with the 1997 dream that ‘things can only getbetter’, New Labour fell far short. Here is what Julian Baggini had to sayon Labour’s record in office in that same issue of The Guardian as quotedfrom above:
I think this has been an under-appreciated government. The last 13 years have been immeasurably better than the previous 18, and the return toConservatism, in its current shape at least, appals me. But the game is up,both for a system which protects two parties which most people do notsupport, and a government that just cannot now hope to be re-elected witha majority.
(Baggini, 2010)
What do we find when, instead of announcing ‘immeasurably better’we actually measure? Here are some attempts (with the help of manyothers) to measure this apparently immeasurable betterment. What isinteresting is to note that when this is done we again do not appear to seetoo great a change from the Thatcherism to New Labour via John Major.
Among British adults during the 1997–2005 Blair years, the proportionunable to make regular savings rose from 25 per cent to 27 per cent; thenumber unable to afford an annual holiday away from home rose from 18per cent to 24 per cent; and the national proportion who could not affordto insure the contents of their home climbed a percentage point, from 8 percent to 9 per cent. However, these national proportions conceal the way inwhich the rising exclusion had hit particular groups especially hard, not
Mapping the Thatcherite legacy
123456789101112131415161718192021222324252627282930313233343536373839
265
Thatcherism-01-c.qxd 4/12/13 15:12 Page 265

least a group that the Blair government had said it would help above allothers: children living in poverty. The sources for all these facts are inDorling (2011: 117–43). Brown’s very short term as prime minister was alittle less damning statistically, but too short and turbulent a time to yeteasily dovetail with the record to date.
Another failure of New Labour was its record on real rates of youthunemployment. They remained high throughout 1997–2010 so that justbefore the London riots of 2011 unemployment rates amongst young blackmen rose again to above 50 per cent. Rates for young black women hadreached that level in 2009 (Figure 8.12). I say again, as this last occurredwhen Mrs Thatcher was in power.
The comparison of poverty surveys taken towards the start and end ofTony Blair’s time in office found that, of all children, the proportion livingin a family that could not afford to take a holiday away from home (or just
123456789101112131415161718192021222324252627282930313233343536373839
Danny Dorling
266
UK
% o
f all
thos
e ag
ed 1
6–24
une
mp
loye
d
60.0
50.0
40.0
30.0
20.0
10.0
02006 2007 2008 2009 2010 2011
White menBlack menWhite womenBlack women
Figure 8.12 Unemployment rate of men and women, black and white, aged 16–24,2006–11, Q4, United Kingdom
Source: Drawn from data at: hhtp://www.guardian.co.uk/news/datablog/2012/mar/09/black-unemployed-young-men. Sourced in turn from Labour Force Survey 2012.
Thatcherism-01-c.qxd 4/12/13 15:12 Page 266

to visit relatives) rose between 1999 and 2005, from 25 per cent to 32 percent. This occurred even as the real incomes of most of the poorest rose;they just rose more for the affluent, making holidays more expensive forall and subtly changing what it meant to go on holiday. Similarly, as therich became richer and housing became more expensive and moreunequally distributed, the number of school-age children who had to sharetheir bedroom with an adult or sibling over the age of 10 and of theopposite sex rose from 8 per cent to 15 per cent nationally.
Encouraging buy-to-let landlords in a new wave of privatization did nothelp reduce overcrowding. It was in London that such overcrowdingbecame most acute and where sharing rooms rose most quickly. Keepingup appearances for the poor in London was much harder than in Britainas a whole, not simply because London had less space, but because withinLondon other children were so often very wealthy. Greatly reducing thenumbers of children living in households below 60 per cent of medianincomes still leaves many children in those households and in some casesit became harder to achieve the child poverty goal in 2005 as compared to1999 as overall inequalities increased as mean incomes rose faster thanmediums. Even among children at the same school, the incomes of theirparents had diverged and, consequently, standards of living and expec-tations of the norm did too.
Nationally, the proportion of children who said their parent(s) could notafford to let them have friends round for tea doubled, from 4 per cent to 8per cent. The proportion who could not afford to pursue a hobby or otherleisure activity also rose, from 5 per cent to 7 per cent, and the proportionwho could not afford to go on a school trip at least once a term doubled,from 3 per cent to 6 per cent. For children aged below the age of 5, theproportion whose parents could not afford to take them to playgroup eachweek also doubled under the Blair government, from 3 per cent to 6 percent.
Concealing poverty becomes ever more difficult in an age of high andincreasingly unequal consumer consumption and it becomes easier for usto imagine why someone might be tempted to go further into debt in orderto pay for a playgroup rather than spend another day at home with atoddler or to pay for a school trip rather than asking their child to pretendto be ill that day. Debt rose greatly amongst families with children underNew Labour (or the continuation of Thatcherism as argued here). Theworse-off resorted to the increasing number of dodgy lending and savingschemes set up by loan sharks or Christmas clubs such as ‘Farepak’ which
Mapping the Thatcherite legacy
123456789101112131415161718192021222324252627282930313233343536373839
267
Thatcherism-01-c.qxd 4/12/13 15:12 Page 267

went bust. One Farepak victim made it clear what growing inequalitymeant:
I have got four children, all at various ages. Like I say, you can’t tell the littletwo, Father Christmas can call next door, but he can’t call here you know.And with my husband being on sick as well, having to pay the mortgage andfeed four kids and whatever, and £37 a week is not a lot.
(Spalek and King, 2007)
The second most expensive of all consumption items are housing costs –rents or mortgages – and these have also diverged as income inequalitieshave increased. Having to move to a poorer area, or being unable to moveout of one, is the geographical reality of social exclusion. People get furtherinto debt trying to avoid this. The most expensive consumer item is a car.The combination of the expense and necessity of car ownership is the reasonwhy not having a car is, for many, a contemporary mark of social failure. Itis also closely connected to why so many car firms were badly hit so earlyon in the crash of 2008, as they were selling debt as much as selling cars.
By 2008/9, two out of three children in Britain living in a householdwithout a car were living with only one parent. The chattels and behaviourthat signal what it means to be poor change over time and in accordancewith what most others have. By 2009, for a family not having a car outsideLondon, like not being able to go on the cheapest of summer holidays,spelled stigma.
This was the outcome of having a government that was seriously relaxedabout the rich becoming richer – ‘as long as they paid their taxes’. (But NewLabour cut Her Majesty’s Revenue staff, thereby reducing tax inspectors’abilities to chase the rich for their payments.) The gaps between all familiesgrew: celebrity, entrepreneur, affluent, hard-working, a bit slovenly, anddown-in-the-mouth. Council housing became social housing with the word‘social’ denoting implications of charity rather than rights.
Taxation became viewed by some in New Labour as a form of charity;something one ‘did’ for the poor. Jobseeker’s Allowance of £9 a day wasfine (as long as ‘one’ never imagined having to live off it oneself). Butcharity, or child tax credits, or Sure Start centres are simply not enough ifthe income gaps between people are allowed to turn into chasms. Whetherour gaps can be considered cracks or chasms can be established by lookingat other similarly affluent societies.
International comparisons of the quintile range of income inequality aresome of the most telling comparisons that can be made between countries.
123456789101112131415161718192021222324252627282930313233343536373839
Danny Dorling
268
Thatcherism-01-c.qxd 4/12/13 15:12 Page 268

By 2005, after eight years of New Labour government, the richest fifthreceived 7.2 times more income on average than the poorest fifth each year– up from 6.9 times in 1997. According to the United Nations DevelopmentProgramme’s Annual Report (the most widely used source), this ratio was6.1 to 1 in Ireland; 5.6 to 1 in France; 4.0 to 1 in Sweden; and 3.4 to 1 in Japan.By contrast, in the USA that same ratio of inequality was 8.5 to 1. Between1997 and 2005 the UK moved 0.3 points towards US levels of inequality, oralmost one-quarter of the way along the path to becoming as sociallyunequal as people are in the USA.
The great and the good of New Labour mostly cared. But caring was notenough given thinking that had been rewired by too many years of livingunder growing inequality, of living under Thatcherism. The people whomake up what is left of the party that governed until 6 May 2010 mostlyknow that it made huge mistakes, that what it did was not enough com-pared with what most other politicians in most other affluent countries inthe world achieve today; not enough compared with what the 1906 or 1910or 1945 or 1964, or even the 1974 governments achieved, all with less timeand far less money.
Conclusion
Thatcherism has shaped the contemporary human geography of the UK as surely as glaciation shaped its physical geography. Thatcherism cutthrough what was there before, brought great industrial cities to near ruin and elevated many small southern rural towns that had only recentlybeen places of monotony or poverty to rise to become sought after (if oftensoulless) dormitory villages for London. Just how appropriate the termThatcherism will be we will not be sure of until we know that the epochis truly over. We already know it has not occurred elsewhere in the worldin the form in which it rose in the UK. Perhaps it was part of the death-throes of Empire? We now know that in many other affluent countriessome equalities grew during the 1980s. The concept of Thatcherism,however, is likely to be a both an idea and a label that sticks, not leastbecause 1978/79 now appears to have been such a seminal turning pointin many key historical series. Above I have concentrated on economicinequalities and how they rose from that point on (Hills et al., 2010), butinequalities in health turned then too (Table 8.2), as did inequalities inwealth (Townsend, 1993), which also rose just a few years later (wealth
Mapping the Thatcherite legacy
123456789101112131415161718192021222324252627282930313233343536373839
269
Thatcherism-01-c.qxd 4/12/13 15:12 Page 269

lags). Even inequalities in the murder rate rose as Thatcherism grew inascendance (Dorling et al., 2008).
No one in the USA would call what happened there ‘Thatcherite’, andlikewise the acolytes of Thatcherism were not simply aping Mr Reagan andthe men who did that president’s thinking for him. It was politicalglaciation in the USA too, but of a different kind. It is worth reiterating thatthe UK Thatcherism may well, in part, have been a long-delayed reactionto loss of empire. Reaganomics, in hindsight, was about still building anempire, still fighting the Cold War. Thatcherism was turning back theprogressive tide and promoting, again, inequality. And then, in 2010 camethe Coalition. Initially the poor became much poorer while most of the richbecame richer. At the very top the incomes of FTSE executives continuedto rise so fast that the declining value of the pound could not dent theirabilities to holiday as before. But that was ‘initially’. There were signsduring 2012 that disgust with the rich might be growing and, in effect,disgust with the intellectual project of Thatcherism was growing. However,there were also signs of continued fear of the poor and even morereluctance to support welfare payments among the population as a wholeas when Mrs Thatcher herself was making cuts. And the basic lie ofThatcherism continued: that everyone could become rich if only they triedhard enough. That if you had not become rich it was simply because youeither had not tried hard enough or that you did not have the ‘potential’ tobe a tall poppy in you. When that view is seen as an ideology and not as‘common sense’, Thatcherism will have ended.
References
Ahmed, M. (2008) ‘Gordon Brown vows to Enshrine Child Poverty Pledge in Law’,http://www.communitycare.co.uk/Articles/2008/09/24/109514/gordon-brown-labour-will-legislate-to-end-child-poverty-by-2020.htm (accessed 29 July2011).
Atkinson, A.B. (2007). ‘The Distribution of Top Incomes in the United Kingdom1908–2000’, in A.B. Atkinson and T. Piketty (eds) Top Incomes over the TwentiethCentury. A Contrast Between Continental European and English-Speaking Countries.Oxford University Press, chapter 4. Series updated by the same author.
Baggini, J. (2010) Quoted in part in The Guardian (1 May), p. 37 and in full atwww.guardian.co.uk/commentisfree/2010/apr/30/lib-dems-tories-election
BBC (1999) http://news.bbc.co.uk/1/hi/uk_politics/298934.stm (accessed 30 July2011).
123456789101112131415161718192021222324252627282930313233343536373839
Danny Dorling
270
Thatcherism-01-c.qxd 4/12/13 15:12 Page 270

Campbell, J. (2008) Margaret Thatcher; Volume One: The Grocer’s Daughter, 3rd edn.London: Vintage (first published in 2000 by Jonathan Cape), p. 134.
Davies, C. and Davies, L. (2012) ‘Tory chief whip faces mounting calls to quit aspolice stand by expletive claim’, The Guardian (21 September), http://www.guardian.co.uk/politics/2012/sep/21/tory-chief-whip-andrew-mitchell-police
Dorey, P. (2010) British Conservatism: The Politics and Philosophy of Inequality. Londonand New York: I.B. Tauris.
Dorling, D. (1996) Area cartograms: Their Use and Creation Concepts and Techniques inModern Geography series no. 59. University of East Anglia: EnvironmentalPublications http://www.dannydorling.org/?page_id=1448
Dorling, D. (2010) ‘Our Divided Nation’, New Statesman (14 June). http://www.newstatesman.com/uk-politics/2010/06/election-seats-support-tory.
Dorling, D. (2011) Injustice: Why Social Inequality Persists. Cambridge: Policy PressDorling, D. (2012) The Visualization of Spatial Social Structure. Chichester: Wiley.Dorling, D. (2013) ‘Fairness and the Changing Fortunes of People in Britain’, The
Beveridge Memorial Lecture, 2012, presented to The Royal Statistical Society onWednesday, 27 June 2012, Journal of the Royal Statistical Society A, 176(1): 97–128.
Dorling, D. and Atkins, D.J. (1995) Population Density, Change and Concentration inGreat Britain 1971, 1981 and 1991, Studies on Medical and Population Subjects No.58, London: HMSO, http://www.dannydorling.org/?page_id=1449
Dorling, D. Gordon, D., Hillyard, P., Pantazis, C., Pemberton, S. and Tombs, S.(2008) Criminal Obsessions: Why Harm Matters more than crime London, 2nd edn.London: Centre for Crime and Justice Studies.
Guardian, The (2010) ‘Editorial’ (30 April): www.guardian.co.uk/commentisfree/2010/apr/30/the-liberalmoment-has-come (accessed 29 July 2011).
Hay, C. (1996) Re-Stating Social and Political Change. Maidenhead: Open UniversityPress.
Hay, C. and Farrall, S. (2011) ‘Establishing the Ontological Status of Thatcherismby Gauging Its “Periodisability”: Towards a “Cascade Theory” of Public PolicyRadicalism’, The British Journal of Politics & International Relations, 13(4): 439–58.
Heffernan, R. (2000) New Labour and Thatcherism. Basingstoke: Macmillan.Hennig, B.D. and Dorling, D. (2012) ‘The Geography of the Super-rich, Political
Insight’, Political Insight, 3(3): 42.Hills, J., Brewer, M., Jenkins, S., Lister, R., Lupton, R., Machin, S., Mills, C., Modood,
T. Rees, T. and Riddell, S. (2010) An Anatomy of Economic Inequality in the UK.London: Government Equalities Office/Centre for Analysis of Social Exclusion.
Jessop, B., Bonnett, K. and Bromley, S. (1990), ‘Farewell to Thatcherism?’, New LeftReview, 179: 81–102.
Jones, R. (2012). ‘End of Life and Financial Risk in GP Commissioning.’. BritishJournal of Healthcare Management, 18(7): 374–81.
Margaret Thatcher Foundation (2012) Biography (accessed November 2012):http://www.margaretthatcher.org/essential/biography.asp
Powell, R. (2012) ‘Echoes of the New Geography? History and Philosophy ofGeography’, Progress in Human Geography, 36(4): 518–26.
Mapping the Thatcherite legacy
123456789101112131415161718192021222324252627282930313233343536373839
271
Thatcherism-01-c.qxd 4/12/13 15:12 Page 271

Robinson, E. (2011) ‘Book review’ of Peter Dorey, British Conservatism: The Politicsand Philosophy of Inequality, Twentieth Century British History, 23(2): 307–8.
Simpson, L. (2004) ‘Statistics of Racial Segregation: Measures, Evidence and Policy’,Urban Studies, 41(3): 661–81.
Spalek, B. and King, S. (2007) ‘Farepak Victims Speak Out: an Exploration of theHarms Caused by the Collapse of Farepak’. See www.crimeandjustice.org.uk/opus419/Farepak_Web_Final.pdf. For the full report, see www.crimeandjustice.org.uk/farepakvictims.html. In April 2010, ‘Customers who Paid for Hampersfrom Farepak are Expected to Receive Less than £50 each, even as Accountantsand Lawyers Handling the Liquidation Rack up Millions in Fees’, The Times (27April 2010); and http://business.timesonline.co.uk/tol/business/industry_sectors/consumer_goods/article7108918.ece
Thatcher, M. (1979) ‘Margaret Thatcher Arrives at 10 Downing Street for the firsttime’, 4 May: http://www.youtube.com/watch?v=A23PQCndPYU
Townsend, P. (1993) ‘Underclass and Overclass: the Widening Gulf between SocialClasses in Britain in the 1980s’, in G. Payne and M. Cross (eds) Sociology in action:Applications and opportunities for the 1990s. London: Macmillan.
von Mises, L. (1975, 1990, 2012) ‘Economic Calculation in the SocialistCommonwealth’, in Friedrich A. Hayek (ed.) Collective Economic Planning.Clifton, NJ: Kelley Publishing, pp. 87–130, and Auburn, AL: Ludwig von MisesInstitute, 1990, available 2012 at: http://mises.org/document/448/Economic-Calculation-in-the-Socialist-Commonwealth
Waugh, E. (1945) Brideshead Revisited, The Sacred and Profane Memories of CaptainCharles Ryder. London: Chapman & Hall.
123456789101112131415161718192021222324252627282930313233343536373839
Danny Dorling
272
Thatcherism-01-c.qxd 4/12/13 15:12 Page 272