THANKS TO CONNECTED DEVICES LIKE TABLETS AND · thanks to connected devices like tablets and...
23
Transcript of THANKS TO CONNECTED DEVICES LIKE TABLETS AND · thanks to connected devices like tablets and...


THANKS TO CONNECTED DEVICES LIKE TABLETS AND
SMARTPHONES, THE WAY PEOPLE SHOP IS
CHANGING DRAMATICALLY.
We aim to better prepare brands for the future of retail.
So for the second consecutive year, DigitasLBi has
conducted a groundbreaking global survey into the
emerging trends of multi-platform shopping across 17
countries. (They include: Australia, Belgium, China,
Denmark, UAE, France, Germany, Hong Kong, India, Italy,
Japan, the Netherlands, Singapore, Spain, Sweden, the
United Kingdom and the USA.)
The study reveals the latest technology trends and
consumer habits that are transforming how, where, and
why we buy.
METHODOLOGY
T h e s t u d y w a s c o n d u c t e d
o n l i n e f r o m M a r c h 5 t h t o M a r c h
2 5 t h , 2 0 1 5 .
S a m p l e s i z e : 1 , 0 0 0 w e b u s e r s
p e r c o u n t r y a g e d 1 8 – 6 4
( q u o t a m e t h o d : g e n d e r , a g e ,
i n c o m e o r s o c i a l p r o f i l e ,
r e g i o n ) .

USAGE
SMARTPHONES ARE INCREASINGLY IMPORTANT
DURING ALL STAGES OF THE CUSTOMER JOURNEY.
What devices do people own and
how do they use them?

WHICH DEVICES DO PEOPLE USE?Ownership of mobile devices is now widespread in all countries
USAGE
SMARTPHONE
85% in 201570% in 2014
60% in 201539% in 2014
84% in 201576% in 2014
71% in 201558% in 2014
TABLET LAPTOP DESKTOP
17% in 2015
WEARABLE
DEVICES
What devices do you
personally use?
TABLETS AND SMARTPHONESPenetration rate of total population
TABLET
SMARTPHONE
BASES:
GLOBAL IN %
50
60
70
80
90
100
30 40 50 60 70 80
USAGE

MULTI-DEVICE BEHAVIOURSAnytime, anywhere, any device
ON AVERAGE PEOPLE USE 5 DEVICES
6 in India and UAE
2.7 in 2014
What devices do you
personally use?
USAGE

E-COMMERCE
WHENEVER, WHEREVER, HOWEVER.
This is the way new connected consumers shop.

In the last 30 DAYS, have you
bought an item online using
one of these devices?
SHOPPING BEHAVIOUR BY DEVICEOnline shopping has become common in all countries,
although there are some differences in terms of maturity
ECOMMERCE
75% of people
have purchased
an item online in
the last 30 days.
90% in China.
84% in the USA.
68% in Australia.
SMARTPHONE
28%of people
in 2015
20%of people
in 2015
50%of people
in 2015
41%of people
in 2015
TABLET LAPTOP DESKTOP
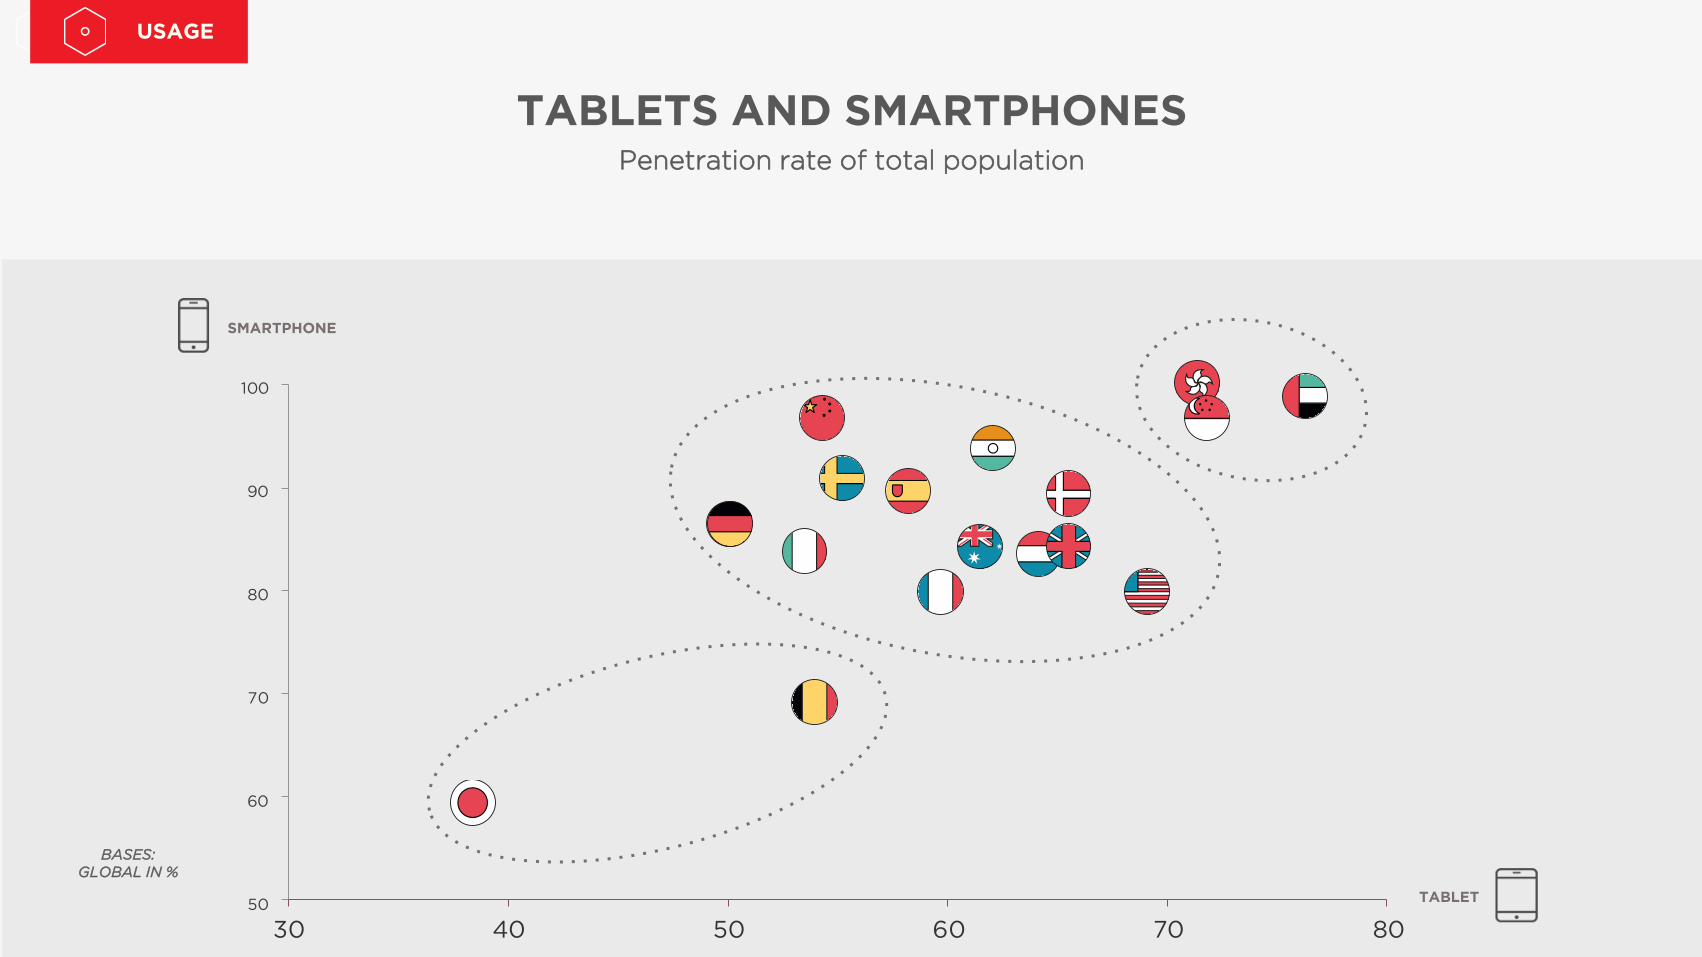
PERSONALISATION
When shopping online, 86% of
shoppers expect special offers
or discounts – and they’re
important for 39% of all
shoppers. For 65% of shoppers,
offers tailored to their previous
purchases or to their user
profile are important. (for 20%
of e-shoppers, very important)
Overall, 57% of e-shoppers find
personalised recommendations
important, and 18% very
important.
INTEREST IN PERSONALISATIONImpact of personalized experience through a personal account
87%of people who log in an e-commerce websites in order to
have personalized offer, says that they buy more.
78% buy more often, 76% buy more products.
Do you always log in to your e-commerce
account when shopping online (on the
regular website you use, as Amazon,
Baidu, Alibaba, etc.)?
ECOMMERCE

MAIN REASONS FOR
NOT LOGGING IN:
Those who purposefully don’t
log in / log off believe it is
‘militant’ behaviour. They don’t
want to give their data to e-
commerce websites or they
consider it annoying to register
each time.
NORMALLY LOG IN TO THEIR
E-COMMERCE ACCOUNT WHEN SHOPPING ONLINE. 21% always do.
40%
‘I want to be able to
check what I have
seen during my
previous visits’
I want to receive
personalised marketing
and promotional offers’
37% 34%
‘I do not want to re-
enter my bank account
and personal data
every time’
Why do you log in when
shopping online?
E-COMMERCE LOG-IN HABITSPersonalization is a key driver of performance
75%
ECOMMERCE
AND AMONG THEM :

RETAIL
THE BRICKS AND MORTAR STORE IS BACK.
But it needs to evolve; be more agile, more digital, and more
connected to consumers’ lives.

SOURCES OF INFORMATIONMain sources of information used
RETAIL
What resources do you use to search
for information on a product or
service? I consult... Please grade your
responses where 1 is the one you use
the most.
INTERNET APPEARS AS THE MAIN SOURCE
OF INFORMATION:
- retailer websites or apps are the first digital
source of information in all countries, notably
in the USA, UK and the Netherlands
- price comparison services are next (47%),
more widely used in Germany, the
Netherlands, Denmark, Sweden and Japan
- 37% use brand websites or apps (more in
the USA, Belgium, Sweden, Singapore and
Australia)
- reviews by online users or consumers are
used by 33% (especially in Germany, the
Netherlands, Denmark and Sweden)
OFFLINE SOURCES ARE STILL IMPORTANT
when looking for information on a product or
service:
- point-of-sale is quoted as the first source of
information (16%), especially in Belgium,
Denmark, Spain and Italy
- the immediate social circle (friends, family,
colleagues) comes second (15%); it is more
common in Asian countries (China, Hong-
Kong, Singapore and India).
20%in 2015
18% in 2014 (1)
RETAILER
WEBSITE APPS
16%in 2015
14% in 2014 (4)
STORE
15%in 2015
13% in 2014 (5)
FAMILY
& FRIENDS
14%in 2015
15% in 2014 (2)
PRICE
COMPARISON
SITES
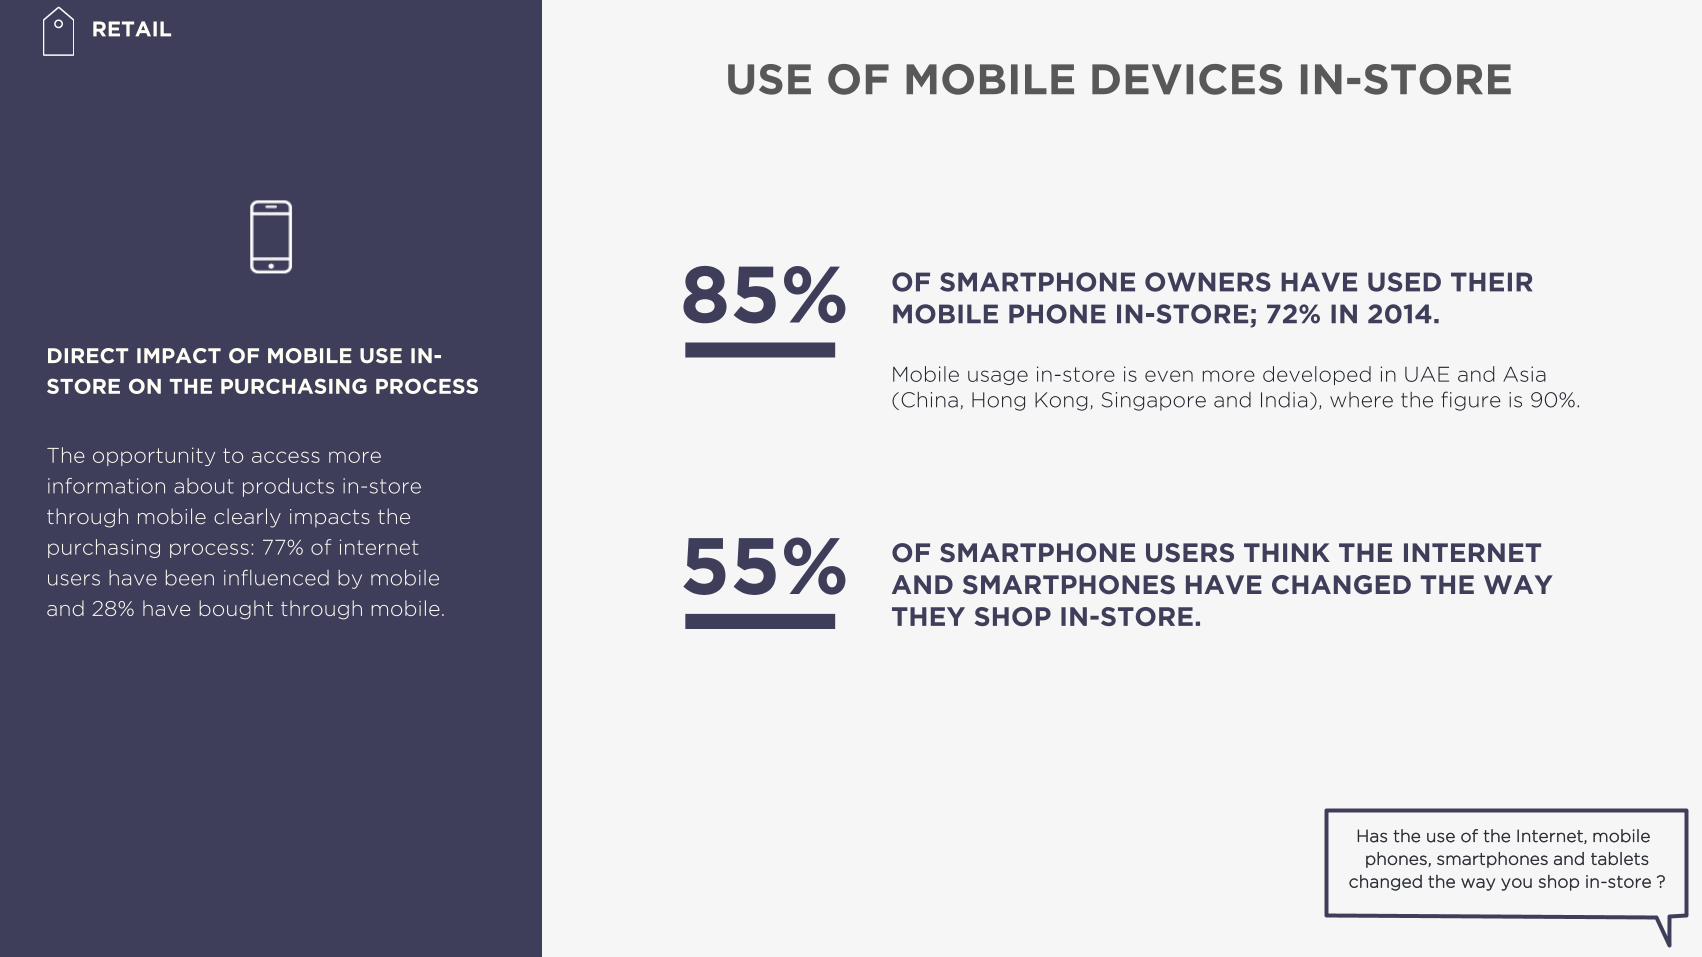
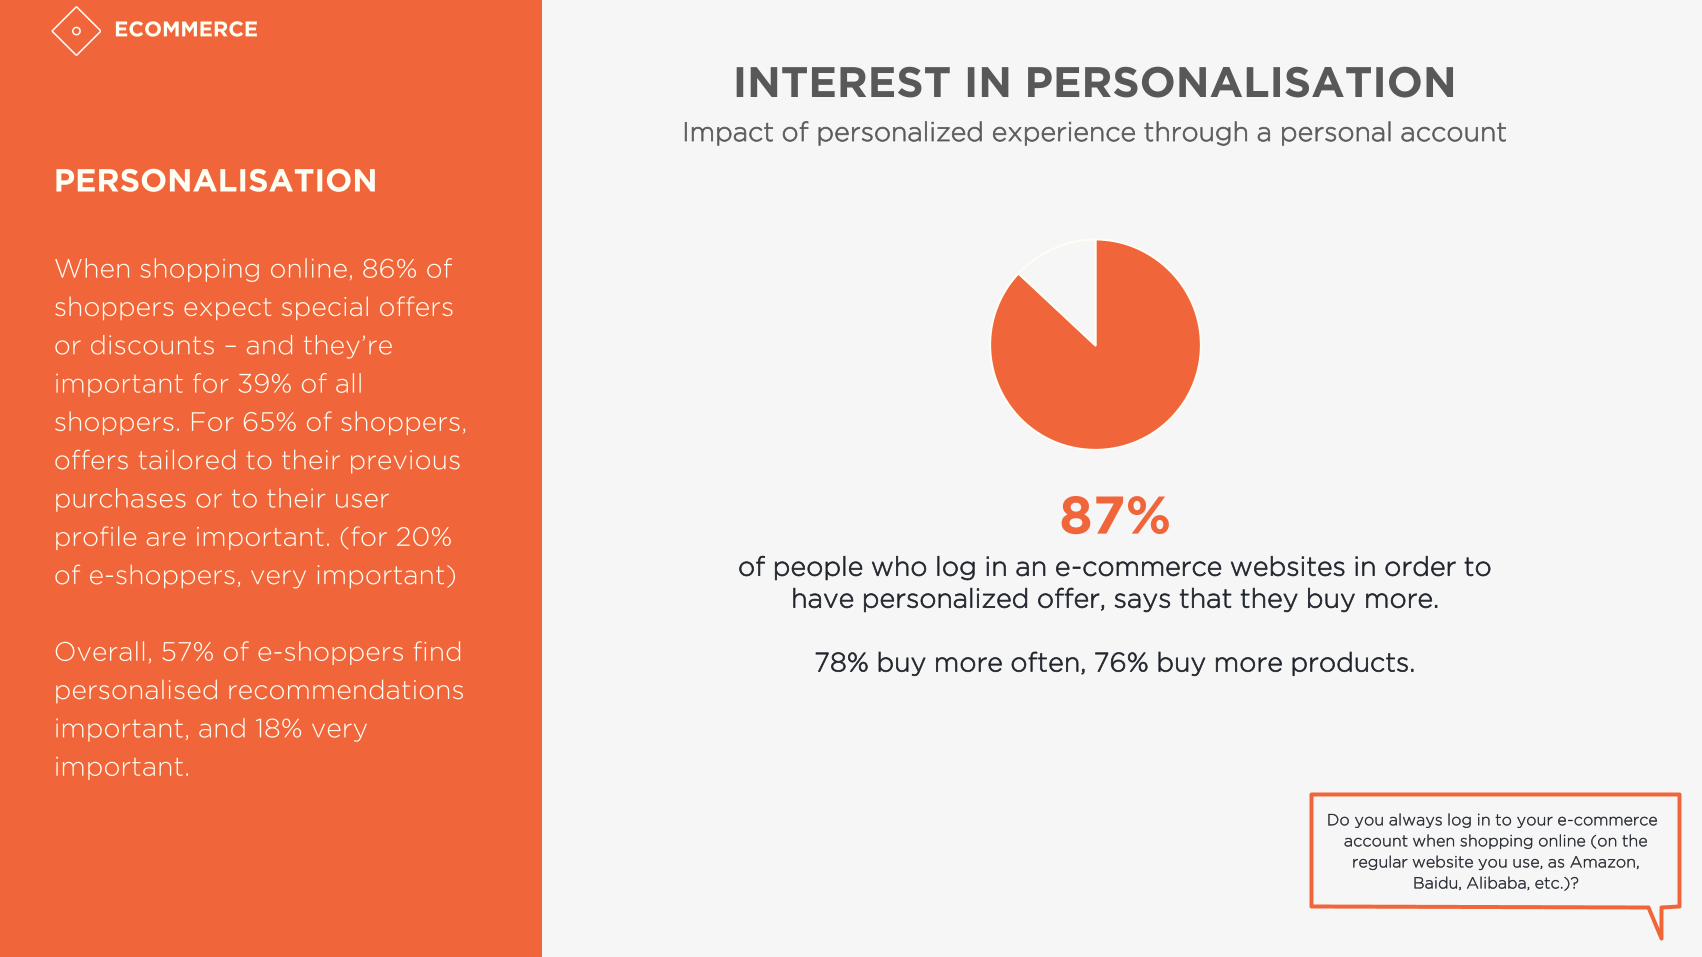
DIRECT IMPACT OF MOBILE USE IN-
STORE ON THE PURCHASING PROCESS
The opportunity to access more
information about products in-store
through mobile clearly impacts the
purchasing process: 77% of internet
users have been influenced by mobile
and 28% have bought through mobile.
USE OF MOBILE DEVICES IN-STORE
Has the use of the Internet, mobile
phones, smartphones and tablets
changed the way you shop in-store ?
RETAIL
OF SMARTPHONE OWNERS HAVE USED THEIR
MOBILE PHONE IN-STORE; 72% IN 2014.
Mobile usage in-store is even more developed in UAE and Asia
(China, Hong Kong, Singapore and India), where the figure is 90%.
85%
OF SMARTPHONE USERS THINK THE INTERNET
AND SMARTPHONES HAVE CHANGED THE WAY
THEY SHOP IN-STORE.
55%

71%
Of U.S consumers are willing
to receive personalised
money-off vouchers or special
offers on their mobile whilst in
the store.
58%
Of shoppers in Spain would
try on clothes virtually using
a digital mirror.
83%
Of UAE consumers are willing
to use a loyalty card on their
mobile phones.
57%
Of Japanese consumers are
willing to check in-store stock
availability via their mobile
phones.
39%
62% 75%
Of Italian consumers are willing
to use a system allowing them
to be identified in-store in order
to receive certain advantages.
Of UK consumers are willing to
use a virtual reality helmet (i.e.:
Oculus Rift) to discover a product
not available in-store.
.
Of Hong Kong consumers are
willing to use interactive
terminals to browse and buy the
products available in-store.
RETAIL
NEW DIGITAL SERVICES IN STORE
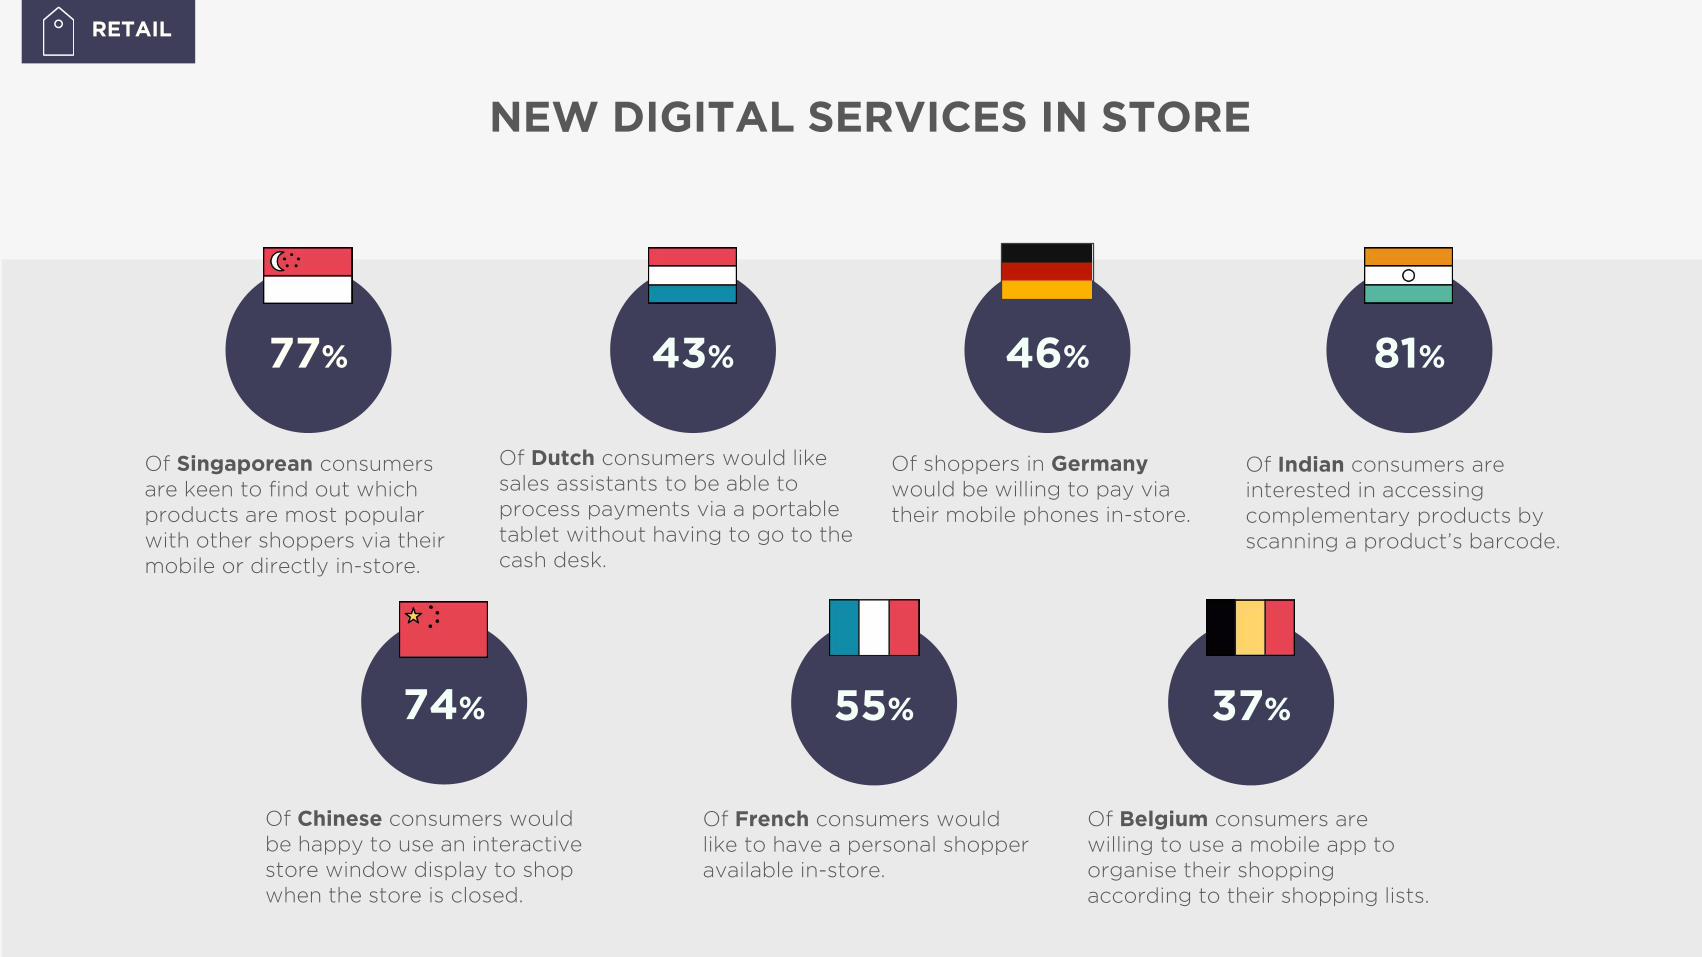
77%
Of Singaporean consumers
are keen to find out which
products are most popular
with other shoppers via their
mobile or directly in-store.
46%
Of shoppers in Germany
would be willing to pay via
their mobile phones in-store.
81%
Of Indian consumers are
interested in accessing
complementary products by
scanning a product’s barcode.
74%
Of Chinese consumers would
be happy to use an interactive
store window display to shop
when the store is closed.
43%
55% 37%
Of French consumers would
like to have a personal shopper
available in-store.
Of Dutch consumers would like
sales assistants to be able to
process payments via a portable
tablet without having to go to the
cash desk.
Of Belgium consumers are
willing to use a mobile app to
organise their shopping
according to their shopping lists.
RETAIL
NEW DIGITAL SERVICES IN STORE

MOBILE
MOBILE IS STILL DRIVING CHANGE.
Being the personal shopping assistant for consumers.
MOB
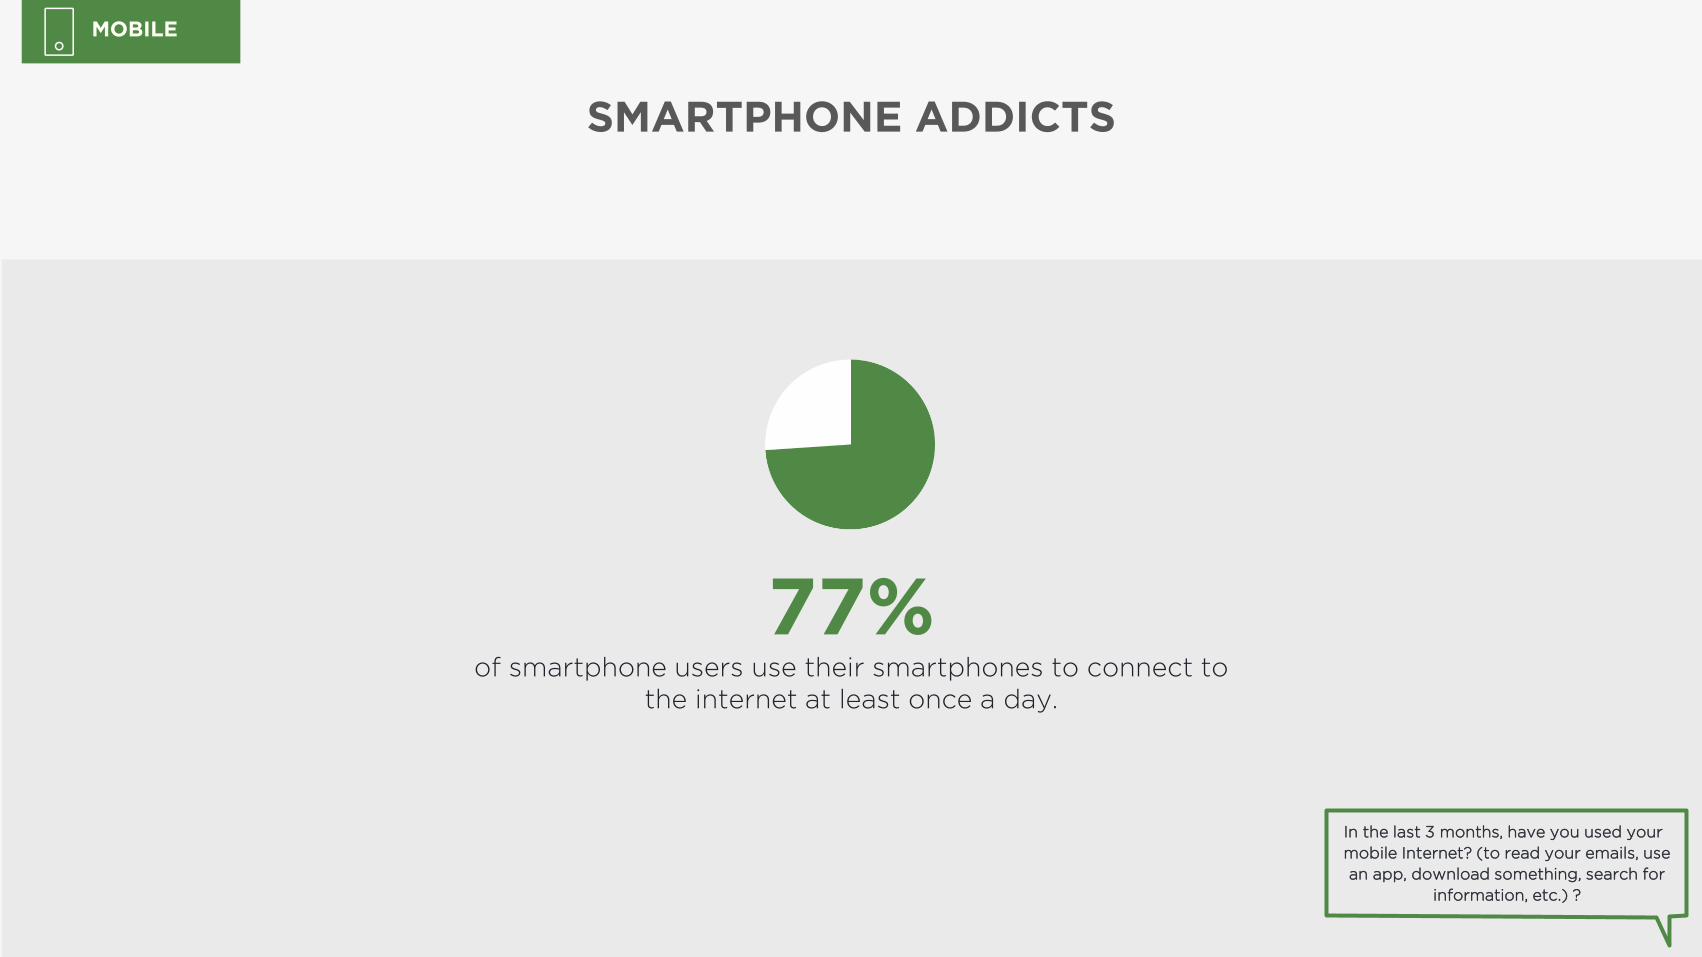
In the last 3 months, have you used your
mobile Internet? (to read your emails, use
an app, download something, search for
information, etc.) ?
MOBILE
SMARTPHONE ADDICTS
77%of smartphone users use their smartphones to connect to
the internet at least once a day.
What resources do you use to search for
information on a product or service? I
consult... Please grade your responses
where 1 is the one you use most ?
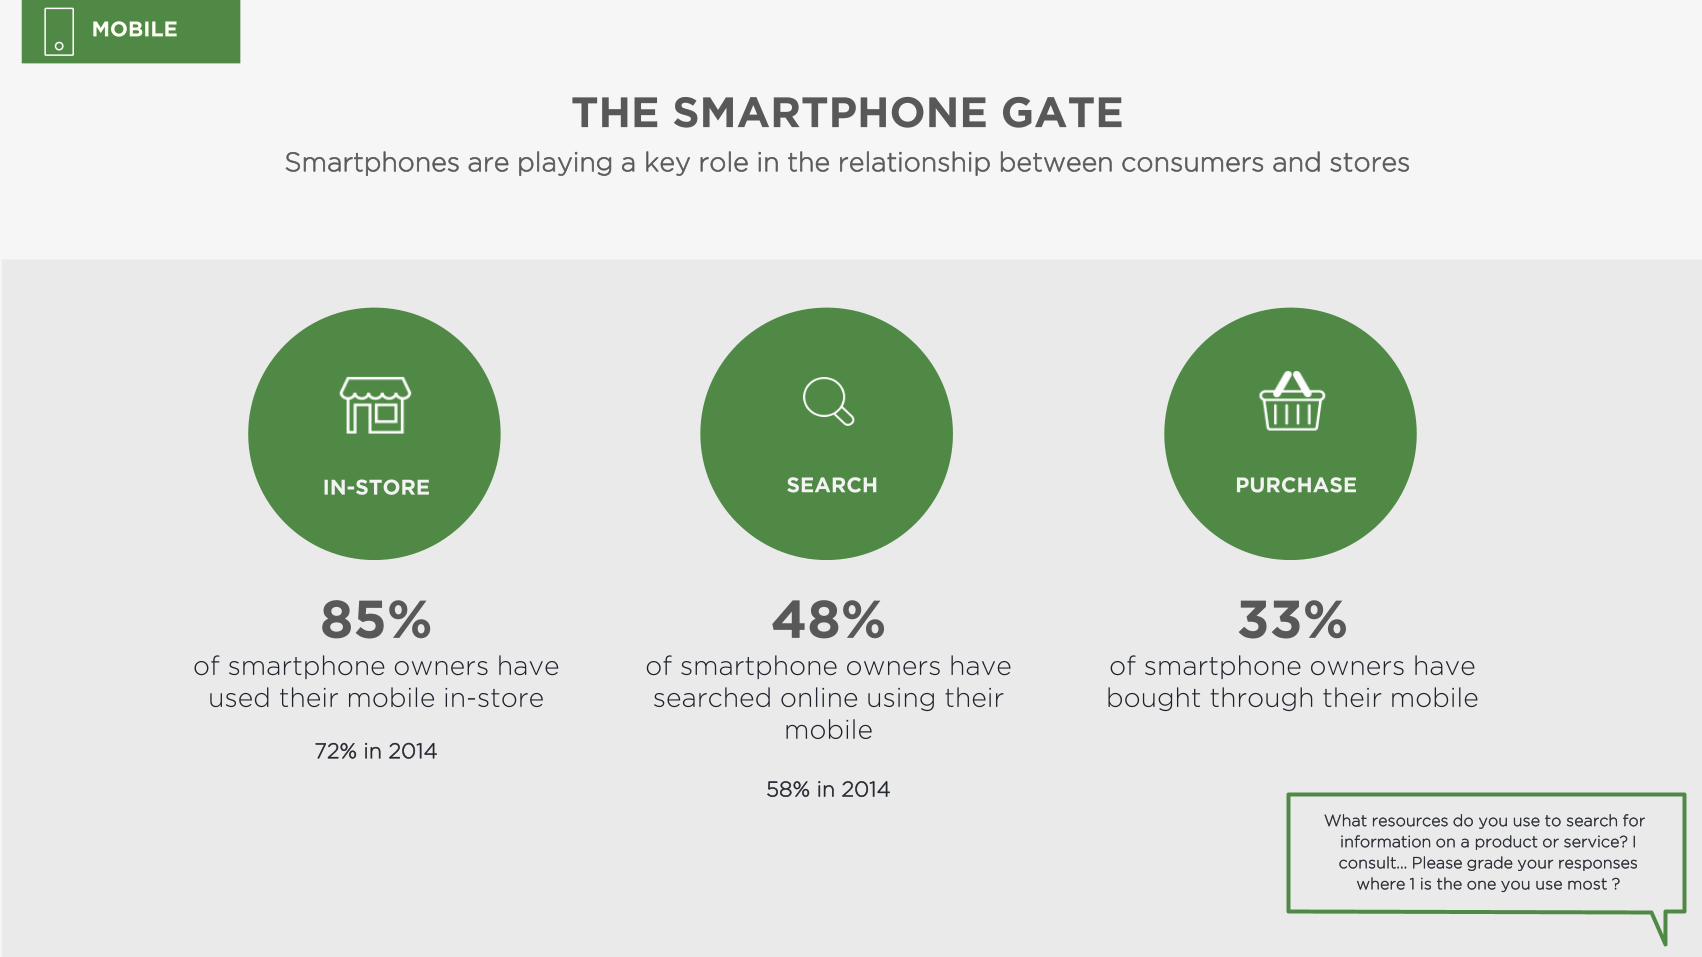
MOBMOBILE
33%of smartphone owners have
bought through their mobile
PURCHASE
85%of smartphone owners have
used their mobile in-store
72% in 2014
IN-STORE
THE SMARTPHONE GATESmartphones are playing a key role in the relationship between consumers and stores
48%of smartphone owners have
searched online using their
mobile
58% in 2014
SEARCH

MOB
In the last 30 days, have
you purchased an item… ?
MOBILE
33%of smartphone users have bought through
their mobile in the last 30 days
Mobile shopping is more developed in UAE (39%) and the
USA (44%) than in Europe and Australia, where the figure
is around 20% on average.
MOBILE PAYMENTSMobile purchasing has increased, but is still far behind
in terms of total online purchasing (80%)
62%of smartphone users would be ready to use
their device to pay in-store
21% have already done it; 49% in India, 34% in USA
SOCIAL
SOCIAL MEDIA IS INFLUENCING AN INCREASING
NUMBER OF PURCHASES ON AND OFFLINE.
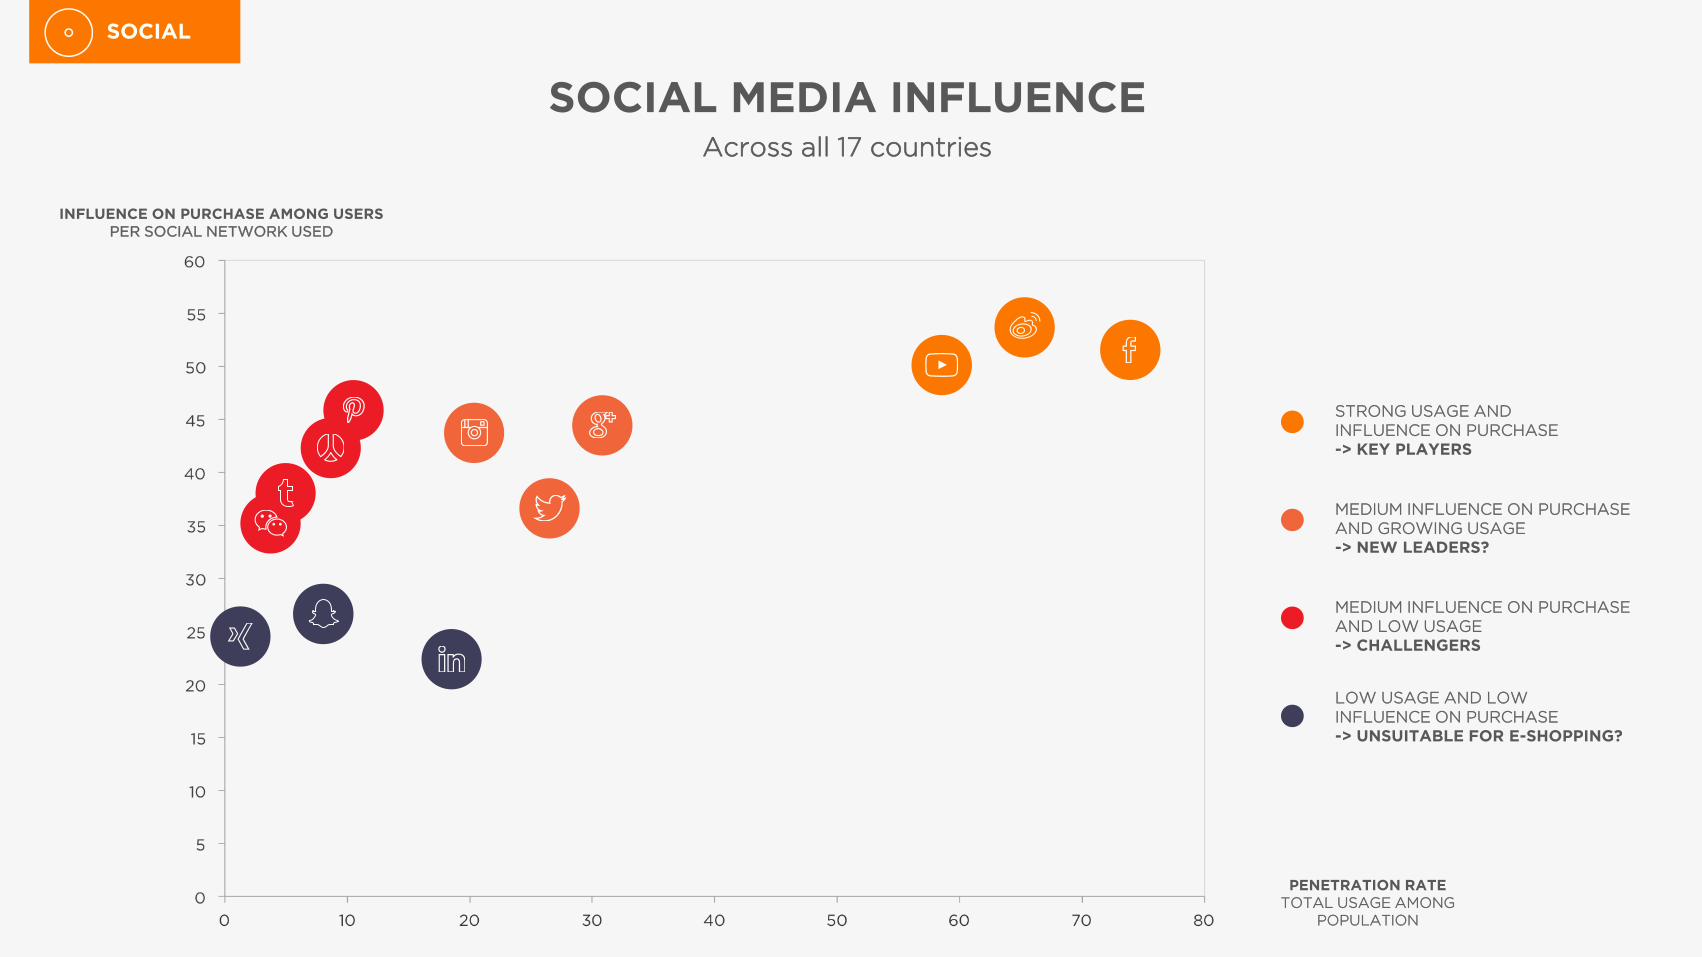
SOCIAL
STRONG USAGE AND
INFLUENCE ON PURCHASE
-> KEY PLAYERS
MEDIUM INFLUENCE ON PURCHASE
AND GROWING USAGE
-> NEW LEADERS?
MEDIUM INFLUENCE ON PURCHASE
AND LOW USAGE
-> CHALLENGERS
LOW USAGE AND LOW
INFLUENCE ON PURCHASE
-> UNSUITABLE FOR E-SHOPPING?
PENETRATION RATE
TOTAL USAGE AMONG
POPULATION
INFLUENCE ON PURCHASE AMONG USERS
PER SOCIAL NETWORK USED
SOCIAL MEDIA INFLUENCEAcross all 17 countries

Which of the following social media
platforms do you think influence
you-make you want to buy
certain products ?
52% of
users claim to
be influenced
by Facebook
43% of
Instragram
users claim to
be influenced
by Instagram
36% of Twitter
users claim to be
influenced by Twitter
46% of Pinterest
users claim to
be influenced by
53% of Sina
Weibo users
claim to be
influenced by
Sina Weibo
SOCIAL
INFLUENCE OF SOCIAL NETWORKS
ON THE PURCHASING PROCESS
Facebook and Sina Weibo in China are the social networks most likely to influence purchases
OF SOCIAL NETWORK USERS SAY THAT, WHEN
IN-STORE, THEY BUY MORE PRODUCTS OF BRANDS
THEY FOLLOW ON SOCIAL MEDIA NETWORKS.
60% in China, 18% in The Netherlands.
35%

MARKET MATURITY DIFFERS COUNTRY
BY COUNTRY, ESPECIALLY IN ASIA VS
THE REST OF THE WORLD.
Purchases via social media platforms are
more developed in the USA, UAE and
Asia; less so in Europe.
Sina Weibo and Renren users are the
most familiar with direct online
purchases, even more so than Google+ or
Facebook users.
SOCIAL PURCHASESocial media platforms are not yet a major purchasing channel.
SOCIAL
Have you ever bought an item
directly from a social media
platform?
OF SOCIAL NETWORK USERS HAVE BOUGHT AN
ITEM DIRECTLY FROM A SOCIAL MEDIA PLATFORM
IN THE LAST 30 DAYS.
32% in the USA, 56% in Singapore, 25% in the UK.
28%
39%from
Sina Weibo
29%from
Renren
23%from
21%from
18%from
17%from