Thales: Value and Impact Study of Australian Supply Chain
27
Thales: Value and Impact Study of Australian Supply Chain 2021 report August 2021 Commissioned by:
Transcript of Thales: Value and Impact Study of Australian Supply Chain
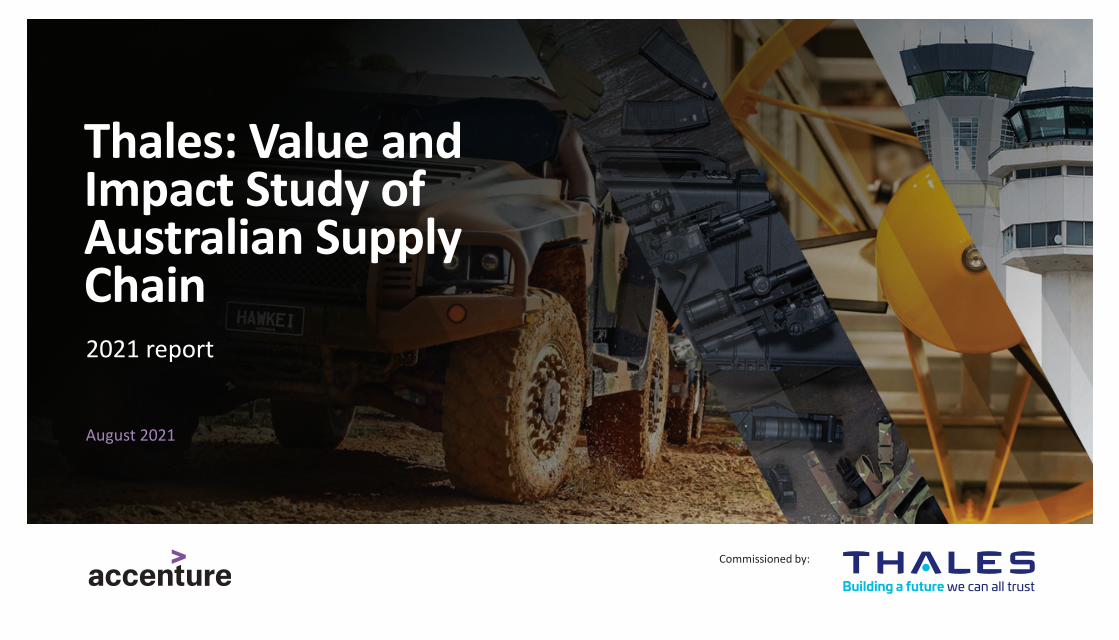
Thales: Value and Impact Study of Australian Supply Chain2021 report
August 2021
Commissioned by:

Key findings – supply chain spending trends
Thales is a significant investor in local Australian businesses. In 2020, Thales spent $657m with 1,841 Australian suppliers – $188m was spent on Maritime Service & Support, $157m on procurement for Protected Vehicles and $129m for Munitions & Small Arms.
Thales’s Australian supply chain spend totalled $1.9bn over the three years, 2018 to 2020, of which 70% was associated with Maritime Service & Support, Protected Vehicles, and Munitions & Small Arms.
SMEs are a critical part of Thales’s Australian supply chains, with more than 1,500 SMEs making-up 82% of all Thales’s Australian suppliers in 2020. SMEs also won 56% of Thales’s Australian procurement spending.
88% of Thales’s Australian suppliers are in NSW, Victoria and Queensland, as this is where production is located; however, suppliers in all States and Territories receive some investment.
Key findings – supply chain jobs and economic impact
Spending by Thales on suppliers directly supported 2,051 jobs in 2020, with Maritime Service & Support and Munitions & Small Arms making the biggest contributions, at 606 (30%) and 458 (22%) respectively.
Over half of supply chain jobs directly supported by Thales’s Australian spending are in SMEs: of the 2,051 jobs supported, 1,087 (53%) are with SMEs.
Thales supports jobs with suppliers all across the country, 89% of jobs are in NSW, Victoria and Queensland as this is where production is located.
Thales sites have significant local economic impact: across major sites, 28% of suppliers, 33% of spend and 34% of jobs supported are in the same Commonwealth Electoral District as a major Thales site.
Executive Summary: Measuring Thales’s supply chain spend and impact (I/II)

Context for study
Understanding the value and impact of Defence Prime spend on local Australian businesses is critical as the Australian Government ramps-up its $200bn Integrated Investment Program (IIP).
Prime defence contractors, such as Thales, are key to translating IIP spend into effective local supply chain and investment programs because they provide a link between the Department of Defence’s investment and the many other Australian businesses that participate in the Prime’s supply chains.
– Thales is one of Australia’s largest manufacturers of Defence capabilities in Australia, with 12 major sites located around the country.
– Thales is a significant customer for other local Australian businesses that participate in its supply chains, with spending of $1.9b in the three years from 2018 to 2020.
However, to date there has been little quantitative data available on the local investment programs of Primes, and and the impact that their investment has on other local businesses and economies.
Thales Australia has partnered with Accenture to take a data-driven approach to quantifying supply chain spending and impact to analyse Thales’s actual spending in 2020.
This enabled the study to use actual spending and firm-level data to measure:
a. The value of Thales’s spending on local Australian businesses in its supply chains
b. The value and characteristics of this spending by business unit, location and supplier business size
c. The impact of this spending on local jobs and economies
Executive Summary: Measuring Thales’s supply chain spend and impact (II/II)
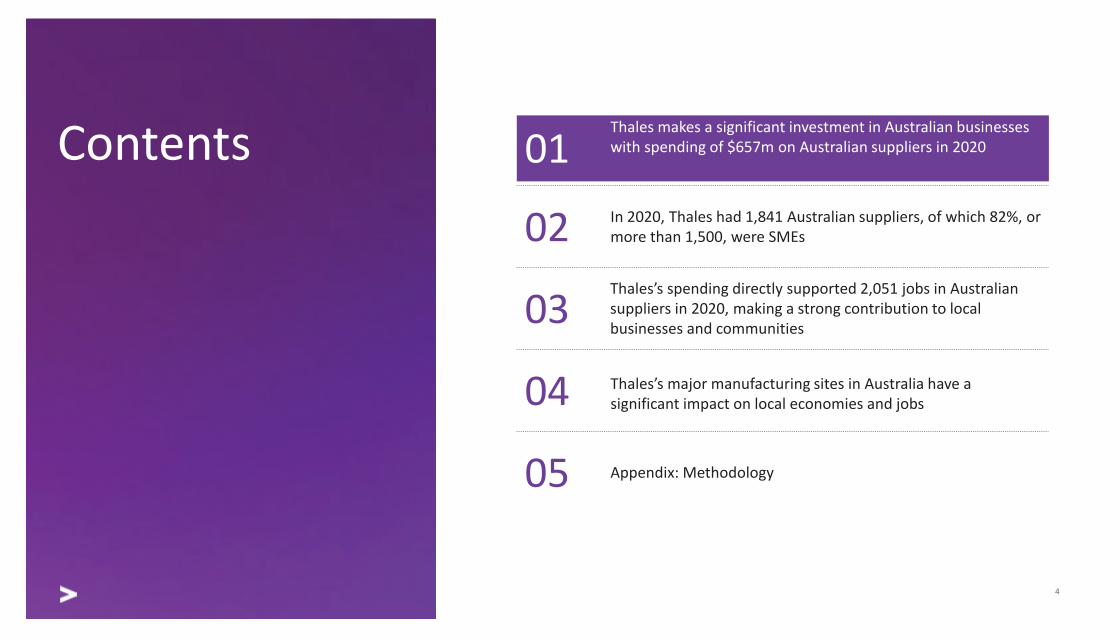
01Thales makes a significant investment in Australian businesses with spending of $657m on Australian suppliers in 2020
02 In 2020, Thales had 1,841 Australian suppliers, of which 82%, or more than 1,500, were SMEs
03Thales’s spending directly supported 2,051 jobs in Australian suppliers in 2020, making a strong contribution to local businesses and communities
Contents
04 Thales’s major manufacturing sites in Australia have a significant impact on local economies and jobs
05 Appendix: Methodology

Thales is one of Australia’s largest manufacturers of Defence capabilities in Australia, with 12 major sites located around the country
SOURCE: ABS, Thales procurement and expenditure data, Accenture analysis
Air Traffic Management $95m spent delivering to:
Shared Services & Corporate $290m spent with suppliers delivering to:
Munitions & Small Arms $386m spent with suppliers delivering to:
Under Water Systems $78m spent delivering to:
Protected Vehicles $398m spent with suppliers delivering
to:
Digital Systems $109m spend with suppliers delivering to:
In the three years from 2018 to 2020, Thales spent $1.9bn with Australian suppliers to deliver projects across 12 major Thales sites in Australia
Maritime Service & Support $552m spent with suppliers delivering to:
Newcastle
Garden Island1Darwin2
3
Melbourne
Bendigo4Eagle Farm5
6
Melbourne6
Canberra7
Rydalmere8
Rydalmere8West Leederville & Rockingham9
Mulwala/Benalla10Lithgow & Orchard Hills11
Sydney Olympic Park and nationally12
1. OVERVIEW OF THALES’S AUSTRALIAN SPENDING ON SUPPLIERS
Newcastle
Lithgow & Orchard Hills
Mulwala/Benalla
Garden Island
Melbourne
Bendigo
Darwin
Eagle Farm
Rydalmere
Sydney Olympic Park
Canberra
West Leederville &Rockingham
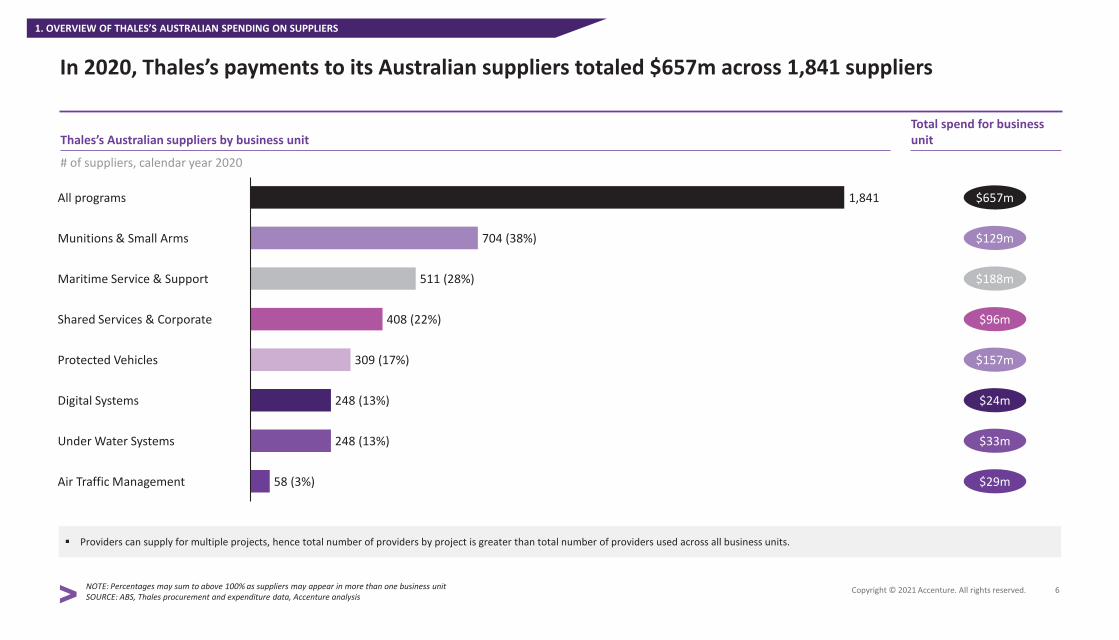
In 2020, Thales’s payments to its Australian suppliers totaled $657m across 1,841 suppliers
NOTE: Percentages may sum to above 100% as suppliers may appear in more than one business unitSOURCE: ABS, Thales procurement and expenditure data, Accenture analysis
Providers can supply for multiple projects, hence total number of providers by project is greater than total number of providers used across all business units.
# of suppliers, calendar year 2020
Thales’s Australian suppliers by business unitTotal spend for business unit
1,841All programs
Protected Vehicles
Shared Services & Corporate
Munitions & Small Arms
Maritime Service & Support
Under Water Systems
Air Traffic Management
Digital Systems
704 (38%)
511 (28%)
408 (22%)
248 (13%)
58 (3%)
309 (17%)
248 (13%)
$657m
$129m
$157m
$96m
$188m
$24m
$33m
$29m
1. OVERVIEW OF THALES’S AUSTRALIAN SPENDING ON SUPPLIERS
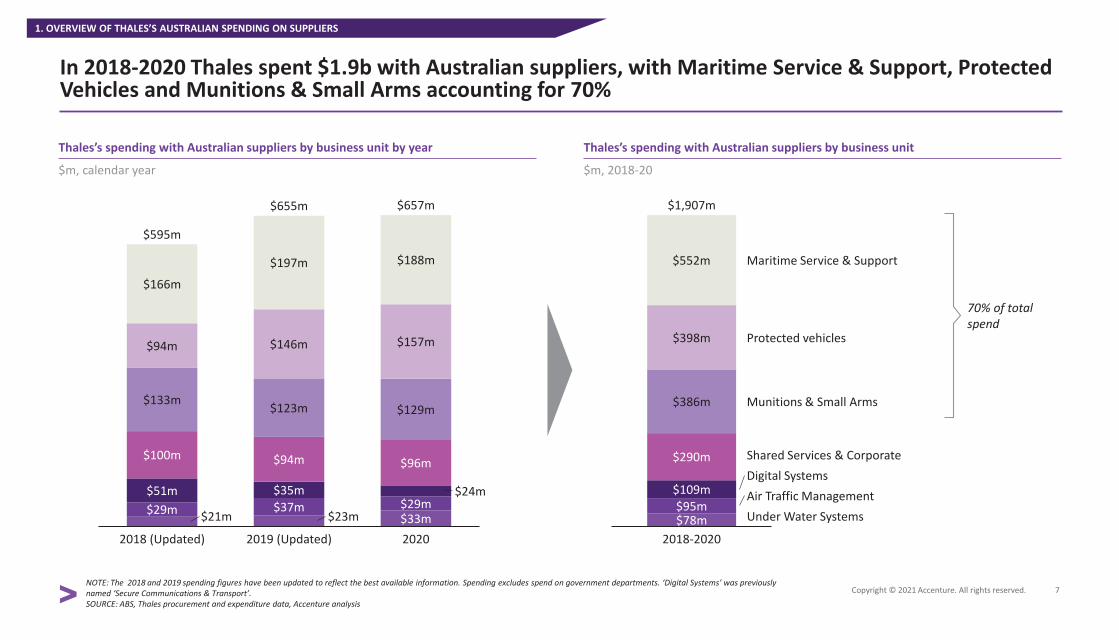
In 2018-2020 Thales spent $1.9b with Australian suppliers, with Maritime Service & Support, Protected Vehicles and Munitions & Small Arms accounting for 70%
NOTE: The 2018 and 2019 spending figures have been updated to reflect the best available information. Spending excludes spend on government departments. ‘Digital Systems’ was previously named ‘Secure Communications & Transport’.SOURCE: ABS, Thales procurement and expenditure data, Accenture analysis
$m, calendar year
Thales’s spending with Australian suppliers by business unit by year Thales’s spending with Australian suppliers by business unit
$m, 2018-20
2018 (Updated) 2019 (Updated)
$188m
$29m
$157m
$129m
$96m
$24m
$94m
$33m2020
$37m
$657m
$595m
$123m
$21m$29m$51m
$100m
$133m
$94m
$166m
$655m
$23m
$35m
$146m
$197m
Under Water Systems
Digital Systems
$78m2018-2020
$386m
$552m
$398m
$290m
$109m$95m
Maritime Service & Support
Protected vehicles
Munitions & Small Arms
Shared Services & Corporate
Air Traffic Management
$1,907m
1. OVERVIEW OF THALES’S AUSTRALIAN SPENDING ON SUPPLIERS
70% of total spend

01Thales makes a significant investment in Australian businesses with spending of $657m on Australian suppliers in 2020
02 In 2020, Thales had 1,841 Australian suppliers, of which 82%, or more than 1,500, were SMEs
03Thales’s spending directly supported 2,051 jobs in Australian suppliers in 2020, making a strong contribution to local businesses and communities
Contents
04 Thales’s major manufacturing sites in Australia have a significant impact on local economies and jobs
05 Appendix: Methodology

SMEs accounted for 82% of the 1,841 Australian suppliers Thales procured from in 2020, winning 56% of Thales’s Australian procurement spending
Number (%) of suppliers (LHS) and $m (%) spend (RHS), calendar year 2020
Thales’s Australian suppliers and spend by business size
$240m(36%)
% of spend
$129m(20%)
$657m
$288m(44%)
$368m(56%)
1511(82%)
2. PROFILE OF THALES’S AUSTRALIAN SUPPLIER SPEND & IMPACT IN 2020
Large businesses includes businesses with 200 employees or more Medium businesses includes businesses with 20-199 employees Small businesses includes businesses with less than 20 employees
Small businesses
Large businesses
942(51%)
Medium businesses 569(31%)
330(18%)
Number of firms
1,841
NOTE: The sum of spending on small and medium business does not sum to spending on SMEs due to rounding.SOURCE: ABS, Thales procurement and expenditure data, Accenture analysis

West Leederville &Rockingham
Mulwala/Benalla
Garden Island
Melbourne
BendigoCanberra
Eagle Farm
Darwin
Lithgow & Orchard Hills Rydalmere
Newcastle
Sydney Olympic Park
While Thales’s supplier base is national, 88% of suppliers are in New South Wales, Victoria and Queensland as this is where production is located
SOURCE: ABS, Thales procurement and expenditure data, Accenture analysis
#, $m, %SMEs, calendar year 2020
Thales’s suppliers by state X - State share of count of national suppliers
TAS<1%
NSW
QLD
NT
WA
SA
1%
37%
3%
7%3%
4%
2. PROFILE OF THALES’S AUSTRALIAN SUPPLIER SPEND & IMPACT IN 2020
8 suppliers providing$7m goods & services88% SMEs
VIC720 suppliers providing$186m goods & services81% SMEs
ACT 27 suppliers providing$6m goods & services74% SMEs
875 suppliers providing$351m goods & services78% SMEs
131 suppliers providing$52m goods & services82% SMEs
52 suppliers providing$15m goods & services79% SMEs
86 suppliers providing $23m goods & services73% SMEs
55 suppliers providing$17m goods & services
82% SMEs
Suppliers can operate in multiple states, such that count of suppliers by state is greater than the count of all suppliers
88% of all suppliers
45%

Australian SMEs are most competitive in manufacturing industries, professional services, and construction
Note: Excludes all industries with less than $10m in spendingSOURCE: ABS, Thales procurement and expenditure data, Accenture analysis
% share for SME and Large suppliers, calendar year 2020
Thales’s spending by industry
93%
80%
78%
76%
72%
72%
71%
69%
50%
45%
36%
29%
Polymer product and rubber product manufacturing
$21m
Fabricated metal product manufacturing
Machinery and equipment manufacturing
Construction services
Machinery and equipment wholesaling
Telecommunications services
Computer system design and related services
Road transport
Property operators and real estate services
$12m
<1%Transport support services
<1%Heavy and civil engineering construction
$60m
<1%Administrative services
Electricity supply
Other store-based retailing
0%
$13m
$58m
$16m
$27m
$47m
$73m
$11m
$14m
$20m
$40m
$23m
Professional, scientific and technical services
Transport equipment manufacturing
Finance
$58m
$19m
0%
$19m
Thales tends to contract SMEs to supply manufactured goods. SMEs provide over 50% of goods four key manufacturing industries. Other areas where SMEs have a dominant share include professional services and construction.
Thales is more likely to contract larger firms to deliver a wide range of services.
2. PROFILE OF THALES’S AUSTRALIAN SUPPLIER SPEND & IMPACT IN 2020
% share spent with SMEs $m spend p.a.
SME supplier share Large supplier shareServicesManufacturing

Australian SMEs are competitive in larger spending industries, accounting for the majority of Thales’s spend in 6 of its top 10 largest supplier industries
Note: Excludes all industries with less than $10m in spendSOURCE: ABS, Thales procurement and expenditure data, Accenture analysis
$m spent with SME and Large suppliers, calendar year 2020
Thales’s spending by industry
SMEs account for the majority of spending by value in 8 of the 17 largest industries in 2020.
Large supplier share
$60m
Professional, scientific and technical services
<1%
25%
Transport equipment manufacturing
72%
76%
71%
Fabricated metal product manufacturing
Machinery and equipment wholesaling
Machinery and equipment manufacturing 80% $58m
69%
78%
<1%
$27m
Electricity supply
Administrative services
45%
Construction services
<1%
Road transport
36%
Polymer product and rubber product manufacturing
Telecommunications services
Finance
Transport support services
29%
72%
24%
Property operators and real estate services
50%Computer system design and related services
Heavy and civil engineering construction
93%
$21m
Other store-based retailing
$73m
$58m
$47m
$40m
$11m
$23m
$20m
$19m
$19m
$16m
$14m
$13m
$12m
% share spent with SMEs
11.1%
9.1%
8.9%
8.8%
7.2%
6.0%
4.1%
3.4%
3.2%
3.0%
2.8%
2.8%
2.5%
2.1%
2.0%
1.8%
% Share of Thales’s total spend p.a.
2. PROFILE OF THALES’S AUSTRALIAN SUPPLIER SPEND & IMPACT IN 2020
Majority SME suppliers Majority large suppliers
1.6%

01Thales makes a significant investment in Australian businesses with spending of $657m on Australian suppliers in 2020
02 In 2020, Thales had 1,841 Australian suppliers, of which 82%, or more than 1,500, were SMEs
03Thales’s spending directly supported 2,051 jobs in Australian suppliers in 2020, making a strong contribution to local businesses and communities
Contents
04 Thales’s major manufacturing sites in Australia have a significant impact on local economies and jobs
05 Appendix: Methodology

Thales’s Australian supplier spend directly supported 2,051 jobs in 2020, including 1,087 with Australian SMEs
NOTE: Thales’s jobs supporters only includes jobs in Thales’s direct suppliers. Percentages may sum to over 100% due to rounding.SOURCE: ABS, Thales procurement and expenditure data, Accenture analysis
# of jobs supported, calendar year 2020
Thales’s jobs supported by business unit Thales’s jobs directly supported in SME/Non-SME suppliers
% of jobs directly supported, calendar year 2020
2,051All programs
Digital Systems
Maritime Service & Support
Munitions & Small Arms
606 (30%)
Protected Vehicles
Shared Services & Corporate
Under Water Systems
Air Traffic Management
458 (22%)
414 (20%)
306 (15%)
103 (5%)
82 (4%)
81 (4%)
2,051
482(24%)
Medium businesses 605(29%)
Large businesses 964(47%)
Small businesses
Jobs supported
1,087(53%)
3. ECONOMIC IMPACT OF THALES’S AUSTRALIAN SUPPLIER SPENDING
Large businesses includes businesses with 200 employees or more Medium businesses includes businesses with 20-199 employees Small businesses includes businesses with less than 20 employees
Canberra
Sydney Olympic Park
Mulwala/Benalla
Rydalmere
Bendigo
West Leaderville &Rockingham
Garden Island
Melbourne
Eagle Farm
Darwin
Lithgow & Orchard Hills
Newcastle
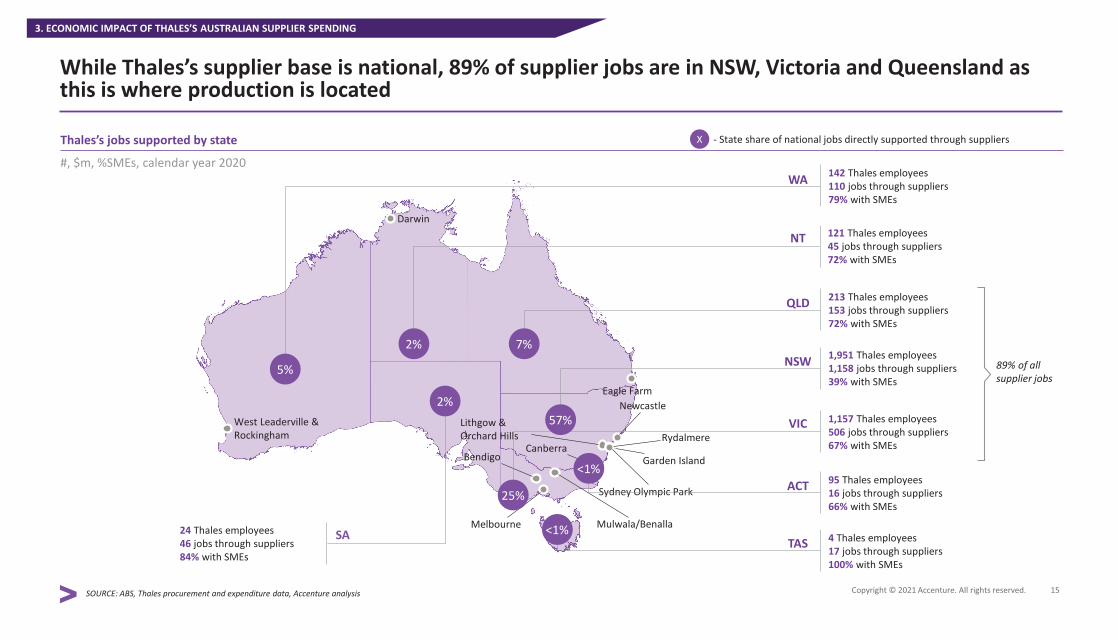
While Thales’s supplier base is national, 89% of supplier jobs are in NSW, Victoria and Queensland as this is where production is located
SOURCE: ABS, Thales procurement and expenditure data, Accenture analysis
#, $m, %SMEs, calendar year 2020
Thales’s jobs supported by state X - State share of national jobs directly supported through suppliers
4 Thales employees17 jobs through suppliers100% with SMEs
95 Thales employees16 jobs through suppliers66% with SMEs
1,157 Thales employees506 jobs through suppliers67% with SMEs
1,951 Thales employees1,158 jobs through suppliers39% with SMEs
TAS
ACT
VIC
<1%
213 Thales employees153 jobs through suppliers72% with SMEs
121 Thales employees45 jobs through suppliers72% with SMEs
142 Thales employees110 jobs through suppliers79% with SMEs
NSW
QLD
NT
WA
SA
<1%
57%
25%
2%
7%2%
24 Thales employees46 jobs through suppliers84% with SMEs
5%
3. ECONOMIC IMPACT OF THALES’S AUSTRALIAN SUPPLIER SPENDING
89% of all supplier jobs

Thales sites have significant local economic impact: a significant proportion of suppliers, spending and jobs occur in the same locality as a Thales site
SOURCE: ABS, Thales procurement and expenditure data, Accenture analysis
#, calendar year 2020
Thales’s suppliers
$m, calendar year 2020
Thales’s spending with suppliers
#, calendar year 2020
Thales’s jobs supported
1,841
Local to a Thales site
509(28%)
1,332(72%)
Not local to a Thales site
Suppliers
3. ECONOMIC IMPACT OF THALES’S AUSTRALIAN SUPPLIER SPENDING
A supplier is local to a Thales site if it is in the same Commonwealth Electoral Division as one of the 12 major Thales sites.
$218m(33%)
Spending
$439m(67%)
$657m
693(34%)
Jobs supported
1,358(66%)
2,051

01Thales makes a significant investment in Australian businesses with spending of $657m on Australian suppliers in 2020
02 In 2020, Thales had 1,841 Australian suppliers, of which 82%, or more than 1,500, were SMEs
03Thales’s spending directly supported 2,051 jobs in Australian suppliers in 2020, making a strong contribution to local businesses and communities
Contents
04 Thales’s major manufacturing sites in Australia have a significant impact on local economies and jobs
05 Appendix: Methodology

The Garden Island site in NSW houses the largest vessel repair and maintenance graving dock in the Southern Hemisphere
4. MAJOR SITE CASE STUDIES: GARDEN ISLAND
Thales’s Garden Island site provides ship support, sustainment and lifecycle management for the Royal Australian Navy. Thales has operated services at the Garden Island Naval base since 1999. At this site, Thales also repairs and maintains a number of commercial vessels such as cruise ships and ferries.
The Garden Island Naval Dockyard is well-equipped with vessel repair and maintenance infrastructure, including a 65-tonne capacity fixed dockside crane, electricity sub-stations and dry dock civil infrastructure. The Garden Island Naval Dockyard also houses the Captain Cook Graving Dock, the largest ship repair and maintenance graving dock in the Southern Hemisphere.
Suppliers
$125m spending with Australian suppliers$74m (59%) of which spent with SMEs
In 2020, this site contracted Australian suppliers to deliver $125m in goods and services as summarised below:
Jobs
433 employed directly by Thales413 supplier jobs directly supported by the Garden Island site
NOTE: See the appendix for the methodology used to determine the economic impact of each Thales site.SOURCE: ABS, Thales procurement and expenditure data, Accenture analysis

The Bendigo site is used to manufacture Hawkei and Bushmaster Protected Mobility Vehicles (PMVs)
4. MAJOR SITE CASE STUDIES: BENDIGO
NOTE: See the appendix for the methodology used to determine the economic impact of each Thales site.SOURCE: ABS, Thales procurement and expenditure data, Accenture analysis
317 employed directly by Thales360 supplier jobs directly supported by the Bendigo site
JobsSuppliers
$136m spending with Australian suppliers$92m (67%) of which spent with SMEs
In 2020, this site contracted Australian suppliers to deliver $136m in goods and services as summarised below:
Thales’s Bendigo site houses Thales’s Protected Vehicle Centre of Excellence encompassing the design, engineering and manufacture of the world’s most advanced Protected Vehicles, the Bushmaster and Hawkei.
Hawkei is now in full rate production and achieved Initial Operating Capability (IOC) with the Australian Army in early 2021. The manufacture of Hawkei PMVs supports over 300 jobs at Thales’s Bendigo site, including engineers, fabricators and trades.
In 2020, Thales’s Bendigo site won a contract worth over $70m to produce 43 Bushmaster PMVs for the New Zealand Army. More than 1200 Bushmasters have been manufactured at the Bendigo site for the Australian Army and export customers.
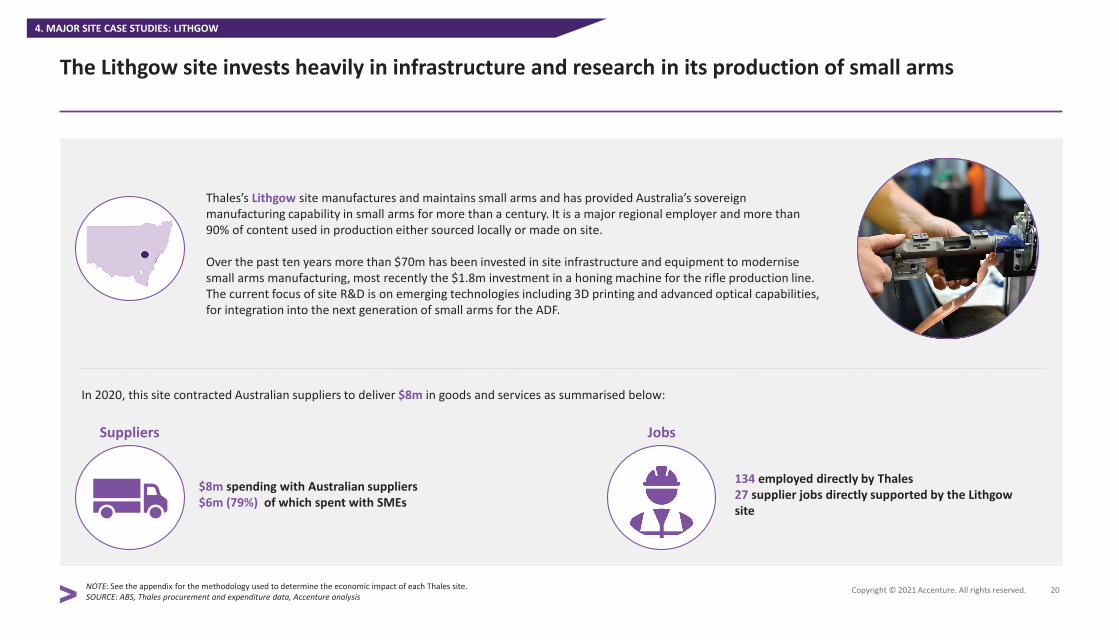
The Lithgow site invests heavily in infrastructure and research in its production of small arms
4. MAJOR SITE CASE STUDIES: LITHGOW
NOTE: See the appendix for the methodology used to determine the economic impact of each Thales site.SOURCE: ABS, Thales procurement and expenditure data, Accenture analysis
Thales’s Lithgow site manufactures and maintains small arms and has provided Australia’s sovereign manufacturing capability in small arms for more than a century. It is a major regional employer and more than 90% of content used in production either sourced locally or made on site.
Over the past ten years more than $70m has been invested in site infrastructure and equipment to modernisesmall arms manufacturing, most recently the $1.8m investment in a honing machine for the rifle production line. The current focus of site R&D is on emerging technologies including 3D printing and advanced optical capabilities, for integration into the next generation of small arms for the ADF.
134 employed directly by Thales27 supplier jobs directly supported by the Lithgow site
JobsSuppliers
$8m spending with Australian suppliers$6m (79%) of which spent with SMEs
In 2020, this site contracted Australian suppliers to deliver $8m in goods and services as summarised below:

The Rydalmere site in western Sydney delivers sovereign industrial capability in sonar systems and mine countermeasures
4. MAJOR SITE CASE STUDIES: RYDALMERE
NOTE: See the appendix for the methodology used to determine the economic impact of each Thales site.SOURCE: ABS, Thales procurement and expenditure data, Accenture analysis
Thales’s Rydalmere site is involved in a variety of projects including the design, manufacture and export of submarine sonar systems, anti-submarine warfare systems, mine countermeasures, training and simulation, secure communication and ground transportation. In 2020, Thales signed a $23.7m contract with the Australian Government to deliver enhanced sonars for Collins Class Submarines. This project is expected to support approximately 30 jobs at Thales’s Rydalmere site.
The Rydalmere site is also heavily involved in railway digitalisation and infrastructure projects. This site has developed signalling and communications systems for the Sydney Metro Northwest project and the Parramatta Light Rail project.
515 employed directly by Thales171 supplier jobs directly supported by the Rydalmere site
JobsSuppliers
$55m spending with Australian suppliers$33m (60%) of which spent with SMEs
In 2020, this site contracted Australian suppliers to deliver $55m in goods and services as summarised below:
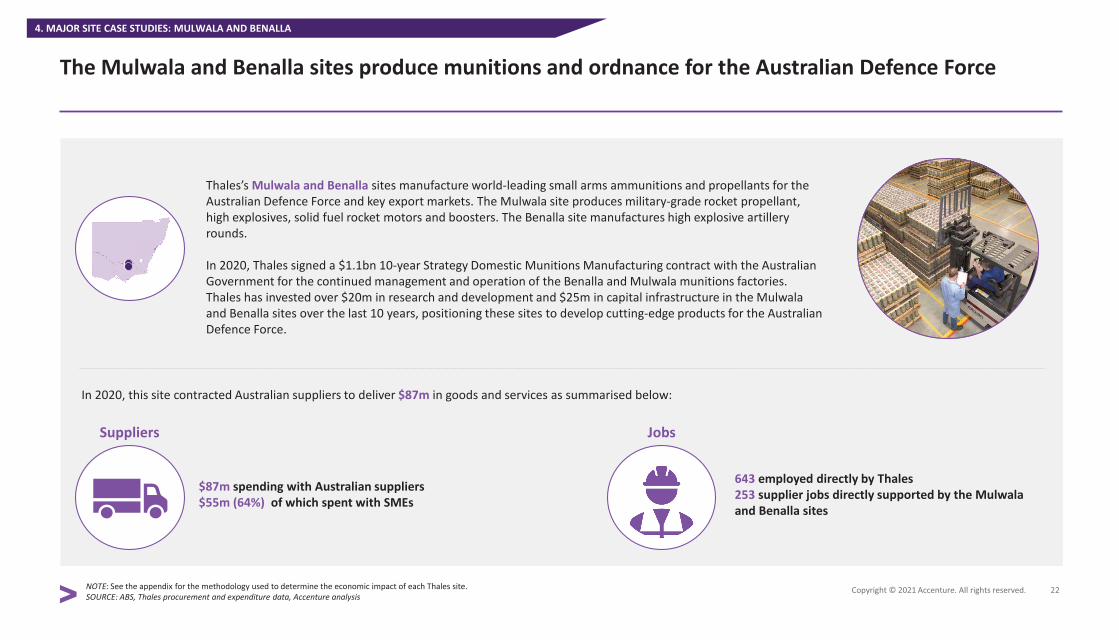
The Mulwala and Benalla sites produce munitions and ordnance for the Australian Defence Force
4. MAJOR SITE CASE STUDIES: MULWALA AND BENALLA
Thales’s Mulwala and Benalla sites manufacture world-leading small arms ammunitions and propellants for the Australian Defence Force and key export markets. The Mulwala site produces military-grade rocket propellant, high explosives, solid fuel rocket motors and boosters. The Benalla site manufactures high explosive artillery rounds.
In 2020, Thales signed a $1.1bn 10-year Strategy Domestic Munitions Manufacturing contract with the Australian Government for the continued management and operation of the Benalla and Mulwala munitions factories. Thales has invested over $20m in research and development and $25m in capital infrastructure in the Mulwalaand Benalla sites over the last 10 years, positioning these sites to develop cutting-edge products for the Australian Defence Force.
643 employed directly by Thales253 supplier jobs directly supported by the Mulwala and Benalla sites
JobsSuppliers
$87m spending with Australian suppliers$55m (64%) of which spent with SMEs
In 2020, this site contracted Australian suppliers to deliver $87m in goods and services as summarised below:
NOTE: See the appendix for the methodology used to determine the economic impact of each Thales site.SOURCE: ABS, Thales procurement and expenditure data, Accenture analysis
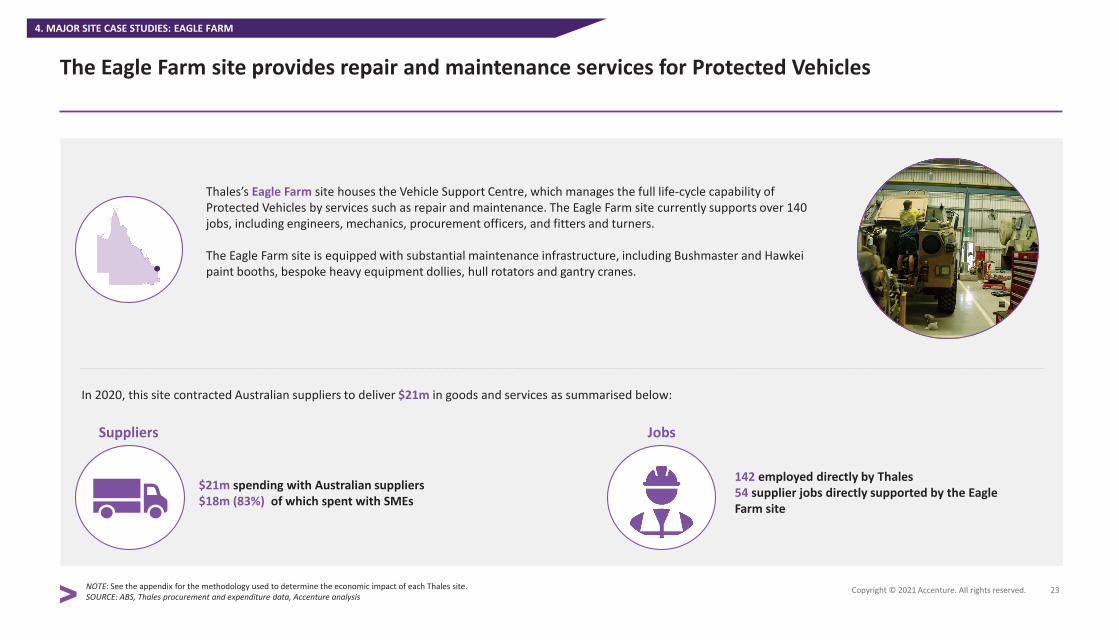
Thales’s Eagle Farm site houses the Vehicle Support Centre, which manages the full life-cycle capability of Protected Vehicles by services such as repair and maintenance. The Eagle Farm site currently supports over 140 jobs, including engineers, mechanics, procurement officers, and fitters and turners.
The Eagle Farm site is equipped with substantial maintenance infrastructure, including Bushmaster and Hawkeipaint booths, bespoke heavy equipment dollies, hull rotators and gantry cranes.
Suppliers
$21m spending with Australian suppliers$18m (83%) of which spent with SMEs
In 2020, this site contracted Australian suppliers to deliver $21m in goods and services as summarised below:
NOTE: See the appendix for the methodology used to determine the economic impact of each Thales site.SOURCE: ABS, Thales procurement and expenditure data, Accenture analysis
The Eagle Farm site provides repair and maintenance services for Protected Vehicles
4. MAJOR SITE CASE STUDIES: EAGLE FARM
142 employed directly by Thales54 supplier jobs directly supported by the Eagle Farm site
Jobs

01Thales makes a significant investment in Australian businesses with spending of $657m on Australian suppliers in 2020
02 In 2020, Thales had 1,841 Australian suppliers, of which 82%, or more than 1,500, were SMEs
03Thales’s spending directly supported 2,051 jobs in Australian suppliers in 2020, making a strong contribution to local businesses and communities
Contents
04 Thales’s major manufacturing sites in Australia have a significant impact on local economies and jobs
Appendix: Methodology05
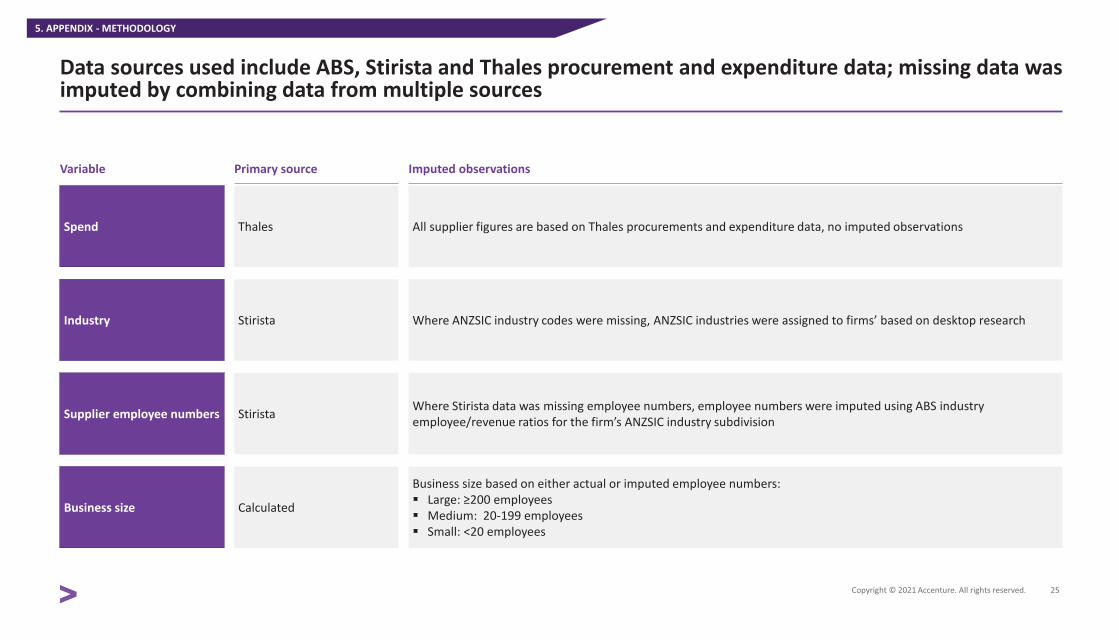
Data sources used include ABS, Stirista and Thales procurement and expenditure data; missing data was imputed by combining data from multiple sources
Variable Primary source
Industry Stirista Where ANZSIC industry codes were missing, ANZSIC industries were assigned to firms’ based on desktop research
Supplier employee numbers Stirista Where Stirista data was missing employee numbers, employee numbers were imputed using ABS industry employee/revenue ratios for the firm’s ANZSIC industry subdivision
Business size Calculated
Business size based on either actual or imputed employee numbers: Large: ≥200 employees Medium: 20-199 employees Small: <20 employees
Imputed observations
5. APPENDIX - METHODOLOGY
Spend Thales All supplier figures are based on Thales procurements and expenditure data, no imputed observations

We estimated the direct employment impact from Thales’s procurement spending and calculated the economic impact attributable to each site
5. APPENDIX - METHODOLOGY
Jobs supported
These are jobs with Thales’s direct suppliers
Calculation
Calculated as:
# Jobs supported per supplier =$ spend by Thales
$ revenue per employee ratio for supplierʹs industry (ABS)
1. Where ANZSIC data is missing, the average revenue per employee ratio for known Thales suppliers is used
Jobs and spending attributable to each Thales site (case studies)
1. Where the Thales delivery site for a particular transaction was known, the associated spend and jobs directly supported were attributed to the identified Thales site
2. Where the Thales delivery site for a particular transaction was not known, the associated spend and jobs directly supported were apportioned to sites based on the business unit associated with the transaction and Thales employment data
Variable

DisclaimerThis document is intended for general informational purposes only. The analysis in this report was commissioned by Thales and prepared by Accenture on behalf of Thales.
Views and opinions expressed in this document are based on Accenture’s knowledge and understanding of its area of business, markets and technology. Accenture does not provide medical, legal, regulatory, audit, or tax advice, and this document does not constitute advice of any nature. While the information in this document has been prepared in good faith, Accenture disclaims, to the fullest extent permitted by applicable law, any and all liability for the accuracy and completeness of the information in this document and for any acts or omissions made based on such information. Opinions expressed herein are subject to change without notice.
No part of this document may be reproduced in any manner without the written permission of Accenture. This document may make references to third party names, trademarks or copyrights that may be owned by others. Any third-party names, trademarks or copyrights contained in this document are the property of their respective owners.
Copyright© 2021 Accenture. All rights reserved. Accenture and its logo are trademarks of Accenture.
About AccentureAccenture is a global professional services company with leading capabilities in digital, cloud and security. Combining unmatched experience and specialized skills across more than 40 industries, we offer Strategy and Consulting, Interactive, Technology and Operations services — all powered by the world’s largest network of Advanced Technology and Intelligent Operations centers. Our 569,000 people deliver on the promise of technology and human ingenuity every day, serving clients in more than 120 countries. We embrace the power of change to create value and shared success for our clients, people, shareholders, partners and communities.
Visit us at www.accenture.com