Thailand ICT Indicators 2005
81
Electronic • Computing • Telecommunication • Information • Technologies Policy and Legal Development Division National Electronics and Computer Technology Center National Science and Technology Development Agency
-
Upload
national-science-and-technology-development-agency-nstda-thailand -
Category
Technology
-
view
283 -
download
0
description
Thailand ICT Indicators 2005
Transcript of Thailand ICT Indicators 2005

Electronic • Computing • Telecommunication • Information • Technologies
http://www.nectec.or.th/pld/e-mail: [email protected]
Policy and Legal Development Division
National Electronics and Computer Technology Center
National Science and Technology Development Agency
Ministry of Science and Technology
73/1 NSTDA Building, RamaVI Rd., Ratchathewi,
Bangkok 10400, THAILAND.
Tel. +66 (0)2-644-8150 ext. 620, 621
Fax. +66 (0)2-644-6653ISBN 974-229-709-6
Policy and Legal Development DivisionNational Electronics and Computer Technology Center
National Science and Technology Development Agency
Thailand ICT Indicators 2004
2
Pric
e 12
0 Ba
ht

Thailand ICT Indicators 2005
February, 2005

Thailand ICT Indicators 2005February 2005
ISBN : 974-229-709-63,000 issues
All rights reserved, as of 2005, under the copyright Act B.E. 2537(1994), by National Electronics and Computer Technology CenterNo part of this book may be copied, reproduced or alteredwithout the written permission of the copyright owner.
Copyright ©2005 by:National Electronics and Computer Technology CenterNational Science and Technology Development AgencyMinistry of Science and Technology
Published by:
National Electronics and Computer Technology CenterNational Science and Technology Development AgencyMinistry of Science and Technology73/1 NSTDA Building, Rama VI Rd., Ratchathewi,Bangkok 10400, THAILAND
Tel. +66-2-644-8150 ext. 620, 621 Fax. +66-2-644-6653e-mail: [email protected]: http://www.nectec.or.th/pld/

Content
LLLLList of Figures ...................................................................... 4
LLLLList of Tables ........................................................................ 5
IIIIIntroduction ......................................................................... 6
TTTTThailand at a Glance ............................................................. 8
I Broadcasting ........................................................... 9
II Computer Usage .................................................... 15
III Telecommunications ............................................... 17
IV Internet ................................................................ 26
V e-Commerce .......................................................... 39
VI ICT Market and Industry ........................................ 49
VII ICT in Government ................................................ 58
VIII ICT Human Resource ............................................. 68
IX Research and Development .................................... 72
List of Contributors ............................................................. 78
List of Abbreviations ........................................................... 79

List of FiguresList of FiguresList of FiguresList of FiguresList of FiguresFigure 1.1 Percentage of Households with Television/Radio ................................................ 10
Figure 1.2 Percentage of Population Listening to Radio and Watching Television byLevel of Educational Attainment (2003) ............................................................ 12
Figure 2.1 Percentage of Business Establishments with Computers (2003) .......................... 14Figure 3.1 Number of Telephone Lines (1999-2004) .......................................................... 18Figure 3.2 Number of Fixed Lines per 100 Inhabitants (1999-2004) .................................... 19Figure 3.3 Number of Fixed Lines per 100 Inhabitants by Location (1999-2004) .................. 20Figure 3.4 Number of Mobile Users (2000-2004) ............................................................... 21Figure 3.5 Number of Mobile Users per 100 Inhabitants by Location (2003) ........................ 21Figure 3.6 Market Share of Mobile Phones by System and Service Provider (2004) .............. 22Figure 3.7 International Telephone Calls (1999-2003) ........................................................ 23Figure 3.8 Number of Telex Services (Outgoing) (1999-2003) ............................................ 24Figure 3.9 Number of Domestic Mails Received (1999-2003) .............................................. 25Figure 4.1 Number of Internet Users (1998-2004) ............................................................. 27Figure 4.2 Internet Users: Bangkok vs Others (2001-2004) ................................................ 27Figure 4.3 Internet Users by Gender (2001-2004) ............................................................. 28Figure 4.4 Internet Users by Age (2004) .......................................................................... 29Figure 4.5 Mode of Access to the Internet (2003) ............................................................. 30Figure 4.6 Average Online Time per User (1999-2003) ...................................................... 31Figure 4.7 Top Ten Internet Activities (2003) .................................................................... 32Figure 4.8 Thailand Domestic Internet Traffic Volume (1998-2004) ..................................... 34Figure 4.9 Total Domestic Exchange Bandwidth (End of Period) (1998-2004) ...................... 34Figure 4.10 International Internet Bandwidth (1998-2004) .................................................. 35Figure 4.11 Distribution of .th Domain Names (2004) .......................................................... 36Figure 4.12 Virus Distribution during December 2003 to November 2004 .............................. 38Figure 5.1 Percentage of Establishments with ICT by Region (2003) ................................... 40
Figure 5.2 Percentage of Establishments with ICT by Size (2003) ....................................... 40
Figure 5.3 Percentage of Establishments with Computers by Economic Activities (2003) ...... 41Figure 5.4 Percentage of Establishments with Internet Access by Economic
Activities (2003) .............................................................................................. 42Figure 5.5 Percentage of Establishments with Web Site by Economic Activities (2003) ......... 42Figure 5.6 Registered e-Commerce Entrepreneurs by Registration Type (2004) ................... 44Figure 5.7 Registered e-Commerce Entrepreneurs by Location (2004) ................................ 44Figure 5.8 Registered e-Commerce Web Sites by Domain Name (2004) .............................. 45Figure 5.9 Internet Purchase Experience (1999-2003) ....................................................... 46Figure 5.10 Reasons Against Internet Purchase (2003) ........................................................ 46Figure 5.11 Online Spending (2003) ................................................................................... 47Figure 5.12 Value of Online Trading (2003-2004) ................................................................ 47Figure 5.13 Number of Online Trading Customers (2000-2004) ............................................ 48Figure 5.14 Value and Volume of Internet Banking Transaction (2000-2004) ......................... 48Figure 6.1 Thailand IT Market by Category (1997-2004) .................................................... 52

Figure 6.2 Software Industry Spending by Sector (2002-2003) ........................................... 54Figure 6.3 Software Piracy Rate in Thailand (1994-2002) ................................................... 55Figure 6.4 Trade in ICT Goods (1999-2004) ...................................................................... 57Figure 7.1 Government Budget on Computer Equipment (1998-2004) ................................ 59Figure 7.2 Number of Government Web Sites by Type of Online Services (2004) ................. 61Figure 7.3 Basic Information on Government Web Sites (2004) .......................................... 62Figure 7.4 Type of Interaction Feature on the Government Web Sites (2004) ...................... 63Figure 7.5 Type of Transaction Feature on the Government Web Sites (2004) ..................... 64Figure 7.6 Security System on the Government Web Sites (2004) ....................................... 65Figure 7.7 Main Assessment of the Government Web Sites (2004) ...................................... 66Figure 7.8 Value of Government e-Auction (2002-2004) ..................................................... 67Figure 8.1 Number of Science and Technology Graduates VS Social Science
Graduates (1999-2001) ................................................................................... 69Figure 8.2 Number of Workforce Attended and Completed IT Training of the
Ministry of Labour (1998-2003) ........................................................................ 71Figure 9.1 The Ratio of ICT R&D Expenditures by Sector (1996-2001) ................................ 74Figure 9.2 R&D Personnel in ICT Field (1996-2001) ........................................................... 76
Figure 9.3 ICT R&D Researchers by Sector (2001) ............................................................ 77
List of TableList of TableList of TableList of TableList of TableTable 1.1 Percentage of Households with Television/Radio by Region (2003) ..................... 11
Table 2.1 Percentage of Households with Computers (2001-2004) .................................... 14
Table 2.2 The Ratio of Business Establishments with Computers by Size of Firms (2003) ... 15
Table 2.3 Students to Computer Ratio (2004) .................................................................. 16
Table 4.1 Internet Penetration by Location (2001-2004) ................................................... 28
Table 4.2 12 Top Ten Most Visited Web Sites ................................................................... 33
Table 4.3 Distribution of .th Domain Names (1997-2004) ................................................. 35
Table 4.4 Report of Virus Infected e-mails during December 2003 to November 2004
Table 5.1 e-Commerce Transaction Value (2003) ............................................................. 45
Table 6.1 Thailand IT Market by Category (1997-2004) ................................................... 51
Table 6.2 Thailand IT Market by Industry Sector (1997-2004) ........................................... 53
Table 6.3 Source of Software Industry Revenue by Sector (2002-2003) ............................. 55
Table 7.1 Budget Approved for Computer in Fiscal Year 2005 ............................................ 59
Table 8.1 Gross Enrollment Ratio .................................................................................... 68
Table 8.2 ICT Workforce (2001-2003) ............................................................................. 70
Table 9.1 National R&D Expenditures (1991-2001) ........................................................... 72
Table 9.2 Budget Allocation for Research and Development by Field of Research
(2001-2002) ................................................................................................... 73
Table 9.3 ICT R&D Expenditures by Sector (1996-2001) ................................................... 74
Table 9.4 R&D Personnel Classified by Occupation and Field of Research (2001) ................ 75

IntroductionWhen our first endeavor in gathering ICT-related statistics, Thailand ICT
Indicators Series I, was published in 2003, we did not anticipate that our book wouldstir such a huge demand. As it turned out, we received positive and enthusiasticresponses as well as comments locally and internationally. This reaffirms our beliefthat there is a need for a country to have systematic mechanisms in collecting as wellas disseminating ICT indicators on a continual basis.
ICT Indicators are critical to the understanding of the status of ICT developmentin a country. They can also serve as benchmarking tools to allow relative assessmentof development progress in comparison to others. Furthermore, they can be used asimpact assessment tools to monitor ICT roles in economic and social development.Without relevant statistics, we cannot conduct objective assessment on the ICTsituation of the country. During the past two years (2003 - 2004), our research teamat the National Electronics and Computer Technology Center (NECTEC), Ministry ofScience and Technology, has worked closely with the National Statistical Office (NSO),Ministry of Information and Communication Technology, in an endeavor to study,collect, and analyze several ICT-related statistics from many agencies in order to comeup with a list of core ICT indicators to be gathered on a continual basis.
In gathering these ICT-related statistics, serveral approaches and methodolo-gies were used. On the demand side, the NSO and NECTEC developed surveyquestionnaires related to ICT ownership and usage in 2001. These questionnaireswere used as supplementary and were integrated into regular surveys, such ashousehold and business establishment surveys. In early 2004, however, the NSOlaunched full scale IT surveys on household and business establishments, aiming toproduce several baseline indicators. On the supply side, the statistics used are mainlyfrom telecommunication operators as well as business associations such as ATCI (theAssociation of Thai Computer Industry).
Additionally, NECTEC has initiated a few other mechanisms to generate a set ofICT-related statistics which can be used as indicators to monitor the status of ThailandICT development. We would like to highlight a few examples as follows:
• NECTEC conducts an online survey of Internet users on an annual basis tostudy their profiles. The questionnaire is posted on NECTEC web site and atleast five more popular ones around September-October each year. Thenumber of respondents has been increasing every year, up to more than15,000 for the past two years.
• To complement with Thailand initiatives on e-Government, NECTEC haslaunched a readiness survey on government web-based services, wherebygovernment agencies were asked to assess their ability to provide differenttypes and levels of e-Services via the designated web site.

• NECTEC has developed an advanced web statistics service called “Truehits”(http://truehits.net) which receives cooperation from more than 7,000 website owners. The statistics generated by ”Truehits” can be used to monitorInternet users behavior-where and when they visit the web site. Throughthis, we are able to speculate the kind of web sites which were mostfrequently visited.
Considering the statistics presented in this book, there are notably threeapproaches in their selection. Firstly, we add the latest figures available to update thedata presented last year, such as the telephone penetration. Secondly, we include thenewly released figures, such as the ICT penetration among business establishments.Lastly, we decide to leave out figures, derived from a one-off survey, which werepresented in the previous series. For those who are interested in the first series, thesoft copy is available on our web site (www.nectec.or.th/pld/document/indicators2003.pdf).
Well, there is a common saying “a picture paints a thousand words”. Webelieve figures and statistics hold the same truth. The infrastructure-related statisticsshow the prevalent digital divide in Thailand. Notwithstanding the governmentintervention to bridge the gap, it appears that people who live, learn, and work in therural areas are socially and economically disadvantage.
The intensity and sophistication of usage, however, are more difficult toevaluate. Included here are statistics on, for example, the average online time, thekind of activities people conduct on the Internet, and the type of web sites frequentlyvisited. The rate to which ICT was integrated into the Thai economy can also beestimated from e-Commerce value as well as government e-Procurement. On theother side of the coin, one might look at the size of ICT market as a reflection ofintensity.
In addition, we put forward the set of indicators on fundamental components toICT development and knowledge creation. These are research and development andhuman resources. From the statistics presented, it is obvious that Thailand wouldneed to invest tremendously in these areas as she moves towards the InformationSociety.
To obtain the data for all indicators requires a titanic coordination effort. In thisregards, we would like to thank all agencies, whose names were presented through-out the book, who make our tasks much easier. The National Statistical Office, Ministryof Information and Communication Technology, with whom we have jointly worked ona project to develop national ICT indicators since 2003, deserves our special apprecia-tion.
We hope that this second series of ICT indicators is beneficial to all readers-being policy-makers, government planning agencies, market analysts, entrepreneurs,academia, researchers, and general public. We realize that this book is anotherstepping-stone on a long journey. It will be some time before we can reach acomplete database on ICT statistics. NECTEC is proud to be one of the maincontributors to materialize that goal in the future.

Thailand ICT Indicators 20058
Thailand at a GlanceThailand at a GlanceThailand at a GlanceThailand at a GlanceThailand at a Glance
Sources: (1) - (6) and (11): Bank of Thailand (BOT)(7) - (10): The National Statistical Office (NSO)(12) - (22): Office of the National Economic and Social Development Board (NESDB)
1 Geography Land Area 513,115 sq. km.
2 Neighboring Countries Myanmar - west and northLao P.D.R. - north and northeastCambodia - southeastMalaysia - south
3 Administration 76 provinces, each subdivided into “amphoe”(district), “tambon” (sub-district) and “muban” (village)
4 Capital Bangkok
5 Language Thai
6 Head of State His Majesty King Bhumibol Adulyadej(Rama IX of the Chakri Dynasty)
1999 1999 1999 1999 1999 2000 2000 2000 2000 2000 2001 2002 2001 2002 2001 2002 2001 2002 2001 2002 2003 2003 2003 2003 2003
7 Population, at year-end (Millions) 61.78 62.41 62.94 63.46 64.01
8 Literacy Rate (%) - 90.8 - - -
9 Labour Force (Millions) 32.72 33.22 33.92 34.25 34.48
10 Unemployed Persons 4.2 3.6 3.2 2.2 2.0
(as % of labour force)
11 Minimum Wage (Baht/day): 162 162 165 169 170Bangkok, Samut Prakan,Nakorn Pathom, andPathum Thani
12 GDP at Current Market Prices(Billion US Dollars) 122.5 122.6 115.5 126.9 142.9
13 Agriculture (as % of GDP) 9.4 9.0 9.1 9.4 9.8
14 Non-agriculture (as % of GDP) 90.6 91.0 90.9 90.6 90.2
15 Per capita GDP (US Dollars) 1,985 1,962 1,834 1,999 2,196
16 Exports (Billion US Dollars) 56.8 67.9 63.1 66.1 78.4
17 Exports (% change) 7.4 19.5 -7.1 4.8 18.6
18 Exports (as % of GDP) 46.3 55.4 54.7 52.1 54.8
19 Import (Billion US Dollars) 47.5 62.4 60.6 63.4 74.2
20 Import (% change) 16.9 31.3 -3.0 4.6 17.1
21 Import (as % of GDP) 38.7 51.0 52.5 50.0 51.8
22 Exchange Rate (Baht/1 USD) 37.8 40.2 44.5 43.0 41.5

National Electronics and Computer Technology Center9
BroadcastingIIIIIn the wave of new information and communication technologies, particularly
the Internet, “broadcasting” seems to be a forgotten sphere. However, in the recentWorld Summit on Information Society, we witnessed the movement of the media toaccentuate their roles in shaping the Information Society as well as in information andknowledge creation and propagation in the 21st century.
The pace of diffusion of broadcasting technologies, often been comparedunfavorably with the rapid diffusion of the Internet, takes a long time since its firstinception to become adopted in most households. Nevertheless, the penetration oftraditional media such as television and radio in most, if not all, developing countries,covers a wide audience--geographically as well as socially.
In this chapter, we scrutinize the diffusion of television and radio in the Thaisociety, using the data from the Mass Media survey, which is conducted every five yearby the National Statistical Office. Television and radio have a much higher penetrationrate when compared to the Internet (discussed in chapter VI). However, there was areverse trend between television and radio. In 1979, merely 17% of householdsowned a television, but a positive growth has been observed since, with the figurereached 92% in 2003. The household ownership of radio, on the other hand, declinesfrom 79% in 1979 to 51% in 2003.
I

Thailand ICT Indicators 200510
Figure 1.1 Percentage of Households with Television/RadioFigure 1.1 Percentage of Households with Television/RadioFigure 1.1 Percentage of Households with Television/RadioFigure 1.1 Percentage of Households with Television/RadioFigure 1.1 Percentage of Households with Television/Radio
Source: Mass Media Survey, National Statistical Office (NSO)
0
10
20
30
40
50
60
Television
’79
Radio
’84 ’89 ’94 ’03Year
70
80
17
79
33
90
100
75
50
73 75 74
92
51
Considering the geographical breakdown, there is an equal access to televisionamong regions, with minor differences. The digital divide, between Bangkok and therest of the country, seems to be more apparent with the diffusion of radio (Table 1.1).
% of households

National Electronics and Computer Technology Center11
Table 1.1 Percentage of Households withTable 1.1 Percentage of Households withTable 1.1 Percentage of Households withTable 1.1 Percentage of Households withTable 1.1 Percentage of Households withTelevision/Radio by Region (2003)Television/Radio by Region (2003)Television/Radio by Region (2003)Television/Radio by Region (2003)Television/Radio by Region (2003)
2003 2003 2003 2003 2003
Households with television sets
Bangkok 94.2
Central 93.3
North 91.0
Northeast 93.1
South 90.0
Households with radio sets
Bangkok 63.7
Central 48.4
North 57.1
Northeast 44.3
South 51.3
Source: National Statistical Office (NSO)
The survey further reveals the usage pattern. Nearly all population with theage of 6 years and over (94.5%) watch televisions, while less than half (42.8%) listensto the radio. Factors such as educational level, gender and occupation, were alsoexamined whether they are influential to the usage pattern. For instance, Figure 1.2shows that, for population who are 15 years old and over, educational level has littleeffect on television viewing, but greatly impinge on radio use. In the latter case, therewas a reverse pattern between those who are least educated and most educated.

Thailand ICT Indicators 200512
For television, the most popular program is entertainment (51.6%), followedby news (47.2%), general knowledge or documentary (0.9%), and others (0.3%). Atpresent, there are six free TV channels (with commercial advertisement broadcasted)in Thailand. For cable TV, subscribers for United Broadcasting Corporation (UBC), themain operator in the market, reached 439,928 in the second quarter of 20041.
Figure 1.2 Percentage of Population Listening to Radio andFigure 1.2 Percentage of Population Listening to Radio andFigure 1.2 Percentage of Population Listening to Radio andFigure 1.2 Percentage of Population Listening to Radio andFigure 1.2 Percentage of Population Listening to Radio andWatching Television by Level of Educational AttainmentWatching Television by Level of Educational AttainmentWatching Television by Level of Educational AttainmentWatching Television by Level of Educational AttainmentWatching Television by Level of Educational Attainment
(2003)(2003)(2003)(2003)(2003)
% of population
0
20
40
60
80
100
Primary or lower Lower secondary Upper secondary Higher education
TV viewer
TV non-viewer
Radio listener
Radio non-listener
61.2
Level ofeducationattainment
91.6
8.4
97.4 97.3 98.8
2.6 2.7 1.2
38.8 55.157.7
62.0
38.042.344.9
Source: National Statistical Office (NSO)
1(ubctv.com/Aboutubc/thaiSubScriberNo_List_front_th.aspx)

National Electronics and Computer Technology Center13
Computer UsageIIIIIn 2003, the Ministry of Information and Communication Technology (MICT)
launched a major initiative to make widely available “low-cost” PCs to the generalpublic as well as civil servants. The PCs distributed through this project was bundledwith the open-source software, i.e., Office TLE, which has equivalent functions to theMicrosoft Office packages. Shortly after the launch of the project, Microsoft hadannounced a drastic price reduction, to approximately US$ 35, for an individual userwho purchased a PC under this project. Moreover, a “low-interest” fund was also madeavailable for those in need. This fairly “well-designed” package has generated muchinterest from those who were considering buying a home-use PC for the first time. Itwas reported that more than 200,000 units were purchased under this program,causing a big jump in the PC penetration rate in Thailand, as seen in Table 2.1.
The rise in the penetration, however, does not only result from the purchase ofPCs under this project alone. What has been observed was that this project has alsoinduced competition in the local PC market. In other words, manufacturers who didnot participate in the project has cut down their price significantly in order to competeand get some marker share.
As a result, the PC penetration in Thailand has risen significantly over the pasttwo years, with the percentage of households with computers arising from 5.1% in2001 to nearly 11% in mid 2004. Nevertheless, the problem of digital divide stillprevails, with household and business establishments in Bangkok having greater accessto computers than those residing outside Bangkok (Table 2.1).
II

Thailand ICT Indicators 200514
Table 2.1 Percentage of Households with ComputersTable 2.1 Percentage of Households with ComputersTable 2.1 Percentage of Households with ComputersTable 2.1 Percentage of Households with ComputersTable 2.1 Percentage of Households with Computers(2001-2004)(2001-2004)(2001-2004)(2001-2004)(2001-2004)
Figure 2.1 Percentage of Business EstablishmentsFigure 2.1 Percentage of Business EstablishmentsFigure 2.1 Percentage of Business EstablishmentsFigure 2.1 Percentage of Business EstablishmentsFigure 2.1 Percentage of Business Establishmentswith Computers (2003)with Computers (2003)with Computers (2003)with Computers (2003)with Computers (2003)
Year Year Year Year Year 20012001200120012001 20032003200320032003 20042004200420042004
Overall 5.1 8.2 11.1
Bangkok 19.8 24 28.1
Central* 5.1 7.5 11.6
North 2.8 6.1 9.0
Northeast 2.0 4.5 6.3
South 2.3 6.1 8.6
Source: Report on the 2004 Information and Communication Technology Survey on BusinessEstablishment
Remarks: *Vicinity includes Pathumthani, Nonthaburi, Samut Prakarn,Samut Sakorn and Nakorn Pathom
Remark: *Exclude Bangkok
Source: Report on the 2001 Survey on Information Technology, NSO
Report on the 2003 Survey on Information Technology, NSO
Report on the Information and Communication Technology Survey (Household) 1st quarter2004, NSO
% of establishments

National Electronics and Computer Technology Center15
The size of firms, classified by the number of employees, is related to theextent to which firms absorb new technology. By and large, the larger the firm is, themore likely it will own and use computer in its business (Table 2.2). In this respect,small and medium enterprises (SMEs), which are fundamental to Thai economy, havenot widely adopted the new technologies. The National ICT Master Plan (2002-2006),therefore, has devised a strategy which aims to increase the use of ICT among SMEs.
Table 2.2 The Ratio of Business Establishments withTable 2.2 The Ratio of Business Establishments withTable 2.2 The Ratio of Business Establishments withTable 2.2 The Ratio of Business Establishments withTable 2.2 The Ratio of Business Establishments with Computers by Size of Firms (2003) Computers by Size of Firms (2003) Computers by Size of Firms (2003) Computers by Size of Firms (2003) Computers by Size of Firms (2003)
Firm SizeFirm SizeFirm SizeFirm SizeFirm Size %%%%%
1-15 employees 10.1
16-25 employees 72.4
26-30 employees 68.7
31-50 employees 78.2
51-200 employees 90.1
more than 200 employees 97.4
Source: National Statistical Office (NSO)
Regarding the use of computers for education, the ratio of students percomputer is rather high. That means computer resources have to be shared by amonglarge number of students (Table 2.3). According to the National ICT for EducationMaster Plan (2004-2006) from Ministry of Education, the number of students sharingone computer in primary schools, secondary schools, and vocational institutionstargeted at 120, 54, and 23 respectively. However, the figures in Table 2.3 show thatsuch targets have already been achieved, especially in primary and secondary schools.

Thailand ICT Indicators 200516
Table 2.3 Students to Computer Ratio (2004)Table 2.3 Students to Computer Ratio (2004)Table 2.3 Students to Computer Ratio (2004)Table 2.3 Students to Computer Ratio (2004)Table 2.3 Students to Computer Ratio (2004)
Source: Office of the Permanent Secretary, Ministry of Education (MOE)
Remarks: *Exclude private universities
Educational Level Number of Number of Number ofEducational Level Number of Number of Number ofEducational Level Number of Number of Number ofEducational Level Number of Number of Number ofEducational Level Number of Number of Number of Students PCs Students Students PCs Students Students PCs Students Students PCs Students Students PCs Students per 1 PC per 1 PC per 1 PC per 1 PC per 1 PC
Primary 6,595,828 73,292 90
Secondary 2,539,657 105,674 24
Vocational 686,737 25,699 27
Higher Education* 645,089 78,290 8
Non-Formal Education 2,342,751 3,311 708
In early 2004, the MICT initiated an “ICT for Children” project. The mainobjective was to increase ICT diffusion in schools, especially those that serve thedeprived areas. Other objectives were to introduce social-engineering measures toincrease ICT awareness and adoption in the community and to establish a scalable andsustainable framework for helping schools nationwide. Under this project, usedcomputers were provided to rural schools. In addition, the ICT skills training wereprovided for both users in schools at all levels and for unskilled or unemployed peoplein the community.

National Electronics and Computer Technology Center17
TelecommunicationsTTTTThe Thai telecommunication sector has just crossed the threshold. After long
awaiting, the National Telecommunications Commission (NTC) was set up in October2004. The market structure of the telecom sector in the absence of NTC remainsunchanged from the year 2003, with the number of operators in both fixed-line andmobile sector the same as in 2003.
Fixed-line service providers include TOT Corporation Public Company Limited,True (previously TelecomAsia Corporation) and TT&T Public Company Limited. Solelyinternational service provider is CAT Telecom Public Company Limited.
Mobile phone service operators are
• Advance Info Service Plc. (AIS): GSM 900-MHz and GSM 1800-MHz mobilephone
• Total Access Communication Plc. (DTAC): Cellular and digital 1800-MHzmobile phone
• TA Orange Company Limited: Cellular and digital 1800-MHz mobile phone
• Thai Mobile Company Limited: 1900-MHz CDMA mobile phone
• Hutchison CAT Wireless Multimedia Ltd.: CDMA mobile phone
• TOT Corporation Plc.: 470-MHz or cellular 470 mobile phone
• CAT Telecom Plc.: cellular AMPS 800 A-Band mobile phone
The growth in telephone penetration has been sluggish over the past couple ofyears, with number of fixed line subscribers increase only slightly. Although thefixed-line penetration in upcountry has been increasing at a greater rate than inBangkok, the digital divide still prevails.
III

Thailand ICT Indicators 200518
Figure 3.1 Number of Telephone Lines (1999-2004)Figure 3.1 Number of Telephone Lines (1999-2004)Figure 3.1 Number of Telephone Lines (1999-2004)Figure 3.1 Number of Telephone Lines (1999-2004)Figure 3.1 Number of Telephone Lines (1999-2004)
Note:Note:Note:Note:Note: All data presented in telecom section from 2002 onwards are collected in thecalendar year. Previous data are in the fiscal year, which is the 12 monthsbeginning October 1 of the year stated.
Source: TOT Corporation Plc. (formerly the Telephone Organization of Thailand)
Remarks: *as of March 2004
5.1 5.5
’99 ’00 ’01 ’02 ’03 ’04*

National Electronics and Computer Technology Center19
Telephone line capacity Fixed line in operation
’99 ’00 ’01 ’02 ’03 ’04*
Year
14
12
10
8
6
4
2
0
Figure 3.2 Number of Fixed Lines per 100 InhabitantsFigure 3.2 Number of Fixed Lines per 100 InhabitantsFigure 3.2 Number of Fixed Lines per 100 InhabitantsFigure 3.2 Number of Fixed Lines per 100 InhabitantsFigure 3.2 Number of Fixed Lines per 100 Inhabitants(1999-2004)(1999-2004)(1999-2004)(1999-2004)(1999-2004)
Lines
12.3
8.1
12.4
8.7
12.5
9.4
12.7
9.9
13.4
9.9
13.5
10.1
Source: TOT Corporation Plc. (formerly the Telephone Organization of Thailand)
Remarks: *as of March 2004

Thailand ICT Indicators 200520
The mobile market experienced an exponential growth in number of users from5.8 million in 2001 to 16.3 million in 2002. The increase from 2002 to 2003, however,was merely half of that. The growth of mobile users in 2004 is expected to remainsluggish as the penetration has reached as high as 36.3%.
A rapid growth of mobile market in the past few years, nonetheless, has not yetsolved the digital divide problem. As Figure 3.5 shows, only 13.3% of population inthe Northeast region have access to a mobile phone, compared to 42.4% of populationin Bangkok and vicinity.
The market is dominated by Advance Info Service Plc. (AIS) with 58.3% share,followed by DTAC 30.3%, Orange 8% and Hutch 2.5%. With regard to the system,900 Mhz gains the highest 58.3%, followed by PCN 1800 (37.9%), CDMA (2.5%),AMPS 800 (0.7%), and 1900 MHz (0.6%) as presented in Figure 3.6.
Figure 3.3 Number of Fixed Lines per 100 InhabitantsFigure 3.3 Number of Fixed Lines per 100 InhabitantsFigure 3.3 Number of Fixed Lines per 100 InhabitantsFigure 3.3 Number of Fixed Lines per 100 InhabitantsFigure 3.3 Number of Fixed Lines per 100 Inhabitantsby Location (1999-2004)by Location (1999-2004)by Location (1999-2004)by Location (1999-2004)by Location (1999-2004)
40
30
20
10
0’99 ’00 ’01 ’02 ’03 ’04**
Year
34.1
4.3 5.0 5.2 5.4 5.5
Source: TOT Corporation Plc. (formerly the Telephone Organization of Thailand)
Remarks: *Vicinity includes Pathumthani, Nonthaburi and Samut Prakarn**as of March 2004
Bangkok and vicinity* The rest of the country
35.738.1
4.7
39.4 38.940.7
50Lines

National Electronics and Computer Technology Center21
Figure 3.5 Number of Mobile Users per 100 InhabitantsFigure 3.5 Number of Mobile Users per 100 InhabitantsFigure 3.5 Number of Mobile Users per 100 InhabitantsFigure 3.5 Number of Mobile Users per 100 InhabitantsFigure 3.5 Number of Mobile Users per 100 Inhabitantsby Location (2003)by Location (2003)by Location (2003)by Location (2003)by Location (2003)
50
40
30
20
10
0Bangkok
and vicinity*
Source: National Statistical Office (NSO)
Remarks: *Vicinity includes Pathumthani, Nonthaburi, Samut Prakarn, Samut Sakhon andNakhon Pathom
Central North Northeast South
42.4
Users per 100 inhabitants
28.8
18.813.3
20.0
Figure 3.4 Number of Mobile Users (2000-2004)Figure 3.4 Number of Mobile Users (2000-2004)Figure 3.4 Number of Mobile Users (2000-2004)Figure 3.4 Number of Mobile Users (2000-2004)Figure 3.4 Number of Mobile Users (2000-2004)
25
20
15
10
5
0’00 ’01 ’02 ’03 Year
Million persons
50
40
30
20
10
0
11.8
4.4
1.4
27.74.6
11.7
4.4
34.1
17.1
4.6
36.3
18.6
Prepaid
Postpaid
% of population
% of population
Source: CAT-Telecom Plc. (formerly the Communications Authority of Thailand)TOT Corporation Plc. (formerly the Telephone Organization of Thailand)
Remarks: *as of March 2004
5.62.70.8
’04*

Thailand ICT Indicators 200522
Mobile Users by System (2004*)Mobile Users by System (2004*)Mobile Users by System (2004*)Mobile Users by System (2004*)Mobile Users by System (2004*)
SystemSystemSystemSystemSystem Number of Users % Number of Users % Number of Users % Number of Users % Number of Users %
900 MHz 13,539,148 58.3
PCN 1800 8,815,356 37.9
CDMA 590,198 2.5
AMPS 800 150,220 0.7
1900 MHz 142,610 0.6
470 MHz 6,176 0
total 23,243,708 100
ServiceServiceServiceServiceService Number of Users Number of Users Number of Users Number of Users Number of Users %%%%%ProviderProviderProviderProviderProvider
Mobile Users by Service Provider (2004*)Mobile Users by Service Provider (2004*)Mobile Users by Service Provider (2004*)Mobile Users by Service Provider (2004*)Mobile Users by Service Provider (2004*)
AIS 13,539,148 58.3
DTAC 7,029,979 30.3
Orange 1,743,384 7.5
Hutch 588,398 2.5
DPC** 192,213 0.8
CAT 1800 0.0
TOT 6176 0.0
Thaimobile 142610 0.6
Total 23,243,708 100.0
Figure 3.6Figure 3.6Figure 3.6Figure 3.6Figure 3.6 Market Share of Mobile Phones Market Share of Mobile Phones Market Share of Mobile Phones Market Share of Mobile Phones Market Share of Mobile Phonesby System and Service Provider (2004)by System and Service Provider (2004)by System and Service Provider (2004)by System and Service Provider (2004)by System and Service Provider (2004)
900 MHZ
58.3AIS58.3
DTAC30.3
ORANGE 7.5
PCN 180037.9
AMPS 800 0.7
CDMA 2.5
1900 MHz 0.6Thai Mobile 0.6
HUTCH 2.5
DPC 0.8
Source: CAT Telecom Plc. (formerly the Communications Authority of Thailand)TOT Corporation Plc. (formerly the Telephone Organization of Thailand)
Remarks: *as of March 2004
** Digital phone Co.,Ltd (DPC) is 98.17% owned by AIS.
Service ProviderService ProviderService ProviderService ProviderService ProviderSystemSystemSystemSystemSystem
**

National Electronics and Computer Technology Center23
Figure 3.7 International Telephone Calls (1999-2003)Figure 3.7 International Telephone Calls (1999-2003)Figure 3.7 International Telephone Calls (1999-2003)Figure 3.7 International Telephone Calls (1999-2003)Figure 3.7 International Telephone Calls (1999-2003)
64.4
’99 ’00 ’02 ’03*
Year50’01
60
70
80
90
100
110
120
Million calls
99.697.7
94.6 96.492.9
105.3
88.5
114.9
96.0
Source: CAT Telecom Plc., (formerly the Communications Authority of Thailand)Remarks: *as of August 13, 2003
Incoming calls Outgoing calls
64.4
Previously, the competition in the telecom sector (fixed-line and mobile) tendsto be on non-price area. Major operators, particularly mobile operators, compete usingproduct differentiation through service quality, advertising and value-added services.However, price competition is now heating up. Fixed-line operators drastically cutdown the price for long distance and international calls, reflecting in an increase in theratio of outgoing calls to incoming calls as seen in Figure 3.7. For mobile, the price,particularly for pre-paid option, went down to as cheap as as one baht per minute.

Thailand ICT Indicators 200524
Figure 3.8 Number of Telex Services (Outgoing)Figure 3.8 Number of Telex Services (Outgoing)Figure 3.8 Number of Telex Services (Outgoing)Figure 3.8 Number of Telex Services (Outgoing)Figure 3.8 Number of Telex Services (Outgoing)(1999-2003)(1999-2003)(1999-2003)(1999-2003)(1999-2003)
Source: CAT Telecom Plc. (formerly the Communication Authority of Thailand)
Remarks: *as of August 13, 2003
Thousand calls
Telex service becomes the latest victim of ICT revolution as the number ofoutgoing calls went down sharply from 268.7 thousands in 1999 to 142.6 thousands in2002. With just one quarter left in 2003, there is no sign of recovery since throughoutthe year only 94.4 thousand calls were made.

National Electronics and Computer Technology Center25
Figure 3.9 Number of Domestic Mails ReceivedFigure 3.9 Number of Domestic Mails ReceivedFigure 3.9 Number of Domestic Mails ReceivedFigure 3.9 Number of Domestic Mails ReceivedFigure 3.9 Number of Domestic Mails Received(1999-2003)(1999-2003)(1999-2003)(1999-2003)(1999-2003)
Source: CAT Telecom Plc., (formerly the Communications Authority of Thailand)
Remarks: *as of August 13, 2003
’99 ’00 ’02 ’03*’01
Ordinary letter-post item Special services Postal parcels
Year0
300
600
900
1,200
1,500
Million items
1,154.41,174.3
113.3 118.9
8.3 8.7
111.7
9.6
108.2
9.896.5
9.4
1,186.6
1,336.7
1,158.2
Although the emergence of ICT and the Internet as new mainstreamcommunication tools has contained the use of telex service, postal service remainsintact with the number of domestic mails received in the past five years constantlyrising. Through three quarters of 2003, 1,158.2 million ordinary letter-post items and9.4 million postal parcels have been delivered to the customers. These figures are wellon course to break a 2002 record which both categories reached a high of 1,336.7 and9.8 million items, respectively.

Thailand ICT Indicators 200526
InternetIIIIInternet is increasingly instrumental to information and knowledge access
in the Thai society. It is also a vital infrastructure for business communication andtransaction. The growth of Internet users is steadily increasing and reachesapproximately 7 million users in 2004, equal to 11.9 users for every 100 population(Figure 4.1).
Internet users are concentrated in Bangkok and other big cities. Nevertheless,the proliferation of Internet users has recently emerged in all regions outside Bangkok(Table 4.1). There is no apparent gender divide in Thailand. Both men and womenhave nearly equal access to the Internet (Figure 4.3).
Another area where digital divide clearly presents is the distribution of usersamong different age group. Population at the age of 15-24 represents more than halfof the Internet users. Elderly population (50 years old and over), on the other hand,represents only 3.2% of Internet users (Figure 4.4).
IV

National Electronics and Computer Technology Center27
Figure 4.2 Internet Users: Bangkok VS Others (2001-2004)Figure 4.2 Internet Users: Bangkok VS Others (2001-2004)Figure 4.2 Internet Users: Bangkok VS Others (2001-2004)Figure 4.2 Internet Users: Bangkok VS Others (2001-2004)Figure 4.2 Internet Users: Bangkok VS Others (2001-2004)
51.6
OthersBangkok
’04
’03
’01
Year
’99 ’00 ’01 ’02 ’03 ’04 Year’98
% of populaion
1.1
Million persons
2.43.7
5.6
7.7
10.4
11.9
0.7 1.52.3
3.54.8
6.07.0
No. of Internet users% of population
Figure 4.1 Number of Internet Users (1998-2004)Figure 4.1 Number of Internet Users (1998-2004)Figure 4.1 Number of Internet Users (1998-2004)Figure 4.1 Number of Internet Users (1998-2004)Figure 4.1 Number of Internet Users (1998-2004)
14
12
10
8
4
2
0
8
7
6
5
4
3
2
1
0
6
Sources: National Electronics and Computer Technology Center (NECTEC)
National Statistical Office (NSO)
Sources: National Electronics and Computer Technology Center (NECTEC)
0 10 20 30 40 50 60 70 80 90 100
%

Thailand ICT Indicators 200528
Table 4.1 Internet Penetration by Location (2001-2004)Table 4.1 Internet Penetration by Location (2001-2004)Table 4.1 Internet Penetration by Location (2001-2004)Table 4.1 Internet Penetration by Location (2001-2004)Table 4.1 Internet Penetration by Location (2001-2004)
Source: National Statistical Office (NSO)
Remarks: *Vicinity includes Pathumthani, Nonthaburi, Samut Prakarn, Samut Sakhon andNakhon Pathom
Number of usersNumber of usersNumber of usersNumber of usersNumber of users Users per 100Users per 100Users per 100Users per 100Users per 100(million persons)(million persons)(million persons)(million persons)(million persons) InhabitantsInhabitantsInhabitantsInhabitantsInhabitants
2001 2003 2004 2001 2003 2004
Whole kingdom 3.53 6.03 6.97 5.6 10.4 11.9
- Bangkok and vicinity* 1.23 2.01 2.00 16.0 26.9 26.6
- North 0.52 1.34 1.52 4.6 10.1 11.2
- Central 0.83 1.00 1.21 5.9 9.7 11.4
- Northeast 0.56 1.07 1.49 2.6 5.6 7.7
- South 0.39 0.62 0.76 4.7 8.2 9.9
RegionRegionRegionRegionRegion
Figure 4.3 Internet Users by Gender (2001-2003)Figure 4.3 Internet Users by Gender (2001-2003)Figure 4.3 Internet Users by Gender (2001-2003)Figure 4.3 Internet Users by Gender (2001-2003)Figure 4.3 Internet Users by Gender (2001-2003)
Source: National Statistical Office (NSO)
53
51
50
49
48
47
46
45
44
51.7 51.9
52.6
48.148.3
47.4
’01 ’02 ’03
Female
Male
% of Internet users
Year
52

National Electronics and Computer Technology Center29
60
50
40
30
20
10
0
Figure 4.4 Internet Users by Age (2004)Figure 4.4 Internet Users by Age (2004)Figure 4.4 Internet Users by Age (2004)Figure 4.4 Internet Users by Age (2004)Figure 4.4 Internet Users by Age (2004)
% of Internet users
6-14 15-24 25-34 35-49 50-59
10.0
52.0
19.8
15.0
3.0
Source: National Statistical Office (NSO)
Years ofage
60+
0.2

Thailand ICT Indicators 200530
Figure 4.5 Mode of Access to the Internet (2003)Figure 4.5 Mode of Access to the Internet (2003)Figure 4.5 Mode of Access to the Internet (2003)Figure 4.5 Mode of Access to the Internet (2003)Figure 4.5 Mode of Access to the Internet (2003)
The government is actively promoting broadband development, with the aim toincrease the number of broadband subscribers to 1 million by the end of 2004.Although there is no exact information on the number of broadband users, it isestimated that there are currently around 200,000.
Sources: National Electronics and Computer Technology Center (NECTEC)
%
Dial Up
ISDN
ADSL
Cable Modem
2
1.6
1.7
0.3
0.7
0.6
31.7
7.1
IP Star
Sattelite
MobileInternet
Office/School’sleased Line
Don’t know
54.3
0 10 20 30 40 50 60

National Electronics and Computer Technology Center31
Figure 4.6 Average Online Time per User (1999-2003)Figure 4.6 Average Online Time per User (1999-2003)Figure 4.6 Average Online Time per User (1999-2003)Figure 4.6 Average Online Time per User (1999-2003)Figure 4.6 Average Online Time per User (1999-2003)
Source: National Statistical Office (NSO)
’99 ’00 ’02 ’03’01
Year9
9.5
10
10.5
Hours/week
11
11.5
12
10.8
11.7
10.6
11.2
10.2
On average, users spend around 10-11 hours per week online. According tothe latest Internet users survey (2003), most popular activities users conduct on theInternet are searching for information, using e-mail, and reading news and currentissues (Figure 4.7). This pattern differs slightly from the previous years where e-mailwas the most popular activity on the Internet. Nowadays the Internet is not just acommunication channel but has become a common platform for information acquisitionin the “Information Society”.
In terms of entertainment, there was a rising popularity of “Online Games”,which accounted for 2.3% and 5.8% of the activities on the Internet in 2002 and 2003survey, respectively. Most players are younger than 20 years of age. The popularity ofentertainment and games are confirmed by another statistics on the most frequentlyvisited web sites in Table 4.2.
The popularity of online games has created a concern within the society for twomain reasons: the excess amount of time being spent and the violent nature of somegames. With the growing concerns that young people are becoming addicted to theonline computer games, the Ministry of Information and Communication Technology(MICT) proposed the online gaming regulations, which was endorsed by the cabinet inNovember 2003. The new regulation would limit gaming among gamers under 18years old to no more than three hours a day; ban online gambling; establish a new

Thailand ICT Indicators 200532
Figure 4.7 Top Ten Internet Activities (2003)Figure 4.7 Top Ten Internet Activities (2003)Figure 4.7 Top Ten Internet Activities (2003)Figure 4.7 Top Ten Internet Activities (2003)Figure 4.7 Top Ten Internet Activities (2003)
Source: National Electronics and Computer Technology Center (NECTEC)
Information search
News, timely report
Chat/ ICQ
Game online
View products
Download-software
Web board
Download-music
Download-game
0 10
0.5
20 30 40
1.0
1.3
2.1
4.6
5.8
7.1
14.1
31.6
31.9
% of activities conducted on Internet
registration process for places offering online gaming services; and run the awarenesscampaign on the negative impacts of game addiction. It will be sometimes before wecan evaluate whether MICT approach is fruitful.

National Electronics and Computer Technology Center33
Table 4.2 Top Ten Most Visited Web SitesTable 4.2 Top Ten Most Visited Web SitesTable 4.2 Top Ten Most Visited Web SitesTable 4.2 Top Ten Most Visited Web SitesTable 4.2 Top Ten Most Visited Web Sites
% of Total Visited
Year 2002 Year 2003Categories
Source: http://truehits.net, Jan-Dec average
1. Entertainment 33.1 29.6
2. Internet 24.9 26.0
3. Business 11.8 9.5
4. News 8.6 7.0
5. Person 6.0 6.0
6. Game - 5.0
7. Shopping - 3.3
8. Government 2.2 2.4
9. Computer 6.5 2.4
10. Education 2.2 2.1
The growth of Internet bandwidth is also impressive. However, since 2002,most ISPs have opted for high quality fiber links and symmetric satellite services.Hence, the figures presented are inbound and outbound capacities, reflecting the“infrastructure” more than actual use. The domestic Internet traffic has also increasedconsiderably from a mere 57.8 GB per day in 1998 to 7,618.6 GB per day in 2004.

Thailand ICT Indicators 200534
Figure 4.8 Thailand Domestic Internet Traffic VolumeFigure 4.8 Thailand Domestic Internet Traffic VolumeFigure 4.8 Thailand Domestic Internet Traffic VolumeFigure 4.8 Thailand Domestic Internet Traffic VolumeFigure 4.8 Thailand Domestic Internet Traffic Volume(1998-2004)(1998-2004)(1998-2004)(1998-2004)(1998-2004)
Source: National Electronics and Computer Technology Center (NECTEC)
Remarks: *as of March 2004
To Thailand
57.80
1,000
2,000
3,000
4,000
5,000
6,000
7,000
8,000
’98 ’99 ’00 ’01
169.8
’02
529.5
1,231.8
3,264.8
’03 ’04
5,438.2
7,618.6
Year
GB/day
Figure 4.9 Total Domestic Exchange BandwidthFigure 4.9 Total Domestic Exchange BandwidthFigure 4.9 Total Domestic Exchange BandwidthFigure 4.9 Total Domestic Exchange BandwidthFigure 4.9 Total Domestic Exchange Bandwidth(End of Period) (1998-2004)(End of Period) (1998-2004)(End of Period) (1998-2004)(End of Period) (1998-2004)(End of Period) (1998-2004)
’98 ’99 ’00 ’01 ’02 ’03 ’04*
To Thailand
2,000
4,000
6,000
8,000
10,000
12,000
14,000
0
16,000
18,000
Mbps
335.8 366.3 612.6 1,069.2
2,571.5
10,409.1
16,773
Year
Source: National Electronics and Computer Technology Center (NECTEC)
Remarks: *as of June 2004

National Electronics and Computer Technology Center35
Figure 4.10Figure 4.10Figure 4.10Figure 4.10Figure 4.10 International Internet Bandwidth (1998-2004) International Internet Bandwidth (1998-2004) International Internet Bandwidth (1998-2004) International Internet Bandwidth (1998-2004) International Internet Bandwidth (1998-2004)
Mbps
Source: National Electronics and Computer Technology Center (NECTEC)
Remarks: The international Internet bandwidth represents the capacity of the communicationlines of the ISPs. During 1999-2002, many ISPs expanded their lines “simplex”satellite service in order to cope with their congestions in the inbound traffic. In late2002, most ISPs opt for high-quality fiber links and symmetric satellite services. Thisresulted in equality between the inbound and outbound capacities.
*as of June 2004
2,500
2,000
1,500
1,000
500
0
’99 ’00 ’01 ’02 ’03
Year
’98
37 37118
66
268 170
642 527
1,011 975
1,438
2,398 2,398
1,438
To Thailand
From Thailand
’04*
Table 4.3 Distribution of .th Domain Names (1997-2004)Table 4.3 Distribution of .th Domain Names (1997-2004)Table 4.3 Distribution of .th Domain Names (1997-2004)Table 4.3 Distribution of .th Domain Names (1997-2004)Table 4.3 Distribution of .th Domain Names (1997-2004)
Year ac.th co.th go.th in.th mi.th net.th or.th Total
1997 156 767 70 - 2 17 89 1,101
1998 230 1,730 88 - 4 18 160 2,230
1999 313 2,927 108 242 6 21 217 3,834
2000 423 4,774 210 804 7 23 312 6,553
2001 624 6,573 229 1,084 10 24 416 8,924
2002 839 8,354 265 1,181 14 27 484 11,164
2003 1,087 10,367 343 1,271 14 27 567 13,676
2004* 1,210 10,999 387 1,264 14 26 576 14,476
Source: T.H. NIC Company Limited
Remarks: *as of May 2004

Thailand ICT Indicators 200536
TotalTotalTotalTotalTotal14,47614,47614,47614,47614,476
domainsdomainsdomainsdomainsdomains
co.th76.0%
ac.th8.4%
or.th4.0%
go.th2.6%
in.th8.7%
mi.th 0.1%
net.th 0.2%
Source: T.H. NIC Company Limited.
Remarks: *as of May 2004
Figure 4.11 Distribution of .th Domain Names (2004*)Figure 4.11 Distribution of .th Domain Names (2004*)Figure 4.11 Distribution of .th Domain Names (2004*)Figure 4.11 Distribution of .th Domain Names (2004*)Figure 4.11 Distribution of .th Domain Names (2004*)
In May 2004, there are 14,476 domain names under .th, representing anincrease of 7.82% from 1997. The majority (76%) of .th domain names are businessregistration, i.e. under “.co.th” (Figure 4.0).
Over the past few years, many computer systems have been burdened by anincreasing incidence of viruses and spam mails which represent a major threat tocomputer security. A Thailand Computer Emergency Response Team or ThaiCERT, forshort, was established under NECTEC in 2000, to perform consultancy services and toquick respond queries as well as to take quick action on issues concerning computersecurity.
Table 4.4 shows the incidence of virus infected e-mails detected on 94 domainswhich were registered with the Government Information Technology Services (GITS)during September 2003 to August 2004.

National Electronics and Computer Technology Center37
Source: http://mailcleaner.gits.net.th/mcstat/index, Government Information Technology Infrastructure (GITS)
Remarks: Statistics from 94 registered domains
MessageMessageMessageMessageMessage Infected Infected Infected Infected Infected % of infected e-Mails% of infected e-Mails% of infected e-Mails% of infected e-Mails% of infected e-Mails Top VirusTop VirusTop VirusTop VirusTop Virus
Dec-03 1,336k 6k 0 HTML/IFrame_Exploit
Jan-04 1,946k 390k 20 Win32/Mydoom.A@mm
Feb-04 2,753k 961k 35 Win32/Mydoom.A@mm
Mar-04 5,337k 1,458k 27 Win32/Mydoom.F@mm
Apr-04 3,789k 1,359k 36 Win32/Mydoom.F@mm
May-04 4,309k 1,917k 44 Win32/Netsky.Z@mm
Jun-04 3,008k 2,084k 69 Win32/Netsky.Z@mm
Jul-04 5,613k 2,809k 50 Win32/Netsky.Z@mm
Aug-04 4,887k 2,657k 54 Win32/Netsky.Z@mm
Sep-04 2491k 1,750K 70 Win32/Netsky.Z@mm
Oct-04 2449k 1,697k 69 Win32/Mydoom.T@mm
Nov-04 5646k 3349K 55 Win32/Bagle.AS@mm
Table 4.4 Report of Virus Infected e-mailsTable 4.4 Report of Virus Infected e-mailsTable 4.4 Report of Virus Infected e-mailsTable 4.4 Report of Virus Infected e-mailsTable 4.4 Report of Virus Infected e-mailsduring December 2003 to November 2004during December 2003 to November 2004during December 2003 to November 2004during December 2003 to November 2004during December 2003 to November 2004
It was found that the percentage of infected e-mails has been continuouslyincreasing. This signifies the need to establish policies and/or measures to appro-priately address the computer security issue. The task is now under the responsibilityof the electronic transactions commission, through the sub-committee on e-security.

Thailand ICT Indicators 200538
Figure 4.12 Virus Distribution during December 2003Figure 4.12 Virus Distribution during December 2003Figure 4.12 Virus Distribution during December 2003Figure 4.12 Virus Distribution during December 2003Figure 4.12 Virus Distribution during December 2003to November 2004to November 2004to November 2004to November 2004to November 2004
38%Other
6%Zafi.B
Mydoom.F@mm
Netsky.Z@mm
Mydoom.A@mm
Netsky.D@mm
Mydoom.T@mm
Win32/Netsky.P@mm
Win32/Zafi.B@mm
HTML/IFrame_Exploit*
Other
12%Mydoom.F
10%Netsky.Z
9%Mydoom.A
8%Mydoom.D
5%HTML/IFrame_Exploit*
6%Netsky.T
6%Netsky.P
Source: Government Information Technology Service http://mailcleaner.gits.net.th/mcstat/index.php
The virus incident reported collection via Mailcleaner, virus and spam mailscreening and cleaning service offered by the Government IT Services (GITS), duringyear 2003 to 2004 (as of November 2004) indicated that Mydoom.F was the majoritytype of infected virus in year 2004 with a share of 12%, whereas Netsky.Z andMydoom.A came as the second and third major type of infected virus with a share of10% and 9%, respectively. In addition, the report revealed that the highest infectedrate has occured in September 2004.

National Electronics and Computer Technology Center39
VTTTTThe National ICT Masterplan (2002-2006) encourages business sectors,
particularly small and medium enterprises which are the driving force behind thenational development, to deploy ICT in order to boost up their competitiveness.ICT is to be applied in both manufacturing and marketing functions.
However, the diffusion of ICT among business establishments was limited anduneven. On average, 11% of business establishments have computers, whereas only4.2% and 1.2% have access to the Internet and own web sites, respectively (Figure5.1). The size of firms is related to the extent to which firms absorb new technology.By and large, the larger the firm is, the more likely it will own and use ICT in itsbusiness (Figure 5.2). Overall, computer is more widespread and commonly used thanthe Internet and web site.
The disparity of ICT uptakes also exists among economic activities. Computerand related services is undoubtedly the most advanced sector, with 89.9% of itsestablishments having computers, 81.9% and 11.2% having Internet access and websites, respectively. Research and development surprisingly comes in second with closerecords, 100% for computer usage and 79.2% for Internet access. However, none ofthe establishments in this sector has its own web site. For the rest, they are not muchdifferent, especially in the area of web site where the usage rate is minimal.
e-Commerce

Thailand ICT Indicators 200540
Figure 5.2 Percentage of Establishments with ICTFigure 5.2 Percentage of Establishments with ICTFigure 5.2 Percentage of Establishments with ICTFigure 5.2 Percentage of Establishments with ICTFigure 5.2 Percentage of Establishments with ICTby Size (2003)by Size (2003)by Size (2003)by Size (2003)by Size (2003)
1.14
10.8
Figure 5.1 Percentage of Establishments with ICTFigure 5.1 Percentage of Establishments with ICTFigure 5.1 Percentage of Establishments with ICTFigure 5.1 Percentage of Establishments with ICTFigure 5.1 Percentage of Establishments with ICTby Region (2003)by Region (2003)by Region (2003)by Region (2003)by Region (2003)
% of establishments
Source: National Statistical Office (NSO)
Source: National Statistical Office (NSO)Remarks: *Vicinity includes Pathumthani, Nonthaburi, Samut Prakarn, Samut Sakhon and Nakhon Pathom
% of establishments

National Electronics and Computer Technology Center41
Figure 5.3 Percentage of Establishments with ComputersFigure 5.3 Percentage of Establishments with ComputersFigure 5.3 Percentage of Establishments with ComputersFigure 5.3 Percentage of Establishments with ComputersFigure 5.3 Percentage of Establishments with Computersby Economic Activities (2003)by Economic Activities (2003)by Economic Activities (2003)by Economic Activities (2003)by Economic Activities (2003)
% of establishments
Economic activities by ISIC*
Source: The Report of the 2004 Information and Communication Technology Survey(Establishment), National Statistical Office (NSO)
Remarks: *List of Economic Activities by ISIC(International Standard Industrial Classification System)
List of Economic ActivitiesList of Economic ActivitiesList of Economic ActivitiesList of Economic ActivitiesList of Economic Activities
50 - Sale, maintenance and repair of motor vehicles and motorcycles; retail saleof automotive fuel
51 - Wholesale trade and commission trade, except of motor vehicles andmotorcycles
52 - Retail trade, except of motor vehicles and motorcycles; repair of personaland household goods
55 - Hotels and restaurants
70 - Real estate activities
71 - Renting of machinery and equipment without operator and of personal andhousehold goods
72 - Computer and related activities
73 - Research and development
74 - Other business activities
92 - Recreational, cultural and sporting activities
93 - Other service activities
12.4
32.1
6.6 8.4
28.524.9
89.9
100
53.4
2.0
35.0

Thailand ICT Indicators 200542
Figure 5.5 Percentage of Establishments with Web siteFigure 5.5 Percentage of Establishments with Web siteFigure 5.5 Percentage of Establishments with Web siteFigure 5.5 Percentage of Establishments with Web siteFigure 5.5 Percentage of Establishments with Web site by Economic Activ by Economic Activ by Economic Activ by Economic Activ by Economic Activities (2003)ities (2003)ities (2003)ities (2003)ities (2003)
% of establishments
Figure 5.4 Percentage of Establishments with Internet AccessFigure 5.4 Percentage of Establishments with Internet AccessFigure 5.4 Percentage of Establishments with Internet AccessFigure 5.4 Percentage of Establishments with Internet AccessFigure 5.4 Percentage of Establishments with Internet Accessby Economic Activities (2003)by Economic Activities (2003)by Economic Activities (2003)by Economic Activities (2003)by Economic Activities (2003)
Economic activities by ISIC*
% of establishments
Economic activities by ISIC*
0.70
25.019.4
79.281.9
10.53.03.22.4
13.7
4.6
1.0
3.3
0.91.7 1.8
0.1
11.2
3.51.5
0.0
Source: The Report of the 2004 Information and Communication Technology Survey(Establishment), Natonal Statistical Office (NSO)
Source: The Report of the 2004 Information and Communication Technology Survey(Establishment), Natonal Statistical Office (NSO)
12
2
050
4
6
8
10
51 52 55 70 72 74 92 9371 73
0.0

National Electronics and Computer Technology Center43
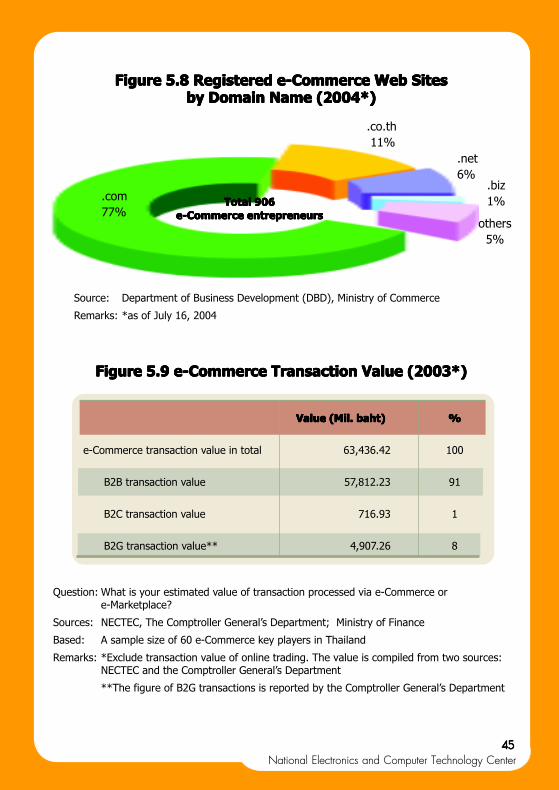
The first ICT Indicator series discussed the difficulty in gathering information one-Commerce. Since then, various government agencies have put further efforts insystematic data collection and analyzing statistics. The Department of BusinessDevelopment, Ministry of Commerce, launched a program in May 2003 on Registrationof E-commerce Entrepreneur which requires e-commerce entrepreneurs to registerwith the department in accordance with the Commercial Registration Act, 1956.Approximately 900 have registered 1,200 web sites so far. Three quarters of thosebusinesses are located in the central region, and 77% are “.com” followed by “.co.th”and “.net” at 11% and 6%, respectively.
This registration program is not only a tool for data and statistics collection, butalso a vehicle for e-Commerce promotion. The department will issue a Trustmark toqualified entrepreneurs by 2005. For consumers, this Trustmark provides themconfidence in the credibility of the provider, thus, encourages them to purchase viae-Commerce.
According to a survey of 880 e-Commerce enterpreneurs, e-Commerce transac-tion value for B2B and B2C was estimated at 58,529.16 million baht. Meanwhile, asthe government is driving towards e-Procurement, B2G transaction value has beenrising from 182 million baht in 2002 to nearly 5,000 million baht in 2003.
Business-to-Consumer or B2C, on the other hand, is not well established inThailand. According to the survey on Internet Users Profile of Thailand conductannually by NECTEC, it is found that during 1999-2003, only 20% of Internet usershave ever purchased goods/services via the Internet. When asked for the reasons towhich users did not buy via e-Commerce, a number of issues came up. For instance,some users need to touch and feel the feelings to be confident in the quality of theproducts in question. Others were concerned with online security and fraud, particu-larly when they have to give out their credit card number on the Internet.
The year 2003 also witnessed the breakthrough of online trading, of which thevalue has reached 417,916 million baht, more than 600% increase from 2002. One ofthe main reasons behind the leapfrog was an enormous boost in the number ofregistered customers and active customers. The customers who registered to open anInternet trading account increased 140%, from 16,381 in 2002 to 39,882 in 2003.Out of this, approximately 25% was active customers who at least once ever tradedonline.

Thailand ICT Indicators 200544
Figure 5.6 Registered e-Commerce Entrepreneurs (2004*)Figure 5.6 Registered e-Commerce Entrepreneurs (2004*)Figure 5.6 Registered e-Commerce Entrepreneurs (2004*)Figure 5.6 Registered e-Commerce Entrepreneurs (2004*)Figure 5.6 Registered e-Commerce Entrepreneurs (2004*)
Figure 5.7 Registered e-Commerce EntrepreneursFigure 5.7 Registered e-Commerce EntrepreneursFigure 5.7 Registered e-Commerce EntrepreneursFigure 5.7 Registered e-Commerce EntrepreneursFigure 5.7 Registered e-Commerce Entrepreneursby Location (2004*)by Location (2004*)by Location (2004*)by Location (2004*)by Location (2004*)
59%41%Total 906Total 906Total 906Total 906Total 906
e-Commerce entrepreneurse-Commerce entrepreneurse-Commerce entrepreneurse-Commerce entrepreneurse-Commerce entrepreneursJuristic personOrdinary person
Source: Department of Business Development (DBD), Ministry of Commerce
Remarks: *as of July 16, 2004
26%Regional
74%Central
Source: Department of Business Development (DBD), Ministry of Commerce
Remarks: *as of July 16, 2004
Total 906Total 906Total 906Total 906Total 906e-Commerce entrepreneurse-Commerce entrepreneurse-Commerce entrepreneurse-Commerce entrepreneurse-Commerce entrepreneurs
National Electronics and Computer Technology Center4545454545
Figure 5.8 RFigure 5.8 RFigure 5.8 RFigure 5.8 RFigure 5.8 Registered e-Commerce Web Sitesegistered e-Commerce Web Sitesegistered e-Commerce Web Sitesegistered e-Commerce Web Sitesegistered e-Commerce Web Sitesby Domain Name (2004*)by Domain Name (2004*)by Domain Name (2004*)by Domain Name (2004*)by Domain Name (2004*)
.com77%
.co.th 11%
.net6%
others5%
.biz1%
Question: What is your estimated value of transaction processed via e-Commerce ore-Marketplace?
Sources: NECTEC, The Comptroller General’s Department; Ministry of Finance
Based: A sample size of 60 e-Commerce key players in Thailand
Remarks: *Exclude transaction value of online trading. The value is compiled from two sources:NECTEC and the Comptroller General’s Department
**The figure of B2G transactions is reported by the Comptroller General’s Department
Figure 5.9 e-Commerce Transaction Value (2003*)Figure 5.9 e-Commerce Transaction Value (2003*)Figure 5.9 e-Commerce Transaction Value (2003*)Figure 5.9 e-Commerce Transaction Value (2003*)Figure 5.9 e-Commerce Transaction Value (2003*)
Source: Department of Business Development (DBD), Ministry of Commerce
Remarks: *as of July 16, 2004
Total 906Total 906Total 906Total 906Total 906e-Commerce entrepreneurse-Commerce entrepreneurse-Commerce entrepreneurse-Commerce entrepreneurse-Commerce entrepreneurs
Value (Mil. baht)Value (Mil. baht)Value (Mil. baht)Value (Mil. baht)Value (Mil. baht) %%%%%
e-Commerce transaction value in total 63,436.42 100
B2B transaction value 57,812.23 91
B2C transaction value 716.93 1
B2G transaction value** 4,907.26 8

Thailand ICT Indicators 200546
Figure 5.10 Internet Purchase Experience (1999-2003)Figure 5.10 Internet Purchase Experience (1999-2003)Figure 5.10 Internet Purchase Experience (1999-2003)Figure 5.10 Internet Purchase Experience (1999-2003)Figure 5.10 Internet Purchase Experience (1999-2003)
Figure 5.11 Reasons Against Internet Purchase (2003)Figure 5.11 Reasons Against Internet Purchase (2003)Figure 5.11 Reasons Against Internet Purchase (2003)Figure 5.11 Reasons Against Internet Purchase (2003)Figure 5.11 Reasons Against Internet Purchase (2003)
Source: National Electronics and Computer Technology Center (NECTEC)
Source: National Electronics and Computer Technology Center (NECTEC)
% ofrespondents
% ofrespondents

National Electronics and Computer Technology Center47
Figure 5.12 Online Spending (2003)Figure 5.12 Online Spending (2003)Figure 5.12 Online Spending (2003)Figure 5.12 Online Spending (2003)Figure 5.12 Online Spending (2003)
30
Figure 5.13 Value of Online Trading (2000-2004)Figure 5.13 Value of Online Trading (2000-2004)Figure 5.13 Value of Online Trading (2000-2004)Figure 5.13 Value of Online Trading (2000-2004)Figure 5.13 Value of Online Trading (2000-2004)
Value of online trading% of total trading
400,000
300,000
200,000
100,000
0
1
2
3
4
5
6
0.061,168
0.41.29
4.45
5.71
12,70853,145
417,916
288,927
’00 ’01 ’02 ’03 ’04*
500,000 7
0
Source: Stock Exchange of Thailand (SET)
Remarks: *as of May 2004
(Exchange rate as of July 21, 2004, 1 USD = 40.89 Baht)
40.7
35.0
11.1
5.5 5.4
45
40
35
30
25
20
15
10
5
0
Million baht
%
% of total trading
Question: What is your approximate online spending in the past year including onlinereservation? The payment can be either offline or online.
Source: National Electronics and Computer Technology Center (NECTEC)
Baht
2.3

Thailand ICT Indicators 200548
Figure 5.14 Number of Online Trading Customers (2000-2004)Figure 5.14 Number of Online Trading Customers (2000-2004)Figure 5.14 Number of Online Trading Customers (2000-2004)Figure 5.14 Number of Online Trading Customers (2000-2004)Figure 5.14 Number of Online Trading Customers (2000-2004)
Persons
Source: Bank of Thailand (BOT)
Figure 5.15 Value and Volume of Internet Banking TransactionFigure 5.15 Value and Volume of Internet Banking TransactionFigure 5.15 Value and Volume of Internet Banking TransactionFigure 5.15 Value and Volume of Internet Banking TransactionFigure 5.15 Value and Volume of Internet Banking Transaction(2000-2003)(2000-2003)(2000-2003)(2000-2003)(2000-2003)
Volume of transactionsValue of transactions
800
700
600
500
400
300
100
0
’00 ’01 ’02 ’03 Year
0.30
2
4
6
8
10
12
8.6
730.5638.0
10.339.99
6.24
3.3
Billion baht
Source: Stock Exchange of Thailand (SET)
Remarks: *as of May 2004
Million transactions
200
’00 ’01 ’02 ’03 ’04*

National Electronics and Computer Technology Center49
IT Market and Industry
FFFFFrom year 1997 onwards, the Thai IT market is expanding continuously withan average growth rate of 17% annually. The total market for 2004 is estimated to be103,191 million baht, with the share of hardware, software and IT services at 66%(69,193 million baht), 17% (17,934 million baht) and 17% (18,064 million baht),respectively. Over the past seven years, hardware market hold the biggest share atthe average of 62%, followed by IT services at 20% and software market at 18%.In terms of growth, hardware market grows the fastest at 21%, while software and ITservices grow at 17% and 12%, respectively.
From the demand side, during 1997-2004, the government, manufacturing,and telecommunications were among the major IT spenders. Their spending individu-ally ranges from 14-16% of the market. From the household side, the home useaccounted for 16% of the market, whereas health care and hotel appeared to be theleast spenders, with the spendings together accounted only approximately 2% of totalmarket.
The total value of software market in 2003 was reported at 14,129 million baht.The major source of spending came from a manufacturing sector and a governmentsector, each accounted for approximately 18% of the market, followed by an educationsector (14%). Those sectors, with spending less than 5% were agriculture (3%),entertainment (2%), health care (1%) and transportation (1%).
VI

Thailand ICT Indicators 200550
However, this market value did not account for the pirated software. The studyconducted by the Business Software Alliance (BSA) reported that, in 1994, the piracyrate was at 87%, which was equivalent to 17.06 million baht in revenue lost. From1995 onward, the country has made a good progress and success in reducing thepiracy rate to a level of 77% in the year 2001 and 2002, the lowest since 1994.
In the area of trade, Thailand has always been a net importer of ICT goods(Figure 6.4), with the value of imports approximately twice of the exports. In 2003,the import values accounted for about 5.73% of GDP, while the export valuesaccounted for only 2.97%. Computer parts and computer accessories are among thetop ICT imported items. Oftentimes, these parts and accessories were used in thelocal assembly plant and re-exported as finished ICT goods.

National Electronics and Computer Technology Center51
Tab
le 6
.1 T
hai
lan
d I
T M
arke
t b
y C
ateg
ory
Tab
le 6
.1 T
hai
lan
d I
T M
arke
t b
y C
ateg
ory
Tab
le 6
.1 T
hai
lan
d I
T M
arke
t b
y C
ateg
ory
Tab
le 6
.1 T
hai
lan
d I
T M
arke
t b
y C
ateg
ory
Tab
le 6
.1 T
hai
lan
d I
T M
arke
t b
y C
ateg
ory
(19
97
-20
04
)(1
99
7-2
00
4)
(19
97
-20
04
)(1
99
7-2
00
4)
(19
97
-20
04
)
Ave
rag
eA
vera
ge
Ave
rag
eA
vera
ge
Ave
rag
e G
row
thG
row
thG
row
thG
row
thG
row
thR
ate
Rat
eR
ate
Rat
eR
ate
Ave
rag
eA
vera
ge
Ave
rag
eA
vera
ge
Ave
rag
e o
f o
f o
f o
f o
fS
har
eS
har
eS
har
eS
har
eS
har
e
Yea
rY
ear
Yea
rY
ear
Yea
r
Cat
ego
ryC
ateg
ory
Cat
ego
ryC
ateg
ory
Cat
ego
ry1
99
71
99
71
99
71
99
71
99
71
99
81
99
81
99
81
99
81
99
81
99
91
99
91
99
91
99
91
99
92
00
02
00
02
00
02
00
02
00
02
00
12
00
12
00
12
00
12
00
12
00
22
00
22
00
22
00
22
00
22
00
32
00
32
00
32
00
32
00
32
00
42
00
42
00
42
00
42
00
4
Val
ue
Val
ue
Val
ue
Val
ue
Val
ue
%%%% %V
alu
eV
alu
eV
alu
eV
alu
eV
alu
e % % % % %
Val
ue
Val
ue
Val
ue
Val
ue
Val
ue
%%%% %V
alu
eV
alu
eV
alu
eV
alu
eV
alu
e%%%% %
Val
ue
Val
ue
Val
ue
Val
ue
Val
ue
%%%% %V
alu
eV
alu
eV
alu
eV
alu
eV
alu
e%%%% %
Val
ue
Val
ue
Val
ue
Val
ue
Val
ue
% % % % %V
alu
eV
alu
eV
alu
eV
alu
eV
alu
e%%%% %
(Y’9
7-
(Y’9
7-
(Y’9
7-
(Y’9
7-
(Y’9
7-
(Y’9
7-
(Y’9
7-
(Y’9
7-
(Y’9
7-
(Y’9
7-
chan
ge
chan
ge
chan
ge
chan
ge
chan
ge
chan
ge
chan
ge
chan
ge
chan
ge
chan
ge
chan
ge
chan
ge
chan
ge
chan
ge
chan
ge
chan
ge
chan
ge
chan
ge
chan
ge
chan
ge
chan
ge
chan
ge
chan
ge
chan
ge
chan
ge
chan
ge
chan
ge
chan
ge
chan
ge
chan
ge
chan
ge
chan
ge
chan
ge
chan
ge
chan
ge
chan
ge
chan
ge
chan
ge
chan
ge
chan
ge
’04
)’0
4)
’04
)’0
4)
’04
) ’0
4)
’04
) ’0
4)
’04
) ’0
4)
Har
dwar
e27
,596
-13
,597
-51%
20,1
1048
%31
,275
56%
35,8
1915
%48
,879
36%
50,3
31%
3%67
,193
37%
21%
62%
(Mkt
Sha
re)
65%
52%
57%
64%
63%
66%
63%
65%
Soft
war
e6,
851
-5,
126
-25%
6,28
923
%8,
378
33%
10,1
2521
%12
,530
24%
14,1
2913
%17
,934
27%
17%
18%
(Mkt
Sha
re)
16%
20%
18%
17%
18%
17%
18%
17%
IT S
ervi
ces
8,20
0-
7,22
9-1
2%8,
738
21%
9,48
69%
10,9
9316
%12
501
14%
15,2
6018
%18
,064
18%
12%
20%
( M
kt S
hare
)19
%28
%25
%19
%19
%17
%19
%18
%
Tota
l42
,647
-25
,952
-39%
35,1
3735
%49
,139
40%
56,9
3716
%73
,910
30%
79,7
208%
103,
191
16%
15%
Sour
ce :
The
Ass
ocia
tion
of T
hai C
ompu
ter
Indu
stry
(AT
CI)
Mill
ion
baht

Thailand ICT Indicators 200552
Figure 6.1 Thailand IT Market by Category (1997-2004)Figure 6.1 Thailand IT Market by Category (1997-2004)Figure 6.1 Thailand IT Market by Category (1997-2004)Figure 6.1 Thailand IT Market by Category (1997-2004)Figure 6.1 Thailand IT Market by Category (1997-2004)
Hardware Software IT Services
Million baht
0
2027.6
40
60
80
100
120
6.8
8.2
13.65.1
7.2
20.1
8.7
6.331.2
8.49.5
35.8
10.110.9
48.9
12.5
12.5 15.1
15.2 17.9
18.1
58.967.2
’98’97 ’99 ’00 ’01
Source: The Association of Thai Computer Industry (ATCI)
’02 ’03 ’04
Year
8,200 7,229 8,738 9,486 10,993 12,501 15,160 18,064
6,865 5,126 6,289 8,378 10,125 12,530 15,086 17,93427,596 13,597 20,110 31,275 35,819 48,879 58,792 67,193

National Electronics and Computer Technology Center53
Tab
le 6
.2 T
hai
lan
d I
T M
arke
t b
y In
du
stry
Sec
tor
Tab
le 6
.2 T
hai
lan
d I
T M
arke
t b
y In
du
stry
Sec
tor
Tab
le 6
.2 T
hai
lan
d I
T M
arke
t b
y In
du
stry
Sec
tor
Tab
le 6
.2 T
hai
lan
d I
T M
arke
t b
y In
du
stry
Sec
tor
Tab
le 6
.2 T
hai
lan
d I
T M
arke
t b
y In
du
stry
Sec
tor
(19
97
-20
04
)(1
99
7-2
00
4)
(19
97
-20
04
)(1
99
7-2
00
4)
(19
97
-20
04
)
Valu
e in
mill
ion
baht
Sec
tor
Sec
tor
Sec
tor
Sec
tor
Sec
tor
19
97
19
97
19
97
19
97
19
97
19
98
19
98
19
98
19
98
19
98
19
99
19
99
19
99
19
99
19
99
20
00
20
00
20
00
20
00
20
00
20
01
20
01
20
01
20
01
20
01
20
02
20
02
20
02
20
02
20
02
20
03
20
03
20
03
20
03
20
03
20
04
20
04
20
04
20
04
20
04
Ave
rag
eA
vera
ge
Ave
rag
eA
vera
ge
Ave
rag
e
Val
ue
Val
ue
Val
ue
Val
ue
Val
ue
Rat
ioR
atio
Rat
ioR
atio
Rat
ioV
alu
eV
alu
eV
alu
eV
alu
eV
alu
eR
atio
Rat
ioR
atio
Rat
ioR
atio
Val
ue
Val
ue
Val
ue
Val
ue
Val
ue
Rat
ioR
atio
Rat
ioR
atio
Rat
ioV
alu
eV
alu
eV
alu
eV
alu
eV
alu
eR
atio
Rat
ioR
atio
Rat
ioR
atio
Val
ue
Val
ue
Val
ue
Val
ue
Val
ue
Rat
ioR
atio
Rat
ioR
atio
Rat
ioV
alu
eV
alu
eV
alu
eV
alu
eV
alu
eR
atio
Rat
ioR
atio
Rat
ioR
atio
Val
ue
Val
ue
Val
ue
Val
ue
Val
ue
Rat
ioR
atio
Rat
ioR
atio
Rat
ioV
alu
eV
alu
eV
alu
eV
alu
eV
alu
eR
atio
Rat
ioR
atio
Rat
ioR
atio
Rat
ioR
atio
Rat
ioR
atio
Rat
io
Gov
ernm
ent/
Stat
e7,
250
17%
3,37
413
%7,
379
21%
8,84
518
%9,
682
17%
11,3
8416
%12
,755
16%
15,3
0015
%17
%
Ente
rpris
e
Fina
ncia
l5,
118
12%
2,07
68%
3,16
29%
3,44
07%
3,98
77%
5,69
28%
7,17
59%
17,6
0017
%10
%
Man
ufac
turin
g6,
823
16%
4,93
119
%6,
325
18%
7,37
115
%9,
112
16%
10,6
7315
%11
,161
14%
14,8
0014
%16
%
Hea
lth C
are
1,27
93%
519
2%70
32%
491
1%57
01%
1,42
32%
2,39
23%
--
2%
Hot
el1,
279
3%51
92%
351
1%49
11%
1,13
92%
2,13
53%
1,59
42%
--
2%
Tele
com
mun
icat
ions
5,54
413
%4,
152
16%
4,21
612
%8,
354
17%
10,2
5218
%12
,808
18%
14,3
5018
%18
,500
18%
16%
Educ
atio
n5,
544
13%
3,37
413
%3,
865
11%
7,86
216
%9,
112
16%
10,6
7315
%11
,958
15%
--
14%
Hom
e U
se5,
118
12%
3,63
314
%4,
216
12%
8,35
417
%9,
682
17%
11,3
8416
%13
,552
17%
22,0
0021
%16
%
Oth
ers
4,69
111
%3,
374
13%
4,91
914
%3,
931
8%3,
417
6%4,
981
7%4,
782
6%14
,992
15%
10%
Tota
l42
,646
100%
25,9
5310
0%35
,137
100%
49,1
3910
0%56
,953
100%
71,1
5310
0%79
,720
100%
103,
191
100%
100%
Sour
ce:
The
Ass
ocia
tion
of T
hai C
ompu
ter
Indu
stry
(AT
CI )

Thailand ICT Indicators 200554
Figure 6.2 Software Industry Spending by SectorFigure 6.2 Software Industry Spending by SectorFigure 6.2 Software Industry Spending by SectorFigure 6.2 Software Industry Spending by SectorFigure 6.2 Software Industry Spending by Sector
(2002-2003)(2002-2003)(2002-2003)(2002-2003)(2002-2003)
Million baht
2002 2003
0
1,000
2,000
3,000
4,000
5,000
6,000
7,000
8,000
Source: The Association of Thai Software Industry (ATSI)
Reta
il
Oil
& G
as
Hea
lthca
re
Hom
e
Agric
ultu
re
Fina
nce
Sector
4,200
5,5005,500
7,000
1,2001,000
1,8001,450
2,200
3,000
6,000
7,000
350500
4,000
5,600
1,000
1,800
800
800
500500
1,1501,000
2,700
3,700
Man
ufac
turin
g
Trad
ing
Gov
ernm
ent
Educ
atio
n
Tran
spor
tatio
n
Ente
rtai
nmen
t
Tele
com
mni
catio
n

National Electronics and Computer Technology Center55
Table 6.3 Source of Software Revenue by SectorTable 6.3 Source of Software Revenue by SectorTable 6.3 Source of Software Revenue by SectorTable 6.3 Source of Software Revenue by SectorTable 6.3 Source of Software Revenue by Sector(2002-2003)(2002-2003)(2002-2003)(2002-2003)(2002-2003)
SectorSectorSectorSectorSector Share (%)Share (%)Share (%)Share (%)Share (%)
20022002200220022002 20032003200320032003
Government 20 18
Manufacturing 17 18
Telecom 14 14
Education 13 14
Financial 9 9
Oil & Gas 7 8
Retail 4 5
Home 3 5
Trading 3 4
Agriculture 3 3
Entertainment 3 2
Transport 2 1
Healthcare 1 1
Total 100 100
Source : The Associaton of Thai Software Industry (ATSI)

Thailand ICT Indicators 200556
Figure 6.3 Software Piracy Rate in Thailand (1994-2002)Figure 6.3 Software Piracy Rate in Thailand (1994-2002)Figure 6.3 Software Piracy Rate in Thailand (1994-2002)Figure 6.3 Software Piracy Rate in Thailand (1994-2002)Figure 6.3 Software Piracy Rate in Thailand (1994-2002)
Source: Business Software Alliance (BSA)
72
74
76
78
80
82
86
84
88
% of software piracy
’94 ’95 ’96 ’97
87
82
’98 ’99 ’00 ’01 ’02Year
80
84
8281
79
77 77

National Electronics and Computer Technology Center57
Figure 6.4 Trade in ICT Goods (1999-2004)Figure 6.4 Trade in ICT Goods (1999-2004)Figure 6.4 Trade in ICT Goods (1999-2004)Figure 6.4 Trade in ICT Goods (1999-2004)Figure 6.4 Trade in ICT Goods (1999-2004)
Source: Customs Department, Ministry of FinanceRemarks: *as of May 2004
5,000
0
100,000
150,000
200,000
250,000
300,000
350,000
400,000
’99 ’00 ’01 ’02 ’03 ’04
92,419.2
307,328.30
147,612.0
348,118.06
167,630.6
351,797.82
158,002.3
319,127.21
176,112.02
339,939.38
72,419.2
137,491.46
Value of ICT Imported (Miliion Baht)
Value of ICT Exported (Miliion Baht)Million baht
*
Value of IT importedValue of IT exported

Thailand ICT Indicators 200558
ICT in Government
TTTTThe current Thailand ICT Policy Framework (IT 2010) and ICT Master Plan(2002-2006) calls for a promotion of ICT usage in the government or “e-government”.Consequently, many initiatives/programs/projects have been implemented by variousministries, with the aim to achieve the “e-government” objectives and targets put forthby the MICT. According to research done by NECTEC, using the information providedby each ministry, the government has approved 1,095 IT projects with the total budgetof 28,436.25 million baht in 2003. In 2004, the number of projects have droppeddown to 1,078, while the total budget has significantly increased to 60,408.62 millionbaht.
Among those projects that were approved, it is worth to mention one largeproject that has received much interest from the media--the Smart Card Project.Proposed by the MICT, the project received the cabinet’s approval in March 2004 withthe total budget of over 7.9 billion baht. Such earmarked budget was to be used forproducing and managing the distribution of 64 million smart cards to every Thaicitizen. The first 12 million cards are expected to be ready for distribution in the fiscalyear 2004.
One indicator that can be used to reflect government commitment on IT wasthe budget allocation. Figure 7.1 shows the government budget on computerequipment during 1998-2004, both in absolute term and as a percentage of the totalbudget, which indicates an increasing trend.
VII

National Electronics and Computer Technology Center59
Figure 7.1 Government Budget on Computer Equipment*Figure 7.1 Government Budget on Computer Equipment*Figure 7.1 Government Budget on Computer Equipment*Figure 7.1 Government Budget on Computer Equipment*Figure 7.1 Government Budget on Computer Equipment*(1998-2004)(1998-2004)(1998-2004)(1998-2004)(1998-2004)
4,000
3,000
2,000
1,000
0
’99 ’90 ’01 ’02 ’03 ’04 Year’98
Million baht
3,300
4,180 3,909
Source: The Bureau of the Budget, Ministry of Finance.Remarks: *However, since the overall government IT budget is composed of several
expenditure accounts, the expenditure on computer equipment can only reflectgovernment spending on IT partially.
5,000
Table 7.1 Budget Approved for Computer in Fiscal Year 2005Table 7.1 Budget Approved for Computer in Fiscal Year 2005Table 7.1 Budget Approved for Computer in Fiscal Year 2005Table 7.1 Budget Approved for Computer in Fiscal Year 2005Table 7.1 Budget Approved for Computer in Fiscal Year 2005
No.No.No.No.No. MinistryMinistryMinistryMinistryMinistry BudgetBudgetBudgetBudgetBudget %%%%%
(Mil. baht)(Mil. baht)(Mil. baht)(Mil. baht)(Mil. baht)
1 Office of The Prime Minister 161.98 3.78
2 Ministry of Defense 133.17 3.09
3 Ministry of Finance 552.78 12.82
4 The Ministry of Foreign Affairs 51.38 1.19
5 Ministry of Tourism and Sports 26.68 0.62
6 Ministry of Social Development and Human Security 152.13 3.53
7 Ministry of Agriculture and Cooperatives 163.16 3.78
8 Ministry of Transport 182.06 4.22
9 Ministry of Natural Resource and Environment 8.46 0.20
10 Ministry of Information and Communication Technology 330.00 7.65
11 Ministry of Energy 35.28 0.82
0.1
0
0.2
0.3
0.4
0.5
% of totalgovernment budget
2,3610.31
1,3830.17
0.20
2,498
1,735
0.360.41 0.39
0.26

Thailand ICT Indicators 200560
Source: Report of the ad hoc subcommittee on the Budget Allocation on the ComputerProcurement of the Government Agencies, fiscal year 2005, The secretariat ofthe House of Representatives
In early 2004, NECTEC has initiated the first on-line survey on governmente-services called “Service e-Readiness Explorer” or SEE evaluation program (http://see.thaigov.net/actionPlan). The purpose was to evaluate the readiness of governmentweb services, based on five-level of e-Government maturity, i.e., Information,Interaction, Transaction, Integration, and Intelligence, and to provide recommenda-tions for future web service development to achieve high level of integration amongvarious government agencies.
The survey revealed that all 267 government agencies have web sites (Figure7.2) to provide information to the public. However, 13% of these sites were still at thebasic level. A much lower percentage was found in the other four categories, i.e.,Interaction, Transaction, Intelligence, and Integration, respectively. Especially in theintegration, no web site with such features was reported. This may imply the lack ofcollaborarion among agencies or lack of systematic mechanism that encouragescollaboration. Figure 7.3-7.5 shows the detail of service features under each categoryand the percentage of government e-services that have those features.
No.No.No.No.No. MinistryMinistryMinistryMinistryMinistry Budget Budget Budget Budget Budget %%%%%(Mil. baht)(Mil. baht)(Mil. baht)(Mil. baht)(Mil. baht)
12 Ministry of Commerce 178.84 4.15
13 Ministry of Interior 282.59 6.55
14 Ministry of Justice 170.96 3.97
15 Ministry of Education 1,097.54 25.45
16 Ministry of Labour 41.62 0.97
17 Ministry of Culture 0.42 0.01
18 Ministry of Science and Technology 60.14 1.39
19 Ministry of Public Health 188.30 4.37
20 Ministry of Industry 35.37 0.82
21 Independent Public Agencies 172.13 3.99
22 Others 286.79 6.65
TotalTotalTotalTotalTotal 4,311,786,5004,311,786,5004,311,786,5004,311,786,5004,311,786,500 100%100%100%100%100%
% of total government budget% of total government budget% of total government budget% of total government budget% of total government budget 0.260.260.260.260.26

National Electronics and Computer Technology Center61
Figure 7.2 Number of Government Web Sites by Type ofFigure 7.2 Number of Government Web Sites by Type ofFigure 7.2 Number of Government Web Sites by Type ofFigure 7.2 Number of Government Web Sites by Type ofFigure 7.2 Number of Government Web Sites by Type ofOnline Services (2004)Online Services (2004)Online Services (2004)Online Services (2004)Online Services (2004)
Remarks: Total number of web sites surveyed is 267.
Source: National Electronics and Computer Technology Center (NECTEC)
Interaction Transaction Integration IntelligenceInformation
Basic Intermediate Advance
-33
17
67
117
167
217
267
232(87%)
35(13%)
160(60%)
46(17%)
117(44%)
13 (5%)15 (6%)
0 (0%)
19(7%)

Thailand ICT Indicators 200562
Figure 7.3 Basic Information on Government Web SitesFigure 7.3 Basic Information on Government Web SitesFigure 7.3 Basic Information on Government Web SitesFigure 7.3 Basic Information on Government Web SitesFigure 7.3 Basic Information on Government Web Sites(2004*)(2004*)(2004*)(2004*)(2004*)
Source : National Electronics and Computer Technology Center (NECTEC)
Remarks: *Survey of 267 government web sites during 16 January - 31 March 2004
0
% of web sites
10 20 30 40 50 60 70 80 90 100
W3C Disability Accessibility
Website Instruction
Site Map
Service Instruction
Other Government Agencies’ News
Download Forms
Bilingual Content
Regulations
Other Information
General News
General Links
Counter/ TruesHits
Organization Related Links
Owned Domain Name
Office e-mail
Organization Structure
Regualry Updating
History
Address Information
Agency’s News
Telephone Contact
Mission
Website Presence
1
68
81
43
31
59
48
66
84
80
64
96
96
78
53
88
94
90
96
92
87
100
91

National Electronics and Computer Technology Center63
Figure 7.4 Type of Interaction Feature on the GovernmentFigure 7.4 Type of Interaction Feature on the GovernmentFigure 7.4 Type of Interaction Feature on the GovernmentFigure 7.4 Type of Interaction Feature on the GovernmentFigure 7.4 Type of Interaction Feature on the GovernmentWeb Sites (2004*)Web Sites (2004*)Web Sites (2004*)Web Sites (2004*)Web Sites (2004*)
Source : National Electronics and Computer Technology Center (NECTEC)
Remarks: *Survey of 267 government web sites during 16 January - 31 March 2004
Other Type of Interaction
% of government web sites
2010
Image map interactive/Internet GIS display
Server script
Prompt interaction byclient-side script
30 40 50 60 70 80 900
21
47
61
74
21
82
47
51
24
39
61
77
60
100
Internal Web sitesearch engine
Mail-to
General search engine
Web board
Responsive database system
FAQ
Dilivering message via e-Mail
Dynamic help tools
Data checking

Thailand ICT Indicators 200564
Figure 7.5 Type of Transaction Feature on GovernmentFigure 7.5 Type of Transaction Feature on GovernmentFigure 7.5 Type of Transaction Feature on GovernmentFigure 7.5 Type of Transaction Feature on GovernmentFigure 7.5 Type of Transaction Feature on GovernmentWeb Sites (2004*)Web Sites (2004*)Web Sites (2004*)Web Sites (2004*)Web Sites (2004*)
Source : National Electronics and Computer Technology Center (NECTEC)
Remarks: *Survey of 267 government Web sites during 16 January - 31 March 2004
Data signature
Other interchangetransaction
Forgotten password securedelivery
Username/ passwordauthentication
Log-in form
0 0.1 0.2 0.3 0.4 0.5 0.6
0.54
0.10
0.06
0.50
0.10
0.12
0.01
0.04
% of government web sites
SSL, data encryption
Online payment
Data tramsaction

National Electronics and Computer Technology Center65
104 (39%)
Figure 7.6 Security System on the Government Web SitesFigure 7.6 Security System on the Government Web SitesFigure 7.6 Security System on the Government Web SitesFigure 7.6 Security System on the Government Web SitesFigure 7.6 Security System on the Government Web Sites(2004)(2004)(2004)(2004)(2004)
Source : Government Information Technology Infrastructure (GITI),National Electronics and Computer Technology Center (NECTEC)
Remarks: *Survey of 267 government web sites during 16 January - 31 March 2004
Digital signature
No security measures
1 (0.4%)
Since security is among the most significant issue in the implementation ofe-Government, we performed an assessment of the security system as currently foundin the government web sites. The result was quite alarming. Out of 267 web sitessurveyed, 104 web sites (39%) did not have any security system implemented, 131(49%) used a simple security system, i.e., user name/password authentication, 31(12%) used a more advanced system, i.e., Secured Socket Layer (SSL), and dataencryption, and only 1 (0.4%) had imposed the strongest security measures, i.e.,digital signature for encryption and authentication (Figure 7.6).
Username/password authentication131 (49%)
SSL, data encryption31 (12%)
Apart from the security measures, we also performed an assessment of those267 government web sites on seven other criteria, for example, having responsivedatabase system, having webboard, having forms for downloaded, etc. The resultswere presented in Figure 7.7. The results confirmed the earlier findings that most websites were fairly weak in the security aspect. This suggested that more efforts need tobe put in implementing appropriate security measures to government e-services inorder to provide more confidence to both service providers and users.

Thailand ICT Indicators 200566
Figure 7.7 Main Assessment of Government Web Sites (2004)Figure 7.7 Main Assessment of Government Web Sites (2004)Figure 7.7 Main Assessment of Government Web Sites (2004)Figure 7.7 Main Assessment of Government Web Sites (2004)Figure 7.7 Main Assessment of Government Web Sites (2004)
Data Updating
SSL Data Encryption
Log-in Form
Search Engine
Responsive Database System
Webboard
Download Form
Bilingual Content
Unit: No. of government web sites
Source: Government Information Technology Infrastructure (GITI),National Electronics and Computer Technology Center (NECTEC)
242
31
145158
171
198 164
137

National Electronics and Computer Technology Center67
5,000
Million baht
4,500
4,000
3,500
3,000
2,500
2,000
1,500
1,000
500
0 Year
û02* û03
Figure 7.8 Value of Government e-Auction (2002-2004)Figure 7.8 Value of Government e-Auction (2002-2004)Figure 7.8 Value of Government e-Auction (2002-2004)Figure 7.8 Value of Government e-Auction (2002-2004)Figure 7.8 Value of Government e-Auction (2002-2004)
0.6
Government AgenciesState enterprises
966.3
3,940.9
1,225.0
û04**
44.8
176.0
Source: The Comptroller General’s Department
Remarks: *Project started October 2002**as of March 2004
The 9th National Economic and Social Development Plan called for an increasedprovision of government services through ICT. To this end, the cabinet issued ameasure on October 1, 2002 emphasizing that online procurement must beimplemented in all government agencies. The target is to acheive the e-Procurementtransaction value of 100,000 million baht by 2006. According to Figure 7.8, thetransacation value in 2003 was approximately 5,000 million baht, or around 5% of thetarget set for the year 2006.

Thailand ICT Indicators 200568
ICT Human ResourcesEEEEEducation plays a large part in building up the human capital. At present, the
framework of education system in Thailand is based on the 1997 Constitution and the1999 National Education Act, which provide principles and guidelines for the provisionand development of the Thai education to prepare all Thais for the learning society.
In 2003, there was around 18.6 million school-age population, of which 14.2million were actually enrolled in formal education. The gross enrollment rate for theyear 1999 to 2003, at each level is presented in Table 8.1. In general, there was aslight decline in enrollment from the year 2002 to 2003.
Table 8.1 Gross Enrollment RatioTable 8.1 Gross Enrollment RatioTable 8.1 Gross Enrollment RatioTable 8.1 Gross Enrollment RatioTable 8.1 Gross Enrollment Ratio
1999 2000 2001 2002 2003
Pre-primary 96.2 95.7 93.1 90.6 87.7
Primary 102.3 103.2 103.8 104.8 104.4
Secondary 68.7 69.7 70.6 71.2 71.7
Lower secondary 83.4 82.8 82.2 82.2 84.6
Upper secondary 55.3 57.4 59.3 60.1 58.5 - General 33.2 36.7 38.9 38.8 37.5 - Vocational 22.1 20.7 20.4 21.3 21
Higher education* 22.5 23.7 26.1 42.9 29.5
Source: Office of the Educational Council (OEC), Ministry of EducationRemarks: Exclude students in open universities
VIII

National Electronics and Computer Technology Center69
There was an increase in the number of graduates from 154,381 in 1999 to190,765 in 2001. However, the majority of graduates were from the field of socialsciences, with the ratio of science and technology graduates to social sciencesgraduates at 31:69 (Figure 8.1). Currently, there are no data on the number ofgraduates in ICT field. The problem centered around the “obscure” boundary of whatmight be considered as “ICT courses/curriculum” due to the rapid evolution of thetechnology itself. In addition to traditional field of computer science, computerengineering and telecommunications engineering, there is a proliferation of appliedcourses such as business computing and e-Commerce which may have been classifiedby some school as “ICT-related” programs.
Figure 8.1 Number of Science and Technology Graduates vsFigure 8.1 Number of Science and Technology Graduates vsFigure 8.1 Number of Science and Technology Graduates vsFigure 8.1 Number of Science and Technology Graduates vsFigure 8.1 Number of Science and Technology Graduates vsSocial Sciences Graduates (1999-2001)Social Sciences Graduates (1999-2001)Social Sciences Graduates (1999-2001)Social Sciences Graduates (1999-2001)Social Sciences Graduates (1999-2001)
Science and Technology
’00’99
Social Sciences
’01Year
20,000
47,221
40,000
60,000
80,000
100,000
120,000
140,000
53,487
0
107,160
61,439
118,644
129,326
Source: Thailand Science and Technology Profile 2004,National Science and Technology Development Agency
Graduates

Thailand ICT Indicators 200570
ICT WorkforceICT WorkforceICT WorkforceICT WorkforceICT Workforce 20012001200120012001 20022002200220022002 20032003200320032003
%%%%% %%%%% %%%%%
Highly-skilled JobHighly-skilled JobHighly-skilled JobHighly-skilled JobHighly-skilled Job 76,51476,51476,51476,51476,514 27.127.127.127.127.1 68,56768,56768,56768,56768,567 22.622.622.622.622.6 77,52977,52977,52977,52977,529 24.224.224.224.224.2
Computer 21,099 7.5 19,888 6.6 20,241 6.3professional
Computer-related 17,736 6.3 16,247 5.4 21,795 6.8personnel
Optometry and 37,679 13.3 32,432 10.7 35,493 11.1electronicspersonnel
Low-skilled JobLow-skilled JobLow-skilled JobLow-skilled JobLow-skilled Job 206,084206,084206,084206,084206,084 72.972.972.972.972.9 234,501234,501234,501234,501234,501 77.477.477.477.477.4 242,519242,519242,519242,519242,519 75.875.875.875.875.8
Electrical and 206,084 72.9 234,501 77.4 242,519 75.8electronicstechnicians
TotalTotalTotalTotalTotal 282,598282,598282,598282,598282,598 100.0100.0100.0100.0100.0 303,068303,068303,068303,068303,068 100.0100.0100.0100.0100.0 320,048320,048320,048320,048320,048 100.0100.0100.0100.0100.0
Source: National Statistical Office (NSO)
From the labour force survey conducted by the NSO in 2003, there wereapproximately 320,048 ICT personnel in Thailand or 9.5 ICT personnel per every 1,000workforce. However, around three quarters of those (75.8%) worked in relatively low-skilled jobs (Table 8.2).
Among ICT personnel, the Thai government has paid considerable attention tosoftware personnel. The Software Industry Promotion Agency (SIPA) speculates thatthere are currently around 30,000 software personnel in the market. The demandprojected for the year 2008 is 100,000 persons, of which educational institutions areexpected to be able to deliver approximately 40,000. Anticipating the personnelshortage, SIPA is working on the program to provide short courses and non-degreeprograms to convert non-ICT personnel into the field.
Other agencies also contribute to the development of ICT workforce and ICTliteracy in the country. For example, NECTEC offers short courses for advanced users,while Software Park Thailand organizes a number of specialized courses aiming athigh-end software developers. The Ministry of Labour has also embarked the programto train general IT knowledge for the workforce at large. The number of workforcetrained by the Ministry of Labour is one of the indicators used to monitor the progresson social capability reinforcement activity which is one strategy indicated in the currentICT Master plan.
Table 8.2 ICT Workforce (2001-2003)Table 8.2 ICT Workforce (2001-2003)Table 8.2 ICT Workforce (2001-2003)Table 8.2 ICT Workforce (2001-2003)Table 8.2 ICT Workforce (2001-2003)
No. ofNo. ofNo. ofNo. ofNo. ofPersonsPersonsPersonsPersonsPersons
No. ofNo. ofNo. ofNo. ofNo. ofPersonsPersonsPersonsPersonsPersons
No. ofNo. ofNo. ofNo. ofNo. ofPersonsPersonsPersonsPersonsPersons

National Electronics and Computer Technology Center71
Figure 8.2 Number of Workforce Attended and CompletedFigure 8.2 Number of Workforce Attended and CompletedFigure 8.2 Number of Workforce Attended and CompletedFigure 8.2 Number of Workforce Attended and CompletedFigure 8.2 Number of Workforce Attended and CompletedIT Training from the Ministry of Labour (1998-2003)IT Training from the Ministry of Labour (1998-2003)IT Training from the Ministry of Labour (1998-2003)IT Training from the Ministry of Labour (1998-2003)IT Training from the Ministry of Labour (1998-2003)
Source: Ministry of Labour
Male Female
’98 ’99 ’00 ’01 ’02 ’03
Thousand person

Thailand ICT Indicators 200572
RRRRResearch and development is a foundation for knowledge generation andinnovation, particularly in science and technology. Knowledge, in turn, is a vitalproduction factor in the development of the knowledge-based society/economy.Indicators related to research and development can be categorized into two maintypes: R&D expenditures and R&D personnel. R&D expenditures are often classifiedby (a) sector of performance or (b) source of funding. R&D personnel includereseachers, assistant researchers (or technicians) and supporting/administrative staffs.
According to the National Research Council of Thailand, Thailand spent a totalof 11,065 million baht on research and development, an equivalent to 0.22% of GDP,in 2001. Despite representing a small percentage in GDP, it was a large increase,approximately 100% from 1999 (Table 9.1).
IXResearch & Development
Table 9.1 National R&D Expenditures (1991-2001) Table 9.1 National R&D Expenditures (1991-2001) Table 9.1 National R&D Expenditures (1991-2001) Table 9.1 National R&D Expenditures (1991-2001) Table 9.1 National R&D Expenditures (1991-2001)
YearYearYearYearYear R&D expenditures R&D expenditures R&D expenditures R&D expenditures R&D expenditures (Million baht)(Million baht)(Million baht)(Million baht)(Million baht) R&D expenditures/GDP (R&D expenditures/GDP (R&D expenditures/GDP (R&D expenditures/GDP (R&D expenditures/GDP (%)%)%)%)%)
1991 3,928.05 0.16
1993 4,473.41 0.14
1995 5,174.24 0.13
1996 5,528.13 0.12
1997 4,811.23 0.10
1999 5,021.76 0.11
2001 11,065.00 0.22
Source: National Research Council of Thailand (NRCT), 2001 National Survey on R&D Expenditures and
Personnel of Thailand
Remarks: Public and Private expenditures are included

National Electronics and Computer Technology Center73
ICT R&D expenditures also experienced an impressive growth fromapproximately 108 million baht in 1997 to 406 million baht in 2001 (Table 9.3).However, it contributed only 3.68% of the total R&D expenditures in Thailand, with themajority (65%) being spent from the government sector. When looking at thedistribution of expenditures across sector during 1996-2001, some fluctuations in ratiowere observed. This might partly be a reflection in the change of methodologyinvolved. A number of semi-autonomous organizations, including the National Scienceand Technology Development Agency, which had previously been classified as publicenterprise has now been re-classified and grouped as “government” sector starting inthe year 2001. The breakdown figure, therefore, should be treated with caution.
The figures from 2001 indicate that there was a high concentration of R&Dactivities in government, whether as a sector of performance or a source of funding.Notwithstanding different data collection approach, the government budget allocationfor research and development activities for the year 2001 and 2002 also confirmedscience and technology at the top of R&D spenders.
Table 9.2 Budget Allocation for Research and Development,Table 9.2 Budget Allocation for Research and Development,Table 9.2 Budget Allocation for Research and Development,Table 9.2 Budget Allocation for Research and Development,Table 9.2 Budget Allocation for Research and Development,by Field of Research (2001-2002)by Field of Research (2001-2002)by Field of Research (2001-2002)by Field of Research (2001-2002)by Field of Research (2001-2002)
(Million baht)
Field of ResearchField of ResearchField of ResearchField of ResearchField of Research 20012001200120012001 20022002200220022002
Science and Technology 3,761.4 3,251.8
Agriculture 3,026.0 2,919.7
Education 1,302.6 1,378.9
Health 418.7 485.1
Environment 127.6 296.5
Industry 70.3 25.5
National Security 35.1 34.8
Source: National Science and Technology Development Agency (NSTDA),Thailand Science and Technology Profile 2004
Remarks: The Figure from the Budget Bureau which devises the R&D budget into 7areas.

Thailand ICT Indicators 200574
1996 1996 1996 1996 1996 19971997199719971997 19991999199919991999 2001 2001 2001 2001 2001
Government 13,971,817 34,475,062 5,983,915 266,145,661
Higher education 4,141,566 51,459,362 66,263,798 70,725,274
Public enterprise 185,415,611 15,440,991 32,567,776 9,461,79
Private enterprise 67,954,862 7,118,000 51,076,815 60,617,914
Private non-profit 8,934,088 - - -
Total 280,417,944 108,493,415 155,892,304 406,950,647
YearYearYearYearYear
Table 9.3 ICT R & D Expenditures by Sector (1996-2001)Table 9.3 ICT R & D Expenditures by Sector (1996-2001)Table 9.3 ICT R & D Expenditures by Sector (1996-2001)Table 9.3 ICT R & D Expenditures by Sector (1996-2001)Table 9.3 ICT R & D Expenditures by Sector (1996-2001)
SectorSectorSectorSectorSector
Source: National Research Council of Thailand (NRCT)
Government Higher education Public enterprise
Figure 9.1 The Ratio of ICT R&D Expenditures by SectorFigure 9.1 The Ratio of ICT R&D Expenditures by SectorFigure 9.1 The Ratio of ICT R&D Expenditures by SectorFigure 9.1 The Ratio of ICT R&D Expenditures by SectorFigure 9.1 The Ratio of ICT R&D Expenditures by Sector(1996-2001)(1996-2001)(1996-2001)(1996-2001)(1996-2001)
Private enterprise Private non-profit
’96 ’97 ’99 ’015%
66%
24%
3%
1%
32%
47%
14%
7%
0%
4%
21%
43%
33%17%
65%
2%
15%
0% 0%
Source: National Research Council of Thailand (NRCT)

National Electronics and Computer Technology Center75
Regarding R&D personnel, the National Research Council of Thailand surveyindicated that there were around 55,748 R&D personnel in 2001, of which 45% wereresearchers, 35.1% were technicians and the remaining 19.8% were supporting staffs(Table 9.4). However, the number of ICT R&D personnel was surprisingly low, ac-counted for only 1.96% of all R&D personnel. According to the survey, there were only750 researchers and 280 technicians working in ICT field in 2001. The majority (42%)were working in educational institutions (Figure 9.3).
Table 9.4 R&D Personnel Classified by Occupation andTable 9.4 R&D Personnel Classified by Occupation andTable 9.4 R&D Personnel Classified by Occupation andTable 9.4 R&D Personnel Classified by Occupation andTable 9.4 R&D Personnel Classified by Occupation andField of Research (2001)Field of Research (2001)Field of Research (2001)Field of Research (2001)Field of Research (2001)
Field of researchField of researchField of researchField of researchField of research OccupationOccupationOccupationOccupationOccupation
ResearchersResearchersResearchersResearchersResearchers Technicians/Technicians/Technicians/Technicians/Technicians/ Supporting StaffsSupporting StaffsSupporting StaffsSupporting StaffsSupporting Staffs TotalTotalTotalTotalTotalResearchResearchResearchResearchResearchAssistantsAssistantsAssistantsAssistantsAssistants
Natural sciences 2,763 1,469 413 4,645
Computer and 750 280 63 1,093communicationtechnologies
Engineering and 5,673 4,257 2,172 12,102technologies
Medical sciences 4,353 3,931 640 8,924
Agricultural sciences 5,222 3,836 6,852 15,910
Social sciences 5,296 5,004 797 11,097
Humanities 1,043 810 124 1,977
Total 25,100 19,587 11,061 55,748
Source: National Research Council of Thailand (NRCT)

Thailand ICT Indicators 200576
933
Figure 9.2 R&D Personnel in ICT Field (1996-2001)Figure 9.2 R&D Personnel in ICT Field (1996-2001)Figure 9.2 R&D Personnel in ICT Field (1996-2001)Figure 9.2 R&D Personnel in ICT Field (1996-2001)Figure 9.2 R&D Personnel in ICT Field (1996-2001)
’96
Source: National Research Council of Thailand (NRCT)
’97 ’99 ’010
100
200
300
400
500
600
700
800
900
1,000
Year
Persons
Researchers and technicians
Supporting staffs
86
241
512
144
352
50 63
1,030

National Electronics and Computer Technology Center7777777777
Private enterprise3%
Public enterprise35%
Figure 9.3 ICT R&D Researchers by Sector (2001)Figure 9.3 ICT R&D Researchers by Sector (2001)Figure 9.3 ICT R&D Researchers by Sector (2001)Figure 9.3 ICT R&D Researchers by Sector (2001)Figure 9.3 ICT R&D Researchers by Sector (2001)
Source: National Research Council of Thailand (NRCT)
Higher education42%
Private non-profit0%
Government20%
750 persons

Thailand ICT Indicators 200578
List of ContributorsList of ContributorsList of ContributorsList of ContributorsList of Contributors
AdvisorsAdvisorsAdvisorsAdvisorsAdvisors
1. Thaweesak Koanantakool
2. Chadamas Thuvasethakul
ContributorsContributorsContributorsContributorsContributors
1. Kasititorn Pooparadai
2. Orachat Leingpeboon
3. Sirintorn Chaisakda
4. Phumisak Smutkupt
5. Jiraporn Tangpoolcharoen
6. Kardsiri Kantikittikun
7. Weerawan Charoensub
8. Kunakorn Charoenwong

National Electronics and Computer Technology Center79
List Of AbbreviationsList Of AbbreviationsList Of AbbreviationsList Of AbbreviationsList Of Abbreviations
ATCI The Association of Thai Computer Industry
ATSI The Association of Thai Software Industry
B.E. Buddhist Era
BOT Bank of Thailand
BSA Business Software Alliance
CAT Telecom Plc. CAT Telecom Public Company Limited
CGD The Comptroller General’s Department,Ministry of Finance
DBD Department of Business Development,
Miinistry of Commmerce
ECRC The Electronic Commerce Resource Center, NECTEC
INA The Information Networking Association
ISP Club Internet Service Provider Club
MOC Ministry of Commerce
NECTEC National Electronics and Computer Technology Center
NESDB National Economic and Social Development Board
NRCT National Research Council of Thailand
NSO National Statistical Office, Ministry of Informationand Communication Technology
NSTDA National Science and Technology Development Agency
OEC The Office of the Education Council,Ministry of Education
SET The Stock Exchange of Thailand
T.H. NIC Thailand Network Information Center (T.H. NIC Co.,Ltd.)

Thailand ICT Indicators 200580
TOT Corporation Plc. TOT Corporation Public Company Limited
GITS Government Information Technology Services
UBC United Broadcasting Corporation
UNDP United Nations Development Programme


![ICT indicators: LIRNEasia's perspectivelirneasia.net/wp-content/uploads/2010/07/Samarajiva...ICT indicators: LIRNEasia's perspective Rohan Samarajiva ; rohan [at] lirneasia.net International](https://static.fdocuments.us/doc/165x107/5f4b65d06608e07e916cd5e8/ict-indicators-lirneasias-ict-indicators-lirneasias-perspective-rohan-samarajiva.jpg)