Thai Beverage Plcthaibev.listedcompany.com/newsroom/Inv_Jan07.pdf · The Initial Public Offering of...
20
Page 1 Investor Presentation by Richard Jones Head of Investor Relations The Initial Public Offering of shares of Thai Beverage Plc was sponsored by Deutsche Bank AG, Singapore Branch, J.P. Morgan (S.E.A) Limited Merrill Lynch (Singapore) Pte. Ltd. Thai Beverage Plc
Transcript of Thai Beverage Plcthaibev.listedcompany.com/newsroom/Inv_Jan07.pdf · The Initial Public Offering of...

Page 1Page 1
Investor Presentationby Richard Jones
Head of Investor Relations
The Initial Public Offering of shares of Thai Beverage Plc was sponsored byDeutsche Bank AG, Singapore Branch,
J.P. Morgan (S.E.A) LimitedMerrill Lynch (Singapore) Pte. Ltd.
Thai Beverage Plc

Page 2Page 2
The following presentation may contain forward looking statements by the management of Thai Beverage Public Company Limited (“ThaiBev"), relating to financial or other trends for future periods, compared to the results for previous periods.
Some of the statements contained in this presentation that are not historical facts are statements of future expectations with respect to the financial conditions, results of operations and businesses, and related plans and objectives. Forward looking information is based on management's current views and assumptions including, but not limited to, prevailing economic and market conditions. These statements involve known and unknown risks and uncertainties that could cause actual results, performance or events to differ materially from those in the statements as originally made. Such statements are not, and should not be construed as a representation as to future performance of ThaiBev. In particular, such targets should not be regarded as a forecast or projection of future performance of ThaiBev. It should be noted that the actual performance of ThaiBev may vary significantly from such targets.
Note on Forward Looking Statements

Page 3Page 3
Dividend Policy:not less than 50% of net profit after deducting all appropriated reserves
Shares outstanding 25,110 millionFree float % (approx.) 21.7%
Major shareholders• Sirivadhanabhakdi family 64%• Other private investors 8%
Market cap S$ 6.8 bn*Market cap US$ 4.4 bnMarket cap THB 158.0 bn
IPO data (billions of shares)– New shares issued 2.44445 10%– Total shares offered 4.8889 20%
• Shares for institutions 4.64446 19%• Shares for Sing retail 0.24444 1%
– Shares for over allotment 0.66558 3%(new shares)
*early DecemberSource: www.shareinvestor.com, Reuters
The average volume of THBEV from May 30 – Dec 22 = 27,061,701 shares
Volume
0
50,000,000
100,000,000
150,000,000
200,000,000
250,000,000
300,000,000
350,000,000
5/30/06 6/19/06 7/7/06 7/27/06 8/17/06 9/6/06 9/26/06 10/16/06 11/6/06 11/24/06 12/14/06
THBEV vs. STI
0.24
0.25
0.26
0.27
0.28
0.29
0.30
0.31
5/30/06 6/19/06 7/7/06 7/27/06 8/17/06 9/6/06 9/26/06 10/16/06 11/6/06 11/24/06 12/14/06
0
500
1,000
1,500
2,000
2,500
3,000
3,500
THBEV STI
THB : SGD 1 23.7Net Profit (M) (6 months '06) 5,109Baht Unaprop. RE (M) (6 months '06) 17,484Baht Number of Shares (M) 25,110Interim Dividend (M) 2,762Baht Portion of Net Profit 54%
Per share 0.11Baht Per share SGD 0.005
Share close SGD 0.285Dividend Yield (per annum) 3.26%

Page 4Page 4
Company Strategies
? Manage the marketing mix and control the pricing of individual brands
? Expand into new profitable segments by launching higher margin products in higher priced segments (premiumization)
? Continue investing in our existing brands through integrated marketing communications and ongoing premiumization
? Leverage our existing infrastructure and extensive distribution network
? establish a platform for international expansion
Maintain market leadership
Expand into new profitable segments
Continue brand investment
Leverage infrastructure and distribution network
Establish platform for international expansion

Page 5Page 5
The Keys to Our Growth
? Extensive distribution network to
400,000 points of sale
? The extensive range of our
distribution channels gives us the
opportunity to deliver newer
products faster to the market
? 17 distilleries nationwide are a
threat to new entrants
ThaiBev
>2,600 Agents
470 Exclusive Agents
>2,130 Non-exclusive Agents
>900 Direct Sales
Modern trade/hospitality
>400,000 points of sales

Page 6Page 6
Financials
Employee Cost as % of Total Revenue
3.58%4.02%
4.31%
2003 2004 2005* EBIT = Earning before Interest Expense and Tax
* EBITDA = Earning before Interest Expense, Tax, Depreciation and Amortization
Source: IPO Prospectus and Company’s Consolidated Financial Statements (Thai GAAP)
(Btmn) 2003 2004 2005 Q1/2006 Q2/2006 Q3/2006Revenues from sales 91,630 90,126 92,091 22,732 23,900 20,745 - Beer 52,085 47,749 42,264 10,791 11,970 9,996 - Spirits 38,713 42,189 49,910 12,034 12,072 10,896
COGS 66,830 63,603 63,143 15,669 17,163 14,616% of sales 73% 71% 69% 69% 72% 70%
SG&A 11,173 11,115 12,517 3,031 2,775 2,782% of sales 12% 12% 14% 13% 12% 13%
Gross Profits 24,800 26,523 28,948 7,064 6,737 6,129EBIT 15,182 15,901 16,718 4,066 4,013 3,384EBITDA 19,293 20,195 21,000 5,109 5,189 4,449Net profit 6,928 10,417 10,409 2,565 2,544 2,285
Margin - Gross Profits 27% 29% 31% 31% 28% 30% - EBIT 17% 18% 18% 18% 17% 16% - EBITDA 21% 22% 23% 22% 22% 21% - Net Profit 8% 12% 11% 11% 11% 11%
Cash Flow 9 mths/06 - Operating Cash Flow 23,454 15,152 28,463 7,120 - CAPEX (3,061) (3,071) (7,220) (2,359) - Free Cash Flow 20,393 12,081 21,243 4,761
Total Assets 91,506 89,121 81,211 81,325 81,010 80,840Equity and Minority 24,936 33,363 31,366 28,626 47,194 51,009Net debt 53,015 46,241 37,136 35,671 22,139 21,097Net debt/Equity 2.13 1.39 1.18 1.25 0.47 0.41

Page 7Page 7
Major Beer Brands on Sale in Thailand
Beer Brands 2005 Share (by volume)Premium Standard Economy
Brands Producer % Share Brands Producer % Share Brands Producer % ShareHeineken Thai Asia Pacific 69.6 Singha Boonrawd 95.1 Chang ThaiBev 63.9
Asahi Boonrawd 1.4 Tiger Thai Asia Pacific 3.6 Leo Boonrawd 34.9Kloster Boonrawd 1.3 Blue Ice San Miguel 1.3 Cheers Thai Asia Pacific 0.4Corona CVS Syndicate 0.2 Archa ThaiBev 0.4Others 27.5 Red Horse San Miguel 0.3
Thai Beer Boonrawd 0.2
Sector Volume ('000 HL) 1,311 1,727 14,252Sector Volume as % of total market 8% 10% 82%
Market Share 2005
ThaiBev 53%Boonrawd 39%Thai Asia Pacific 6%
Source: Canadean, The Beer Service Annual Report - 2006 Cycle, Thailand

Page 8Page 8
Beer
Chang Chang Light Chang Draught Archa
Alcohol Content 6.4% 4.2% 5.0% 5.4%
Positioning Economy(Rural)
Upper Economy/Standard(Urban)
Light Economy(Urban)
Light Economy(Urban)
Price / Bottle Bt 33-35 / 640ml Bt 40 / 640ml Bt 35-38 / 640ml Bt 33-35 / 640ml
Key Competitors Singha / Singha Light/ Heineken
Leo / Singha Leo Leo

Page 9Page 9
Beer Sales
* EBIT = Earning before Interest Expense and Tax
* EBITDA = Earning before Interest Expense, Tax, Depreciation and Amortization
Source: IPO Prospectus and Company’s Consolidated Financial Statements (Thai GAAP)
(in million Baht) 2003 2004 2005 Q1/2005 Q1/2006 Q2/2005 Q2/2006 Q3/2005 Q3/2006Revenue from Beer sales 52,085 47,749 42,264 10,539 10,791 10,665 11,970 9,275 9,996Interest income 28 11 9 18 0 5 6 2 3Other income 214 307 141 11 10 40 11 82 9Total Beer revenues 52,327 48,067 42,414 10,568 10,801 10,710 11,988 9,359 10,009
Cost of sales 39,641 36,847 32,544 8,341 8,186 7,975 9,193 7,260 7,718 Selling and administrative expenses 4,970 4,580 6,954 1,635 1,548 1,846 1,653 1,692 1,467
EBIT 7,716 6,640 2,917 592 1,067 889 1,142 407 824EBITDA 9,559 8,587 4,835 1,071 1,535 1,374 1,614 885 1,298
Interest expense 295 285 350 93 89 117 61 82 49 Income tax expense 1,938 1,704 1,332 307 455 312 495 231 393 Net profit 5,483 4,651 1,235 192 523 459 586 94 381
CoS as % of rev 76% 77% 77% 79% 76% 75% 77% 78% 77%S&A as % of rev 10% 10% 16% 16% 14% 17% 14% 18% 15%Net profit margin 11% 10% 3% 2% 5% 4% 5% 1% 4%Gross profit margin 24% 23% 23% 21% 24% 25% 23% 22% 23%EBIT Margin 15% 14% 7% 6% 10% 8% 10% 4% 8%EBITDA Margin 18% 18% 11% 10% 14% 13% 13% 10% 13%

Page 10Page 10
Cost Structure and Beer Volume9 mths/06
(% of sales)
Source: Q3/06 Financial Statements
Beer Sales Volumes(m liters)
944824
591 648
1,041
2003 2004 2005 9 mths/05 9 mths/06
* Sales volumes for domestic and export
Raw Material, 5.7%
Depreciation, 2.8%
Labor, 0.7%
Other, 2.2%
Excise Tax, 52.8%
SG&A, 14.2%
Int. + Inc. Tax, 4.7%
Net profit, 4.6%
Packaging, 12.3%

Page 11Page 11
Major Spirit Brands on Sale in Thailand
Spirits Brands 2005 Share (by volume)Local white spirits Local brown spirits, admixes Scotch whisky Premium imported spirits
Brands Producer % Share Brands Producer % Share Brands Producer % Share Brands Producer % ShareRuang Khao Thaibev 74% Sangsom Thaibev 48% 100 Pipers Pernod Ricard 77% JW Black Pernod Ricard 24%Pai Thong Thaibev 5% Mungkorn Thong Thaibev 15% JW Red Pernod Ricard 5% Chivas Regal Pernod Ricard 9%
Chinese Herbal Thaibev 2% Mekhong Thaibev 8% Spey Royal Pernod Ricard 6% Other 67%Community Producers 18% Crown 99 Thaibev 3% Other 12%
Master Blend Pernod Ricard 5%Singha Haraj The United Products 2%
Other 20%
Sector Volume ('000 9 Litre Cases) 51,000 18,211 3,490 838 Sector Volume as % 69% 25% 5% 1%
Market Share 2005
ThaiBev 75%Others 19%Pernod Ricard 6%
Source: Canadean, The Spirits Service Annual Report - 2006 Cycle, Thailand

Page 12Page 12
SpiritsBlue
? Admix whisky made from quality imported malt from Scotland
? Bt 200/700ml
Crown 99
Existing White Spirit portfolio has limited brand differentiation Launching Niyomthai to Establish a National brand of White Spirits
? Regional based
? Limited brand recognition
? National Brand
? Utilization improvement opportunity
? Higher margins
Pai-ThongRuang Khao Chiang-Chun Sua Dum
Niyomthai
30° 35° 40°
Many white spirit products with no established branding
SangsomMungkorn Thong Mekhong Hong Thong
? Repackaged, revamped and relaunched Hong Thong
? Bt 150/700ml
Blend 285
? New choice to admix to tap low end scotch segment
? Bt 260/700ml
? Sangsom to be introduced in gift boxes
? Bt 190/700ml? Bt 115/ 750 ml ? Bt 135/750 ml
? Quality blended spirits
? Bt 170/700ml

Page 13Page 13
Spirits Sales
* EBIT = Earning before Interest Expense and Tax
* EBITDA = Earning before Interest Expense, Tax, Depreciation and Amortization
Source: IPO Prospectus and Company’s Consolidated Financial Statements (Thai GAAP)
(in million Baht) 2003 2004 2005 Q1/2005 Q1/2006 Q2/2005 Q2/2006 Q3/2005 Q3/2006Revenue from Spirits sales 38,713 42,189 49,910 12,319 12,034 12,030 12,072 11,714 10,896Interest income 447 6 42 1 0 9 8 0 4Other income 495 172 104 20 28 30 28 34 24Total Spirits Revenues 39,655 42,367 50,056 12,340 12,062 12,069 12,108 11,748 10,924
Cost of sales 26,339 26,090 29,920 7,084 7,353 7,378 7,730 7,008 6,906Selling and administrative expenses 6,420 7,031 6,656 1,453 1,675 1,398 1,511 1,602 1,542
EBIT 6,897 9,246 13,479 3,803 3,035 3,293 2,867 3,138 2,477EBITDA 8,964 11,391 15,618 4,329 3,556 3,825 3,395 3,677 3,010
Interest expense 2,488 1,401 1,144 267 320 223 342 281 169Income tax expense 1,203 2,609 3,249 1,101 587 809 515 721 450Net profit 3,205 5,236 9,086 2,436 2,128 2,261 2,010 2,136 1,858
CoS as % of rev 68% 62% 60% 58% 61% 61% 64% 60% 63%S&A as % of rev 17% 17% 13% 12% 14% 12% 13% 14% 14%Net profit margin 8% 12% 18% 20% 18% 19% 17% 18% 17%Gross profit margin 32% 38% 40% 42% 39% 39% 36% 40% 37%EBIT Margin 18% 22% 27% 31% 25% 27% 24% 27% 23%EBITDA Margin 23% 27% 31% 35% 30% 32% 28% 31% 28%

Page 14Page 14
Cost Structure and Spirit Volume9 mths/06
(% of sales)
Source: Q3/06 Financial Statements
38,617 39,188 41,387
29,51130,083
11,4699,204
7,0189,467
12,547
2003 2004 2005 9 mths/05 9 mths/06
White spirits Brown spirits
Depreciation, 2.1%
Labor, 1.1%
Other, 1.7%
Raw Material, 4.8%
Excise Tax, 47.7%
SG&A, 13.5%
Int. + Inc. Tax, 6.8%
Net profit, 17.1%
Packaging, 5.2%
Sales volumes2003 2004 2005 9 mths/05 9 mths/06
White spirits 80.8% 77.4% 76.7% 76.1% 80.8%Brown spirits 19.2% 22.6% 23.3% 23.9% 19.2%
(‘000 cases)

Page 15Page 15
Product Ad Valorem Rate(Ex-factory) Unit Bt/Unit
Fermented Liquor: Beer 55% Liter of pure alcohol 100 Wine & Sparkling wine from grapes 60% Liter of pure alcohol 100 Local fermented liquor 25% Liter of pure alcohol 70 Other 25% Liter of pure alcohol 70Distilled Liquor White spirits 25% Liter of pure alcohol 70 Compounded spirits (Hong, Mungkorn , Chinese Herb) 50% Liter of pure alcohol 240 Blended spirits (Mekhong) 50% Liter of pure alcohol 400Special spirits Brandy 40% Liter of pure alcohol 400 Whisky 50% Liter of pure alcohol 400 Other (Sang Som, Crown99, Blue) 50% Liter of pure alcohol 400Ethyl Alcohol: used in industry 2% Liter 1 used in medicine, pharmaceuticals, science 0.10% Liter 0.05 other 10% Liter of pure alcohol 6
Specific Rate
+ Municipal Taxes: 10% of Excise + Health Promotion Fund Contribution: 2% of Excise
Taxes are the Company’s Largest Cost
The Company will be charged at whichever rate is higher.

Page 16Page 16
CAPEX & Cost StructureCurrent total beer production capacity is 1,090 mm L and will be 1,550 mm L after the expansion of Khamphaeng Phet is completedWe also produce soda and water at these facilities; the combined capacity is 700 mm L per yearMost of the 7.2 bn Bt CAPEX for Khamphaeng Phet has been spent
Current total beer production capacity 1090 mm L Capacity of ThaiBev Breweries (mn L/pa)
Current total soda & water production capacity 700 mm L Bang Ban 530
Current total spirit production capacity 790 mm L Kamphaengphet 440 and 460 mn L additional expansion in 2007
Wang Noi 120
Source: IPO Prospectus
Planned capex to 2007 Billion BahtKamphaeng Phet 7.2 Biogas (water treatment system) 0.9 Bang Ban water filttration system 0.8
Sangsom packaging lines 0.8 Distilleries' packaging lines 0.3 Glass bottle recycle terminal 0.5 Cosmos Brewery water filtration system 0.1
10.6
9 mths/06(in million Baht) Beer/water Spirits Alcohol Related Total
Gross capital expenditure- Fixed assets 959.2 1,333.0 53.2 13.6 2,359.0- Intangible assets 4.1 5.0 0.2 0.5 9.7Depreciation 1,412.7 1,563.0 90.2 73.4 3,139.3Amortisation 1.5 19.4 0.1 122.8 143.8
(in million Baht)Capital Expenditure (Bt mm) 2003 2004 2005 2006 (F) 2007 (F)Beer and Water 661 1,553 6,389 1,841 593 Spirits 1,987 1,019 400 2,582 1,176 Alcohol/Related 413 499 432 523 150 Total 3,061 3,071 7,220 4,946 1,918 Operating Cash Flow (Bt mm) 23,454 15,152 28,463 N/A N/A
Source: Q3/06 Financial Statements

Page 17Page 17
Industrial Alcohol & Others
Source: IPO Prospectus and Company’s Consolidated Financial Statements (Thai GAAP)
Ind. Alcohol as % Total Rev.
0.9%
0.3%0.6%
2.4%
0.8%0.7%
2003 2004 2005 Q1/06 Q2/06 Q3/06
(million litres) 2003 2004 2005 Q1 2006 Q2 2006 Q3 2006Ethyl alcohol of 95 degrees 55.95 57.56 32.18 0.65 0.41 0.21Ethanol of 99.5 degrees - 4.16 20.78 3.00 5.08 19.36Acetic acid - - 0.19 0.08 - 0Ethyl acetate - - 0.05 0.04 0.04 0.04
Total 55.95 61.72 53.20 3.77 5.53 19.61
Page 18Page 18
International Sales
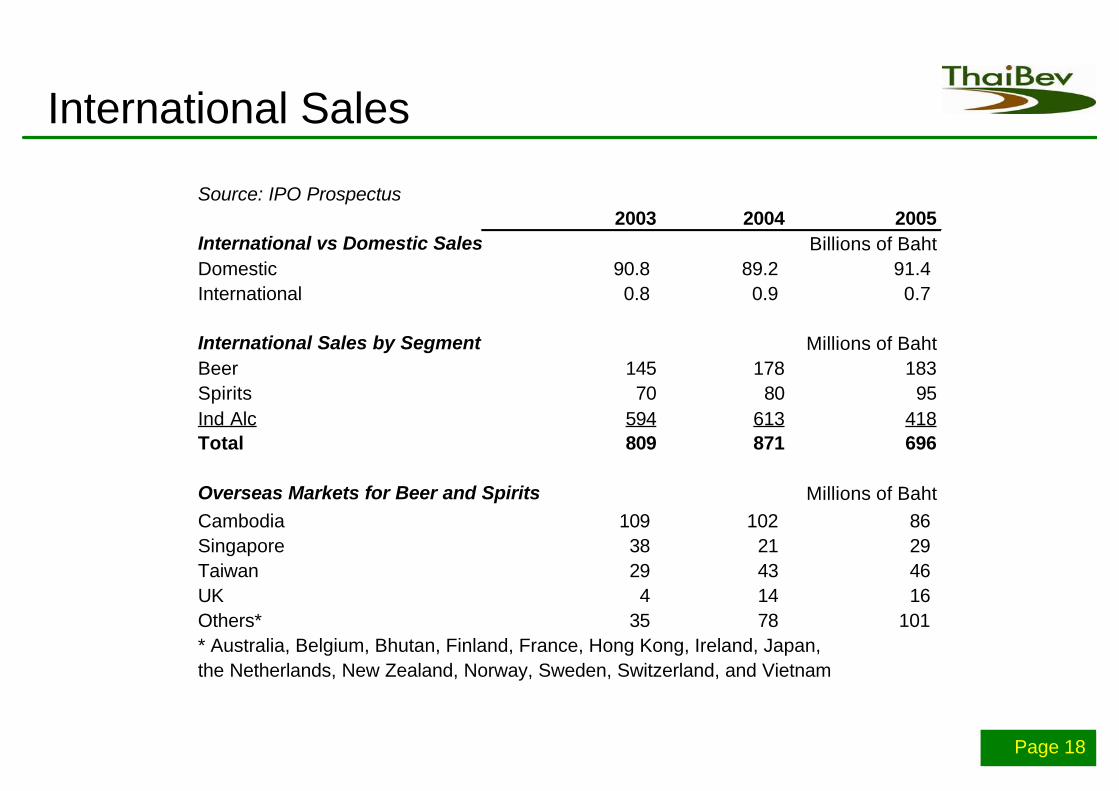
Source: IPO Prospectus 2003 2004 2005
International vs Domestic Sales Billions of BahtDomestic 90.8 89.2 91.4International 0.8 0.9 0.7
International Sales by Segment Millions of BahtBeer 145 178 183Spirits 70 80 95Ind Alc 594 613 418Total 809 871 696
Overseas Markets for Beer and Spirits Millions of BahtCambodia 109 102 86 Singapore 38 21 29 Taiwan 29 43 46 UK 4 14 16 Others* 35 78 101 * Australia, Belgium, Bhutan, Finland, France, Hong Kong, Ireland, Japan, the Netherlands, New Zealand, Norway, Sweden, Switzerland, and Vietnam

Page 19Page 19
Seasonal Sales: Look at Long Term Growth as Quarters can be Misleading
232
173208205
11.5
8.5
10.210.1
0
50
100
150
200
250
300
350
Q1 Q2 Q3 Q40
2
4
6
8
10
12
Volume Value
(mm L) (Bt bn)
Beer Domestic Sales 2005 Spirit Domestic Sales 2005
129
117118120
13.811.71212.2
50
70
90
110
130
150
170
Q1 Q2 Q3 Q402468
10121416
Volume Value
? Q3 is the slowest period of the year because of the rainy season and the Buddhist Lent period? Q4 is the best period of the year because of the kind weather (cold and dry), many holidays (Loy Kratong,
King’s birthday, New Year), and end of the Buddhist Lent period
(mm L) (Bt bn)

Page 20Page 20
New Generation of ManagementDirector and Senior Vice President ThaiBev - Mr. Ueychai Tantha-Obhas- Former Chief Executive Officer and the Managing Director of Riche Monde (Bangkok) Ltd.- Former Managing Director of Sarin Property Co., Ltd., - Former Group Product Manager of Colgate Palmolive Co., Ltd.
President and CEO InterBev Group - Barrie Jackson- 25 years in the international beverage business. - Former Group Director with The Edrington Group, responsible for global sales, marketing and group strategy, building The Famous
Grouse, Macallan and Cutty Sark brands. - Five years as Director of Maxxium Worldwide BV (international distribution arm of Remy Cointreau, V & S); brands included Absolut, Jim
Beam and TEG. - Two years as Maxxium Group Chairman.
Chief Financial Officer InterBev Group - Michael Chye- More than 20 years experience in accounting, finance and investments in Asia. - Worked for the Singapore Government and multi-national companies before joining the TCC Group. - Former independent director and Audit Committee Chairman of public listed companies in Singapore.
President InterBev USA Inc - John Lennon- 22 years in the international beverage industry. - Former President and CEO of Pyramid Breweries, a U.S. craft beer producer. - Former President and CEO of Beck’s North America. - Former VP and General Manager of Guinness Caribbean and Latin America. - Senior marketing and sales roles with Mexico’s FEMSA Cerveza, Grand Metropolitan (now Diageo) and with Guinness in both the USA
and Ireland.