Th F t B l t th Ed t dThe Future Belongs to the Educatedpdf.leeazmail.com/pdfs/CC Team/Michael...
113
Th F t B l t th Ed td Th F t B l t th Ed td The F uture Belongs to the Educated The F uture Belongs to the Educated ASU Education Innovation Summit Phoenix ASU Education Innovation Summit Phoenix April 16, 2012 April 16, 2012 Michael Milken Chairman, Milken Institute Michael Milken Chairman, Milken Institute
-
Upload
truongkhanh -
Category
Documents
-
view
215 -
download
0
Transcript of Th F t B l t th Ed t dThe Future Belongs to the Educatedpdf.leeazmail.com/pdfs/CC Team/Michael...

Th F t B l t th Ed t dTh F t B l t th Ed t dThe Future Belongs to the EducatedThe Future Belongs to the Educated
ASU Education Innovation SummitPhoenix
ASU Education Innovation SummitPhoenix
April 16, 2012April 16, 2012
Michael MilkenChairman, Milken Institute
Michael MilkenChairman, Milken Institute

“A k t h t “A k t h t “Ask not what your country can do for “Ask not what your country can do for
you, but what you can do for your country.”
you, but what you can do for your country.”y y
John F Kennedy
y y
John F KennedyJohn F. Kennedy1961 Inaugural
John F. Kennedy1961 Inaugural

Humanity’s Top 10 Humanity’s Top 10 Problems for Next 50 YearsProblems for Next 50 Years
• Democracy• Disease• Education
• Democracy• Disease• EducationEducation• Energy• Environment
Food
Education• Energy• Environment
Food• Food• Population• Poverty
• Food• Population• Poverty• Terrorism & War• Water• Terrorism & War• Water

Humanity’s Top 10 Humanity’s Top 10 y pProblems for Next 50 Years
y pProblems for Next 50 Years
EducationEducation• Education• Energy• Education• Energygygy
Nobel Laureates in Nobel Laureates in Nobel Laureates in Science/Medicine
Nobel Laureates in Science/Medicine

Humanity’s Top 10 Humanity’s Top 10 Solutions for Next 50 YearsSolutions for Next 50 Years
DD Ed tiEd ti• Democracy• Disease• Education
• Democracy• Disease• Education
• Education• Education• Education
• Education• Education• Education
• Energy• Environment• Food
• Energy• Environment• Food
• Energy• Energy• Energy
• Energy• Energy• Energy• Food
• Population• Poverty
T i & W
• Food• Population• Poverty
T i & W
• Energy• Education• Education
Ed ti
• Energy• Education• Education
Ed ti• Terrorism & War• Water• Terrorism & War• Water
• Education• Energy• Education• Energy

The World’s Top 10 Economies(P t f W ld GDP)
The World’s Top 10 Economies(P t f W ld GDP)
U.S. (23.6%)U.S. (23.6%)TodayToday
(Percent of World GDP)(Percent of World GDP)
China (18.7%) China (18.7%) 20502050 18201820
China (28.7%) China (28.7%) U.S. (23.6%)China (8.7%) Japan (8.6%) Germany (5 2%)
U.S. (23.6%)China (8.7%) Japan (8.6%) Germany (5 2%)
China (18.7%) U.S. (16.5%) India (11.8%)Brazil (4 8%)
China (18.7%) U.S. (16.5%) India (11.8%)Brazil (4 8%)
China (28.7%) India (16.0%)France (5.4%) England (5 2%)
China (28.7%) India (16.0%)France (5.4%) England (5 2%) Germany (5.2%)
France (4.4%) U.K. (3.6%)
Germany (5.2%)France (4.4%) U.K. (3.6%)
Brazil (4.8%)Indonesia (3.5%)Japan (3.1%)
Brazil (4.8%)Indonesia (3.5%)Japan (3.1%)
England (5.2%) Prussia (4.9%) Japan (3.1%)
England (5.2%) Prussia (4.9%) Japan (3.1%)
Italy (3.4%) Brazil (3.1%)Canada (2.6%)
Italy (3.4%) Brazil (3.1%)Canada (2.6%)
Mexico (3.0%)Russia (2.7%) Germany (2.4%)
Mexico (3.0%)Russia (2.7%) Germany (2.4%)
Austria (1.9%)Spain (1.9%) U.S. (1.8%)
Austria (1.9%)Spain (1.9%) U.S. (1.8%) Canada (2.6%)
Russia (2.4%)Canada (2.6%)Russia (2.4%)
Sources: World Bank/Angus Maddison, “The World Economy: Historical Statistics” (OECD)/PricewaterhouseCoopers/Milken Institute/Goldman Sachs (9/09)
Germany (2.4%)U.K. (2.2%)Germany (2.4%)U.K. (2.2%)
U.S. (1.8%) Russia (1.7%)U.S. (1.8%) Russia (1.7%)

The World’s Economic Clout Moves EastThe World’s Economic Clout Moves EastLeading Cities Ranked by GDPLeading Cities Ranked by GDP
• More than 20 of the world’s Top 50 cities will be located in Asia by 2025, up from 8 in 2007.
• More than 20 of the world’s Top 50 cities will be located in Asia by 2025, up from 8 in 2007.
• More than half of Europe’s Top 50 cities will drop off the list, as will three in North America.
• More than half of Europe’s Top 50 cities will drop off the list, as will three in North America.
• Shanghai and Beijing will outrank Los Angeles and London … Mumbai and Doha will surpass Munich and Denver
• Shanghai and Beijing will outrank Los Angeles and London … Mumbai and Doha will surpass Munich and DenverDenver.Denver.
Source: McKinsey Global Institute (March 2011)

Where U.S. Immigrants Were BornWhere U.S. Immigrants Were Born
Asia 5%Latin19601960
Oth
gg20112011
Asia 5%LatinAmerica
9%
Other 1%
Canada 2%Other 4%
Canada10%
Asia28%
Europe75% Latin America
53%

iiThe future of any nation can be found in its classrooms.
The future of any nation can be found in its classrooms.be found in its classrooms.be found in its classrooms.
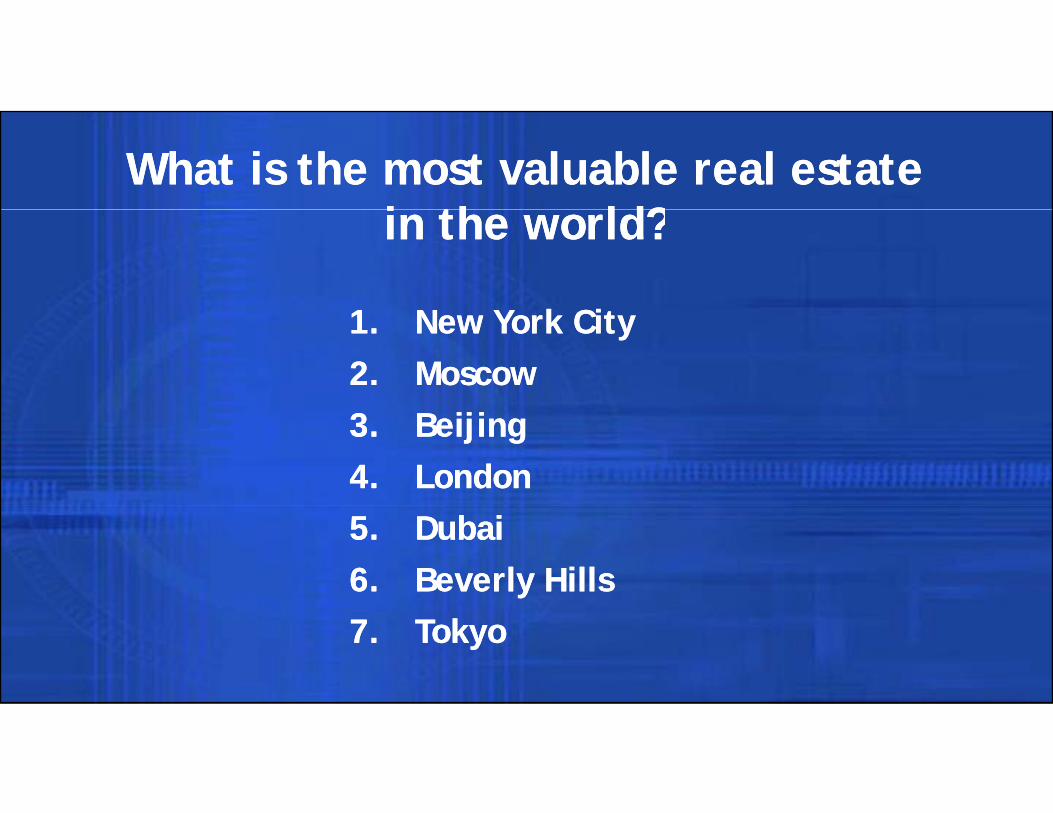
What is the most valuable real estate i th ld?
What is the most valuable real estate i th ld?in the world?in the world?
kk1. New York City2. Moscow1. New York City2. Moscow3. Beijing4. London3. Beijing4. London5. Dubai6. Beverly Hills5. Dubai6. Beverly Hills7. Tokyo7. Tokyo

What is the most valuable real estate in the ld?
What is the most valuable real estate in the ld?world?world?

1957 America
Computer Storage: $2 million per megabyte
Computer Storage: $2 million per megabyte$2 million per megabyte$2 million per megabyte

IBM System 370/168 in 1976IBM System 370/168 in 1976IBM System 370/168 in 1976IBM System 370/168 in 1976
• 8 megabytes for$8 million
• 8 megabytes for$8 million$
• Cost per megabyte:
$
• Cost per megabyte:p g y$1 million
p g y$1 million

Apple iPad 2Apple iPad 2Apple iPad 2Apple iPad 2
• 64 gigabytes for $699• 64 gigabytes for $699
• Cost per megabyte: $0 01
• Cost per megabyte: $0 01$0.01$0.01

1957 America
International Phone Call:$12/Minute
International Phone Call:$12/Minute~$12/Minute~$12/Minute

Cost of a 1-Minute Phone Call from the Cost of a 1-Minute Phone Call from the U.S. to IndiaU.S. to India
1975$101975$10
20122012$.01$.01
Telecommunications cost to business Telecommunications cost to business Telecommunications cost to business approaches zero.
Telecommunications cost to business approaches zero.

There are more than 6 billion There are more than 6 billion There are more than 6 billion mobile phones in the world!
There are more than 6 billion mobile phones in the world!

Down on the FarmDown on the FarmDown on the FarmDown on the Farm


Blockbuster vs. Netflix - 2002Blockbuster vs. Netflix - 2002Market ValueMarket Value
BlockbusterBlockbuster$4.5 billion$4.5 billion28 Netflix = 1 Blockbuster $$
Netflix$0 16 billion
Netflix$0 16 billion$0.16 billion$0.16 billion

Blockbuster vs. Netflix Blockbuster vs. Netflix Market ValueMarket Value
Netflix$16 billionNetflix$16 billion$16 billion
7/13/2011
$16 billion
7/13/20114/16/2012
7/13/20117/13/2011BlockbusterBlockbuster
$0$0Netflix
$5 6 billion $0$0$5.6 billion

The Future Belongs to the EducatedThe Future Belongs to the EducatedThe Future Belongs to the EducatedThe Future Belongs to the Educated
• Democratization of Capital
• Building Human Capital
• Democratization of Capital
• Building Human Capital• Building Human Capital
• Where’s Sputnik?
• Building Human Capital
• Where’s Sputnik?
• Education is the Answer• Education is the Answer

B k lBerkeley19641964

Los Angeles Under SiegeLos Angeles Under Siege

P=ΣFti*(ΣHCi+ΣSCi+ΣRAi)P=ΣFti*(ΣHCi+ΣSCi+ΣRAi)P ΣFti (ΣHCi ΣSCi ΣRAi)P ΣFti (ΣHCi ΣSCi ΣRAi)P = ProsperityP = Prosperityp yFt = Financial TechnologyHC = Human Capital
p yFt = Financial TechnologyHC = Human CapitalpSC = Social CapitalRA = Real Assets
pSC = Social CapitalRA = Real Assets

What makes America great?What makes America great?gg

Barn RaisingBarn Raisinga a s ga a s g

Volunteer Fire DepartmentVolunteer Fire DepartmentVolu tee e epa t e tVolu tee e epa t e t

National ParksNational ParksNat o al a sNat o al a s

Universal EducationUniversal EducationU ve sal ducat oU ve sal ducat o

P=ΣFti*(ΣHCi+ΣSCi+ΣRAi)P=ΣFti*(ΣHCi+ΣSCi+ΣRAi)P ΣFti (ΣHCi ΣSCi ΣRAi)P ΣFti (ΣHCi ΣSCi ΣRAi)P = ProsperityP = Prosperityp yFt = Financial TechnologyHC = Human Capital
p yFt = Financial TechnologyHC = Human CapitalpSC = Social CapitalRA = Real Assets
pSC = Social CapitalRA = Real Assets

“The most important financial innovation that I have seen the past 20 years is the automatic teller machine I wish someone
“The most important financial innovation that I have seen the past 20 years is the automatic teller machine I wish someone automatic teller machine…I wish someone would give me one shred of neutral evidence that financial innovation leads to
automatic teller machine…I wish someone would give me one shred of neutral evidence that financial innovation leads to evidence that financial innovation leads to economic growth. One shred of evidence.”evidence that financial innovation leads to economic growth. One shred of evidence.”
Paul VolckerFormer Chairman, Federal Reserve
Paul VolckerFormer Chairman, Federal Reserve

“A country does not go bankrupt.”“A country does not go bankrupt.”
Walter WristonWalter Wriston—Walter WristonFormer CEO of Citibank
—Walter WristonFormer CEO of Citibank
Source: New York Times, September 14, 1982.

Sovereign Debt DefaultsSovereign Debt DefaultsSovereign Debt DefaultsSovereign Debt DefaultsArgentinaArgentina EcuadorEcuador ParaguayParaguay RomaniaRomania TurkeyTurkey UruguayUruguay
18301830 18321832 18271827 18761876 1876187619151915•• 18301830•• 18901890•• 19151915
•• 18321832•• 18681868•• 19111911
•• 18271827•• 18741874•• 18921892
••18761876••19151915••19401940
•• 18761876•• 18911891•• 19151915
••19151915••19331933••19811981•• 19151915
•• 1930s1930s•• 19821982
•• 19111911•• 19141914•• 19311931
•• 18921892•• 19201920•• 19321932
••19401940••19781978
•• 19151915•• 19331933•• 19831983
••19811981
19821982•• 20012001
19311931•• 19821982•• 19991999
19321932•• 19861986•• 20032003
19831983•• 20032003
Sources: Sturzenegger and Zettelmayer (2006), Moody‘s, Milken Institute.
•• 20082008

America Goes to WorkU S d F t 500 E l tAmerica Goes to Work
U S d F t 500 E l tU.S. and Fortune 500 EmploymentU.S. and Fortune 500 Employment200200
180180 U.S. = +62 million jobsU.S. = +62 million jobsNew financialNew financial180180
160160
140140
jjNew financialtechnologies arefully implemented
New financialtechnologies arefully implemented
140140
120120
100100100100
8080
6060Fortune 500 = minus 4 millionFortune 500 = minus 4 million
Modern capitalmarkets beginModern capitalmarkets begin
00009595909085858080757570706060
Index 1970 = 100Index 1970 = 100

Ted TurnerTed Turner Craig McCawCraig McCaw Bill McGowanBill McGowangg
Steve RossSteve Ross Steve WynnSteve WynnReg LewisReg Lewis

The Future Belongs to the EducatedThe Future Belongs to the EducatedThe Future Belongs to the EducatedThe Future Belongs to the Educated
• Democratization of Capital
• Building Human Capital
• Democratization of Capital
• Building Human Capital• Building Human Capital
• Where’s Sputnik?
• Building Human Capital
• Where’s Sputnik?
• Education is the Answer• Education is the Answer

2011 U.S. Household Balance Sheet$
2011 U.S. Household Balance Sheet$$71 Trillion Total$71 Trillion Total
Insurance Insurance R R Shares Shares and and
Securities Securities 37%37%
Loans Loans <1%<1%Reserve Reserve
Funds 19Funds 19%% Other Other Financial Financial Assets Assets 1%1%
Real Real Estate Estate 26%26%
Other Other Deposits and Deposits and
Currency Currency
Source: Federal Reserve Flow of Funds, Q3 2011
Tangible Tangible 7%7%Currency Currency
10%10%

Q3 2011 Human Capital in the U.S.Q3 2011 Human Capital in the U.S.
U.S. Financial U.S. Financial
$229 Trillion Total$229 Trillion Total
Assets24%
Assets24%
Human and Social CapitalHuman and Social Capital76% 76%
Source: Derived from Kevin Murphy and Federal Reserve, Flow of Funds Q3, 2011

Human capitalHuman capitalHuman capitalis our most valuable asset.
Human capitalis our most valuable asset.

The 21st Century will see The 21st Century will see The 21 Century will see a worldwide competition The 21 Century will see a worldwide competition a worldwide competition
for human capital.a worldwide competition
for human capital.for human capital.for human capital.

Apple vs. Sony 1997Apple vs. Sony 1997pp yMarket Value
pp yMarket Value
Sony$34 3 billi
21 Apple = 1 Sony$34.3 billion
llApple$1.65 billion
Apple$1.65 billion

Sony: Five Decades of InnovationSony: Five Decades of Innovation• Tape recorder and transistor radio (1950s)
• 5-inch micro TV (1962)
• Tape recorder and transistor radio (1950s)
• 5-inch micro TV (1962)
• Trinitron Color TV (1965)
• U-matic video tape system (1969)
• Trinitron Color TV (1965)
• U-matic video tape system (1969)
• Beta-Max (1975)
• Sony Walkman (1979)
C t di d l (1982)
• Beta-Max (1975)
• Sony Walkman (1979)
C t di d l (1982)• Compact discs and player (1982)
• Handycam 8mm video camera (1985)(Sony sales and profits triple during the 1980s)
• Compact discs and player (1982)
• Handycam 8mm video camera (1985)(Sony sales and profits triple during the 1980s)
Akio MoritaCo-founder
Akio MoritaCo-founder
• Sony Play Station (1994)• Sony Play Station (1994)Co founderSony Corp.1921-1999
Co founderSony Corp.1921-1999
Source: “Historical Review of Sony's Innovations and Future Steps” (Masanori Hachiya/Sloan School of Management)

“Innovation has nothing to “Innovation has nothing to gdo with how many R&D dollars you have. When
gdo with how many R&D dollars you have. When yApple came up with the Mac, IBM was spending at
yApple came up with the Mac, IBM was spending at least 100 times more on R&D. It's about the people least 100 times more on R&D. It's about the people you have [and] how you're led.”you have [and] how you're led.”
-Steve Jobs-Steve Jobs

Apple vs. Sony 2012Apple vs. Sony 2012
30 S 1 A l
pp yMarket Value
pp yMarket Value
30 Sony = 1 AppleApple
$547 billionApple
$547 billion
SonySony
$547 billion$547 billion
Sony$18 billion
Sony$18 billion
Date: 4-16-12

Do human capital strategies work?Do human capital strategies work?Per Capita GDPPer Capita GDP
19601960 20112011
p gp g
SiSi 19601960
$50,714$50,714
20112011
$2,271$2,271
SingaporeSingapore
,,
JamaicaJamaica
$ 5,376$ 5,376$2,255$2,255
JamaicaJamaica
Source: International Monetary Fund (2011 USD)
$ ,$ ,$ ,$ ,

There are three ways to There are three ways to There are three ways to build human capital:
There are three ways to build human capital:p
Education
p
EducationEducation
Health
Education
HealthHealth
Immigration
Health
ImmigrationImmigrationImmigration

Addressing the Issues(Non Profit Organizations)
Addressing the Issues(Non Profit Organizations)(Non-Profit Organizations)(Non-Profit Organizations)
Milken Family Foundation (1982)• Education reform/teacher recognition/medical researchg
The Milken Institute (1991)• Economics/public-policy research and conferences
Prostate Cancer Foundation (1993)• World’s leading philanthropic source of support for research
FasterCures (2003)• Removing barriers to progress on all life-threatening diseases
Melanoma Research Alliance (2007)• Advancing research on the most-deadly skin cancer

The Future Belongs to the EducatedThe Future Belongs to the EducatedThe Future Belongs to the EducatedThe Future Belongs to the Educated
• Democratization of Capital
• Building Human Capital
• Democratization of Capital
• Building Human Capital• Building Human Capital
• Where’s Sputnik?
• Building Human Capital
• Where’s Sputnik?
• Education is the Answer• Education is the Answer

Where’s Sputnik?Where’s Sputnik?•• EnergyEnergy
Where s Sputnik?Where s Sputnik?gygy
•• HousingHousing•• EntitlementsEntitlements•• EntitlementsEntitlements•• EducationEducation•• ImmigrationImmigration•• HealthHealthHealthHealth


President Jimmy Carter on the energy crisisPresident Jimmy Carter on the energy crisisy gyy gyand proposed energy legislationand proposed energy legislation
“This difficult effort will be “This difficult effort will be the ‘moral equivalent of war’ the ‘moral equivalent of war’ ---- except that we will be except that we will be uniting our efforts to build uniting our efforts to build
d t d t ”d t d t ”and not destroy.”and not destroy.”

D f di th P i G lf f 1976 2007 D f di th P i G lf f 1976 2007 Defending the Persian Gulf from 1976-2007 has cost $7.3 trillion.
Defending the Persian Gulf from 1976-2007 has cost $7.3 trillion.
• Aircraft carriers• Aircraft carriers • Foreign aid• Foreign aid
• War on terrorism
• Wars in Iraq/Afghanistan
• War on terrorism
• Wars in Iraq/Afghanistan
• Intelligence operations
• Oil price volatility
• Intelligence operations
• Oil price volatilityq g
• Maintain troops overseas
q g
• Maintain troops overseas
p y
• Homeland security
p y
• Homeland security
Source: Stern, R.J., United States cost of military force projection in the Persian Gulf, 1976–2007. Energy Policy (2010), doi:10.1016/j.enpol.2010.01.013

Where’s Sputnik?Where’s Sputnik?•• EnergyEnergy
Where s Sputnik?Where s Sputnik?gygy
•• HousingHousing•• EntitlementsEntitlements•• EntitlementsEntitlements•• EducationEducation•• ImmigrationImmigration•• HealthHealthHealthHealth

Fallacy:Fallacy:y“Any loan to real estate is a good loan … ”
y“Any loan to real estate is a good loan … ”

Home prices don’t go up foreverCh i h i i 121
Home prices don’t go up foreverCh i h i i 121
WWIWWI WWIIWWIIGreat
DepressionGreat
Depression70’s
Boom70’s
Boom80’s
Boom80’s
BoomLatestBoomLatestBoom30%30%
Change in home prices in 121 yearsChange in home prices in 121 years
The image cannot be displayed. Your computer may not have enough memory to open the image, or the image may have been corrupted. Restart your computer, and then open the file again. If the red x still appears, you may have to delete the image and then insert it again.
The image cannot be displayed. Your computer may not have enough memory to open the image, or the image may have been corrupted. Restart your computer, and then open the file again. If the red x still appears, you may have to delete the image and then insert it again.
The image cannot be displayed. Your computer may not have enough memory to open the image, or the image may have been corrupted. Restart your computer, and then open the file again. If the red x still appears, you may have to delete the image and then insert it again.
The image cannot be displayed. Your computer may not have enough memory to open the image, or the image may have been corrupted. Restart your computer, and then open the file again. If the red x still appears, you may have to delete the image and then insert it again.
The image cannot be displayed. Your computer may not have enough memory to open the image, or the image may have been corrupted. Restart your computer, and then open the file again. If the red x still appears, you may have to delete the image and then insert it again.
The image cannot be displayed. Your computer may not have enough memory to open the image, or the image may have been corrupted. Restart your computer, and then open the file again. If the red x still appears, you may have to delete the image and then insert it again.
WWIWWI WWIIWWIIpp
20%20%
10%10%
0%0%
-10%-10%
19901990
Sources: Robert Shiller, Milken Institute.
18901890 19001900 19101910 19201920 19301930 19401940 19501950 19601960 19701970 19801980 20002000 20102010-20%-20%

Average Size of American HousesAverage Size of American Houses
2 5002 500square feetsquare feet
2 4692 4692,1352,135
2,5002,500
2 0002 000
2,4692,469
2,0002,000
1 5001 5001,5001,500
1 0001 0002009200919701970 19801980 19901990 20002000 20062006
1,0001,000
Source: National Association of Home Builders / U.S. Census Bureau

Home Sizes: U.S. vs. AsiaHome Sizes: U.S. vs. Asia
2,5002,500square feetsquare feet
2,4692,4692,5002,500
1 5001 500
2,0002,000
1,0001,000
1,5001,500 1,2001,200
500500
HongKongHongKong
Source: Mr & Mrs Asia - CLSA
JapanJapan SouthKoreaSouthKorea
IndiaIndia ChinaChina SingaporeSingapore U.S.U.S.

Consumer SpendingConsumer Spending
Housing 33%Housing 33%
U.S.U.S. AsiaAsiaFood 23%Food 23%Housing 33%
Transportation 18%Food 13%
Housing 33%Transportation 18%Food 13%
Food 23%Supplemental Education 15%Housing 10%
Food 23%Supplemental Education 15%Housing 10%
Insurance/pensions 11%Healthcare 6%Entertainment 5%
Insurance/pensions 11%Healthcare 6%Entertainment 5%
Clothing 8%Other 8%Transportation 6%
Clothing 8%Other 8%Transportation 6%Entertainment 5%
Apparel and services 4%Supplemental Education 2%
Entertainment 5%Apparel and services 4%Supplemental Education 2%
Transportation 6%Healthcare 5%Communication 5%
Transportation 6%Healthcare 5%Communication 5%pppp
Source: U.S. Bureau of Labor Statistics/CLSA

Where’s Sputnik?Where’s Sputnik?•• EnergyEnergy
Where s Sputnik?Where s Sputnik?gygy
•• HousingHousing•• EntitlementsEntitlements•• EntitlementsEntitlements•• EducationEducation•• ImmigrationImmigration•• HealthHealthHealthHealth

When Social Security was introduced in When Social Security was introduced in 1935 the average life span in the U S was 1935 the average life span in the U S was 1935, the average life span in the U.S. was 1935, the average life span in the U.S. was 61.7 years.61.7 years.
In 2009, life expectancy in the U.S. In 2009, life expectancy in the U.S. reached 78.1 years. reached 78.1 years. reached 78.1 years. reached 78.1 years.
Sources: National Center for Health Statistics, National Vital Statistics Reports, vol. 54, no. 19, June 28, 2006.U.S. Census Bureau, International Database.
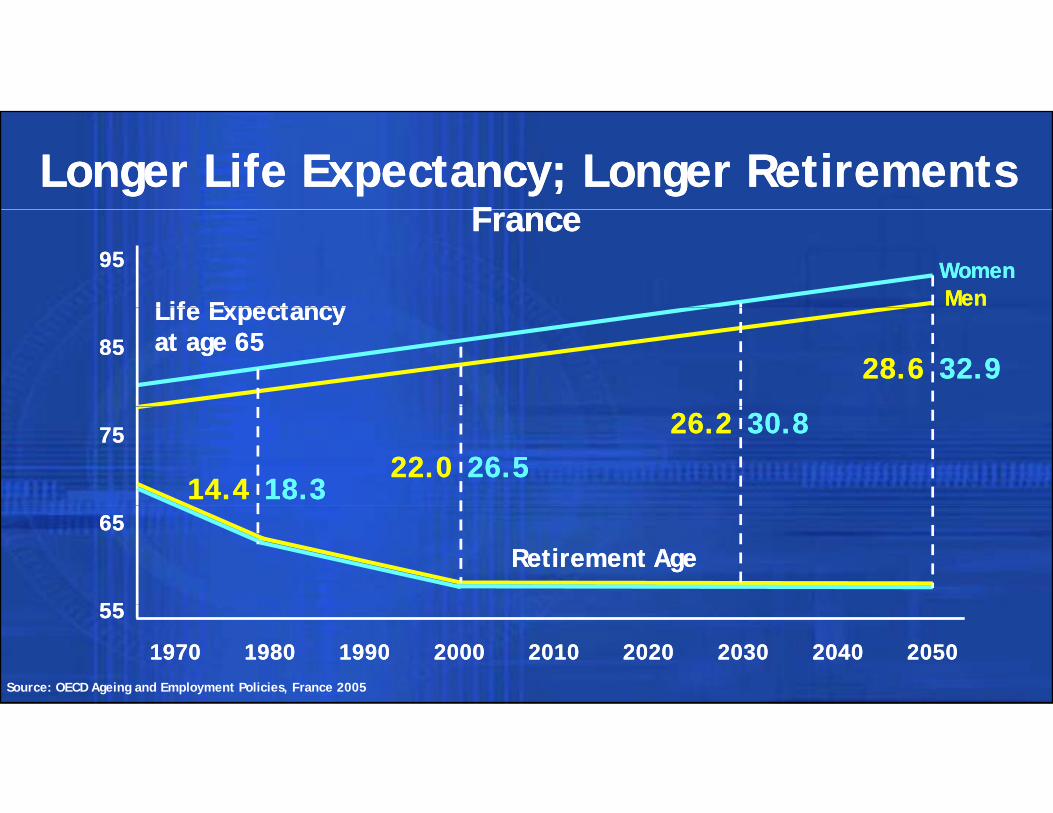
Longer Life Expectancy; Longer RetirementsF
Longer Life Expectancy; Longer RetirementsF
9595
FranceFrance
Life Expectancy Life Expectancy
WomenWomenMenMen
8585
Life Expectancy at age 65Life Expectancy at age 65
28.628.6 32.932.9
7575
14.414.4 18.318.322.022.0 26.526.5
26.226.2 30.830.8
6565
5555
Retirement AgeRetirement Age
19701970 19801980 19901990 20002000 20102010 20202020 20302030 20402040 20502050
5555
Source: OECD Ageing and Employment Policies, France 2005

Pensions for Greece’s Most Dangerous JobsPensions for Greece’s Most Dangerous Jobs
• High-risk workers are eligible for early retirement:• High-risk workers are eligible for early retirement:
• Full government pension benefits
• Age 50 for women, 55 for men
• Full government pension benefits
• Age 50 for women, 55 for menAge 50 for women, 55 for men
• Who qualifies?
Age 50 for women, 55 for men
• Who qualifies?
• 580 job categories
• 700,000 workers (14% of workforce)
• 580 job categories
• 700,000 workers (14% of workforce)
Source: NY Times, 3/11/10.

High-Risk Occupations in GreeceHigh-Risk Occupations in Greece
Coal MiningCoal Mining Bomb DisposalBomb Disposal
Source: NY Times, 3/11/10.

High-Risk Occupations in GreeceHigh-Risk Occupations in Greece
Radio Hosts?(“Bacteria on microphones”)
Radio Hosts?(“Bacteria on microphones”)
Hairdressers?(“Exposure to hair dyes”)
Hairdressers?(“Exposure to hair dyes”)
Source: NY Times, 3/11/10.
( Bacteria on microphones )( Bacteria on microphones ) ( Exposure to hair dyes )( Exposure to hair dyes )

Where’s Sputnik?Where’s Sputnik?•• EnergyEnergy
Where s Sputnik?Where s Sputnik?gygy
•• HousingHousing•• EntitlementsEntitlements•• EntitlementsEntitlements•• EducationEducation•• ImmigrationImmigration•• HealthHealthHealthHealth

Between 1870 and 1950, Americans added Between 1870 and 1950, Americans added Between 1870 and 1950, Americans added almost one year of education each decade.Between 1870 and 1950, Americans added almost one year of education each decade.
By 1960, the highest average grade level in the U.S. exceeded every other nation by two By 1960, the highest average grade level in the U.S. exceeded every other nation by two years.years.
Since 1960, we have made no progress and several other nations have surpassed us.Since 1960, we have made no progress and several other nations have surpassed us.
Source: Claudia Goldin and Lawrence Katz / The Race between Education and Technology

“If f i dl “If f i dl “If an unfriendly foreign power had tt t d t i
“If an unfriendly foreign power had tt t d t i attempted to impose on
America the mediocre d ti l
attempted to impose on America the mediocre d ti l educational
performance that exists t d i ht h
educational performance that exists t d i ht h today, we might have viewed it as an act of
”
today, we might have viewed it as an act of
”war.”- 1983
war.”- 1983

Skilled and Unskilled JobsSkilled and Unskilled Jobs
19501950 T dT d
Skilled and Unskilled JobsSkilled and Unskilled Jobs
19501950 TodayToday
60% 65%Skill d
20%Skilled
20%Semi-
60%Unskilled
20%Semi-
Skilled
15%Skilled skilledskilled Unskilled

The Jobs ProblemThe Jobs Problem(It Isn’t Jobs – It’s Trained Workers)(It Isn’t Jobs – It’s Trained Workers)
Millions125125
100100
Millions
123,000,000 hi h kill d j b
7575
5050
high-skilled jobs will be available
in 202050 000 000 5050
252550,000,000
Americans will qualify for those jobs
Source: Edward Gordon, “Winning the Global Talent Showdown”
j

ChiChi
• Parents spend an average • Parents spend an average
ChinaChina
Parents spend an average of 15% on their children’s education … and only 10%
Parents spend an average of 15% on their children’s education … and only 10% on housing.
• 55% of parents in China
on housing.
• 55% of parents in China 55% of parents in China send their children for extra lessons in English.
55% of parents in China send their children for extra lessons in English.

Beverly HillsBeverly HillsBeverly HillsHigh SchoolBeverly HillsHigh School
46th percentile in math
46th percentile in math
87.7% of students rank “proficient” or 87.7% of students
rank “proficient” or 34th percentile in
math34th percentile in
math
rank proficient or above in math.
rank proficient or above in math.
Sources: City-Data.com / Global Report Card (Jay Greene and Josh McGee)

We must not be afraid of We must not be afraid of f fcompetition.
f fcompetition.
We must be ready to We must be ready to We must be ready to compete.
We must be ready to compete.

Eddie “The Eagle” EdwardsEddie “The Eagle” Edwards
• 1988 Calgary Olympics• 1988 Calgary Olympics
Eddie The Eagle EdwardsEddie The Eagle Edwards
• Britain’s first (and last!) ski jumper
• Britain’s first (and last!) ski jumper
• Last place finish with a jump of 253 feet
• Last place finish with a jump of 253 feet
The gold-medal jump was 412 feet.

Eddie “The Eagle” EdwardsEddie “The Eagle” Edwards
• 1988 Calgary Olympics• 1988 Calgary Olympics
Eddie The Eagle EdwardsEddie The Eagle Edwards
• Britain’s first (and last!) ski jumper
• Britain’s first (and last!) ski jumper
• Last place finish with a jump of 253 feet
• Last place finish with a jump of 253 feet
Eddie “The Eagle” Rule:Eddie “The Eagle” Rule:Olympic qualifiers must compete in international events and place in the Top 30 percent or Top 50 competitors.Olympic qualifiers must compete in international events and place in the Top 30 percent or Top 50 competitors.

M lti l thM lti l th• Multiple career paths• Ongoing applied professional growth• Multiple career paths• Ongoing applied professional growth• Instructionally focused accountability• Performance based compensation• Instructionally focused accountability• Performance based compensation• Performance-based compensation• Performance-based compensation
National Institute for Excellence in Teaching (NIET)

• 284 Scholars since program began in 1989• 284 Scholars since program began in 1989p g g
• 80 born outside the United States
• 34 countries of origin
p g g
• 80 born outside the United States
• 34 countries of origin• 34 countries of origin
• 205 Scholars have one or more parents born outside the U.S.
• 34 countries of origin
• 205 Scholars have one or more parents born outside the U.S.
• 99 colleges attended
• 54 are married
• 99 colleges attended
• 54 are married• 54 are married
• 48 children of Milken Scholars
• 54 are married
• 48 children of Milken Scholars

Selected colleges and universities in the Milken Scholars program:
Selected colleges and universities in the Milken Scholars program:
52 to Harvard34 to Stanford 52 to Harvard34 to Stanford
11 to Penn11 to M I T11 to Penn11 to M I T
Milken Scholars program:Milken Scholars program:
34 to Stanford 25 to Yale21 to Berkeley
34 to Stanford 25 to Yale21 to Berkeley
11 to M.I.T.8 to Princeton6 to Brown
11 to M.I.T.8 to Princeton6 to Brown 21 to Berkeley
14 to Columbia 21 to Berkeley14 to Columbia
6 to Brown 5 to Cornell6 to Brown 5 to Cornell

More than More than More than 30,000 students
More than 30,000 students

Mike’s Math Club in ChinaMike’s Math Club in China

2012: More than 2 500 teachers2012: More than 2 500 teachers2012: More than 2,500 teachers2012: More than 2,500 teachers

Return on Human Capital InvestmentReturn on Human Capital Investment
Preschool Preschool
“The rate of return to a dollar investment made while a person is young is higher than the rate of return to the same
“The rate of return to a dollar investment made while a person is young is higher than the rate of return to the same
ReturnReturnProgramsPrograms
dollar made at a later age.”dollar made at a later age.”
Nobel Prize Economist James Heckman
Nobel Prize Economist James Heckman
SchoolSchoolOpportunity Cost of FundsOpportunity Cost of Funds
Job TrainingJob Training
AgeAgeSource: James Heckman, University of Chicago

Ability to learnAbility to learnb l ty to lea
Love of learning
b l ty to lea
Love of learningLove of learningLove of learning

Knowledge UniverseKnowledge Universe
Knowledge Universe InternationalKnowledge Universe InternationalSingapore, Malaysia, India, United KingdomSingapore, Malaysia, India, United Kingdom

Where’s Sputnik?Where’s Sputnik?•• EnergyEnergy
Where s Sputnik?Where s Sputnik?gygy
•• HousingHousing•• EntitlementsEntitlements•• EntitlementsEntitlements•• EducationEducation•• ImmigrationImmigration•• HealthHealthHealthHealth

Highly skilled, entrepreneurial Highly skilled, entrepreneurial
and educated immigrants are
l
and educated immigrants are
lcrucial to prosperity. crucial to prosperity.

Building Human Capital Through ImmigrationBuilding Human Capital Through Immigration
Albert EinsteinAlbert Einstein Jerry YangJerry Yang Madeleine AlbrightMadeleine Albright(Germany)(Germany) (Taiwan)(Taiwan) (Czechoslovakia)(Czechoslovakia)
Sergey Brin(Russia)
Sergey Brin(Russia)
Alex. Graham Bell(Scotland)
Alex. Graham Bell(Scotland)
Gustavo Dudamel(Venezuela)
Gustavo Dudamel(Venezuela)

Doctorates Awarded in the U.S.Doctorates Awarded in the U.S.Doctorates Awarded in the U.S.Doctorates Awarded in the U.S.
• 1/3 of all doctoral students in the U S • 1/3 of all doctoral students in the U S • 1/3 of all doctoral students in the U.S. are foreign born, up from one in ten 30 years ago
• 1/3 of all doctoral students in the U.S. are foreign born, up from one in ten 30 years agoyears ago.
• 84% of their doctorates are in
years ago.
• 84% of their doctorates are in 84% of their doctorates are in engineering and the sciences.84% of their doctorates are in engineering and the sciences.
Sources: National Science Foundation/Div of Science Resource Statistics

Immigrants in Silicon Valley Immigrants in Silicon Valley
• More than half of Silicon Valley’s science and engineering workforce is foreign born
• More than half of Silicon Valley’s science and engineering workforce is foreign bornengineering workforce is foreign-born.
• More than 15 percent of Silicon Valley start-
engineering workforce is foreign-born.
• More than 15 percent of Silicon Valley start-p yup companies were founded by immigrants from India.
p yup companies were founded by immigrants from India.
• Another 13 percent had CEOs from China or Taiwan
• Another 13 percent had CEOs from China or Taiwan
Sources: Vivek Wadhwa, Duke University
Taiwan. Taiwan.

60% of the nearly 1 million Chinese people with assets over 10 million yuan
60% of the nearly 1 million Chinese people with assets over 10 million yuanpeople with assets over 10 million yuan
($1.6 million) are thinking about emigrating to the U S or Europe
people with assets over 10 million yuan($1.6 million) are thinking about emigrating to the U S or Europe emigrating to the U.S. or Europe. emigrating to the U.S. or Europe.
Source: U.S. Department of Homeland Security (WSJ 2/22/12 “Plan B for China’s Wealthy: Moving to the U.S./Europe)

Where’s Sputnik?Where’s Sputnik?•• EnergyEnergy
Where s Sputnik?Where s Sputnik?gygy
•• HousingHousing•• EntitlementsEntitlements•• EntitlementsEntitlements•• EducationEducation•• ImmigrationImmigration•• HealthHealthHealthHealth

Half of all economic growth in the l i b d
Half of all economic growth in the l i b d last two centuries can be traced to medical research advances.
last two centuries can be traced to medical research advances.to medical research advances.to medical research advances.

Three SolutionsThree SolutionsThree Solutionsto Healthcare Challenges
Three Solutionsto Healthcare Challenges
• Prevention• Prevention
• Cost reduction• Cost reduction
• Research leading to cures• Research leading to curesResearch leading to curesResearch leading to cures

Lifestyle Makes a DifferenceLifestyle Makes a Differenceyy70% of health-care spending –about $2.5 trillion – is spent on lif l l d di
70% of health-care spending –about $2.5 trillion – is spent on lif l l d di
30% is spent on hereditary diseases30% is spent on hereditary diseases
lifestyle-related diseases.lifestyle-related diseases.
U S EconomyU S Economy
hereditary diseases.hereditary diseases.
U.S. Economy$14.6 trillionU.S. Economy$14.6 trillion
Sources: CIA Handbook / Centers for Medicare and Medicaid Services (2009)


Obesity Prevalence Among U.S. Adults1991
Obesity Prevalence Among U.S. Adults199119911991
>15%>15%<15%<15%
Source: Centers for Disease Control and Prevention

Obesity Prevalence Among U.S. Adults2011
Obesity Prevalence Among U.S. Adults201120112011
25-30%25-30%> 30%> 30%
20-24%20-24%
Source: Centers for Disease Control and Prevention

Obesity Rates: U.S. vs. WorldObesity Rates: U.S. vs. WorldObesity Rates: U.S. vs. WorldObesity Rates: U.S. vs. World20022005 41.8%41.8%
36.5%U.S.U.S. MENWOMENWOMEN
24 2%24 2%21.6%U.K.U.K.
34.3%34.3%24.0%MexicoMexico
20.4%20.4%
24.2%24.2%
7 8%
20.9%
FF
GermanyGermany
1 9%1 9%
6.6%6.6%1.6%1.6%
7.8%
ChinaChina
FranceFrance
Source: World Health Organization / Estimated obesity rates for people aged 15 years and older / 2005
1.5%1.5%
1.9%1.9%1.8%1.8%JapanJapan

The Supersize InvestmentThe Supersize Investment
For only 67 cents you can step up For only 67 cents you can step up
A Negative ReturnA Negative ReturnYet, every time you supersize, it costs Yet, every time you supersize, it costs For only 67 cents you can step up
to a larger order of French fries and a 32-ounce soda …
For only 67 cents you can step up to a larger order of French fries and a 32-ounce soda …
Yet, every time you supersize, it costs you $8 in extra lifetime spending on food, gas and medical care to sustain a heavier body.
Yet, every time you supersize, it costs you $8 in extra lifetime spending on food, gas and medical care to sustain a heavier body.heavier body.heavier body.
Source: Journal of the American College of Nutrition


Only in AmericaOnly in Americayy

Chronic Disease StudyChronic Disease Study
Failure to address chronic diseases Failure to address chronic diseases adequately costs the
U S th adequately costs the
U S th U.S. economy more than $1 trillion annually.
U.S. economy more than $1 trillion annually.

“We shall pa an price bear “We shall pa an price bear “We shall pay any price, bear any burden, meet any
hardship in order to assure
“We shall pay any price, bear any burden, meet any
hardship in order to assure hardship … in order to assure the survival and the success
of liberty.”
hardship … in order to assure the survival and the success
of liberty.”y
John F. Kennedy
y
John F. Kennedy1961 Inaugural1961 Inaugural

Do Do WeWe Have the Will?Have the Will?•• EnergyEnergy
Do Do WeWe Have the Will?Have the Will?gygy
•• HousingHousingEducationEducation•• EducationEducation
•• EntitlementsEntitlements•• ImmigrationImmigration•• HealthHealthHealthHealth

• Finance• Finance• Education• Philanthropy• Education• Philanthropy
April 28 – May 2, 2012April 28 – May 2, 2012 • Health• Climate/Energy• Health• Climate/Energy• Government• Regions• Government• Regions• Industries• Media• Industries• Media• Successful Aging• Successful Aging

The Future Belongs to the EducatedThe Future Belongs to the EducatedThe Future Belongs to the EducatedThe Future Belongs to the Educated
• Democratization of Capital
• Building Human Capital
• Democratization of Capital
• Building Human Capital• Building Human Capital
• Where’s Sputnik?
• Building Human Capital
• Where’s Sputnik?
• Education is the Answer• Education is the Answer

Short term StimulusShort term StimulusShort-term StimulusShort-term Stimulus

Education is the long term stimulusEducation is the long term stimulusEducation is the long-term stimulus.Education is the long-term stimulus.

“Education is the most powerful weapon “Education is the most powerful weapon powerful weapon which you can use to change the world ”
powerful weapon which you can use to change the world ”change the world.”change the world.”
- Nelson Mandela- Nelson Mandela

We are creating a legacy for the next We are creating a legacy for the next generation.generation.

“I h d “I h d “In your hands, my fellow citizens, more
“In your hands, my fellow citizens, more
than in mine, will rest the final success or
than in mine, will rest the final success or
failure of our course.”failure of our course.”
John F. Kennedy1961 Inaugural
John F. Kennedy1961 Inaugural1961 Inaugural1961 Inaugural

Th F t B l t th Ed t dTh F t B l t th Ed t dThe Future Belongs to the EducatedThe Future Belongs to the Educated
ASU Education Innovation SummitPhoenix
ASU Education Innovation SummitPhoenix
April 16, 2012April 16, 2012
Michael MilkenChairman, Milken Institute
Michael MilkenChairman, Milken Institute