Tgi conference call 4Q 2013 vf
30
March 2014 Strictly Private and Confidential TGI 4Q 2013 results
-
Upload
empresa-de-energia-de-bogota -
Category
Investor Relations
-
view
55 -
download
0
Transcript of Tgi conference call 4Q 2013 vf

March 2014
Strictly Private and Confidential
TGI 4Q 2013 results
2
Table of contents
1. TGI Overview and History
2. Key updates
3. Financial and operating highlights
4. Sizeable expansion projects are well underway
Appendix
1. Economic, industry and regulatory environment
2. Shareholders and management team
3. EEB Overview

1. Overview and History
4
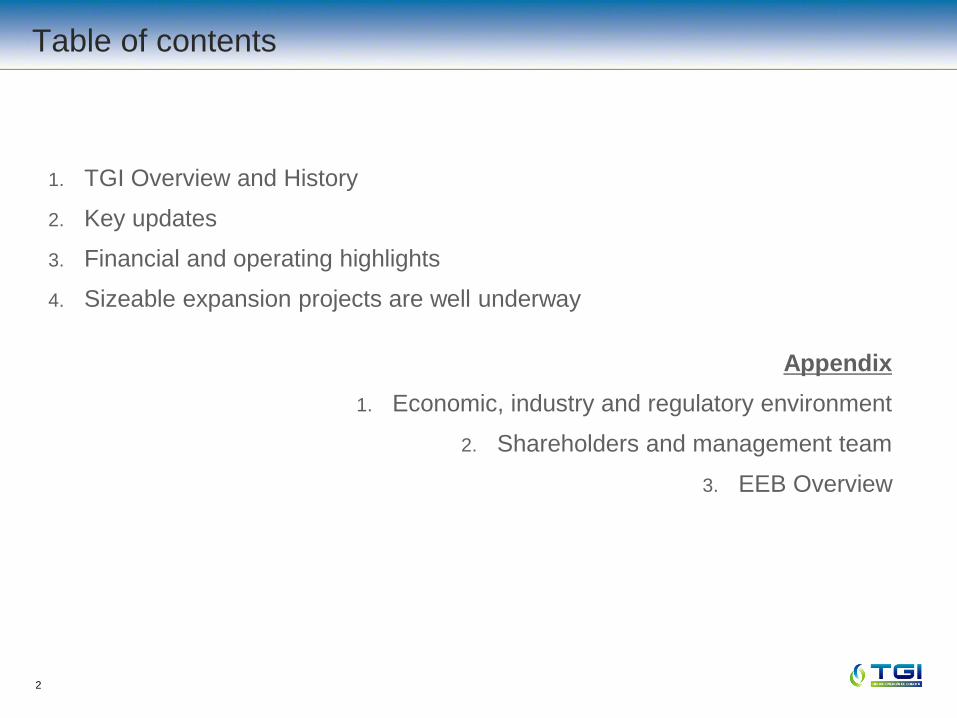
Overview
Stable and growing Colombian economy with sound investment environment
Constructive and stable regulatory framework
Largest natural gas pipeline system in Colombia
Stable and predictable cash flow generation, strongly indexed to the US Dollar
Strong and consistent financial performance
Experienced management team with solid track record in the sector
Expertise, financial strength and support of shareholders
Natural monopoly in a regulated environment
Strategically located pipeline network

5
Company history
TGI history Pipeline network
Natural gas reserves
City (population)
References
Highlights
Source: Company information and ANH.
2.11 tcf Center
1.89 tcf North
2.99 tcf
Eastern
Producers: Chevron Ecopetrol
Producers: Ecopetrol & Equion South
Valledupar (350k)
Currumaní (27k)
Bucaramanga (1.1mm)
Bogota (7.9mm)
Neiva (477k)
Cali (2.7mm)
Pereira (682k)
Manizales (430k)
Medellin (3.3mm)
0.02 tcf
Pipeline owned by TGI Pipeline owned by a third party
References
BOMT
Owns ~61% of the national pipeline network (3,957 km) and transports 48.5% of the gas consumed in the country
− Serves ~70% of Colombia’s population, reaching the most populated areas (Bogota, Cali, Medellin, Bucaramanga and the coffee region and Piedemonte Llanero, among others)
− Area served generates ~82% of Colombia’s GDP
− Has access to the two main production regions, La Guajira and Cusiana/Cupiagua
25% interest in Contugas (Peru)
− 30-year concession for natural gas transportation and distribution
TGI was created as a result of the privatization of Ecogás and has experienced remarkable growth since then, under the leadership of its controlling shareholders, EEB and CVCI
Villavicencio (384k)
Creation of Ecogas
1997
2005
Alienation of Ecogas assets
2006
Ecogás awarded to EEB
2007
Creation of TGI and bond issuance Transfer of 1st
BOMT (GBS) and pipelines exchange with Promigas
Transfer of 2nd BOMT (Centragas) and CVCI capitalization
Cusiana expansion phase I begins operations
Subordinated debt is refinanced.
2009
2008
TGI assumes the O&M of owned pipelines
2012
Refinancing of 2007 Bond issue
Cusiana expansion phase II begins operations (3Q)
TGI assumes the O&M of Compressor stations.
Moody´s and Fitch give investment grade rating to TGI
2011
2010
Source: Company information.
Ballena expansion begins Operations
TGI-Transcogas merger
2013
Standard & Poor’s gives investment grade rating to TGI
Headquarters relocation from Bucaramanga to Bogotá
Redesign of organizational structure

2. Key Updates
7
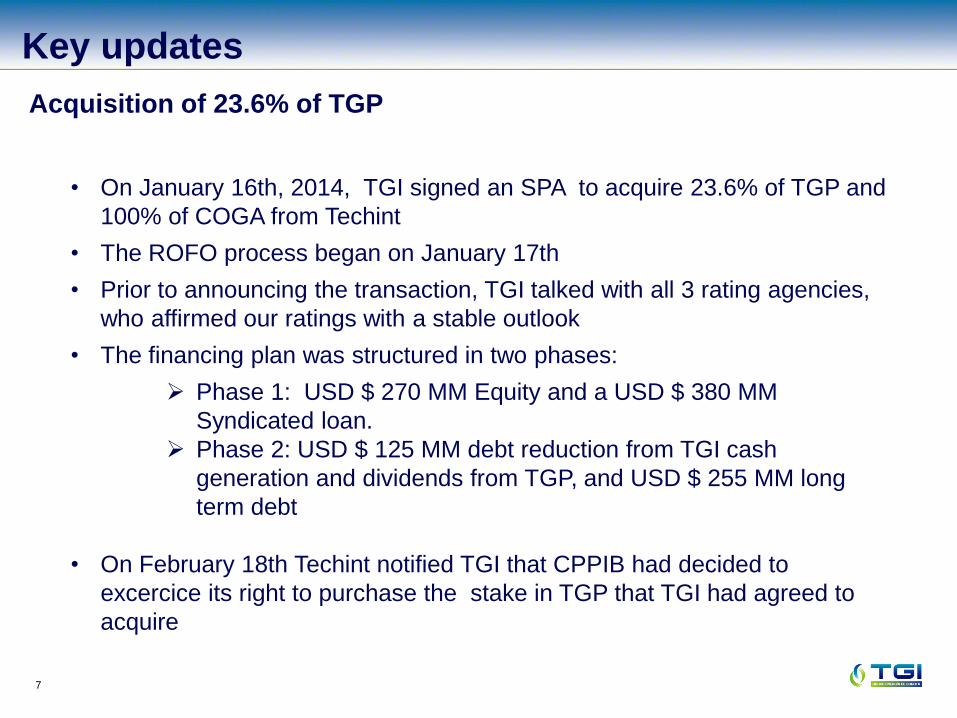
Acquisition of 23.6% of TGP
Key updates
• On January 16th, 2014, TGI signed an SPA to acquire 23.6% of TGP and
100% of COGA from Techint
• The ROFO process began on January 17th
• Prior to announcing the transaction, TGI talked with all 3 rating agencies,
who affirmed our ratings with a stable outlook
• The financing plan was structured in two phases:
Phase 1: USD $ 270 MM Equity and a USD $ 380 MM
Syndicated loan.
Phase 2: USD $ 125 MM debt reduction from TGI cash
generation and dividends from TGP, and USD $ 255 MM long
term debt
• On February 18th Techint notified TGI that CPPIB had decided to
excercice its right to purchase the stake in TGP that TGI had agreed to
acquire

8
Cusiana Apiay San Fernando (CASF)
Key updates
• After basic engineering was completed the estimated budget of this project
was USD $ 268 million
• On February 2014 Ecopetrol decided not to continue with this project as
initially agreed
• Ecopetrol is now analyzing the construction of a major electricity plant at
Cusiana
• Ecopetrol will continue expanding the capacity of Termo Ocoa and Termo
Suria and will need to contract 20mmcf/d along the Cusiana- Apay and
Apiay-Villavicencio-Ocoa tranches
• TGI is in the process of looking for additional shippers willing to contract
capacity in this pipeline
• On March 4, 2014 TGI formally solicited proposals from shippers
(including Ecopetrol) for this and other upcoming expansions

3. Financial and operating highlights

10
Source: Company information.
Network length
(km)
Capacity
(mmscfd)
Firm Contracted Capacity
(mmscfd)
Transported Volume Gas Losses Load factor
(%) (%)
371 396
422 420 422 454
2008 2009 2010 2011 2012 2013
66.1% 69.1% 71.2%
57.6% 58.9% 60.8%
2008 2009 2010 2011 2012 2013
3702
3529
3774 3774
3957 3957
2008 2009 2010 2011 2012 2013
0.10%
0.20%
0.57% 0.54% 0.52%
0.21%
2008 2009 2010 2011 2012 2013
TGI Operational performance 2013
478 478 548
618
730 730
2008 2009 2010 2011 2012 2013
427 437 485
560 604 624
96% 99%
95% 96%
83% 85%
2008 2009 2010 2011 2012 2013

11 11
Source: UPME and Company information. (1) 48,5% of market share of gas transported directly by TGI. Most of the 15% transported by “Others” is natural gas transported by TGI through the
TGI Pipeline System to other pipeline systems. (2) As of December 301 2013.
TGI is the largest natural gas transportation company in the country
− Holds 48.5%(2) market share in the Colombian natural gas transportation sector and owns ~61% of the pipeline network
TGI’s extensive pipeline network (3,957 km) allows the Company to take advantage of new business opportunities and participate in expansion projects in different regions
Other industry participants face high barriers of entry to access TGI’s gas transportation market in a cost-efficient manner
Natural gas transportation market share (1)
Natural gas transported volume (2)
(mmscfd)
(% of natural gas transported volume)
Largest natural gas pipeline system in Colombia
TGI has a dominant market position, holding a natural monopoly with high barriers of entry
Source: Natural gas transportation companies’ Electronic Bulletin of Operations
Source: Natural gas transportation companies’ Electronic Bulletin of Operations
TGI 49%
Promigas 36%
Others 15%
454.4
341.3
44.4 47.5 29.9 12.5 5.9

12
Stable and predictable cash flow generation
TGI’s revenues are highly predictable, with approximately 98% coming from regulated tariffs that are reviewed al least every 5 years, ensuring cash flow stability and attractive rates of return
Main sectors served by the Company (72(1)% of revenues) present stable consumption patterns (no seasonality)
The Company enjoys excellent contract quality
− 100% of TGI’s contracts are firm contracts with an average life of 8,3 years
− 84% of regulated revenues are fixed tariffs, not dependent on transported volume
− Extremely low sensitivity of EBITDA to changes in exchange rate
Revenues breakdown
(% of revenues)
Source: Company information. (1) Includes Distributors, Ecopetrol´s refinery and Natural gas for Vehicles. (2) TGI calculations (3) Ecopetrol accounts for most of this revenue.
TGI’s revenues are highly predictable as a result of regulated tariffs and stable consumption
Source: TGI as of December 31- 2013
Key financial data - Ebitda
US$ in millions )
196 198 224
261 293
359
0
50
100
150
200
250
300
350
2008 2009 2010 2011 2012 2013
Ecopetrol 17%
Natural Gas 23%
Gases de Occidente
16% EPM 12%
Isagen 7%
Others 26%
By Client
Distributor 57%
Vehicles 7%
Traders 8%
Thermal. 17%
Refinery 8%
Others* 3%
By Sector

13
And long term firm contracts
Source: Company information. (1) Includes 32 clients.
TGI’s capacity is covered by firm contracts (average life of 8.3 years) with top-tier clients
(1)
In 2008, the Company contracted its capacity on a long term basis, with most of the contracts maturing 2021
TGI has in place a commercial strategy to ensure a timely rollover of the contracts
Retail distributors (regulated users), including Gas Natural, Gases de Occidente, EPM are forced by regulation to have their gas transport needs under firm contracts
0
100.000
200.000
300.000
400.000
500.000
600.000
700.000
800.000
Jan
-14
May
-14
Sep
-14
Jan
-15
May
-15
Sep
-15
Jan
-16
May
-16
Sep
-16
Jan
-17
May
-17
Sep
-17
Jan
-18
May
-18
Sep
-18
Jan
-19
May
-19
Sep
-19
Jan
-20
May
-20
Sep
-20
Jan
-21
May
-21
Sep
-21
Jan
-22
May
-22
Sep
-22
Jan
-23
May
-23
Sep
-23
Jan
-24
May
-24
Sep
-24
Jan
-25
OTHERS
ISAGEN
GASES DE OCCIDENTE
EPM
ECOPETROL
GAS NATURAL

14
Revenues EBITDA and EBITDA margin
Funds from operations (1)
(US$ in millions – average exchange rate for each period)
Source: Company information
(US$ in millions – average exchange rate for each period)
(US$ in millions – average exchange rate for each period)
(1)FFO calculated as net income plus depreciation, amortization and provisions, adjusted for effect from exchange rate and hedges.
On 2012 FFO includes the LM transaction premium~ USD 69 million (one time event)
240 253
295
339
391
465
2008 2009 2010 2011 2012 2013
TGI Financial performance 2013
(US$ in millions)
2013 Preliminary figures subject to shareholders assembly approval
196 198 224
261 293
359
81.7% 78.2% 76.2% 76.8% 75.0% 77.1%
0
50
100
150
200
250
300
350
2008 2009 2010 2011 2012 2013
84 96 108 117 133
266
2008 2009 2010 2011 2012 2013
14 69
174
387
185
35
2008 2009 2010 2011 2012 2013
Historical Capex

15
Financial debt breakdown – Dec. 2013 (2)
Subordination Agreement
The lender is EEB (major shareholder)
No repayment of principal allowed before payment of senior debt
Interest can only be paid if there is no default or event of default and if the payment does not trigger any such scenario
Subordinated debt acceleration is not allowed until senior debt is not repaid
Source: Company information. Note: Ratios calculated in local currency (1) Interest coverage ratio calculated as EBITDA / Net Interest (2) Senior debt stands for the US$750 million Senior Unsecured Notes due 2022 and 2.4 million Leasing operations. Subordinated debt stands for
intercompany loan with EEB.
Total Debt / EBITDA (x)
Total Senior Debt / EBITDA (x)
Interest coverage (1)
(x)
Financial performance
5.6 5.4 4.9
4.2 3.5
2009 2010 2011 2012 2013
3.8 3.7 3.4
2.9 2.5
2009 2010 2011 2012 2013
2.0 2.1 2.5
4.0
5.9
2009 2010 2011 2012 2013
2013 Preliminary figures subject to shareholders assembly approval
Senior Debt; 752; 60.8%
Hedges; 114; 9.2%
Subordinated debt; 370;
29.9%

16
4. Sizeable expansion projects are well underway

17
La Sabana Compression Plant
Description: Critical to greater expansion of
service to Bogota and surrounding
areas, La Sabana uses MOPICO
technology within a new
compression station. The project
will increase transportation
capacity from 143 to 215 mmcf/d
Cost: ~$55mm
Status: — Land acquired
— MOPICO compressor supply
contracted
— Environmentally permitted
— Contractor selected and has
initiated work
— Expected Completion: Begin
operations during August 2014
Expansion projects are well underway
Description: Increase capacity in 20 mmcf/d
by adapting Vasconia, Miraflores,
Puente Guiillermo compression
stations
Cost: ~$33.5mm
Expected
Completion: 2015
Cusiana Phase III
Description: Adapt compression stations,
delivery and receipt locations
along the Ballena -
Barrancabermeja pipeline so
that it can transport natural gas
in both directions, in order to
allow natural gas to be
transported from the central
region to the north
Cost: ~$20mm
Expected
Completion: 2016
Ballena – Barrancabermeja Bidirectionality

18
Eje Cafetero Branches
Description: TGI will increase existing capacity
of Armenia and Chinchina
branches with the construction of
two new loops; Armenia Branch:
37.5 km 8” loop parallel to exiting
6” pipeline and Chinchina – Santa
Rosa – Dosquebradas Branch:
7.5km 3” loop parallel to existing
3” pipeline
Cost: ~$28mm
Status: — Planning stage
— Expected Completion: 2016
Expansion projects pipeline
Description: Construction of a 122 km 14” loop
from Apiay to Usme. Porject
maximizes the use of Cusiana-Apiay
loop and additional capacity
expansions could be achieved with
compression stations.
Cost: ~$185mm
Expected
completion:
2018
Expansión Apiay – Usme
Description: Adapt infrastructure at Ballena field
to connect the Ballena-
Barrancabermeja pipeline with
PDVSA’s cross-border natural gas
pipeline, enabling the transportation
of natural gas to come from
Venezuela to the central region of
Colombia
Cost: ~$5mm
Expected
Completion: 2015
Adjustments for Venezuela Imports
Description: Construction of a 65 km 14”
loop and a new compression
station.
Increase capacity in 12.6
mmcf/d from Mariquita.
Cost: ~$90mm
Expected
Completion: 2016
Mariquita - Gualanday

19
4. Questions and answers

20 20
Investor Relations
For more information about TGI contact our Investor Relations team:
http://www.tgi.com.co
http://www.grupoenergiadebogota.com.co
Santiago Pardo de la Concha
CFO
+57 (1) 3138400 - ext 2320
Rafael Andrés Salamanca Rodriguez
Investor Relations Advisor
+57 (1) 3268000 – ext1675
Antonio Angarita
Investor Relations Officer
+57 (1) 3268000 - ext 1546
Sergio Andrés Hernández Acosta
Finance Manager
+57 (1) 3138400 - ext 2450
21
Appendix 1 – Economic and Industry Environment
22
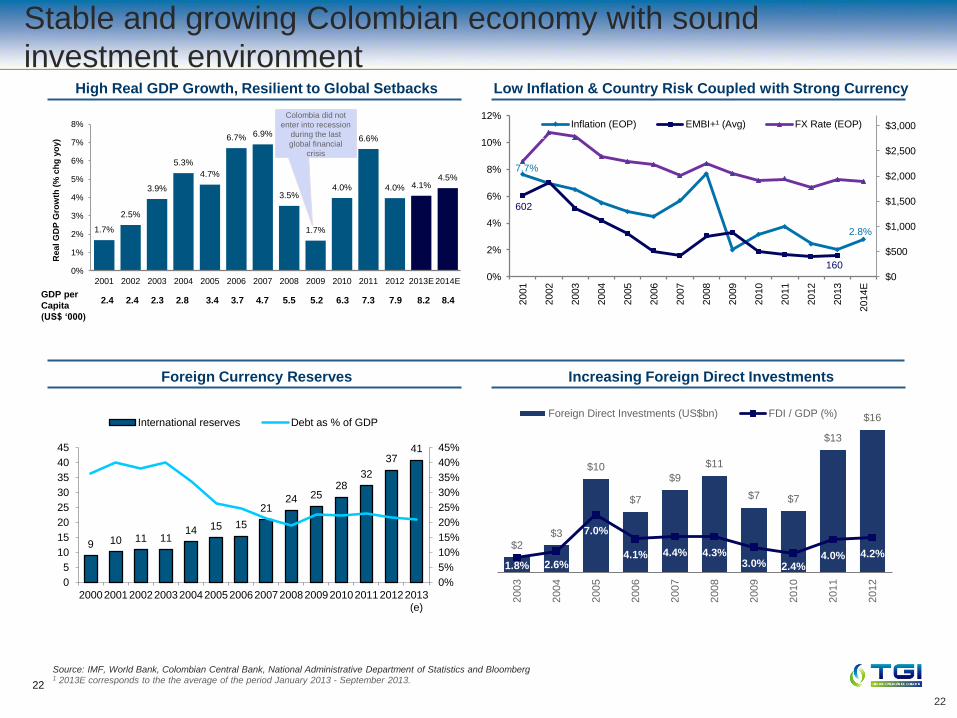
Source: IMF, World Bank, Colombian Central Bank, National Administrative Department of Statistics and Bloomberg 1 2013E corresponds to the the average of the period January 2013 - September 2013.
Foreign Currency Reserves Increasing Foreign Direct Investments
High Real GDP Growth, Resilient to Global Setbacks Low Inflation & Country Risk Coupled with Strong Currency
1.7%
2.5%
3.9%
5.3%
4.7%
6.7% 6.9%
3.5%
1.7%
4.0%
6.6%
4.0% 4.1% 4.5%
0%
1%
2%
3%
4%
5%
6%
7%
8%
2001 2002 2003 2004 2005 2006 2007 2008 2009 2010 2011 2012 2013E 2014E
Re
al
GD
P G
row
th (
% c
hg
yo
y)
GDP per
Capita
(US$ ‘000)
2.4 2.4 2.3 2.8 3.4 3.7 4.7 5.5 5.2 6.3 7.3 7.9
7.7%
2.8%
602
160
$2,291
$1,900
$0
$500
$1,000
$1,500
$2,000
$2,500
$3,000
0%
2%
4%
6%
8%
10%
12%
20
01
20
02
20
03
20
04
20
05
20
06
20
07
20
08
20
09
20
10
20
11
20
12
20
13
20
14
E
Inflation (EOP) EMBI+¹ (Avg) FX Rate (EOP)
22
$2 $3
$10
$7
$9
$11
$7 $7
$13
$16
1.8% 2.6%
7.0%
4.1% 4.4% 4.3% 3.0% 2.4%
4.0% 4.2%
2003
2004
2005
2006
2007
2008
2009
2010
2011
2012
Foreign Direct Investments (US$bn) FDI / GDP (%)
8.2 8.4
Colombia did not
enter into recession
during the last
global financial
crisis
Stable and growing Colombian economy with sound
investment environment
9 10 11 11 14 15 15
21 24 25
28 32
37 41
0%
5%
10%
15%
20%
25%
30%
35%
40%
45%
0
5
10
15
20
25
30
35
40
45
20002001200220032004200520062007200820092010201120122013(e)
International reserves Debt as % of GDP
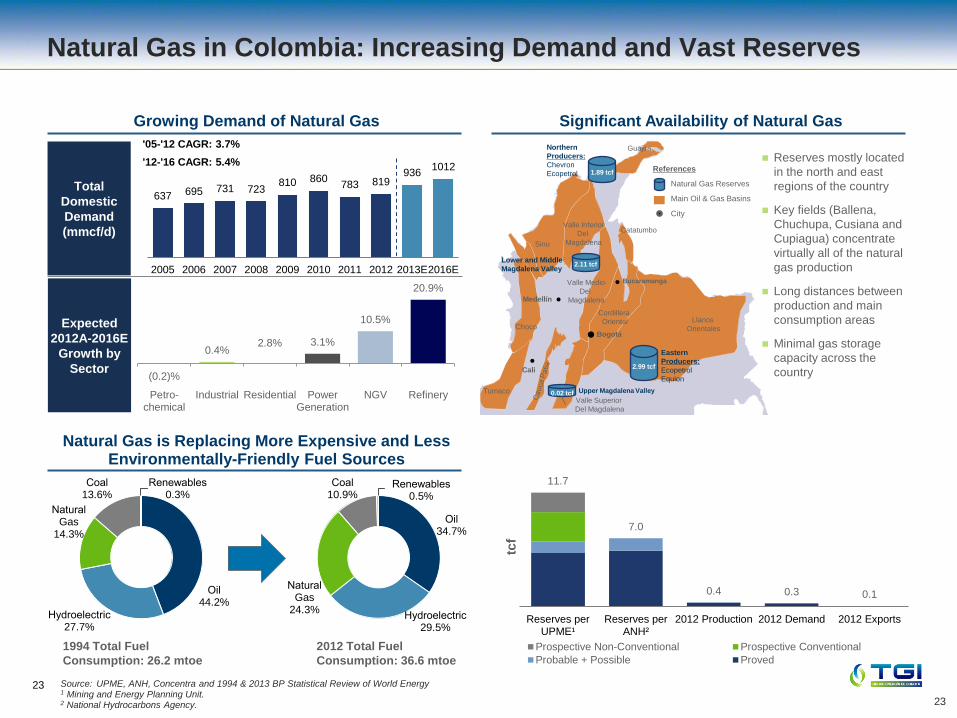
23 Source: UPME, ANH, Concentra and 1994 & 2013 BP Statistical Review of World Energy 1 Mining and Energy Planning Unit. 2 National Hydrocarbons Agency.
Natural Gas is Replacing More Expensive and Less Environmentally-Friendly Fuel Sources
Growing Demand of Natural Gas Significant Availability of Natural Gas
Reserves mostly located
in the north and east
regions of the country
Key fields (Ballena,
Chuchupa, Cusiana and
Cupiagua) concentrate
virtually all of the natural
gas production
Long distances between
production and main
consumption areas
Minimal gas storage
capacity across the
country
Total
Domestic
Demand
(mmcf/d)
Expected
2012A-2016E
Growth by
Sector
1994 Total Fuel
Consumption: 26.2 mtoe
2012 Total Fuel
Consumption: 36.6 mtoe
23
Natural Gas in Colombia: Increasing Demand and Vast Reserves
(0.2)%
0.4% 2.8% 3.1%
10.5%
20.9%
Petro-chemical
Industrial Residential PowerGeneration
NGV Refinery
Bucaramanga
Bogotá
Cali
Medellín
2.99 tcf
0.02 tcf
2.11 tcf
Eastern
Producers:
Ecopetrol
Equion
Upper Magdalena Valley
Lower and Middle
Magdalena Valley
Northern
Producers:
Chevron
Ecopetrol References
Natural Gas Reserves
Main Oil & Gas Basins
City
1.89 tcf
Llanos
Orientales
Catatumbo
Guajira
Sinu
Tumaco
Choco
Valle Superior
Del Magdalena
Cordillera
Oriental
Valle Inferior
Del
Magdalena
Valle Medio
Del
Magdalena
11.7
7.0
0.4 0.3 0.1
Reserves perUPME¹
Reserves perANH²
2012 Production 2012 Demand 2012 Exports
tcf
Prospective Non-Conventional Prospective Conventional
Probable + Possible Proved
Oil34.7%
Hydroelectric29.5%
Natural Gas
24.3%
Coal10.9%
Renewables0.5%
Oil44.2%
Hydroelectric27.7%
Natural Gas
14.3%
Coal13.6%
Renewables0.3%
637 695 731 723810 860
783 819936
1012
2005 2006 2007 2008 2009 2010 2011 2012 2013E2016E
'05-'12 CAGR: 3.7%
'12-'16 CAGR: 5.4%

24
Regulatory framework established to attract private sector investment
Law 142 (1994) establishes system of open entry to the natural gas transportation sector − No term limitation for the provision
of the service − Assets used in the provision of the
service are not owned by the state but by the company providing such service
CREG required by law to seek input from market participants
CREG is an independent regulatory body that controls natural gas regulation − Sets tariffs, promotes competition
and monitors quality of service
Tariff calculation based on the principle of financial feasibility and economic efficiency
Tariffs are set in order to allow the service provider to: − Recover operational costs and
investments − Obtain a return on investment
comparable to what an efficient company would obtain in a sector of similar risk
Cost recovery, attractive regulated return on investment and protection against inflation
Transporters are given full recovery of operating and maintenance expenses − Adjusted by Colombian Price
Index (CPI) Dollar indexation of investment
remuneration tariff Different rates of return applied
when determining fixed and variable charges
Constructive and stable regulatory framework
Source: Company information.
The Colombian gas transportation regulatory framework was established to attract private sector investment and provide adequate cost recovery and regulated returns

Appendix 2 – Shareholders
26
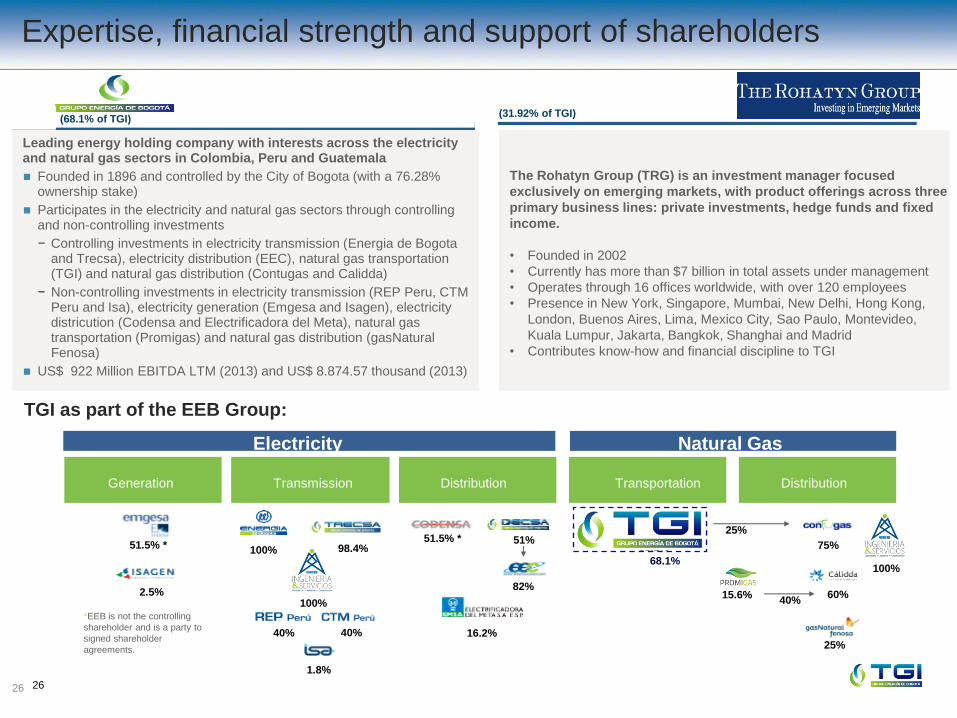
(68.1% of TGI)
Leading energy holding company with interests across the electricity and natural gas sectors in Colombia, Peru and Guatemala
Founded in 1896 and controlled by the City of Bogota (with a 76.28% ownership stake)
Participates in the electricity and natural gas sectors through controlling and non-controlling investments
− Controlling investments in electricity transmission (Energia de Bogota and Trecsa), electricity distribution (EEC), natural gas transportation (TGI) and natural gas distribution (Contugas and Calidda)
− Non-controlling investments in electricity transmission (REP Peru, CTM Peru and Isa), electricity generation (Emgesa and Isagen), electricity districution (Codensa and Electrificadora del Meta), natural gas transportation (Promigas) and natural gas distribution (gasNatural Fenosa)
US$ 922 Million EBITDA LTM (2013) and US$ 8.874.57 thousand (2013)
The Rohatyn Group (TRG) is an investment manager focused
exclusively on emerging markets, with product offerings across three
primary business lines: private investments, hedge funds and fixed
income.
• Founded in 2002
• Currently has more than $7 billion in total assets under management
• Operates through 16 offices worldwide, with over 120 employees
• Presence in New York, Singapore, Mumbai, New Delhi, Hong Kong,
London, Buenos Aires, Lima, Mexico City, Sao Paulo, Montevideo,
Kuala Lumpur, Jakarta, Bangkok, Shanghai and Madrid
• Contributes know-how and financial discipline to TGI
(31.92% of TGI)
Expertise, financial strength and support of shareholders
26
68.1%
25%
15.6%
Electricity
Transmission
40% 40%
1.8%
98.4%
Generation
51.5% *
2.5%
Distribution
51.5% *
16.2%
51%
82%
Distribution Transportation
Natural Gas
75%
60%
100%
*EEB is not the controlling
shareholder and is a party to
signed shareholder
agreements.
40%
25%
68.1%
TGI as part of the EEB Group:
100%
100%

27
Appendix 3 – EEB Overview

28
EEB Strategy and Overview Strategy
Transportation and distribution of energy
Key facts
More than 100 years’ experience in the sector; founded in 1896.
Regional leader in the energy sector; major player in the entire electricity
and natural gas value chains (except E&P); operations in Colombia,
Peru, and Guatemala.
Largest stockholder is the District of Bogota - 76.2%.
Stock listed on the Colombia stock exchange; EEB adheres to global
standards of corporate governance.
The EEB Group is one of the largest issuers of equity and debt in
Colombia
USD Million 2013
Operating revenue 1,016
Operating income 315
EBITDA LTM 922
Net Income 438
Consolidated - Covenants 2013
Leverage Ratio 1.48
Interest Coverage Ratio 11.1
68.1%
25%
15.6%
Electricity
Transmission
40% 40%
1.8%
98.4%
Generation
51.5% *
2.5%
Distribution
51.5% *
16.2%
51%
82%
Distribution Transportation
Natural Gas
75%
60%
100%
*EEB is not the controlling
shareholder and is a party to
signed shareholder
agreements.
40%
25%
100%
100%
Focus on
natural
monopolies
Ample access
to capital
markets
Ambitious
projects in
execution
Growth in
controlled
subsidiaries
Sound
regulatory
framework
Experienced
management
and partners

29
Disclaimer
This presentation contains statements that are forward-looking within the meaning of Section 27A of the Securities Act of 1933, as amended
(the “Securities Act”), and Section 21E of the Securities Exchange Act of 1934, as amended. Such forward-looking statements are only
predictions and are not guarantees of future performance. All statements other than statements of historical fact are, or may be deemed to
be, forward-looking statements. Forward-looking statements include, among other things, statements concerning the potential exposure of
TGI, its consolidated subsidiaries and related companies to market risks and statements expressing management’ expectations, beliefs,
estimates, forecasts, projections and assumptions. These forward-looking statements are identified by their use of terms and phrases such as
“anticipate”, “believe”, “could”, “estimate”, “expect”, “intend”, “may”, “plan”, “objectives”, ”outlook”, “probably”, “project”, “will”, “seek”, “target”,
“risks”, “goals”, “should” and similar terms and phrases. Forward-looking statements are statements of future expectations that are based on
management’s current expectations and assumptions and involve known and unknown risks and uncertainties that could cause actual
results, performance or events to differ materially from those expressed or implied in these statements. Although TGI believes that the
expectations and assumptions reflected in such forward-looking statements are reasonable based on information currently available to TGI’s
management, such expectations and assumptions are necessarily speculative and subject to substantial uncertainty, and as a result, TGI
cannot guarantee future results or events. TGI does not undertake any obligation to update any forward-looking statement or other
information to reflect events or circumstances occurring after the date of this presentation or to reflect the occurrence of unanticipated events.

30