Texture‐modified 3D printed dark chocolate: Sensory ...
38
Texture-modified 3D printed dark chocolate: Sensory evaluation and consumer perception study Sylvester Mantihal, Sangeeta Prakash, Bhesh Bhandari* School of Agriculture and Food Sciences, the University of Queensland, St Lucia QLD 4072, Australia *Corresponding author’s details: Prof. Bhesh Bhandari; Phone: +61 7 33469192; Email: [email protected] Abstract This study aimed to assess the preferences and perceptions of texture-modified 3D printed chocolate through three measures, two tasting tests and one survey. In the first test, 30 semi-trained panellists ranked their overall preference from among the three samples of chocolate printed in a honeycomb pattern with infill percentages of 25%, 50% and 100%. The panellists ranked the samples based on appearance and hardness. In the second test, the same panellists nominated one preference between a 3D printed sample (100% infill percentage) and a cast commercial chocolate sample. Friedman test indicated that there was no significant difference in overall preferences for hardness although the panellists significantly preferred the appearance of samples with 25% and 50% over the 100% infill. Further, there was no significant difference in preference between the cast and 100% infill samples. The texture data of the chocolate samples showed that a higher force was required to break the chocolate samples as the infill percentage increased from 25% (20.4 ± 1.1 N) to 100% (54.4 ± 1.5 N). Also, the 3D printed chocolate (printed in 100% infill percentage) was found to be less hard than that of casted chocolate. In the survey of consumer perceptions, a total of 244 participated and assessed the samples for their intricate design and novel technology concept through a questionnaire. While there was a general awareness of 3D printing technology among these participants, many were impressed with the application of 3D printing to chocolate, as this was the first time they had seen this. The results obtained from the sensory tests and consumer survey provided a useful insight into consumer s’ perception of 3D food printing and the 3D products design. This awareness will be beneficial to promote this technology in the food industry. Keywords: 3D food printing, texture modification, infill percentage, sensory. This article is protected by copyright. All rights reserved. Accepted Article This article has been accepted for publication and undergone full peer review but has not been through the copyediting, typesetting, pagination and proofreading process, which may lead to differences between this version and the Version of Record. Please cite this article as doi: 10.1111/jtxs.12472
Transcript of Texture‐modified 3D printed dark chocolate: Sensory ...

Texture-modified 3D printed dark chocolate: Sensory evaluation and consumer
perception study
Sylvester Mantihal, Sangeeta Prakash, Bhesh Bhandari*
School of Agriculture and Food Sciences, the University of Queensland, St Lucia QLD 4072,
Australia
*Corresponding author’s details: Prof. Bhesh Bhandari; Phone: +61 7 33469192; Email:
Abstract This study aimed to assess the preferences and perceptions of texture-modified 3D printed
chocolate through three measures, two tasting tests and one survey. In the first test, 30 semi-trained
panellists ranked their overall preference from among the three samples of chocolate printed in a
honeycomb pattern with infill percentages of 25%, 50% and 100%. The panellists ranked the
samples based on appearance and hardness. In the second test, the same panellists nominated one
preference between a 3D printed sample (100% infill percentage) and a cast commercial chocolate
sample. Friedman test indicated that there was no significant difference in overall preferences for
hardness although the panellists significantly preferred the appearance of samples with 25% and
50% over the 100% infill. Further, there was no significant difference in preference between the
cast and 100% infill samples. The texture data of the chocolate samples showed that a higher force
was required to break the chocolate samples as the infill percentage increased from 25% (20.4 ± 1.1
N) to 100% (54.4 ± 1.5 N). Also, the 3D printed chocolate (printed in 100% infill percentage) was
found to be less hard than that of casted chocolate. In the survey of consumer perceptions, a total of
244 participated and assessed the samples for their intricate design and novel technology concept
through a questionnaire. While there was a general awareness of 3D printing technology among
these participants, many were impressed with the application of 3D printing to chocolate, as this
was the first time they had seen this. The results obtained from the sensory tests and consumer
survey provided a useful insight into consumers’ perception of 3D food printing and the 3D
products design. This awareness will be beneficial to promote this technology in the food industry.
Keywords: 3D food printing, texture modification, infill percentage, sensory.
This article is protected by copyright. All rights reserved.
Acc
epte
d A
rticl
e
This article has been accepted for publication and undergone full peer review but has not been through the copyediting, typesetting, pagination and proofreading process, which may lead to differences between this version and the Version of Record. Please cite this article as doi: 10.1111/jtxs.12472

1. Introduction
3D food printing (3DFP) is a novel technology that is capable of creating a complex geometry.
Thus, 3DFP provides the freedom to fabricate food in numerous structures. Recently, several
research studies into many facets of food printing have been published including the application of
additives (Rapisarda et al., 2018) and the influence of this technology on food textural properties
(Prakash, Bhandari, Godoi, & Zhang, 2019). 3DFP also provides the opportunities for creativity in
the design of structures (Noort, Van Bommel, & Renzetti, 2017). In 3D printing, the most important
component of texture variation is in the internal structure which consists of the infill pattern and the
infill percentage (RepRap, 2016). The infill pattern refers to the type of configuration that will form
as a pattern within the printed construction. The infill percentage is the intensity of the
mesostructure (layer-to-layer gap) of the material upon deposition. This structure (pattern and
percentage) is designated in the slicing software before the printing process (Fernandez-Vicente,
Calle, Ferrandiz, & Conejero, 2016). The incorporation of the infill pattern and percentage in 3D
printing creates a unique internal microstructure within the printed food.
The infill structure within printed food will influence the construction’s sensorial textural
attributes. Le Tohic et al. (2018) compared the texture of cheese printed in 100% infill with cast
cheese prepared using moulding. They reported that printed cheese is 49 % softer than cast cheese
even when printed with 100% infill. Severini, Derossi, and Azzollini (2016) reported that a cereal-
based product printed in 20% infill required a 62.62 N force to break the samples as compared to
samples printed in 10% infill, which needed 26.31 N. This finding indicates that the infill
percentage influences the mechanical strength of the constructions, as increasing the infill
percentage tends to create a harder construction (Dizon, Espera, Chen, & Advincula, 2018). A
lower infill percentage will create a hollow internal structure within printed food contributing to
textural variation. In our previous work (Mantihal et al ., 2018), the void fraction of the printed
chocolate when printed in 60% infill (with a honeycomb pattern) was 11.6 ± 2.3 % while printing in
5% infill resulted in 68.8 ± 4.4 % voids.
3D printing technology demonstrated that food texture could be modified to suit personal
requirements (Vancauwenberghe et al., 2018). As food texture is an essential characteristic in
defining the quality of food, it is also a vital sensory attribute that can affect an individual’s
sensation experience during oral consumption. The 3D printing can address the personalising of
nutritional needs and also achieve the texture requirements for elderly people with dysphagia
(Lipton, Cutler, Nigl, Cohen, & Lipson, 2015). Also, 3DFP is able to offer a texturised and
palatable food shape which provides the patient some enjoyment in eating rather than the monotony
of consuming only pureed food (Noort et al., 2017). Thus, 3DFP is considered a powerful
technology that is able to tailor food to personal preferences, particularly in shape and texture.
This article is protected by copyright. All rights reserved.
Acc
epte
d A
rticl
e

The perceived texture is closely related to the structure and composition of food (Aguilera &
Park, 2016; Lupton & Turner, 2018). Severini, Derossi, Ricci, Caporizzi, and Fiore (2018)
investigated the sensory attributes (appearance, taste, odour and colour) of 3D printed fruits and
vegetables with a reduction in moisture content to increase the viscosity of the formula. The
researchers reported that the appearance attribute of printed smoothies was significantly different to
that of food formula, with a value of 4.60 ± 0.74 for printed samples compared with 3.37 ± 1.1 for
food formula. Also, there was no significant difference between the colour, taste and odour of
printed smoothies and the non-printed samples. Their results suggested that 3DFP was able to
improve the visual appeal of food. However, this finding was limited to the sensory attributes of 3D
printed food based on formula modification rather than on the alteration of the internal structure of
printed food.
Texture is an important attribute for consumers’ acceptance of a food which is influenced by
their conventional perception of food and view on the production of the food product. Thus, the
perception about this new technology could be a barrier for consumers to accept 3D printed food.
McCluskey, Kalaitzandonakes, and Swinnen (2016) explored an extensive review on the
application of a new technology to produce food and its influence on consumer behaviour and
public perceptions based on media coverage. Issues such as misconceptions, a lack of knowledge
and a negative attitude were found to be drawbacks in consumer acceptance of new food production
technology. However, McCluskey et al. (2016) emphasised that a proactive knowledge
dissemination and established credible reports from reliable sources (scientists, firms) could
overcome consumers’ perception of risk in regard to new food technologies.
Recently, the acceptance of 3D printed food has been studied in various settings and among
targeted consumers. Brunner, Delley, and Denkel (2018) explored Swiss consumers’ attitudes and
attitudinal changes toward 3D printed food using a survey. The questionnaire was constructed with
14 predictors, constituting variables of food neophobia, benefits perception, nutritional knowledge,
previous knowledge, and technology neophobia (Brunner et al., 2018). The questionnaire design
consisted of a six-point Likert scale and response options ("true", "false" and "don't know") and a
postal method to distribute the questionnaire to target participants. After an intervention which
consisted of the feedback from the respondents, they reported that its outcome was successful in
overcoming consumers’ food neophobia and convincing consumers that 3DFP technology is
capable of producing healthy and individualised meals with an exciting food design.
Similarly, Lupton and Turner (2018) also explored consumer attitudes toward 3D food
printing with a different approach by outsourcing a specialised company to conduct an online
discussion among 30 Australians aged 18 years and older. During this discussion, participants were
supplied with a set of questions with seven photographs of 3D printed foods from different
formulations and designs (1) confectionary with multiple design geometry (2) insect formulation (3)
This article is protected by copyright. All rights reserved.
Acc
epte
d A
rticl
e

carrot based puree (4) vegetable and chicken (5) pizza (6) pasta with intricate shapes and, (7)
chocolate in a rose shape. For familiarisation, the ingredients of each food in the given photograph
were listed. The participants were asked to respond to each image with some question items using a
scale of 1 to 10 and some open-ended questions. The results suggested that the ingredients, sensory
quality and level of processing were the key elements in determining consumer acceptance of 3D
printed food.
To our knowledge, there are no reports as yet of sensory evaluation of the food texture in 3D
printed foods which have been modified by varying the internal structure. That is to say, there have
been attempts to gauge the consumers’ attitudes solely by a survey, without actual 3D printed food
presented for the consumer to view. Therefore, this study aimed to demonstrate the capability of
3DFP to modify food texture by altering the internal structures of printed chocolate. A sensory
evaluation of texture-modified 3D printed chocolate was conducted among 30 semi-trained
respondent to assess consumers’ preferences concerning sensory attributes such as texture and
appearance and their overall preferences. 3D printed chocolates with various infill patterns and
percentages were displayed and a questionnaire was distributed to assess respondents’ awareness
and opinions on 3D printed foods. The outcome of this study is expected to benefit to food
entrepreneurs and organisations that wish to adopt this novel technology in their businesses.
2. Materials and Method
2.1 Materials
Two types of dark chocolates, Cadbury dark chocolate (Choc-1) and Callebaut dark chocolate
buttons (Choc-2) purchased locally in Brisbane, Australia were used in this study. Choc-1 was also
used for cast chocolate samples as a control. The composition of the Cadbury dark chocolate was
53% (minimum) cocoa solids, 35% (minimum) cocoa butter, 0.5% lecithin, and approximately
11.5% sugar. The Callebaut dark chocolate buttons (bittersweet flavour, Lindt Piccoli) were
composed of 58% (minimum) cocoa solids, 33% (minimum) cocoa butter, 5% anhydrous milk fat,
0.5% lecithin and vanilla and about 3.6 % sugar. Both dark chocolate samples (Choc-1 and Choc-2)
were ground separately into powder in a controlled temperature room at around ~ 5°C and kept in
refrigeration (~ 8 °C) separately until the initiation of the printing process.
2.3 Commercial dark chocolate casting process
Casting of Choc-1 was done to compare it with the textural property of 3D printed
chocolate. Before casting, the chocolate was melted at a controlled temperature at around 32 °C
using a chocolate melting machine (ChocEdge, UK). Melted chocolate samples (10 g) were poured
This article is protected by copyright. All rights reserved.
Acc
epte
d A
rticl
e

into a 3D printed cast (printed using scrylonitrile butadiene styrene (ABS) filament, see Figure 1)
and covered by a thin layer of clear food grade plastic wrap. All samples were kept under
refrigeration at around 8 °C until the initiation of the textural analysis and sensorial evaluation.
<Figure 1>
2.2 Printing process
The 3D chocolate printing consisted of three essential steps: (i) making the 3D geometry design, (ii)
slicing the design and (iii) the printing process.
i. 3D geometry design: Chocolate Model (1) of 20 mm x 50 mm and 5 mm thickness and
Chocolate Model (2) of 43.5 mm x 35.5 mm and 5 mm thickness were designed using
TinkerCad online software.
ii. Slicing: The 3D models from the above online software were uploaded into the Repetier-
Host software (.stl file) and sliced using Sli3er configuration to generate the g-code for each
model. The shell perimeters were set at default three shells (approximately ~ 2.34 mm
thickness) considering the inner nozzle diameter is 0.78 mm. Model (1) for Choc-2 was set
to a honeycomb infill pattern with a variation of infill of 25%, 50%, and 100% as shown in
Figure 2. Model (2) for Choc-1 was set to a rectilinear pattern with 100% infill to mimic the
commercial chocolate block. All samples were sliced (with the specific g-code extracted for
each 3D model) according to each infill pattern and infill percentage using Sli3er software.
iii. Printing process: A Shinnove 3D printer (Model No. Shinnove-D1, Shiyin Co. Ltd,
Hangzhou, China) was used in this study, as illustrated in Figure 3. The printer was
equipped with a syringe-based extrusion unit with a capacity of 60 mL in each syringe. Two
syringes are inserted into two separate heating barrels which shared the same shaft and
bearings. Therefore, each syringe barrel could be controlled individually to deposit food
materials. The nozzle diameter used was 0.78 mm and the printing speed set in the Sli3er
software was 70 mm/s. These printing parameters were optimised as per the researcher’s
previous work (Mantihal, Prakash, Godoi, & Bhandari, 2017). The printer bed (stainless
steel) temperature was maintained between 15 °C and 16 °C by a recirculating water system.
A total of 132 samples was prepared. All printed samples were kept under refrigeration at
around 8 °C until the execution of textural analysis and sensory evaluation.
<Figure 2>
<Figure 3>
This article is protected by copyright. All rights reserved.
Acc
epte
d A
rticl
e

2.4 Dimensional and weight measurement of 3D printed chocolates
A digital calliper (0-150 mm, CraftRight®, Bunnings, Australia) was used to measure the
dimensions of the 3D printed chocolate (length, width and thickness). This was done in three
different positions on each printed chocolate samples for accuracy and the average value (mm) was
reported. Also, a digital weighing balance was used to assess the weight of each printed chocolate
sample.
2.5 Texture properties of 3D printed chocolate
The texture attribute of hardness was obtained by texture analysis using a texture analyser (Model
TA-XT Plus, Stable Microsystem, UK) equipped with a 10.0 kg load cell with Exponent version
6.1.9.0 software. A TA-42 knife blade was used, and the test was conducted at room temperature
(around 23 °C). Compression mode was used to analyse the samples at 10 mm distance. A pre-test
of the speed of 1.0 mm/s and the test speed of 2.0 mm/s with 5.0g trigger force were applied. The
measurement was conducted in triplicate and the data of maximum force (N) from the force-
displacement curve were extracted.
2.6 Sensory evaluation
The sensory profile of the printed chocolate was carried out to determine consumer acceptability of
3D printed chocolate. The chocolate was evaluated using a ranking test for preferences and a
paired-preferences test with the aid of RedJade sensory evaluation software. The sensory test was
conducted in a sensory analysis laboratory, at the School of Agriculture and Food Sciences (SAFS),
the University of Queensland, Australia. Ethical clearance approval for this evaluation was granted
by the Human Research Ethics Committee, University of Queensland. 30 semi-trained (panellist
who familiar with chocolate testing) panellists composed of 21 females and nine males from the
School were involved in the sensory test. The age range of the panellists was between 28 and 55
years. The printing time for each sample ranged from 3 to 5 minutes, depending upon the sample’s
infill percentage. The chocolate samples were kept at room temperature (23 °C) before evaluation.
Two sets of samples were served to the panellists, starting with three samples for a ranking test for
preferences. Once the panel completed the ranking test, the second set of samples (2 samples) for
the paired preference test was given to the panellists.
For the ranking test for preferences, three dark chocolate (Choc-2) samples were prepared with
dimensions of 20 mm x 50 mm and 5 mm thickness, printed in honeycomb infill pattern with infill
percentages of 25%, 50% and 100%. The sensory attributes assessed were appearance, hardness and
overall preferences using Rank 1 for the most preferred, Rank 2 for the medium ranking and Rank 3
for the least preferred. The printed samples were coded with three random numerical numbers and
This article is protected by copyright. All rights reserved.
Acc
epte
d A
rticl
e

placed in random order on one paper plate for each respondent. For the paired-preferences test, two
dark chocolate (Choc-2) samples were served (dimensions: 43.5 mm x 35.5 mm and 5 mm
thickness). One sample was printed in 100% infill with a rectilinear pattern, and another was the
cast chocolate block. The samples were coded with three random digits and served randomly on the
plate. In this test, the panellist had to choose which chocolate they preferred the most.
2.7 Consumer survey
To obtain consumers’ attitudes and knowledge about 3D food printing, 3D printers (Porimy and
Shinnove-D1) and printed chocolate samples (various design) were displayed at the University of
Queensland premises and a questionnaire was designed and distributed among the University of
Queensland community. The questionnaire design and data collection were conducted as follows:
2.7.1 Design of questionnaire
The survey began with a brief description of the research study – consumer perceptions about 3D
food printing – in which consumers were informed about this novel technology for printing food.
The questionnaire consisted of five sections (1) demographics (2) knowledge about 3D printing (3)
perception about the benefit of 3D printing (4) opinion about the 3D printed chocolate products on
display and (5) measure of attitude toward 3D printed food. In the first section, the respondent was
asked a series of socio-demographic questions (gender, age, nationality, occupation and household
size). In the second section, the respondent’s knowledge was assessed using three items, for which
the respondent had to indicate either “yes”, “no”, or “don’t know”. This was adopted from Brunner
et al. (2018). Next, the respondent was asked about their perception of the benefits of 3D food
printing in terms of it creating appealing shapes, being a ready to serve food, being used to prepare
healthy snacks, potentially addressing a swallowing problem (dysphagia), and the potential of 3D
food printing to minimise waste. In the third section, the respondent’s perception was assessed
using seven items and their responses noted as binary (“yes” or “no”) answers. In the fourth, the
respondent was asked about the 3D printed chocolate products on display. Opinions about these
printed chocolates’ attributes (appearance and design complexity) were sought and also their
willingness to consume the novel chocolate structure (indication of food neophobia) was gauged.
Furthermore, the respondent was asked if they would like a 3D printer at home. In this section, the
respondent ranked their responses on a scale from 1 to 10. In the last section, the respondent’s
attitude to 3D printed food in general (Brunner et al., 2018) was assessed and their answers were
again ranked on a scale from 1 to 10.
A 3D food printing display was made at the University of Queensland (UQ), at a central location
where there is usually a lot of movement of students, staff members and visitors. The 3D food
printers were displayed in operation and 3D printed chocolate samples were presented. A
This article is protected by copyright. All rights reserved.
Acc
epte
d A
rticl
e

questionnaire-based consumer survey (form) was distributed using the simple random method
during the display to UQ students, staff and public visitors and collected on completion. A total of
280 questionnaires was distributed and 244 questionnaires were successfully collected. During
filling in the questionnaire, people were exposed to the 3D food printer and observed some printed
chocolates as well as the demonstration of chocolate printing. The data collection was performed
around mid-October 2018. Chocolate was printed in various shapes and dimensions for display
purpose. Figure 4 exhibits these 3D printed chocolates with various dimensions, infill patterns and
infill percentages.
<Figure 4>
2.8 Statistical analysis
Dimensional properties (weight, width, length and thickness), and mechanical strength (Force –N)
were presented as mean values ± standard deviation. Minitab version 17 (statistical software) was
used to analyse the significant difference between values using the one-way analysis of variance
(ANOVA) Tukey’s test (where applicable). The significant difference was determined at p-value
(p) of less than 0.05. The ranking of preferences (sensory analysis) was compared using a
nonparametric, Friedman test. The significant difference of the sensory attributes was determined
at (p) of less than 0.05. IBM’s Statistical Package for Social Science (SPSS) version 24.0 was used
to analyse the survey data. A descriptive analysis was performed for the sample profile of
respondents’ demographics. A Chi-square test was conducted to determine the significant
relationship between categorical variables. Cronbach’s alpha values were computed, taking into
consideration the values greater than 0.60 (Bernstein & Nunnally, 1994; Sekaran & Bougie, 2016).
3. Results and Discussion
The 3D printed constructions and cast chocolate block for Choc-1 (Cadbury dark chocolate) and
Choc-2 (Callebaut dark chocolate) are illustrated in Figure 5. As can be seen in the figure, the 3D
printed chocolate constructed with various infill percentages (25%, 50% and 100%) were able to
support the size and shape of the constructions. Also, the hollow structure was visible in chocolate
printed in 25% and 50% infill when the chocolate was snapped. The physical properties (thickness,
width, length) and weight are discussed in the subsequent section.
<Figure 5>
3.1 Evaluation of dimensional properties and weight of 3D printed chocolate
Table 1 shows the recorded thickness, width and length of the 3D constructs. As can be seen in
Table 1, the thickness of the construction printed with Choc-2 (regardless of infill percentages)
This article is protected by copyright. All rights reserved.
Acc
epte
d A
rticl
e

remained the same; there was no significant difference (p <0.05) between samples printed in 25%
(5.09 ± 0.03 mm), 50% (5.12 ± 0.07 mm) and 100% (5.06 ± 0.04 mm), respectively. Also, the width
and length of the constructions showed similarity to that of the predesign geometry, as there was no
significant difference (p <0.05) between samples printed in 25%, 50% and 100% infills. Similarly,
for samples printed with Cadbury dark chocolate (Choc-1), the thickness, width and length of the
printed product (100% infill) were not significantly different (p <0.05) with those of the cast
chocolate block (see Table 1).
<Table 1>
The dimensions of the cast chocolate block remain as per the predesign model because the
chocolate was moulded explicitly to the predetermined dimensions. Similar results were reported by
different authors for other 3D printed materials. Liu, Bhandari, Prakash, and Zhang (2018) reported
that mashed potato constructions printed in 10%, 40% and 70% infill were closely matched to the
design geometry. Also, Yang et al. (2018) designed an intricate geometry of Mickey Mouse with a
predesign model (length 5.40 cm, width 5.00 cm and height 2.30 cm) using dough as the main
substrate. They verified that 3D printing was able to re-create an intricate design precisely to that of
the design geometry with the dimensions of 5.41 cm in length, 4.95 cm in width and 2.28 cm in
height. These findings indicate that 3D food printing was capable of producing a product with
accurate dimensions. Thus, the results suggest that this novel technology is a great tool for food
customisation.
A significant difference (p <0.05) was observed in the weight of each construction printed in
various infill percentages: 25% (4.70 ± 0.64 g), 50% (6.03 ± 0.21 g) and 100% (8.39 ± 0.65 g).
Also, the weight of printed chocolate (Choc-1) was recorded as less than that of the cast chocolate
block (9.21 ± 0.52 g). The difference of weight between the 3D printed chocolate and cast samples
is due to the layer-by-layer deposition method in the 3D printing process. In the printing process,
the fusion between layers of chocolate will be formed by gravity, cohesive effects and the swell
behaviour of extruded chocolate (Mantihal et al., 2019). Incomplete fusion of layers with their
adjacent layers will cause micro-voids in the microstructure. These layers could be visually seen in
the 3D printed chocolate. In comparison, the cast sample preparation involves filling the mould with
molten chocolate to form a single solid and compact mass. Therefore, this difference in production
influences the weight of the chocolate.
It is expected that increasing the infill percentage will increase the weight of the printed
construction (Table 1). The increased weight is due to the amount of extruded material used to fill
the construction to accommodate the preset infills (Severini et al., 2016). Fernandez et al. (2016)
This article is protected by copyright. All rights reserved.
Acc
epte
d A
rticl
e

also reported that the weight of the constructs (ABS filament) significantly increased from 11.2 g up
to 18.9 g, respectively as the constructs were printed from 20% to 100% infill (with honeycomb
infill pattern). These results confirm that a variation in infill percentage would strongly influence
the 3D food construction’s weight.
3.2 Textural evaluation of 3D printed and cast chocolate
A textural analysis was performed to determine the mechanical strength of the 3D constructions. In
this experiment, honeycomb infill pattern was applied as this criss-cross pattern provides strong
support in 3D construction (McLouth, Severino, Adams, Patel, & Zaldivar, 2017; Murphy & Atala,
2014). Figure 6 exhibits of force (N) as a function of distance (mm) of chocolate printed with Choc-
1 (with 100% infill and cast samples) and Choc-2 with a variation of infill percentages (25%, 50%
and 100%). Figure 6a clearly shows that the cast chocolate requires a higher force (N) to break the
samples than that of the 3D printed construction with 100% infill. In Figure 6b, a variation of force
(N) was observed as the infill percentage increased. A steep curve with slight displacement can be
seen indicating a good snap quality of all the chocolate samples (Beckett, 2011; Mantihal et al.,
2018).
<Figure 6>
Table 2 summarises the force (N) required to break chocolate samples printed with Choc-1 (with
100% infill in a rectilinear pattern and cast samples) and Choc-2 (in 25%, 50% and 100% infill) in a
honeycomb pattern. As can be seen in Table 2, the 3D printed Choc-2 required an increase in the
force (N) to break the samples as the infill percentage increased. It was observed that chocolate
printed with 25% infill required 20.44 ± 1.12 N, 50% required 33.52 ± 1.55 N and 100%, 54.43 ±
1.47 N, respectively. The forces were significantly different at p < 0.05.
<Table 2>
For Choc-1, there was also a significant difference (p < 0.05) in the force (N) required to break the
cast and 100% infill chocolate samples, a (83.58 ± 1.40 N and 71.06 ± 1.35 N, respectively)
although the 100% infill was similar to the cast chocolate dimension. The reduced resistance to
break the printed Choc-1 (3DP100%_IP) is due to a weak interface of layers affected by the
sequential layering upon printing. This result is also in line with Le Tohic et al. (2018) who reported
that the hardness of the 3D cheese construction diminished by ~ 49% compared to that of cast
cheese. Therefore, cast samples are relatively tougher than printed constructions even when printed
at 100% infill.
This article is protected by copyright. All rights reserved.
Acc
epte
d A
rticl
e

Also, an increase in percentage infill means that the intensity of deposited layers (mesostructure)
becomes compact as the higher IP is achieved (Rankouhi, Javadpour, Delfanian, & Letcher, 2016).
Figure 5 illustrates that a larger hollow structure can be seen in samples printed with 25% infills and
this becomes compact when samples are printed in 50% infill while no void was visible for samples
printed in 100% infill. A similar concept was presented in a pectin-based food stimulant printed in
honeycomb structure (Vancauwenberghe et al., 2018). The researchers reported that the Young’s
modulus of printed samples with larger cell size was less (11.58 ± 1.43 kPa) than that of samples
printed in a cube which was similar to printing in 100% infill (118.58 ± 12.10 kPa). Thus, by
altering the infill percentage the texture of the printed construction will substantively change.
Based on the results of the dimension and textural properties testing of the 3D printed chocolate, we
found that the 3DP was capable of producing a precise 3D construction to target geometry. Also, an
increase in the mechanical strength of 3D printed chocolate is correspondingly influenced by the
variation of infill percentage. Overall, the texture (hardness) of 3D printed chocolate can be
changed subject to internal structure modification. In the next section, we attempt to explore the
sensorial properties of 3D printed dark chocolate through sensory evaluation and assessing
consumer preferences.
3.3 Sensory evaluation of 3D printed dark chocolate
In this evaluation, 30 participants (21 females and nine males) were selected. Three printed samples
with different infill percentages (Choc-2) were given for the ranking preference test and two
samples of Choc-1 (3D printed and cast chocolates) given for the paired preference test.
3.3.1 Ranking for preference evaluation
Table 3 presents the estimated median based on the Friedman test (nonparametric) and p-value for
3D printed dark chocolate samples (at 25%, 50% and 100% infill) in an evaluation of ranking for
preferences in terms of appearance and hardness and overall preferences. As can be seen in Table 3,
there was a significant difference (p < 0.05) between the preferred appearance of the 3DP samples
(Choc-2) as most participants favoured the appearance of sample 3DP100%_IP (1.33) to those of
samples 3DP25%_IP (2.00) and 3DP50%_IP (2.67). These results indicate that the participants
mostly prefer the smooth appearance of the 3D printed chocolate (see Figure 5). As the infill
structure is printed at closer to 100% infill, the infill structure provides sufficient support to the top
layer and prevents it from any surface deformation (Mantihal et al., 2018). Thus, a smooth and even
top layer is produced as the infill percentage increased. The appearance of the 3DP construction was
vital as this modality can influence the acceptability of the product.
<Table 3>
This article is protected by copyright. All rights reserved.
Acc
epte
d A
rticl
e

There were no significant differences (p > 0.05) in the participants’ preferred texture (hardness)
among the 3DP samples. However, participants indicated their preferences for the hardness of
chocolate sample (by bitting the 3D printed chocolate) 3DP25%_IP (1.66) as compared to
3DP50%_IP (2.00) and 3DP100%_IP (2.33). This result corroborates with the finding in Section
3.2, indicating that samples printed in 25% infill are less hard than samples printed in 50% and
100% infill. In this case, we found that the participant is likely to choose a modified texture (less
hard). The way the texture changes is significant in determining food product acceptance (Jeltema,
Beckley, & Vahalik, 2016) and 3DP provides freedom to customise a design, modify textures and
alter palatibility (Dankar, Haddarah, El Omar, Sepulcre, & Pujolà, 2018; Devezeaux de Lavergne et
al., 2016; Szczesniak, 2002)
In terms of overall preferences, no significance difference (p > 0.05) was found among all 3D
printed chocolate (Choc-2) samples with different infill percentages. The decision about overall
preferences is based on the participants’ satisfaction in the product’s appearance (Andersen,
Brockhoff, & Hyldig, 2019) and texture (James, 2018). These attributes are essential to determine
consumer preferences in chocolate (Sune, Lacroix, & Huon de Kermadec, 2002). Pannelists could
feel the texture when consuming the 3D printed chocolate. This perception is influenced by varying
the infill structure of the construction.
3.3.2 Paired preference evaluation
Figure 7 represents the results of the paired preference test of the 3D printed Choc-1 in 100% infill
and the cast chocolate block, based on textural attribute. No significant difference was identified
between the samples as the results indicate that 50% of participants chose the 3D100%_IP
chocolate, and 50% chose the cast samples. This could be because the 3D printed 100% infill
chocolate is perceived to be similar to cast samples with no apparent void existing in the printed
chocolate (Mantihal et al., 2018). Besides, participants were also asked to specify their reason for
choosing the chocolate samples. Participant mainly indicated that the 3D printed sample was less
hard than the cast sample. This notion corroborated with the finding stated in Section 3.2 (textural
properties), signifying that cast samples were tougher than of 3D printed chocolate (with 100% IP).
These findings indicate that 3D printed food provides a new texture experience to participants.
<Figure 7>
This article is protected by copyright. All rights reserved.
Acc
epte
d A
rticl
e

In this experiment, the application of 3DFP was successful in fabricating chocolate with different
infill percentages, which leads to textural modification. The 3D printed chocolate attributes
(appearance and texture) were appropriate to indicate the participant’s perception of the printed
product. The outcome from the sensorial experiment was that 3D printed food provided a good
impression as participants experienced the real product produced by this new technology. This
impression is an indication of a positive perception of a 3D printed food product (Brunner et al.,
2018).
Consumer test has to be done using a large representative (>100) sample size. The objective of this
study was to get a preliminary understanding of preference for 3D printed chocolate against
chocolate prepared using conventional method (mould). In this case, only a limited number (30) of
participants who enjoy consuming chocolate on a regular basis were considered. This is relatively a
low number in preference testing. Therefore, the results should be cautiously interpreted and
applied.
3.4 Consumer survey
The consumer survey was conducted mainly to explore consumer knowledge, awareness of 3D
printing technology and likelihood to accept the products produced from this technology. The
questionnaire consisted of five sections with 27 questions. The outcomes of the survey are
discussed in the subsequent sections.
3.4.1 Socio-demographics
The majority of the respondents were females 59.8%, with 40.2% males were aged between 20 and
39 years (majority); 51.2% were Australians, and 48.8% were citizens of other countries. Most of
the respondents were UQ students (84.8 %) while 15.2% were UQ staff, visitors and others. There
was a total of 244 participants.
3.4.2 Knowledge about 3D printing technology
3D food printing is a novel technology in food processing that can be used to personalise individual
needs (Sun, Zhou, Yan, Huang, & Lin, 2018). However, the lack of knowledge about 3DP
technology may significantly influence consumer opinion about accepting the new technology for
food (Sajdakowska et al., 2018). Therefore, disseminating emerging knowledge on new food
processing technology is crucial to attract consumer attention to it (Bruhn, 2007; Cardello, Schutz,
& Lesher, 2007; McCluskey et al., 2016). In this survey, we assessed the respondents’ knowledge
about 3DP technology using seven closed questions with results indicating α = 0.61. Tables 4a and
4b exhibit the descriptive analysis of knowledge about 3D printing obtained from these 244
respondents.
This article is protected by copyright. All rights reserved.
Acc
epte
d A
rticl
e

<Table 4a>
<Table 4b>
As can be seen in Table 4a, 63.5% of respondents indicated that they had heard/read and understood
about 3DP technology in general. Also, 66.5% indicated that they were familiar with 3D food
printing technology. These results mean that roughly two thirds of the respondents knew about the
technology. We anticipate that this awareness of 3DP technology could have been derived due to
the widespread use of social media (Pandey, Sahu, & Dash, 2018). The respondents’ understanding
of 3D printing was gauged with four questions related to food produced by the technology (plastic
food, artificial food, natural food and modified-ingredient food). These questions were adopted
from as study by Lupton and Turner (2018).
There was a significant relationship between the question “I have heard/read and understand about
3DP” (knowledge) and the respondents’ perception that 3DFP is either a plastic food [X2 (2, N =
244) =13.5, p < .05], artificial food [X2 (2, N = 244) =20.3, p < .05], or natural food [X
2 (2, N = 244)
=17.1, p < .05]. No significant relationships were observed for respondents’ understanding of 3DFP
in modified-ingredient food [X2 (2, N = 244) =4.1, p >.05]. These results signify that they clearly
understood the concept of 3DFP. The majority considered that food produced using 3DP
technology was not plastic or artificial (76.2 % and 54.1 %, respectively). These findings
challenged some of those by Lupton and Turner (2018) who reported that consumers are sceptical
about food produced by 3DFP as they perceive 3D printed food to be “unreal” and “not food like”
material. It is possible that due to the respondents in our study actually being able to observe the 3D
printing process for chocolate, their perceptions were dissimilar to those of participants in the
Lupton and Turner (2018) study.
Moreover, less than half thought that 3DFP technology uses natural and modified food (42.2 % and
47.5 %, respectively). Greehy, McCarthy, Henchion, Dillon, and McCarthy (2013) suggested that
the knowledge and understanding of new technology to produce food varies among individual.
These findings are valuable as an indicator that respondents are aware of the existence of 3DFP
technology. However, the more positive results indicated in this work could also be due to the fact
that we used more educated and informed participants at a university location. The perception might
be different for the general public.
This article is protected by copyright. All rights reserved.
Acc
epte
d A
rticl
e

3.4.3 Benefits of 3D printing
Despite constructing an intricate design, 3DFP can potentially be a useful tool to personalise
nutrition (Sun et al., 2018), it may reduce food wastage (Lupton & Turner, 2018), and it may also
address difficulties for people with a swallowing problem (dysphagia) (Lipton et al., 2015). The
perception of benefits from novel technology is a crucial determinant of consumer acceptance
(Ronteltap, van Trijp, Renes, & Frewer, 2007). In this survey, we asked about seven foreseeable
benefits of 3DFP to users. These questions were pooled from multiple studies (Lipton et al., 2015;
Lupton & Turner, 2018; Shier, 2016; Sun et al., 2018; Zoran & Coelho, 2011).
<Table 5>
Table 5 summarises the descriptive analysis (frequency and cross-tabulation) of 3DFP benefits to
users. Most of the probable benefits of 3DFP have a significant relationship (p < 0.05) with the
extent of knowledge about 3DFP. No significant relationship with this variable and the perceived
benefit that “3D food printing can create any appealing shapes/ design” [X2 (2, N = 244) =2.05, p >
0.05] was found. The majority of respondents (91.8%) indicated that they ascertain 3DFP can create
an appealing design. This response was valid as 3DFP was mainly developed to customise a
preferred design (Zhang et al., 2018). Also, most respondents indicated that 3DFP can create food
instantly (68.4%), can be used to prepare healthy snacks (56.1%), potentially addresses swallowing
dysphagia (53.7%), personalises nutrition (57.4 %) and has the potential to minimise waste (56.6%).
There are no significant differences in respondents’ perception about the benefits of 3DFP based on
gender, age or education (data not shown). Bruhn (2007) proposed that the demonstration of
benefits associated with new food processing technology would decrease the apprehension toward
the new technology, thus improving the acceptance and willingness to try the product. In this case,
to curb the respondents’ uncertainty about the use of a 3D food printer, we attracted the
respondents’ attention by exhibiting the 3D printer, which included a printing demonstration and 3D
printed chocolate samples. The display of the actual printing and samples may have influenced their
opinion on the benefits of this technology.
3.4.4 3D printed chocolate evaluation
As mentioned in the previous section, 3D printed chocolate was presented to the respondents to
experience the 3D printed product. We opted to print multiple shapes and design which included the
infill structures that the mould could not create (see Figure 4) by modifying the infill patterns and
percentages. 3DFP has demonstrated its competency in producing printed constructions precisely to
the target geometry (Liu, Zhang, Bhandari, & Wang, 2017). Appearance is the most critical factor
when it comes to evaluating new food concepts (Brunner et al., 2018; Greehy et al., 2013). Thus,
This article is protected by copyright. All rights reserved.
Acc
epte
d A
rticl
e
the presence of visual representations aided the validity of the results to some extent. Several
respondents expressed surprise because they stated they had never actually seen 3D printed
chocolate before. This experience created an excitement in some respondents who were positive on
their willingness to have a 3D food printer at home as exhibited in Figure 8.
Table 6 recorded the measure of respondents’ perception on the displayed 3D printed chocolates.
As can be seen in the table, the respondents indicated that the printed chocolates’ appearance was
very attractive (M = 8.29 SD =1.6). Also respondents perceived the 3D printed chocolate was
intricate (M = 8.75 SD =1.4). Most of the respondents indicated that they are willing to try the 3D
printed chocolate (M = 9.13 SD =1.8).
<Table 6>
<Figure 8>
As can be seen in Figure 8, 54.5% of the respondents indicated their willingness to have a 3D food
printer at their home, 30.3% indicated they were unsure and 15.2% decided not to have a food
printer. However, a further study relating to the marketing strategy for 3D food printers should be
explored in order to understand the actual factor(s) that might influence consumers when they
contemplate purchasing this new technology.
3.4.5 Measure of attitude toward 3D printed food
The final stage of the survey measured the attitudes of the respondents toward 3DFP. These five
questions were adopted from Brunner et al. (2018) and modified to suit the current survey setting
with acceptable reliability (α = 0.801). Table 7 represents the measurement of respondents’
attitudes toward food produced by 3D food printing technology. Mostly, the respondents’ attitudes
toward 3D food printing were good (M =8.03, SD = 1.8), important (M = 7.36, SD = 2.0), positive
(M = 8.13, SD = 1.7), and the respondents also indicated that the new technology should be
supported (M = 7.96, SD = 1.9). The visual representation of 3D printed products has been reported
as creating a good experience among respondents (Jaeger, Knorr, Szabo, Hamori, & Banati, 2015).
Therefore, we postulate that the actual representation of 3D printed chocolate may well have
contributed to the familiarisation of the technology to consumer, thus, this could have positively
affected their attitudes (Lyndhurst, 2009).
<Table 7>
This article is protected by copyright. All rights reserved.
Acc
epte
d A
rticl
e

Overall, the outcomes of the survey provided a valuable insight into perceptions about the
technology and about 3D printed chocolate products. The acceptance of this technology is heavily
guided by such consumer perceptions as well as the technology’s perceived benefit (Bruhn, 2007;
Siegrist, 2008). The survey results obtained in this study suggested that respondents were mostly
aware of the existence of 3DFP and associated their knowledge with the benefits of this technology.
These results reinforce the view that an actual presentation of 3DFP (printer and 3D printed
product) had a significant impact on respondents’ perception. Although most were aware this
technology existed, some had never encountered a real 3D printed product nor a 3D food printer.
The exposure to this displayed technology helped to build up their awareness (Lyndhurst, 2009).
4. Conclusion
In this study, 3D printed chocolates were successfully fabricated by varying the infill structures
(infill patterns and percentages) for textural and sensorial evaluations. The constructions’
dimensional properties (length, width and thickness) significantly matched the target geometry,
confirming that 3DFP is a potent and precise tool for design customisation. The weight of 3D
printed chocolate varied with the increase in infill percentage and this also contributed to texture
modification and, potentially, the cost and energy density per unit piece. The infill percentage
influenced the textural properties of 3D printed chocolate, signified by an increase in force (N) to
break the samples as the infill increased. The results showed that 3D printed chocolates (with 100%
infill) were less hard than cast chocolates, because of a weak interaction of layers, affected by the
consecutive layering during extrusion deposition. The sensorial evaluation revealed that appearance
has a significant effect on the participants’ preferences. However, the participants also indicated
their preference (in terms of hardness) for 3D printed chocolate with 25% infills. A comparison of a
cast chocolate sample with a 100% infill printed chocolate sample showed equal preference for both
samples, influences in part by their perceived texture.
The consumer survey outcomes demonstrated a constructive response from the respondents, the
majority of whom indicated an awareness of 3DFP. This knowledge contributed to a good
perception of 3DFP’s benefits, thus, affecting their positive attitude toward 3DFP. We believe that
this positive attitude was encouraged by the actual presentation of a 3D food printer and 3D printed
chocolate samples. A further exploratory study regarding consumer acceptance and preferences of
3DFP should be pursued in terms of various aspects and types of 3D printed products to enhance
consumer acceptance of this novel technology in the domain of the general public.
This article is protected by copyright. All rights reserved.
Acc
epte
d A
rticl
e

ETHICAL STATEMENTS
Conflict of Interest:
The authors declare that they do not have any conflict of interest in this research.
Ethical Review:
Contributors Statement of contribution
Sylvester Mantihal (1st author)
Designed experiments (80%)
Carried out experiments (100%)
Analysed experimental data (80%)
Wrote the paper (70%)
Sangeeta Prakash (2nd
author)
Analysed experimental data (5%)
Edited the paper (10%)
Bhesh Bhandari (Corresponding author)
Designed experiments (20%)
Analysed experimental data (15 %)
Edited the paper (20%)
Informed Consent:
No animal subjects were involved in this research. Human subjects, as trained panellist, were
involved in this study and has been approved by Human Research Ethics Committees (Approval
number: 2019001010) at the University of Queensland.
Written informed consent was obtained from all study participants.
This article is protected by copyright. All rights reserved.
Acc
epte
d A
rticl
e
5. References
Aguilera, J. M., & Park, D. J. (2016). Texture-modified foods for the elderly: Status, technology
and opportunities. Trends in Food Science & Technology, 57, 156-164.
Andersen, B. V., Brockhoff, P. B., & Hyldig, G. (2019). The importance of liking of appearance, -
odour, -taste and -texture in the evaluation of overall liking. A comparison with the
evaluation of sensory satisfaction. Food Quality and Preference, 71, 228-232.
Beckett, S. T. (Ed.). (2011). Industrial chocolate manufacture and use. New Jersey: John Wiley &
Sons.
Bernstein, I. H., & Nunnally, J. (1994). Psychometric theory. New York: McGraw-Hill. Oliva, TA,
Oliver, RL, & MacMillan, IC (1992). A Catastrophe Model for Developing Service
Satisfaction Strategies. Journal of Marketing, 56, 83-95.
Bravi, L., Murmura, F., & Santos, G. (2017). Attitudes and behaviours of Italian 3D prosumer in the
Era of Additive Manufacturing. Procedia Manufacturing, 13, 980-986.
Bruhn, C. M. (2007). Enhancing consumer acceptance of new processing technologies. Innovative
Food Science & Emerging Technologies, 8(4), 555-558.
Brunner, T. A., Delley, M., & Denkel, C. (2018). Consumers’ attitudes and change of attitude
toward 3D-printed food. Food Quality and Preference, 68, 389-396.
Cardello, A. V., Schutz, H. G., & Lesher, L. L. (2007). Consumer perceptions of foods processed by
innovative and emerging technologies: A conjoint analytic study. Innovative Food Science
& Emerging Technologies, 8(1), 73-83.
Dankar, I., Haddarah, A., El Omar, F., Sepulcre, F., & Pujolà, M. (2018). Assessing the
microstructural and rheological changes induced by food additives on potato puree. Food
Chemistry, 240, 304-313.
Devezeaux de Lavergne, M., Tournier, C., Bertrand, D., Salles, C., van de Velde, F., & Stieger, M.
(2016). Dynamic texture perception, oral processing behaviour and bolus properties of
emulsion-filled gels with and without contrasting mechanical properties. Food
Hydrocolloids, 52, 648-660.
Dizon, J. R. C., Espera, A. H., Chen, Q., & Advincula, R. C. (2018). Mechanical characterization of
3D-printed polymers. Additive Manufacturing, 20, 44-67.
Fernandez-Vicente, M., Calle, W., Ferrandiz, S., & Conejero, A. (2016). Effect of infill parameters
on tensile mechanical behavior in desktop 3D printing. 3D printing and additive
manufacturing, 3(3), 183-192.
Greehy, G. M., McCarthy, M. B., Henchion, M. M., Dillon, E. J., & McCarthy, S. N. (2013).
Complexity and conundrums. Citizens’ evaluations of potentially contentious novel food
technologies using a deliberative discourse approach. Appetite, 70, 37-46.
This article is protected by copyright. All rights reserved.
Acc
epte
d A
rticl
e

Jaeger, H., Knorr, D., Szabo, E., Hamori, J., & Banati, D. (2015). Impact of terminology on
consumer acceptance of emerging technologies through the example of PEF technology.
Innovative Food Science & Emerging Technologies, 29, 87-93.
James, B. (2018). Oral processing and texture perception influences satiation. Physiology &
Behavior, 193, 238-241.
Jeltema, M., Beckley, J., & Vahalik, J. (2016). Food texture assessment and preference based on
Mouth Behavior. Food Quality and Preference, 52, 160-171.
Le Tohic, C., O'Sullivan, J. J., Drapala, K. P., Chartrin, V., Chan, T., Morrison, A. P., Kelly, A. L.
(2018). Effect of 3D printing on the structure and textural properties of processed cheese.
Journal of Food Engineering, 220, 56-64.
Lipton, Cutler, M., Nigl, F., Cohen, D., & Lipson, H. (2015). Additive manufacturing for the food
industry. Trends in Food Science & Technology, 43(1), 114-123.
Liu, Z., Bhandari, B., Prakash, S., & Zhang, M. (2018). Creation of internal structure of mashed
potato construct by 3D printing and its textural properties. Food Research International,
111, 534-543.
Liu, Z., Zhang, M., Bhandari, B., & Wang, Y. (2017). 3D printing: Printing precision and
application in food sector. Trends in Food Science & Technology, 69, 83-94.
Lupton, D., & Turner, B. (2018). “I can’t get past the fact that it is printed”: consumer attitudes to
3D printed food. Food, Culture & Society, 21(3), 402-418.
Lyndhurst, B. (2009). An evidence review of public attitudes to emerging food technologies. Social
Science Research Unit, Food Standards Agency, Crown.
Mantihal, S., Prakash, S., & Bhandari, B. (2019). Textural modification of 3D printed dark
chocolate by varying internal infill structure. Food Research International, 121, 648 -657.
Mantihal, S., Prakash, S., Godoi, F. C., & Bhandari, B. (2017). Optimization of chocolate 3D
printing by correlating thermal and flow properties with 3D structure modeling. Innovative
Food Science & Emerging Technologies, 44(Supplement C), 21-29.
McCluskey, J. J., Kalaitzandonakes, N., & Swinnen, J. (2016). Media Coverage, Public
Perceptions, and Consumer Behavior: Insights from New Food Technologies. Annual
Review of Resource Economics, Vol 8, 8, 467-486.
McLouth, T. D., Severino, J. V., Adams, P. M., Patel, D. N., & Zaldivar, R. J. (2017). The impact
of print orientation and raster pattern on fracture toughness in additively manufactured ABS.
Additive Manufacturing, 18, 103-109.
Murphy, S. V., & Atala, A. (2014). 3D bioprinting of tissues and organs. Nature biotechnology,
32(8), 773.
Noort, M., Van Bommel, K., & Renzetti, S. (2017). 3D-printed cereal foods. Cereal Foods World,
62(6), 272-277.
This article is protected by copyright. All rights reserved.
Acc
epte
d A
rticl
e

Pandey, A., Sahu, R., & Dash, M. K. (2018). Social media marketing impact on the purchase
intention of millennials. International Journal of Business Information Systems, 28(2), 147-
162.
Prakash, S., Bhandari, B. R., Godoi, F. C., & Zhang, M. (2019). Chapter 13 - Future Outlook of 3D
Food Printing. In F. C. Godoi, B. R. Bhandari, S. Prakash, & M. Zhang (Eds.),
Fundamentals of 3D Food Printing and Applications (pp. 373-381): Academic Press.
Rankouhi, B., Javadpour, S., Delfanian, F., & Letcher, T. (2016). Failure analysis and mechanical
characterization of 3D printed ABS with respect to layer thickness and orientation. Journal
of Failure Analysis and Prevention, 16(3), 467-481.
Rapisarda, M., Valenti, G., Carbone, D. C., Rizzarelli, P., Recca, G., La Carta, S., Fincchiaro, S.
(2018). Strength, fracture and compression properties of gelatins by a new 3D printed tool.
Journal of Food Engineering, 220, 38-48.
RepRap. (2016). RepRapWiki: G-code. Retrieved from http://reprap.org/wiki/G-code
Ronteltap, A., van Trijp, J. C. M., Renes, R. J., & Frewer, L. J. (2007). Consumer acceptance of
technology-based food innovations: Lessons for the future of nutrigenomics. Appetite, 49(1),
1-17.
Sajdakowska, M., Jankowski, P., Gutkowska, K., Guzek, D., Żakowska‐Biemans, S., & Ozimek, I.
(2018). Consumer acceptance of innovations in food: A survey among Polish consumers.
Journal of Consumer Behaviour, 17(3), 253-267.
Sekaran, U., & Bougie, R. (2016). Research methods for business: A skill building approach. New
Jersey: John Wiley & Sons.
Severini, C., Derossi, A., & Azzollini, D. (2016). Variables affecting the printability of foods:
Preliminary tests on cereal-based products. Innovative Food Science & Emerging
Technologies, 38, 281-291.
Severini, C., Derossi, A., Ricci, I., Caporizzi, R., & Fiore, A. (2018). Printing a blend of fruit and
vegetables. New advances on critical variables and shelf life of 3D edible objects. Journal of
Food Engineering, 220, 89-100.
Shier, M. (2016). Food of the future. Retrieved from http://3dprintingindustry.com/news/food-of-
the-future-78638/
Siegrist, M. (2008). Factors influencing public acceptance of innovative food technologies and
products. Trends in Food Science & Technology, 19(11), 603-608.
Sun, J., Zhou, W., Yan, L., Huang, D., & Lin, L.-y. (2018). Extrusion-based food printing for
digitalized food design and nutrition control. Journal of Food Engineering, 220, 1-11.
Sune, F., Lacroix, P., & Huon de Kermadec, F. (2002). A comparison of sensory attribute use by
children and experts to evaluate chocolate. Food Quality and Preference, 13(7–8), 545-553.
Szczesniak, A. S. (2002). Texture is a sensory property. Food Quality and Preference, 13(4), 215-
225. doi:Pii S0950-3293(01)00039-8
This article is protected by copyright. All rights reserved.
Acc
epte
d A
rticl
e

Vancauwenberghe, V., Delele, M. A., Vanbiervliet, J., Aregawi, W., Verboven, P., Lammertyn, J.,
& Nicolaï, B. (2018). Model-based design and validation of food texture of 3D printed
pectin-based food simulants. Journal of Food Engineering, 231, 72-82.
Zhang, H., Fang, M., Yu, Y., Liu, Q., Hu, X., Zhang, L., Tian, F. (2018). Application Prospect of
3D Printing Technology in the Food Intelligent Manufacturing. Paper presented at the
International Conference on Mechatronics and Intelligent Robotics (pp. 974-984). Springer.
Zoran, A., & Coelho, M. (2011). Cornucopia: the concept of digital gastronomy. LEONARDO,
44(5), 425-431.
This article is protected by copyright. All rights reserved.
Acc
epte
d A
rticl
e

Figure 1: The 3D cast printed using Da Vinci 2.0 dual nozzle model XYZ printer with ABS filament.
This article is protected by copyright. All rights reserved.
Acc
epte
d A
rticl
e

Figure 2: 3D model designs of rectangular shape (a) Model -1(20 mm x 50 mm and 5 mm
thickness) with Honeycomb pattern in variation of infill density of 25%_IP, 50%_IP and 100%_IP
(b) Model-2 ( 43.5 mm x 35.5 mm and 5 mm thickness) in rectilinear pattern with 100%_IP. IP
refers to infill percentage.
This article is protected by copyright. All rights reserved.
Acc
epte
d A
rticl
e

Figure 3: Schematic illustration of Shinnove dual nozzle 3D printer and its components.
This article is protected by copyright. All rights reserved.
Acc
epte
d A
rticl
e

Figure 4: Various shapes, designs and internal structures (infill patterns and percentages) of 3D
printed chocolates used in display session.
This article is protected by copyright. All rights reserved.
Acc
epte
d A
rticl
e
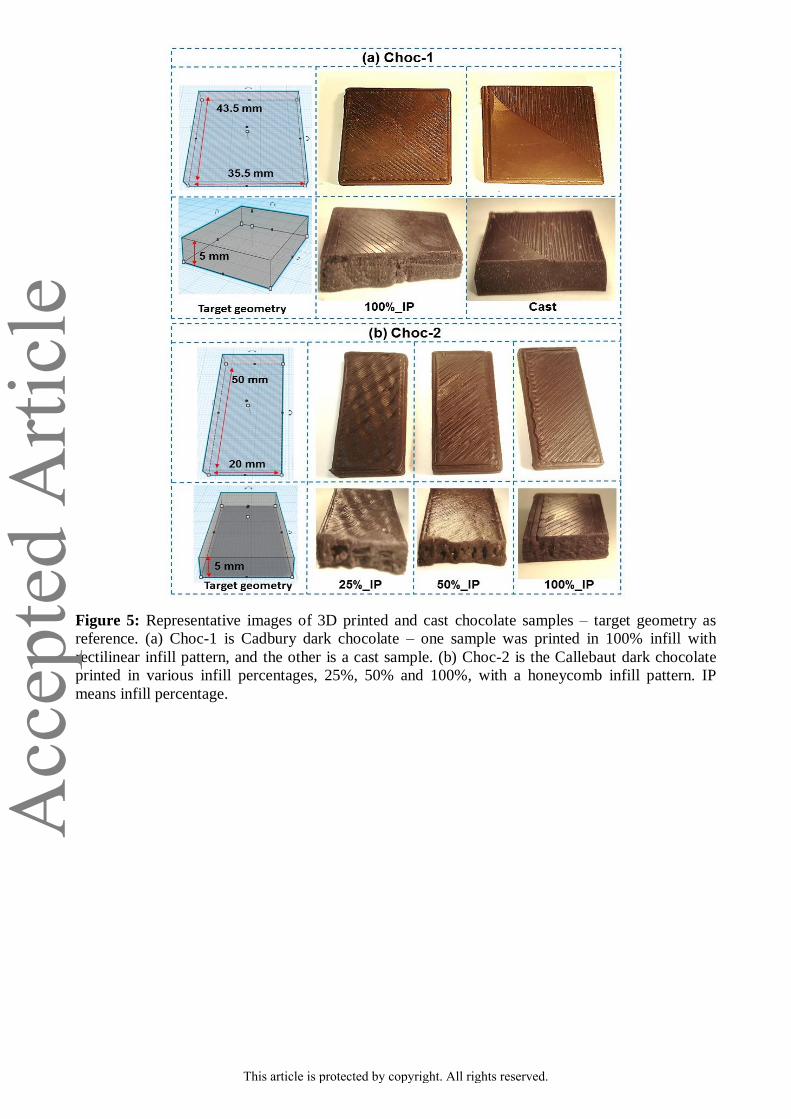
Figure 5: Representative images of 3D printed and cast chocolate samples – target geometry as
reference. (a) Choc-1 is Cadbury dark chocolate – one sample was printed in 100% infill with
rectilinear infill pattern, and the other is a cast sample. (b) Choc-2 is the Callebaut dark chocolate
printed in various infill percentages, 25%, 50% and 100%, with a honeycomb infill pattern. IP
means infill percentage.
This article is protected by copyright. All rights reserved.
Acc
epte
d A
rticl
e

Figure 6: Representative graphs of force (N) as a function of distance (mm) of 3DP chocolate
printed and cast for samples (a) Choc-1 with 100% infill for 3DP (rectilinear pattern) and (b) Choc-
2 samples various infill percentages of 25%, 60%, and 100% (honeycomb pattern) with a pre-test
speed of 1.0 mm/s and test speed 2.0 mm/s with 5.0g of trigger load of all chocolate. IP means infill
percentage.
This article is protected by copyright. All rights reserved.
Acc
epte
d A
rticl
e

Figure 7: Distribution of the consumer preferences for texture for 3D printed Choc-1 in 100% infill
and cast chocolate block.
This article is protected by copyright. All rights reserved.
Acc
epte
d A
rticl
e

Figure 8: Willingness of respondents (n=244) to have a 3D food printer at home.
This article is protected by copyright. All rights reserved.
Acc
epte
d A
rticl
e
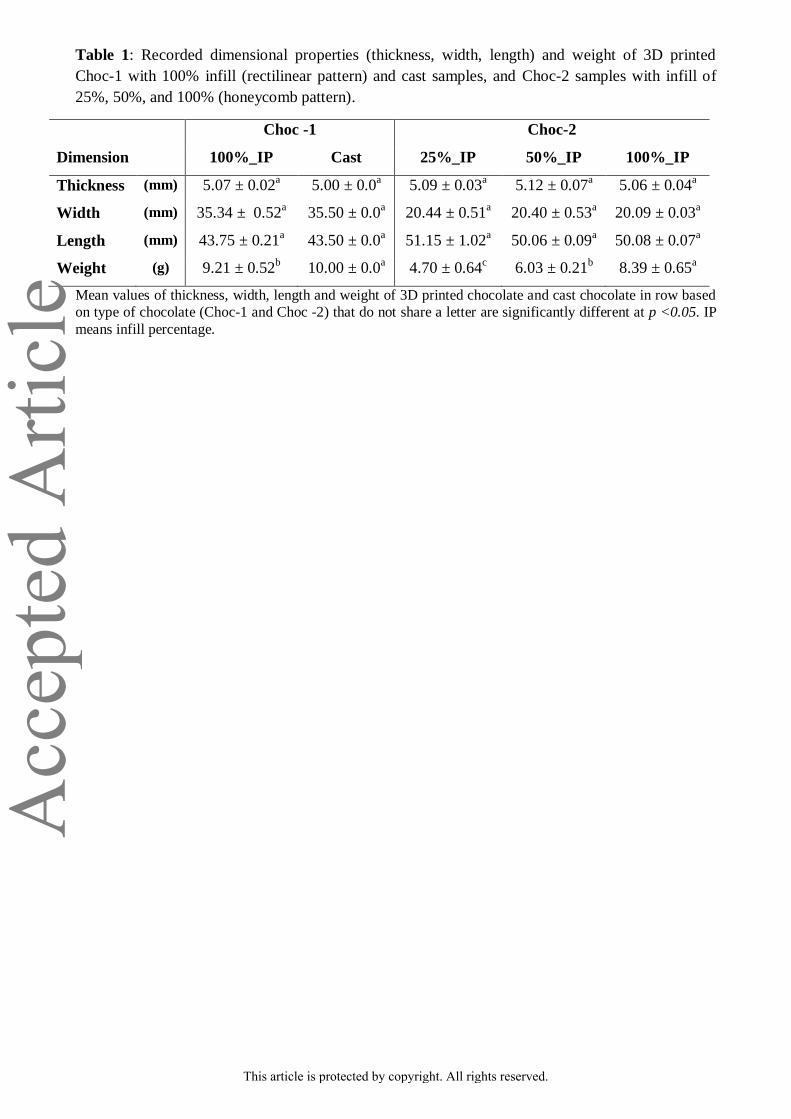
Table 1: Recorded dimensional properties (thickness, width, length) and weight of 3D printed
Choc-1 with 100% infill (rectilinear pattern) and cast samples, and Choc-2 samples with infill of
25%, 50%, and 100% (honeycomb pattern).
Choc -1 Choc-2
Dimension 100%_IP Cast 25%_IP 50%_IP 100%_IP
Thickness (mm) 5.07 ± 0.02a 5.00 ± 0.0
a 5.09 ± 0.03
a 5.12 ± 0.07
a 5.06 ± 0.04
a
Width (mm) 35.34 ± 0.52a 35.50 ± 0.0
a 20.44 ± 0.51
a 20.40 ± 0.53
a 20.09 ± 0.03
a
Length (mm) 43.75 ± 0.21a 43.50 ± 0.0
a 51.15 ± 1.02
a 50.06 ± 0.09
a 50.08 ± 0.07
a
Weight (g) 9.21 ± 0.52b 10.00 ± 0.0
a 4.70 ± 0.64
c 6.03 ± 0.21
b 8.39 ± 0.65
a
Mean values of thickness, width, length and weight of 3D printed chocolate and cast chocolate in row based
on type of chocolate (Choc-1 and Choc -2) that do not share a letter are significantly different at p <0.05. IP
means infill percentage.
This article is protected by copyright. All rights reserved.
Acc
epte
d A
rticl
e

Table 2: Recorded force (N) to break the chocolate samples with various infill percentages (25%,
50%, and 100%), and cast samples.
Choc-1 Choc-2
100%_IP Cast 25%_IP 50%_IP 100%_IP
Force (N)
71.06 ± 1.35b
83.58 ± 1.40a
20.44 ± 1.12c
33.52 ± 1.55b
54.43 ± 1.47a
Mean values of Force (N) required to break the 3D printed chocolate and cast chocolate samples(in a row
based on the type of chocolate (Choc-1 and Choc -2) that do not share a letter are significantly different at p
<0.05. IP means infill percentage
This article is protected by copyright. All rights reserved.
Acc
epte
d A
rticl
e

Table 3: Recorded median and p-value of ranking of preferences (appearance, hardness and overall
preferences) based on Friedman test for 3DP chocolate printed in various infill percentages (25%,
50%, and 100%).
Ranking for
preferences
Samples p-value
3DP25%_IP 3DP50%_IP 3DP100%_IP
Appearance
2.00
2.67
1.33
0.001*
Hardness
1.66
2.00
2.33
0.792
Overall
preferences
1.33
2.66
2.00
0.875
*P < 0.05
Ranking varied from 1-3 (1 is the most preferred sample)
This article is protected by copyright. All rights reserved.
Acc
epte
d A
rticl
e

Table 4a: Descriptive analysis of knowledge about 3D printing (α = 0.61)
Section 1a: Knowledge about 3D
Printing
Frequency
(N)
Valid percent
(%)
I have heard/read and understand
about 3D printing
Yes 155 63.5
No
89 36.5
I know what 3D food printing is
Yes 162 66.4
No
80 32.8
This article is protected by copyright. All rights reserved.
Acc
epte
d A
rticl
e

Table 4b: Recorded frequency of understanding of 3DFP. Pearson Chi-Square (X2) derived from
cross-tabulation of “I have heard/read and understand about 3D printing” and each question in
Section 1b.
Section 1b: Understanding
about 3D Printing
Frequency
(N)
Valid
percent (%)
Pearson chi-square (X2)
Value df Sig. (2-sided)
In my understanding
3DFP is plastic food
Yes 11 4.5 13.55 2 0.001*
No 186 76.2
Don't know 47 19.3
In my understanding
3DFP is artificial food
Yes 53 21.7 20.30 2 0.000*
No 132 54.1
Don't know 59 24.2
In my understanding
3DFP is natural food
Yes 103 42.2 17.10 2 0.000*
No 79 32.4
Don't know 62 25.4
In my understanding
3DFP is food with
modified ingredients
Yes 116 47.5 4.11 2 0.128
No 63 25.8
Don't know 65 26.6
*p < 0.05
This article is protected by copyright. All rights reserved.
Acc
epte
d A
rticl
e

Table 5: Descriptive analysis of perception of 3DFP benefits. Pearson Chi-Square (X2) derived
from cross-tabulation of “I have heard/read and understand about 3D printing” and seven questions
in Section 3. (α = 0.784)
Section 3:
The Benefits of 3D printing
Frequency
(N)
Valid
percent
(%)
Pearson chi-square (X2)
Value df Sig. (2-sided)
3D food printing can create
any appealing shapes/ designs
yes 224 91.8 2.05 2 0.357
no 20 8.2
Food can be prepared straight
away and may be ready to be served
yes 167 68.4 9.75 1 0.002*
no 77 31.6
By printing food, we can create
appealing shapes/sizes of vegetable to
motivate children to consume more
vegetables
yes 155 63.5 4.33 1 0.037*
no 89 36.5
Easy to prepare healthy snacks at home
yes 137 56.1 4.56 1 0.033*
no 107 43.9
By printing food, we can address the
the issue of swallowing problems
(dysphagia) among the elderly without
sacrificing the taste and appearance of
food
yes 131 53.7 5.48 1 0.019*
no 113 46.3
Food can be designed for individuals’
nutritional needs (controlling portions
and special dietary needs)
yes 140 57.4 10.52 1 0.001*
no 104 42.6
By 3D printing food, wastage of food
can be minimised and food by-products
can be utilised
yes 138 56.6 3.87 1 .049*
no 106 43.4
*p < 0.05
This article is protected by copyright. All rights reserved.
Acc
epte
d A
rticl
e
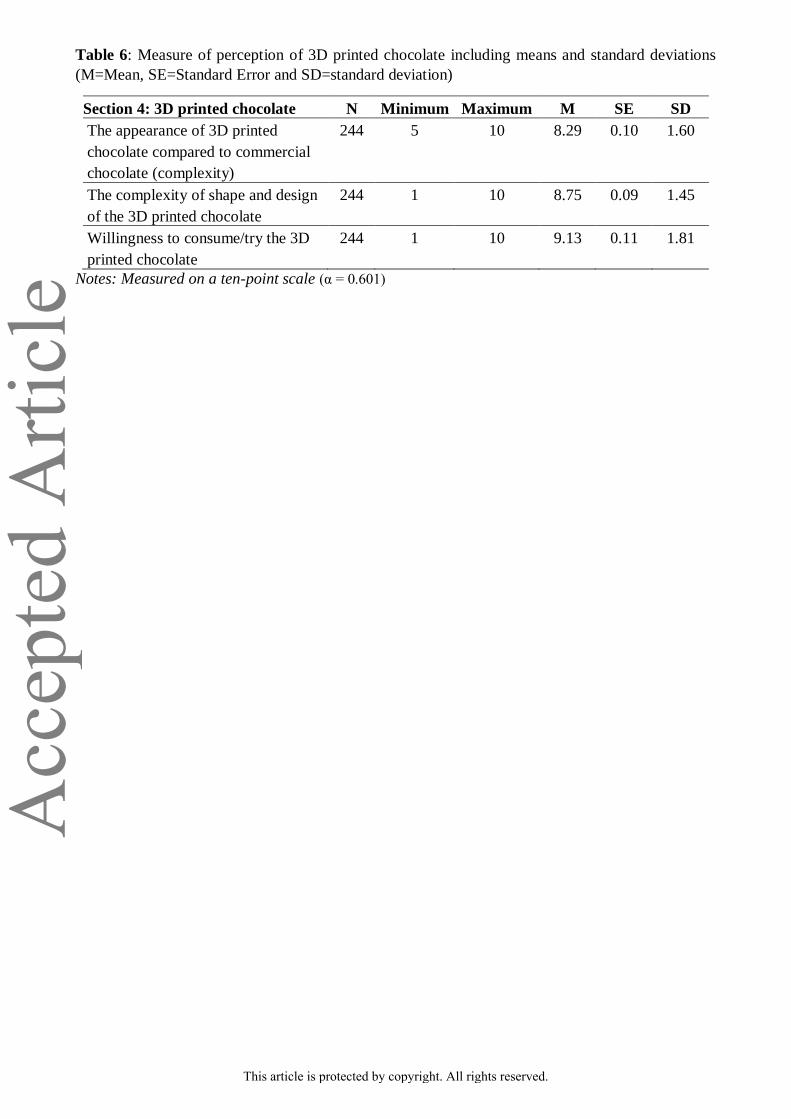
Table 6: Measure of perception of 3D printed chocolate including means and standard deviations
(M=Mean, SE=Standard Error and SD=standard deviation)
Section 4: 3D printed chocolate N Minimum Maximum M SE SD
The appearance of 3D printed
chocolate compared to commercial
chocolate (complexity)
244 5 10 8.29 0.10 1.60
The complexity of shape and design
of the 3D printed chocolate
244 1 10 8.75 0.09 1.45
Willingness to consume/try the 3D
printed chocolate
244 1 10 9.13 0.11 1.81
Notes: Measured on a ten-point scale (α = 0.601)
This article is protected by copyright. All rights reserved.
Acc
epte
d A
rticl
e

Table 7: Measure of attitude toward 3D printed food, including means and standard deviations
Section 5: Attitude toward 3DFP N Minimum Maximum M SE SD
I think food produced by 3D printer will
generally be: Bad/Good
244 3 10 8.03 0.11 1.81
I think food produced by 3D printer will
generally be: Not important/Important
244 1 10 7.36 0.13 2.06
I think food produced by 3D printer will
generally be: Negative/Positive
244 2 10 8.13 0.11 1.75
I think food produced by 3D printer will
generally be: Not supported/ Supported
244 1 10 7.96 0.12 1.98
Notes: Measured on a ten-point scale
This article is protected by copyright. All rights reserved.
Acc
epte
d A
rticl
e