Texture Analysis of High Resolution Aeromagnetic Data to ...
4
Recovery – 2011 CSPG CSEG CWLS Convention 1 Texture Analysis of High Resolution Aeromagnetic Data to Identify Geological Features in the Horn River Basin, NE British Columbia Hassan H. Hassan* [email protected] and Serguei Goussev Fugro Gravity and Magnetic Services Summary This study describes a pattern recognition technique to extract the anomalous texture from High-Resolution AeroMagnetic (HRAM) images. Images of HRAM data often exhibit regions of variable magnetic intensities that form certain patterns or anomalous textures. These textures are attributed to changes in the physical properties of subsurface rocks. Crystalline basements, as an example, contain rocks of different lithological composition and different geological structures that may be shown as different textures on magnetic images. In order to extract textures from the aeromagnetic images, we applied Grey-Level Co-occurrence Matrices (GLCM) to the HRAM total magnetic intensity image over the shale gas play of the Horn River basin in NE British Columbia. The GLCM are composed of sets of spatial statistical parameters that convert magnetic images into texture images. The resultant texture images show the pixel-based spatial distribution of magnetic anomalies, associated with elements of subsurface structure, with much higher lateral resolution than the original magnetic images. Five GLCM texture features (angular second moment, contrast, correlation, entropy and homogeneity) were computed in this study. We combined these five GLCM texture images into a single image using a principle component analysis. The texture images produced in this study allowed us to identify different elements of geological structures in the Horn River basin including geological terranes, lithological contacts, fractures and faults. The aim of the study is therefore to show the properties of statistical analysis of the HRAM images that can be used for oil-and-gas exploration applications. Introduction Texture is one of the most important characteristics of an image as it contains valuable information about the subsurface structure of the area. Therefore, the texture analysis can be used to distinguish different spatial characteristics or patterns that are present in the image. Geological features such as lithological contacts, depositional edges, fractures and faults can be identified on enhanced filtered grids (for example, horizontal gradient magnitude) of the total magnetic intensity grid. However, these geological features are often difficult to recognize on original magnetic images. But they can be much more reliably identified on the magnetic texture images. Textures displayed on magnetic texture images reflect changes in physical properties of rock units including changes in geological structures and rock types. Haralick et al. (1973)
Transcript of Texture Analysis of High Resolution Aeromagnetic Data to ...
Recovery – 2011 CSPG CSEG CWLS Convention 1
Texture Analysis of High Resolution Aeromagnetic Data to Identify Geological
Features in the Horn River Basin, NE British Columbia
Hassan H. Hassan*
and
Serguei Goussev
Fugro Gravity and Magnetic Services
Summary
This study describes a pattern recognition technique to extract the anomalous texture from High-Resolution
AeroMagnetic (HRAM) images. Images of HRAM data often exhibit regions of variable magnetic
intensities that form certain patterns or anomalous textures. These textures are attributed to changes in the
physical properties of subsurface rocks. Crystalline basements, as an example, contain rocks of different
lithological composition and different geological structures that may be shown as different textures on
magnetic images.
In order to extract textures from the aeromagnetic images, we applied Grey-Level Co-occurrence Matrices
(GLCM) to the HRAM total magnetic intensity image over the shale gas play of the Horn River basin in NE
British Columbia. The GLCM are composed of sets of spatial statistical parameters that convert magnetic
images into texture images. The resultant texture images show the pixel-based spatial distribution of
magnetic anomalies, associated with elements of subsurface structure, with much higher lateral resolution
than the original magnetic images. Five GLCM texture features (angular second moment, contrast,
correlation, entropy and homogeneity) were computed in this study. We combined these five GLCM texture
images into a single image using a principle component analysis. The texture images produced in this study
allowed us to identify different elements of geological structures in the Horn River basin including
geological terranes, lithological contacts, fractures and faults. The aim of the study is therefore to show the
properties of statistical analysis of the HRAM images that can be used for oil-and-gas exploration
applications.
Introduction
Texture is one of the most important characteristics of an image as it contains valuable information about
the subsurface structure of the area. Therefore, the texture analysis can be used to distinguish different
spatial characteristics or patterns that are present in the image. Geological features such as lithological
contacts, depositional edges, fractures and faults can be identified on enhanced filtered grids (for example,
horizontal gradient magnitude) of the total magnetic intensity grid. However, these geological features are
often difficult to recognize on original magnetic images. But they can be much more reliably identified on
the magnetic texture images. Textures displayed on magnetic texture images reflect changes in physical
properties of rock units including changes in geological structures and rock types. Haralick et al. (1973)
Recovery – 2011 CSPG CSEG CWLS Convention 2
proposed a series of simple yet powerful statistical features to compute various parameters of an image
texture. These statistical features are commonly referred to them as Grey-Level Co-occurrence Matrices
(GLCM) and used extensively by scientists since 1973 for textural analysis, image segmentation and image
classification. These features and their functions are described in Table 1. We applied them to the total
magnetic intensity image of the HRAM data to produce HRAM texture images.
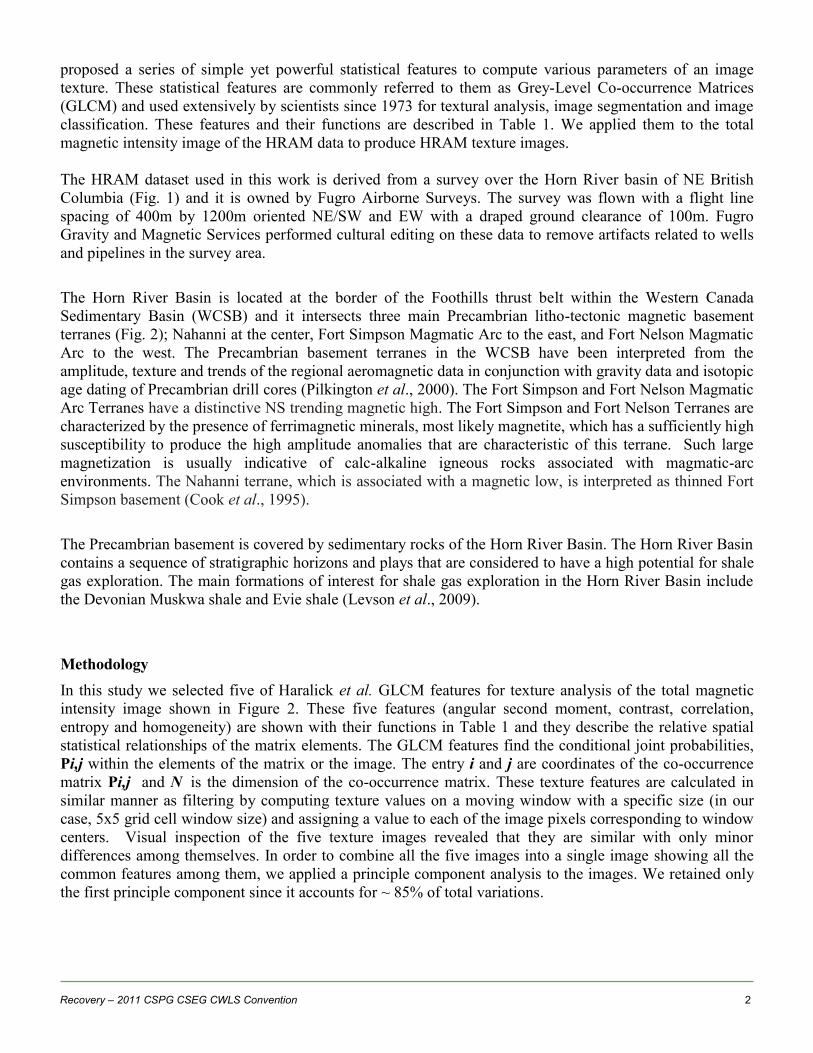
The HRAM dataset used in this work is derived from a survey over the Horn River basin of NE British
Columbia (Fig. 1) and it is owned by Fugro Airborne Surveys. The survey was flown with a flight line
spacing of 400m by 1200m oriented NE/SW and EW with a draped ground clearance of 100m. Fugro
Gravity and Magnetic Services performed cultural editing on these data to remove artifacts related to wells
and pipelines in the survey area.
The Horn River Basin is located at the border of the Foothills thrust belt within the Western Canada
Sedimentary Basin (WCSB) and it intersects three main Precambrian litho-tectonic magnetic basement
terranes (Fig. 2); Nahanni at the center, Fort Simpson Magmatic Arc to the east, and Fort Nelson Magmatic
Arc to the west. The Precambrian basement terranes in the WCSB have been interpreted from the
amplitude, texture and trends of the regional aeromagnetic data in conjunction with gravity data and isotopic
age dating of Precambrian drill cores (Pilkington et al., 2000). The Fort Simpson and Fort Nelson Magmatic
Arc Terranes have a distinctive NS trending magnetic high. The Fort Simpson and Fort Nelson Terranes are
characterized by the presence of ferrimagnetic minerals, most likely magnetite, which has a sufficiently high
susceptibility to produce the high amplitude anomalies that are characteristic of this terrane. Such large
magnetization is usually indicative of calc-alkaline igneous rocks associated with magmatic-arc
environments. The Nahanni terrane, which is associated with a magnetic low, is interpreted as thinned Fort
Simpson basement (Cook et al., 1995).
The Precambrian basement is covered by sedimentary rocks of the Horn River Basin. The Horn River Basin
contains a sequence of stratigraphic horizons and plays that are considered to have a high potential for shale
gas exploration. The main formations of interest for shale gas exploration in the Horn River Basin include
the Devonian Muskwa shale and Evie shale (Levson et al., 2009).
Methodology
In this study we selected five of Haralick et al. GLCM features for texture analysis of the total magnetic
intensity image shown in Figure 2. These five features (angular second moment, contrast, correlation,
entropy and homogeneity) are shown with their functions in Table 1 and they describe the relative spatial
statistical relationships of the matrix elements. The GLCM features find the conditional joint probabilities,
Pi,j within the elements of the matrix or the image. The entry i and j are coordinates of the co-occurrence
matrix Pi,j and N
is the dimension of the co-occurrence matrix. These texture features are calculated in
similar manner as filtering by computing texture values on a moving window with a specific size (in our
case, 5x5 grid cell window size) and assigning a value to each of the image pixels corresponding to window
centers. Visual inspection of the five texture images revealed that they are similar with only minor
differences among themselves. In order to combine all the five images into a single image showing all the
common features among them, we applied a principle component analysis to the images. We retained only
the first principle component since it accounts for ~ 85% of total variations.

Recovery – 2011 CSPG CSEG CWLS Convention 3
Table 1. GLCM statistical texture features and their main functions
GLCM texture features Function
Measures the image homogeneity. Angular second moment is high when pixels
are very similar. A small angular second moment indicates a spread of values in
the co-ocurrence matrix, thus a heterogeneous, or coarse image texture.
Contrast measures the amount of local variations present in the image. Contrast
is zero when the neighbouring pixels have constant values.
σ² = variance
Correlation measures the joint probability occurrence of the specified pixel
pairs.
Entropy measures disorder or complexity of an image. It is maximal when all
elements are equal. The high entropy image has a great contrast from one pixel
to its neighbour. Complex textures tend to have high entropy.
Homogeneity relates to contrast of the texture. It has maximum value when all
elements in the image are same.
Results
Five GLCM texture features including angular second moment, contrast, correlation, entropy and
homogeneity were applied to the total magnetic intensity image displayed in Figure 2. Out of these five
texture features, we show the results of the entropy feature and first principle component which is expected to
be similar to the entropy image to confirm the consistency and repeatability of statistical parameters. Figures 3
and 4 reveal several interesting geological features that we were unable to see on the magnetic image or its
derivatives. The results reveal several geological features such as lithological contacts, fractures and faults.
Unlike what we see on magnetic images, the faults and fractures on the texture images are more obvious and
better expressed. It is also of interest to note variations in the texture within the study area. For example, the
texture in the NE corner of the area is different from the one in other parts of the image. The geological
ensemble in the NE corner of the area is apparently different from the rest of the area. It is also evident that
this area is separated from the rest of the area by either geological contact or a fault since it borders the
prominent Bovie Fault to the west and the Precambrian terrane to the south and east.
Conclusions
Five of Haralick’s GLCM texture features were applied to the total magnetic intensity image of the Horn River
sedimentary basin. The resulted texture images were combined into a single texture image using a principle
component analysis. The texture images produced in this study appear to be effective in visualization of various
geological features in the HRAM survey area. The visual inspection of results reveals well defined geological
structures and patterns than we do not see conclusively on original magnetic images.
References
Cook, F.A., Varsek, J.L., and Thurston, J.B., 1995, Tectonic significance of gravity and magnetic variations along the Lithoprobe southern
Canadian Cordillera transect: Canadian Journal of Earth Sciences, 32, 1584–1610.
Haralick, R.M., Shanmugam, K., and Dinstein, I., 1973, Textural features for image classification: IEEE Transaction on Systems, Man, and
Cybernetics, 6, 269–285.
Levson, V.L., Walsh, W., Adam, C., Ferri, F., and Hayes, M., 2009, An overview of shale gas potential in Northeastern British Columbia:
CSPG CSEG CWLS annual convention, Calgary, Alberta, 562-563.
Pilkington, M. Miles, W. F., Ross, G. M., and Roest, W. R., 2000, Potential field signatures of buried Precambrian Basin: Canadian Journal of
Earth Sciences. 37, 1453-1471.

Recovery – 2011 CSPG CSEG CWLS Convention 4
Fig. 1. Location of the study area Fig. 2. Total magnetic intensity draped on NE-shaded
topography. Precambrian Terrane boundaries are
plotted and labeled in purple.
Fig. 3. GLCM entropy texture feature. Fig. 4. 1st principle component of five texture features.