TEXTO PARA DISCUSSÃO N 215 AN ASSESSMENT OF THE … · Centro de Desenvolvimento e Planejamento...
18
TEXTO PARA DISCUSSÃO N° 215 AN ASSESSMENT OF THE DATA QUALITY FOR LIVE BIRTHS AND INFANT DEATHS FOR THE 1998-BIRTH COHORT, CITY OF SÃO PAULO, USING INFORMATION FROM SINASC AND SIM Carla Jorge Machado Agosto de 2003
Transcript of TEXTO PARA DISCUSSÃO N 215 AN ASSESSMENT OF THE … · Centro de Desenvolvimento e Planejamento...

TEXTO PARA DISCUSSÃO N° 215
AN ASSESSMENT OF THE DATA QUALITY FOR LIVE BIRTHS AND INFANT DEATHS FOR THE 1998-BIRTH COHORT,
CITY OF SÃO PAULO, USING INFORMATION FROM SINASC AND SIM
Carla Jorge Machado
Agosto de 2003
Ficha catalográfica
314.01 M149p 2003
Machado, Carla Jorge.
An assessment of the data quality for live births and infant deaths for the 1998-birth cohort, city of São Paulo, using information from SINASC and SIM / por Carla Jorge Machado. - Belo Horizonte: UFMG/Cedeplar, 2003.
18p. (Texto para discussão ; 215)
1. Demografia – Técnica. 2. Levantamentos demográficos – Avaliação. 3. Mortalidade infantil – São Paulo (SP) 4. Registro civil – São Paulo (SP). I.Universidade Federal de Minas Gerais. Centro de Desenvolvimento e Planejamento Regional. II. Título. III. Série.
CDU
2
UNIVERSIDADE FEDERAL DE MINAS GERAIS FACULDADE DE CIÊNCIAS ECONÔMICAS
CENTRO DE DESENVOLVIMENTO E PLANEJAMENTO REGIONAL
AN ASSESSMENT OF THE DATA QUALITY FOR LIVE BIRTHS AND INFANT DEATHS FOR THE 1998-BIRTH COHORT, CITY OF SÃO PAULO,
USING INFORMATION FROM SINASC AND SIM
Carla Jorge Machado
Departamento de Demografia do Centro de Desenvolvimento e Planejamento Regional (CEDEPLAR) da Universidade Federal de Minas Gerais (UFMG)
Fontes de Auxílio na Forma de Bolsa: Bolsa de Doutorado Pleno – CAPES (durante o período de elaboração do primeiro manuscrito)
número do processo na Coordenação (CAPES): 2166/97-6
CEDEPLAR/FACE/UFMG BELO HORIZONTE
2003
3
SUMÁRIO INTRODUCTION .................................................................................................................................................. 6 MATERIAL AND METHODS .............................................................................................................................. 7 RESULTS ............................................................................................................................................................... 7
Missing Information........................................................................................................................................... 7 Basic information about the infant ................................................................................................................ 7 Socio-demographic information .................................................................................................................... 8 Mother’s pregnancy history........................................................................................................................... 8 Information related to the pregnancy ............................................................................................................ 8 Information related to definition of cause of death or infants’ care.............................................................. 9 Place of occurrence and place of residence ................................................................................................ 10
Consistency of the Data.................................................................................................................................... 10 Preference for digits (heaping).................................................................................................................... 10 Sex Ratios at Birth and at Death ................................................................................................................. 11 Children born dead, children born alive and maternal age ........................................................................ 11 Birth Weight and Sex ................................................................................................................................... 11 Birth Weight and Gestational Age............................................................................................................... 12 Apgar Scores ............................................................................................................................................... 12 Underlying cause of death........................................................................................................................... 13
CONCLUSION AND DISCUSSION................................................................................................................... 13 ACKNOWLEDGEMENTS .................................................................................................................................. 14 REFERENCES ..................................................................................................................................................... 15
4
ABSTRACT
In this article we use data from the 1998 birth-cohort from the City of São Paulo for live births and data on deaths from the same birth cohort that took place before the first year of life. Information on live birth came from the Information System of Live Births (SINASC) and on deaths came from the Information System on Mortality (SIM). Our aim was to evaluate two aspects of data quality, which are the percentage of missing information and consistency of the data based on empirical regularities observed in other populations or with the criterion of plausibility. Preference for digits, sex ratios at birth and at death and the Apgar score distribution were examples of quality indicators evaluated in this population. We concluded that information is much more frequently recorded for live births than for infant deaths (except for race/color of the infant) and that the internal consistency of the information can be considered satisfactory for the study population. Key words: SINASC, SIM, missing data, consistency checks, data quality, birth-cohort JEL classification: C80, I10, C89 RESUMO
Utiliza-se dados da coorte de nascimentos de 1998 da Cidade de São Paulo, bem como as informações sobre nascidos vivos desta coorte que morreram antes de completar um ano de vida. As fontes de dados consistiram no Sistema de Informações de Nascidos Vivos (SINASC) e no Sistema de Informações sobre Mortalidade (SIM).Objetivou-se avaliar dois aspectos da qualidade das informações, quais sejam, a porcentagem de não declarados e a consistência das informações declaradas, tomando por base regularidades empíricas observadas em populações ou por critério de plausibilidade. A preferência por dígitos, razões de sexo ao nascer e ao morrer antes de completar o primeiro ano de vida e a distrribuições dos escores Apgar ao primeiro e quinto minuto foram alguns dos indicadores avaliados neste artigo. Conclui-se que as informações são muito mais freqüentemente registradas (ou declaradas) para os nascidos vivos do que para as crianças falecidas desta coorte de nascimentos (com exceção de raça/cor) e que a consistência e plausibilidade das informações registradas é satisfatória. Palavras-Chave: SINASC, SIM, informação não declarada, verficação de consistência, qualidade dos dados, coorte de nascimentos Classificação no JEL: C80, I10, C89
5

INTRODUCTION
The Information System on Live Births (SINASC – Sistema de Informações sobre Nascidos Vivos) and the Information Systems on Mortality (SIM – Sistema de Informações sobre Mortalidade) were designed and implemented by the Brazilian Ministry of Health. These systems are not restricted to the hospitals and in case a birth or a death occurrs in some other health facility or at home, the attendant physician can fill the birth or death record. Therefore, it is expected a high degree of coverage of events from both systems, especially in highly urbanized areas. Indeed, in the City of São Paulo, the coverage of SINASC is considered to be extremelly satisfactory, above 96 percent 1; 2; 3. Besides, all infants born in the City of São Paulo who die before the first year of life are also captured by SIM 2.
In the State of São Paulo, the birth record or the death record, after being issued at the hospital, is taken to the registry office and the officer then issues a birth certificicate or a death certificate. Neither the birth or the death record is to be used for legal purposes, since it is the certificate itself that is the legal document. In case of birth records, this is unique to the State of São Paulo. The SEADE Foundation (State System for Data Analysis Foundation) has a long time agreement with all the registrar’s offices in the State. The registrar’s offices send the birth records to SEADE, where they are processed and sent to the Ministry of Health and IBGE (Brazilian Institute of Geography and Statistics). Therefore, in the State of São Paulo, the SINASC system and the civil registration system for vital events are the same thing. In other States, where the civil registration system is considered to be under-enumerated, the maternity hospitals are ultimately responsible for sending the birth records to the Ministry of Health. In these States, by comparing births in the SINASC System and births registered in registrar’s office, it has been possible to obtain estimates of under-enumeration of live births in the civil registration system. This need was never felt in the State of São Paulo, since the under-enumeration is considered to be very small in the State (Ferreira, personal communication, 03/06/2002). Besides, there would not exist a complete rupture with the pre-existing information flow that has been yielding satisfactory results for so many years 2.
Even though the coverage of events may be considered complete, a registration system may be deficient in recording characteristics of events 4, which compromises data quality. The idea is that if physicians or nurses are the primary responsible for filling a birth record or a death record, it would be reasonable to assume that data quality is satisfactory since data that come into the system should come from the best informed source, which is the health care provider. This article is an initial step in verifying whether or not this can be considered true for the 1998-birth cohort cohort of the City of São Paulo.
6

MATERIAL AND METHODS
Our aim was to analyze all 209,628 live births from the 1998-birth cohort from the City of São Paulo and all the infant deaths from the same cohort. We defined that infants whose mothers’ place of residence was the City of São Paulo at the time of birth belonged to the birth cohort. In order to study infant deaths from this birth cohort, we also analyzed 3,842 infants born in 1998 who died before the first year of life whose mothers’ place of residence at the time of death was the City of São Paulo. Among those, 3364 infants were born and died in the year 1998 and 478 infants were born in 1998 and died in 1999.
We downloaded the data from the DATASUS website (http://www.datasus.gov.br). Individual data come in a DBC format and each DBC file can be converted into a DBF file, which is a Dbase format. There is a file for each State of Brazil and each birth (or death) contains a code for the city of maternal residence and a code for the city of birth (or death occurrence). Since the information on deaths that occurred in 1999 was not available from DATASUS we requested such information directly from the SEADE Foundation.
In order to verify the possibility of defective recording or coding of the information, our approaches were as follows: first, since one aspect of this deficiency is the failure to record certain characteristics, we assessed the percentage of missing information for each characteristic of interest. Second, considering that the other aspect relates to how accurately the information is recorded, we examined the consistency of the data based on empirical regularities observed in other populations or with the criterion of plausibility. For example, following this criterion, data are said to be inconsistent if mothers of 15 years old are found to have parity four or higher. This is an unexpected finding, biologically inconsistent. RESULTS Missing Information
In Table 1 we present the percentage of missing information in each variable in birth and death records, for the 1998-birth cohort of infants. Basic information about the infant
In birth and death records, the basic information about the infant is well recorded, with the exception of race. Race is less frequently recorded in the birth records than in the death records. This may be due to the fact that the information on race started being collected in the birth records only in 1997 5. The consistent and continuous recording and coding of this new piece of information may yet require some time 5.
7
Socio-demographic information
For all four socio-demographic variables on both the birth and death certificate, information is very infrequently recorded in the death records, especially maternal education. In absolute numbers, only 749 infants who died, out of the 3,842, had information recorded on maternal education, despite the fact that the information is not open-ended, but it is collected based on a check box design, which is known to improve the degree of reporting 6. It is likely, then, that physicians or the persons responsible for filling out this information are consistently skipping this section of the record. This information may be considered to be useless. As a result it is virtually impossible to make any generalizing statement about mother’s educational level for infants who died using information on death records only.
About a half of the infants who died did not have information on either parent’s occupation. Considering infants who died in 1998 only, 1,183 did not possess information on either parents’ occupation (35 percent of all infants who were born and died in 1998).
Maternal age is much more frequently recorded in the birth records than in death records. Indeed, it is one of the variables with information most often recorded in the birth records, with a degree of missingness of only 0.5 percent. But, as in the case of maternal education, it seems inappropriate to make any assertion about the level of education of the mothers of infants who died based on the information provided by the death records only. Mother’s pregnancy history
For variables related to the mother’s pregnancy history, the level of missingness is the worst in the death records among all other variables considered, with the exception of maternal education. The attempt of trying to make any inference based on death records is worsened by the fact that there is no clear specification to exclude (or to include) the reference infant among the number of children born alive. This is a serious mistake that still persists on the new death record form, used since 2001. In the birth records, there is a specification not to include the reference infant. Information related to the pregnancy
For all four variables related to the pregnancy present in birth and death records, the greater frequency of recording of this information in birth records is striking. The degree of missingness in birth records varies from 1.1 to 5.8 percent but it varies from 53.8 to 55.4 percent in death records.
For both sets of records, there is an association between having a missing value in one of the four the variables and having a missing value in another variable (among those four). As an example, we can see how likely it is to have another characteristic recorded as missing (or not recorded) if birth weight is recorded as missing (or not recorded) in a birth record. Among the 2312 infants with missing information on birth weight, 1213 also had missing information on plurality (52 percent of 2312); 1710 had missing information on delivery mode (74 percent); 1781 had missing information on weeks’ gestation (77 percent). In the case of death records, among the 2091 deaths with no
8
information on birth weight, 1904 infants also had no information on plurality (91 percent of 2091); 1987 infants had no information on delivery mode (95 percent); 1942 infants had no information on gestational age (93 percent). Therefore it seems likely that the reasons behind the failure to report a value are much the same for each of these variables.
Information on birth weight included in the death records is required only for those infants who died in the neonatal period (before 28 days of life). However, 1077 infants who died in the neonatal period had a missing value on birth weight (42 percent of 2581 neonatal deaths); and 247 infants who died in the post-neonatal period had a non-missing value for birth weight recorded (20 percent of 1261 post-neonatal deaths). This finding seems to reflect lack of adherence to the rule: the information is coded accordingly to how easily available it is at the time of death, or how important the physician judges it to be that this information be included in the death record.
Information on weeks’ gestation was more likely to be missing in birth records and in death records than other variables. This may be related to the nature of the measure: birth weight is directly measured; delivery mode has a clear-cut definition; and whether or not an infant was a singleton, twin or triplet is also straightforward. However, gestational age is an estimated measure. The uncertainty about the true number of weeks’ gestation for a given pregnancy has been recognized for many years 7;
8. Even though the variable is recorded in a check-box format and within a range of numbers of weeks, it is still an estimated measure, leaving room for biases and imprecision, and some physicians may judge it appropriate not to report any value for this variable.
In regard to number of prenatal visits, it has a non-negligible percentage of missing values, about 33 percent, despite the fact that is recorded in a check box format, with a limited number of options. The mother only had to answer whether or not she had no prenatal visit, one to six prenatal visits or seven or more visits.
Apgar scores at one and five minutes were recorded reasonably completely. The small percentages of missing information should not deter from making assertions based on Apgar scores and generalizing those assertions for this study population. However, we notice that infants with both Apgar scores missing (8788 infants) were more likely to be low birth weight or preterm in comparison to the entire cohort of infants. The percentage of low birth weight infants (below 2500 grams) among those with missing both Apgar scores was 16.3 percent, and for the whole cohort, this percentage was 9 percent. The percentage of preterm birth (born before 37 weeks’ gestation) was 7.2 overall and for the cohort, 5.5. Therefore, we infer that those infants with missing information on Apgar score tend to be frailer infants, compared to all the others. Information related to definition of cause of death or infants’ care
By law, an autopsy is required for causes related to injuries, poisoning, when the infant was found dead or accidents. It is likely that most infants were not clinically examined, or underwent a surgery or autopsy. Therefore, the high percentage of missing values in these variables may be due to the absence of an exam, surgery or autopsy, for a given infant. Rather than reporting that there was no exam, surgery or autopsy, physicians may be simply skipping the question or leaving it blank. This mistake is similar to that of classifying childless women as women of missing parity 9.
9
Place of occurrence and place of residence
Place of occurrence had an excellent level of recording and coding in both records. Place of residence was also recorded with a reasonable level of completeness, in both records. Consistency of the Data
Preference for digits (heaping)
Preference for certain digits or ‘heaping’ is a term commonly used in the context of reporting of age. Age heaping is a tendency of enumerators or respondents to report certain ages at the expense of others 4 and it is a very important aspect of data quality. In the case of age, there may exist a tendency for the mother, or for other respondent to report her age at ages ending in zero or five. In fact, the causes and patterns of age and digit preference vary from one culture to another, but in general there is a widespread preference for ages ending in “0” or “5” 10. There are many indexes that reflect age preference. We chose the Whipple’s index that is based on the principle of rectangularity or linearity, i.e., that there are equal numbers in each age over some age range 10. The assumption of linearity in a five-year range, heaping on multiples of five in the ranges 13 to 47, may be measured by comparing the sum of the mothers at the ages ending at “0” or “5” (15, 20, 25, 30, 35, 40 and 45) and one fifth of the total number of mothers in the range 13 to 47. We take the ratio between the first component and the second one and multiply the result by 100. Based on the birth records, the obtained index was 124 and in case of the death records it was 125. The index varies from 100, representing no preference for “0” or “5” to 500, representing complete avoidance of digits other than “0” or “5”. We can say that there some, but not very high, systematic, reporting of these ages. The index shows that there is an overstatement of the corresponding unbiased number of mothers by about 25 percent. Another feature is that the bias, if it really exists, is not differential, which means that mothers whose infants died and mothers of any infant in the birth cohort do not report ages differentially. This was expected, since the mothers come from the same population.
Preference for certain digits can exist and be measured not only for ages but also for any other interval variable. We applied the same idea of digit preference to the case of birth weight. Birth weights are almost invariably recorded rounded in a 100-gram format, such as 500, 600, 700, and so on – indeed, only 68 infants who died had a recorded birth weight not rounded in the death record, among the 1751 with recorded information (3.9 percent) and only 60 infants of the 1998-birth cohort had a recorded birth weight not rounded in the birth record (less than 0,1 percent). In order to measure whether coding of birth weights were clustered on the 1000, 1500 grams to 4500, we calculated the Whipple’s index. The numerator was the sum of all birth weights ending in “500” and “000” (from 1000 grams to 4500 grams) and the denominator was one fifth of the sum of all birth weights from 800 to 4700 grams. The index is then multiplied by 100. For all the infants from the birth cohort whose birth weights were reported, the index was 126; for infants who died, the index was found to be 128. Again, we notice that there seems to exist some preference for some digits (in this case, “0” and “5” again), and that the preference is non-differential among infants who have died and infants from the entire birth cohort.
10
The Whipple’s index is a very useful tool when cautiously interpreted. It is an indication that preference for digits may exist. However, types of error may exist other than specific preference for some terminal digits; also, the assumption of equal increments (or decrements) from age to age (or from birth weight to birth weight) may be not applicable for certain ages or certain birth weights 10. Sex Ratios at Birth and at Death
The sex ratio, the ratio between male births and female births (multiplied by 100), is above 100 for nearly all populations for which relatively complete data are available, and generally falls between 104 and 107 10. In this birth-cohort a ratio between 106,835 male births and 102,771 female births yields 1.04, which is in agreement with expectations. Indeed, the sex ratio at birth for this population may seem in the “border line” of what is expected: 1.0395. A number of studies to date links a significant reduction of male births in some countries to influences of environment on reproductive function 11. Studies have linked exposure of fathers to pollutant and other chemicals to a lower probability of having a male infant 11, 12.
Sex ratios at death are much more variable across populations, but for fetuses and infants biological reasons are behind a higher mortality for males than for females 10. The sex ratio at death for this cohort was 116 (ratio between 2064 male deaths and 1778 female deaths, times 100) and it may be considered reasonable. Children born dead, children born alive and maternal age
Older women in 1998 had a longer exposure time to childbearing than younger women. They were also more exposed to pregnancy loss than their younger counterparts. As a result, we expect older women to have higher parity and greater pregnancy loss than younger women. Besides, since fertility has been declining, older women were more likely to experience similar or higher age-specific fertility rates than younger women, and in this sense a simple measure of number of children born alive and children born dead by age are imprecise and unstandardized measures 13. Results are in Table 2.
As expected, older mothers had more children and a higher number of prior losses. The trend is of a monotonic increase from younger to older maternal ages. Another feature is that it seems probable that mothers of infants who died are including the infant who had just died in the total number of children they reported (second column of Table 2). It seems unlikely, that on average, mothers 24 or younger had one live birth before the reference infant. Birth Weight and Sex
Differences in birth weight are well recognized and males tend to be slightly heavier than females 14. As expected, we found that, for infants who died, the median birth weights for males and females, respectively, were 1300 grams and 1200 grams; the mean birth weights were, respectively, 1700 grams and 1500 grams; for the entire cohort of infants, the median and mean birth weights, for males and females respectively, were 3200 and 3100 grams (927 males and 824 females with recorded information).
11

Birth Weight and Gestational Age
Infants born at more advanced gestational ages are expected to have, on average, higher birth weights. After 28 weeks’ gestation until birth the relationship between weight and gestational age appears linear, indicating a uniform incremental weight gain 15. Indeed, according to the author, the relationship seems to hold until 18 weeks’ posnatal age15. The author constructed fetal and postnatal curves of fetal growth and also observed that there is a flattening in the growth curve usually after 40 weeks’ gestation considered to be due to the constraint of fetal growth15. Table 3 shows the distribution of median and mean birth weights according to gestational age groups.
In general, the expected relationship holds in this birth-cohort. The higher the number of weeks’ gestation, the higher the median and the mean birth weight. We also see that the median and mean values in the group 42 weeks’ gestation or higher, are not much bigger than those in the group 37 to 41 weeks, indicating also the expected stabilization in the weights of infants at birth after 40 weeks’ gestation. The only unexpected finding relates to infants who died in the group of infants born before 22 weeks’ gestation, who have a higher mean birth weight than the subsequent group of infants. The small number of infants (49) in the first group may explain this divergence. Four infants weighed 3000 grams or more at birth, and the mean value was clearly affected by these extreme values. In the subsequent group (22 to 27 weeks’ gestation), the number of infants is much higher, 391, and only one infant weighed 3000 grams or more at birth. Therefore, we believe that the data presented are, in general, in accordance with what is expected in any population of infants.
Data tabulated this way also provide evidence on what the literature on birth weight and gestational age and infant mortality shows continuasly: that lower birth weight infants are at a much higher risk of dying 16, 17, 18. According to these data, the median and mean birth weights for infants who died are on average only about half those of the entire cohort of infants, which corroborates for the assertion that data are plausible and valid. Apgar Scores
We compared the information on Apgar scores for this birth cohort at one and five minutes for low birth weight infants (less than 2500 grams) with the information obtained by De Hart 19 on low birth weight infants born between January 1985 and March 1990 at Christiana Hospital of the Medical Center, Delaware, United States. The latter information is virtually 100 percent complete and considered accurate 19. Since this is the only detailed information on Apgar scores at this point available for comparison, from a population other than of Brazilian infants, and considered to be of better quality, we had no choice other than to restrict our comparison to low birth weight infants. The cumulative distribution of Apgar scores at one and five minutes for both populations is presented in Table 4.
In Table 4 it is clear that in São Paulo’s population of infants, a higher percentage is classified at higher Apgar scores. Particularly striking is the fact that a considerably higher percentage of infants are classified as having Apgar scores 10 at five minutes. An infant in the City of São Paulo was about 18 times more likely to be assigned an Apgar score 10 at five minutes than an infant in the Christiana
12
Hospital. It is unlikely that this is due to the fact that infants in the City of São Paulo were healthier than the infants born at the Christiana Hospital. It seems that a misclassification from Apgar scores 8, and more markedly 9, may exist towards Apgar 10 in the City of São Paulo. Indeed, the percentages of infants with scores 8 and 9 in the study population are lower than in their U.S. counterparts, which may suggest a misclassification. We may infer that in the City of São Paulo there exists an overall tendency to classify infants considered to be ‘healthy’ with an Apgar score of 10, without a more careful consideration of the individual components of the score.
Other than this apparent misclassification, there does not seem to be any other major indication or serious threat to the validity of the Apgar scores. In comparison to De Hart’s series of Apgar scores 19, there are no discontinuities in the distribution. The trends of increasing percentage of infants in each level of Apgar scores is the same in both populations. Underlying cause of death
If death records were poorly filled out, we may expect a high percentage of ill-defined causes of death 2. In 1930, for the State of São Paulo, 40 percent of all causes of death for infants were coded as ill-defined causes. In 1979 this percentage was about 5 percent 2. This improvement in diagnosis and coding are associated with higher coverage of infant deaths during this period. In the case of our population of infants who died, only for 33 infants was the underlying cause of death ill defined, (Chapter XVI of the Tenth International Classification of Diseases, “symptoms, signs and ill-defined conditions”), which is less than one percent of the infants. CONCLUSION AND DISCUSSION
Missing information was found to be less of a problem in the case of birth records than it is in the case of death records. The degree of missingness in death records reaches an extremely high level of more than 80 percent for maternal education; and it is as high as 55 percent for important variables such as birth weight and gestational age. This suggests that any assertion about socio-demographic characteristics of infants who have died can be severely flawed, especially if infants at higher risk of adverse outcomes are more likely not to have information recorded.
Consistency with standard patterns seen in birth and death records data was assessed and it seems to be fairly good for birth and death records. A degree of misclassification was assessed in Apgar scores, especially towards the values of 10, but in general the data are of reasonably good quality. Therefore, the recorded information seems to be correctly reported and coded and may be assumed to be valid.
As a conclusion, we understand that a vital records system is primarily a set of records concerning individual persons used for legal matters, such as proof of citizenship 20. The degree of precision that can be expected from this information, in any country, is limited. It is likely to be worse in a developing country. Information on deaths, as we have seen, is less likely to be reported, maybe due to the fact that it is being collected in a more stressful situation and in an atmosphere of personal
13
loss and sorrow. Also, given the need to process a number of records daily, especially in a city such as São Paulo, into computer readable form in a standard manner, automated coding procedures will sometimes distort the information in the records . Therefore, it is a mistake to look at the records system as an “ongoing national statistical supersurvey” and we should not pose unrealistic expectations for birth and death registration systems 20. Even though we are optimistic that the data seems to be valid and consistent and that lack of precision can be improved, we recognize that it is likely to remain to some extent. ACKNOWLEDGEMENTS
The author’s Doctoral studies in The Bloomberg School of Public Health, Johns Hopkins University, were fully funded by the Brazilian Agency for Post-Graduate Education (CAPES) – process number 2166/97-6 – and a preliminary version of this article was developed as part of the author´s Ph.D. dissertation submited in November, 2002. The author also would like to thank Dr. Carlos E. C. Ferreira from the SEADE Foundation, São Paulo, and Dr. Kenneth Hill, from Johns Hopkins University for comments on an earlier version on this manuscript.
14

REFERENCES 1. Waldvogel B, Yasaki LM, Correia LCS. Nascimentos no Estado de São Paulo: Situação do sub-
registro nos anos 80 e diferenciais regionais In: A Fecundidade da Mulher Paulista. São Paulo: SEADE, 1994. p. 145-198.
2. Ferreira CEC, Flores LPO. The dimensions of infant mortality in São Paulo. Brazilian Journal of Population Studies 1998; 1: 145-64.
3. Machado CJ. Early Infant Morbidity and Infant Mortality in the City of São Paulo, Brazil: A Probabilistic Record Linkage approach [Ph.D. dissertation] Baltimore (MD): Johns Hopkins University, 2002.
4. United Nations (UN). Manual X Indirect Techniques for Demographic Estimation (Populations Studies No. 81). New York (NY), 1983.
5. Cunha EMP Condicionantes da mortalidade infantil segundo raça/cor no Estado de São Paulo, 1997-1998 [dissertation]. Campinas (SP): UNICAMP; 2001.
6. Frost F, Starzyk P, George S, MacLaughlin JF. Birth complication reporting: the effect of birth certification design American Journal of Public Health 1984; 74: 505-06.
7. Hall MH, Carr-Hill RA, Fraser C, Campbell D, Samphier ML. The extent and antecedents of uncertain gestation .British Journal of Obstetrics and Gynaecology 1985; 92: 445-51.
8. Nakling J, Backe B. Adverse obstetric outcome in fetuses that are smaller than expected at second trimester routine ultrasound examination. Acta Obstetricia et Gynecologica Scandinavica 2002; 81:846-51.
9. El Badry MR. Failure of enumerators to make entries of zero: Errors in recording childless cases in population censuses. Journal of American Statistical Association 1961; 909-24.
10. Shryock HS, Siegel JS (and associates). The Methods and Materials of Demography London: Academic Press; 1976.
11. Jarrell J. Rationale for the study of the human sex ratio in population studies of polluted environments Cadernos de Saúde Pública 2002; 18: 532-42.
12. Sakamoto M, Nakano A, Akagi H. Declining male birth ration associated with increased male fetal death due to heavy methylmercury pollution. Environmental Research 2001; 87: 92-98.
13. Brass W. Problems in the measurement of child mortality where statistical systems are.limited. : Annales de la Societe Belge de Medecine Tropicale 1987; 67 Suppl 2: 57-79.
14. Hindmarsh PC, Geary MP, Rodeck CH, Kingdom JC, Cole TJ. Intrauterine growth and its relationship to size and shape at birth. Pediatric Research 2002; 52: 263-68.
15. Dunn PM. A perinatal growth chart for international reference. Acta Paediatrica Scandinavica 1985; 319 Suppl : 180-87.
16. Wilcox AJ. On the importance – and the unimportance – of birthweight. International Journal of Epidemiology 2001; 30: 1233-41.
15

17. Buekens P, Wilcox A. Why do small twins have a lower mortality rate than small singletons? American Journal of Obstetrics and Gynecology. 1993; 168 (3 Pt 1): 937-41.
18. Wilcox AJ, Russell IT. Birthweight and perinatal mortality: II. On weight-specific mortality.International Journal of Epidemiology 1983; 12: 319-25.
19. De Hart MP. Racial differences in Apgar scores and mortality and morbidity in low birthweight infants. [Sc.D. dissertation] Baltimore (MD): Johns Hopkins University, 1994.
20. Zemach R. What the vital statistics system can and cannot do. American Journal of Public Health 1984; 74: 756-58.
16
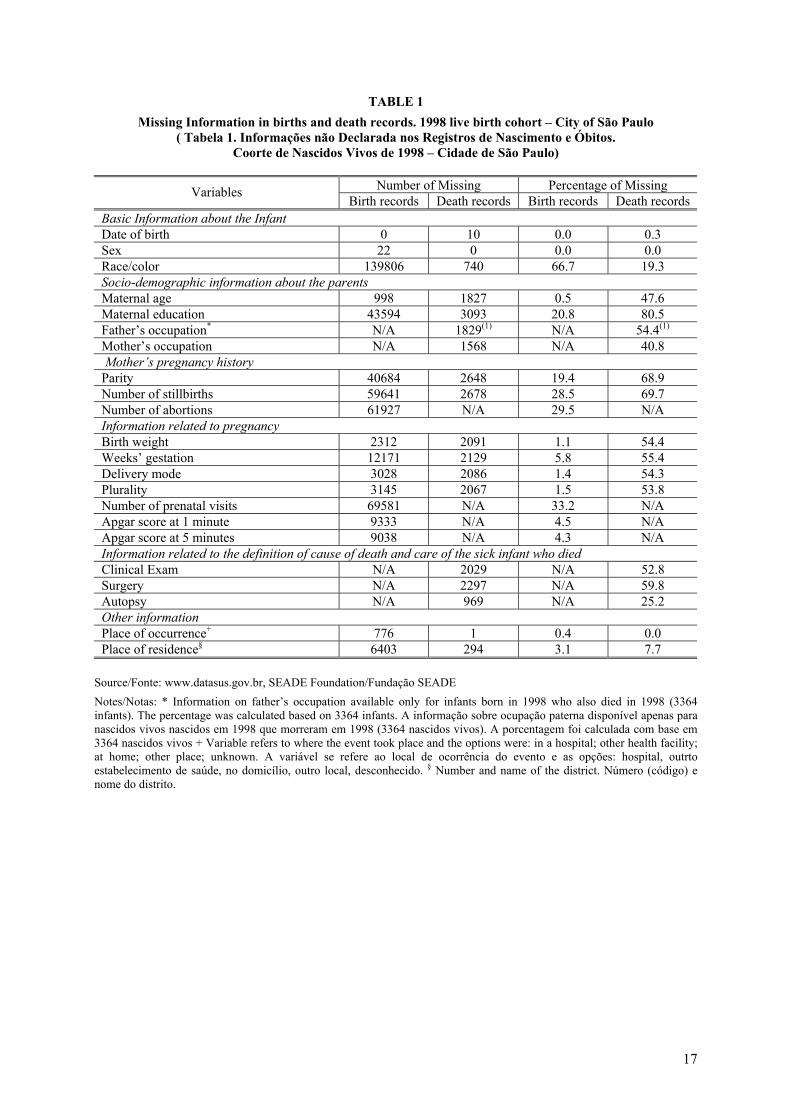
TABLE 1 Missing Information in births and death records. 1998 live birth cohort – City of São Paulo
( Tabela 1. Informações não Declarada nos Registros de Nascimento e Óbitos. Coorte de Nascidos Vivos de 1998 – Cidade de São Paulo)
Number of Missing Percentage of Missing Variables
Birth records Death records Birth records Death records Basic Information about the Infant Date of birth 0 10 0.0 0.3 Sex 22 0 0.0 0.0 Race/color 139806 740 66.7 19.3 Socio-demographic information about the parents Maternal age 998 1827 0.5 47.6 Maternal education 43594 3093 20.8 80.5 Father’s occupation* N/A 1829(1) N/A 54.4(1) Mother’s occupation N/A 1568 N/A 40.8 Mother’s pregnancy history Parity 40684 2648 19.4 68.9 Number of stillbirths 59641 2678 28.5 69.7 Number of abortions 61927 N/A 29.5 N/A Information related to pregnancy Birth weight 2312 2091 1.1 54.4 Weeks’ gestation 12171 2129 5.8 55.4 Delivery mode 3028 2086 1.4 54.3 Plurality 3145 2067 1.5 53.8 Number of prenatal visits 69581 N/A 33.2 N/A Apgar score at 1 minute 9333 N/A 4.5 N/A Apgar score at 5 minutes 9038 N/A 4.3 N/A Information related to the definition of cause of death and care of the sick infant who died Clinical Exam N/A 2029 N/A 52.8 Surgery N/A 2297 N/A 59.8 Autopsy N/A 969 N/A 25.2 Other information Place of occurrence+ 776 1 0.4 0.0 Place of residence§ 6403 294 3.1 7.7
Source/Fonte: www.datasus.gov.br, SEADE Foundation/Fundação SEADE Notes/Notas: * Information on father’s occupation available only for infants born in 1998 who also died in 1998 (3364 infants). The percentage was calculated based on 3364 infants. A informação sobre ocupação paterna disponível apenas para nascidos vivos nascidos em 1998 que morreram em 1998 (3364 nascidos vivos). A porcentagem foi calculada com base em 3364 nascidos vivos + Variable refers to where the event took place and the options were: in a hospital; other health facility; at home; other place; unknown. A variável se refere ao local de ocorrência do evento e as opções: hospital, outrto estabelecimento de saúde, no domicílio, outro local, desconhecido. § Number and name of the district. Número (código) e nome do distrito.
17

TABLE 2 Average number of children born alive and children born dead, by age of mother. Birth records and
death records – 1998 birth cohort – City of São Paulo (Tabela 2. Número médio de filhos nascidos vivos e filhos nascidos mortos, por idade da mãe. Coorte de Nascidos Vivos de 1998 – Cidade de São Paulo)
Parity (or children born alive) Children born dead Age group of mothers Death records Birth records Death records Birth records
(stillbirths) Birth records (abortions)
11 to 14 1.00 0.04 0.22 0.00 0.02 15 to 24 1.22 0.55 0.34 0.02 0.11 25 to 34 2.03 1.31 0.42 0.05 0.26 35 plus 2.73 2.07 0.50 0.11 0.45
Source/Fonte: www.datasus.gov.br, SEADE Foundation/Fundação SEADE Notes/Notas: Number of infants in each group: From birth records, children born alive: 168784; stillbirths: 149848, abortions: 147561. From death records: children born alive: 949; children born dead: 739. Número de nascidos vivos em cada grupo: Dos registros de nascimento, número de nascidos vivos: 168784; natimortos: 149848, abortos: 147561. Dos registros de óbito: número de nascidos vivos: 949; número de nascidos mortos: 739
TABLE 3
Median and mean birth weights, according to gestational age groups. Birth records and death records – 1998 birth cohort, City of São Paulo ( Tabela 3. Pesos medianos e médios, de acordo com grupos de idade gestacional. Registros de nascimento e óbitos. Coorte de Nascidos Vivos de 1998, Cidade de São Paulo )
Median Birth Weight Mean Birth Weight Weeks’ gestation Death records Birth records Death records Birth records
Less than 22 600 500 1000 700 22 to 27 700 1100 800 1600 27 to 36 1300 2300 1500 2300 37 to 41 2800 3200 2800 3200 42 and plus 3000 3300 2900 3300 TOTAL 1300 3100 1600 3100
Source/Fonte: www.datasus.gov.br, SEADE Foundation/Fundação SEADE Notes/Notas: Number of infants: death records: 1512; birth records: 196926/Número de nascidos vivos: registros de óbitos: 1512, registros de nascimentos: 196926
TABLE 4
Cumulative distribution of Apgar Scores at one and five minutes for two low-birth weight populations of infants – City of São Paulo (1998) and Delaware (1985-1990) (Tabela 4. Distribuição acumulada de Escores Apgar ao primeiro e quinto minuto para duas populações de nascidos vivos de baixo peso –
Cidade de São Paulo (1998) e Delaware (1985-1990))
Apgar scores at one minute (percentage) Apgar scores at 5 minutes (percentage)
Apgar Score Christiana Hospital, Delaware
(N=2616)
City of São Paulo (N=17354)
Christiana Hospital, Delaware
(N=2617)
City of São Paulo (N=17403)
0 0.8 0.6 0.3 0.3 1 6.1 3.6 1.8 0.9 2 8.8 6.3 2.4 1.5 3 11.5 9.3 3.1 2.1 4 16.0 12.9 4.3 2.9 5 20.9 17.9 6.1 4.5 6 28.9 25.4 10.6 6.8 7 44.0 41.8 18.0 12.1 8 82.6 85.2 37.5 26.9 9 99.9 99.5 98.8 78.5
10 100.0 100.0 100.0 100.0
Source/Fonte: De Hart (1994) and www.datasus.gov.br.
18