Text Data Mining and Predictive Modeling of Online Reviews
18
How Popular Will Your Restaurant Be? Text Mining Approach To Word Frequency Prediction on Online Reviews Mark Chesney & Albert Nguyen June 11, 2014
-
Upload
mark-chesney -
Category
Documents
-
view
60 -
download
0
Transcript of Text Data Mining and Predictive Modeling of Online Reviews
How Popular Will Your Restaurant Be?
Text Mining Approach To Word Frequency Prediction on Online Reviews
Mark Chesney & Albert Nguyen June 11, 2014
Page 2
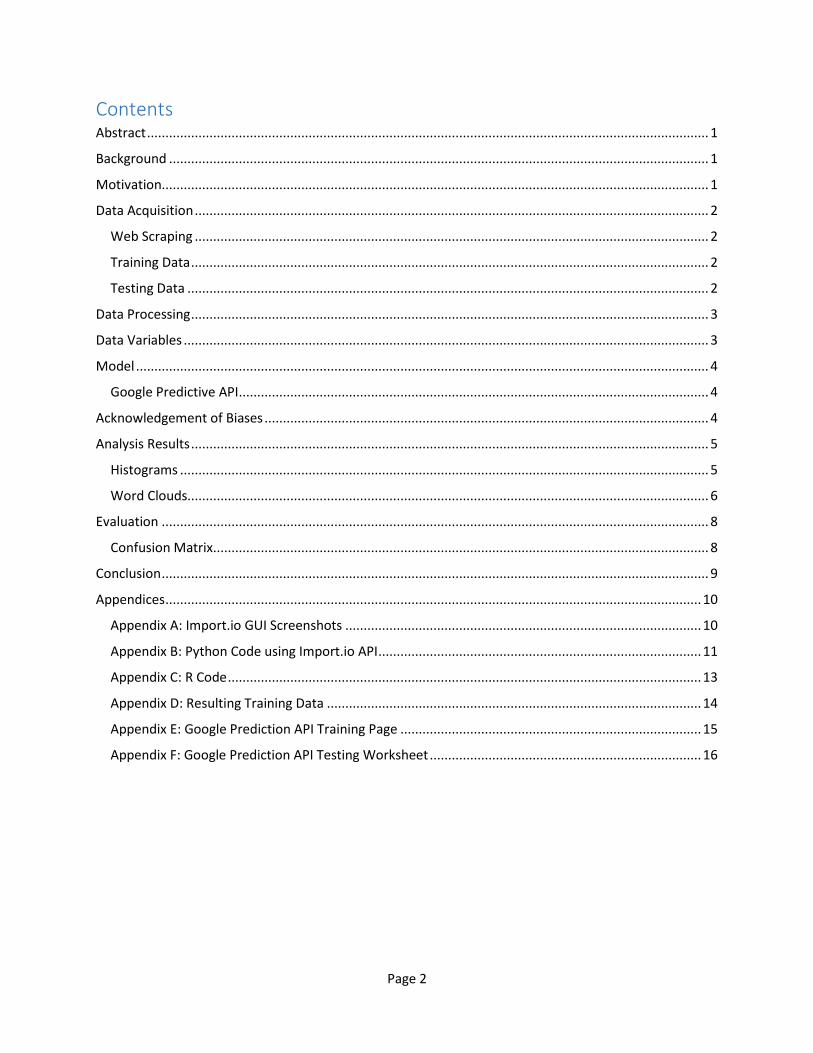
Contents Abstract ......................................................................................................................................................... 1
Background ................................................................................................................................................... 1
Motivation..................................................................................................................................................... 1
Data Acquisition ............................................................................................................................................ 2
Web Scraping ............................................................................................................................................ 2
Training Data ............................................................................................................................................. 2
Testing Data .............................................................................................................................................. 2
Data Processing ............................................................................................................................................. 3
Data Variables ............................................................................................................................................... 3
Model ............................................................................................................................................................ 4
Google Predictive API ................................................................................................................................ 4
Acknowledgement of Biases ......................................................................................................................... 4
Analysis Results ............................................................................................................................................. 5
Histograms ................................................................................................................................................ 5
Word Clouds.............................................................................................................................................. 6
Evaluation ..................................................................................................................................................... 8
Confusion Matrix ....................................................................................................................................... 8
Conclusion ..................................................................................................................................................... 9
Appendices .................................................................................................................................................. 10
Appendix A: Import.io GUI Screenshots ................................................................................................. 10
Appendix B: Python Code using Import.io API ........................................................................................ 11
Appendix C: R Code ................................................................................................................................. 13
Appendix D: Resulting Training Data ...................................................................................................... 14
Appendix E: Google Prediction API Training Page .................................................................................. 15
Appendix F: Google Prediction API Testing Worksheet .......................................................................... 16
Page 1
Abstract
While online consumer review sites can hold a massive amount of seemingly unorganized information, big data analysis can treat these sites as a repository of useful information. In our project we apply data mining techniques to build a model that predicts what reviews a restaurant would receive, based on restaurant review information available online. We then run our model on a test set to show that to a reasonable extent, it possesses predictive power that may serve a restaurateur with business expansion.
Background
Yelp is a highly popular company that supports and shares user-provided business reviews through social media. Though it is available for any internet users to read, the use of Yelp appeals particularly to younger demographics as well as to the smart-phone carrying portion of the population. In our project, Yelp serves as a vast source of online data on restaurant reviews from cities across the United States.
The restaurant industry is highly competitive and very sensitive to consumer sentiment. Online reviews significantly have an impact on business, with a one-star increase in Yelp boosting restaurant revenues by as much as 9%1. (Interestingly enough, this effect is only observed in independent restaurants. Because chain restaurants do not receive any significant effect from Yelp reviews, Yelp has effectively expanded the success of independent restaurants in the overall marketplace.) It is this impact that makes a Yelp review vital for an restaurateur who hopes to open a successful business.
Motivation
The reviews seen on Yelp are the most recent aggregate of all the reviews. Therefore, the predictive ability of this analysis is not to actively predict the most recent Yelp review, but to predict potential Yelp reviews before a restaurant opens. For instance, imagine a restaurateur who recently had a soft launch for her restaurant. The goal of the restaurateur is to use the soft launch to determine the sentiments of the diners, which she can do by handing out surveys. With the survey results, she can then compare them to results of this text mining model to determine its potential Yelp review. This may potentially have impact on her business decisions. This can be seen as a more robust estimation of a restaurant potential rating since it takes into account the diners sentiments and detailed thoughts versus basic online surveys in which diners would just give an overall star-rating. Our business model is to provide restaurateurs the ability to estimate their future Yelp review, given about 40 written reviews. This estimation will give them a chance to make any needed changes before going public.
1 Luca, Michael and Georgios Zervas. Fake It Till You Make It: Reputation, Competition, and Yelp Review Fraud. Harvard Business School. September 17, 2013. (http://businessinnovation.berkeley.edu/WilliamsonSeminar/luca092613.pdf)
Page 2
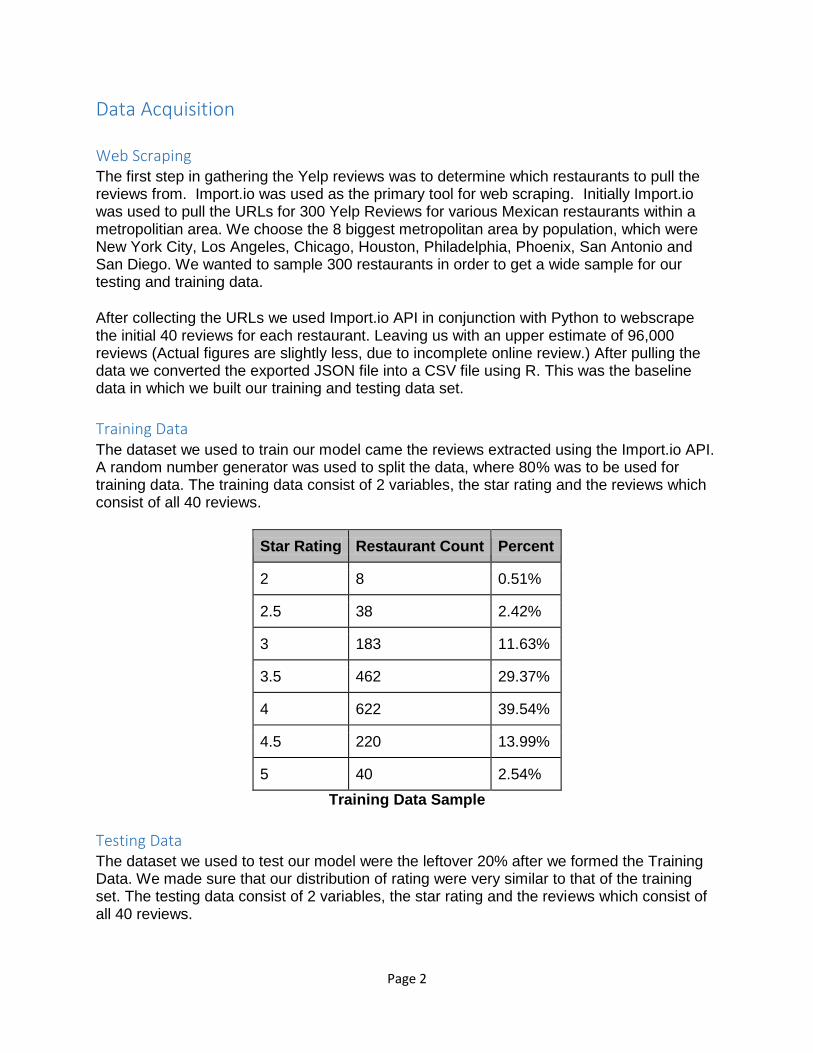
Data Acquisition
Web Scraping
The first step in gathering the Yelp reviews was to determine which restaurants to pull the reviews from. Import.io was used as the primary tool for web scraping. Initially Import.io was used to pull the URLs for 300 Yelp Reviews for various Mexican restaurants within a metropolitian area. We choose the 8 biggest metropolitan area by population, which were New York City, Los Angeles, Chicago, Houston, Philadelphia, Phoenix, San Antonio and San Diego. We wanted to sample 300 restaurants in order to get a wide sample for our testing and training data.
After collecting the URLs we used Import.io API in conjunction with Python to webscrape the initial 40 reviews for each restaurant. Leaving us with an upper estimate of 96,000 reviews (Actual figures are slightly less, due to incomplete online review.) After pulling the data we converted the exported JSON file into a CSV file using R. This was the baseline data in which we built our training and testing data set.
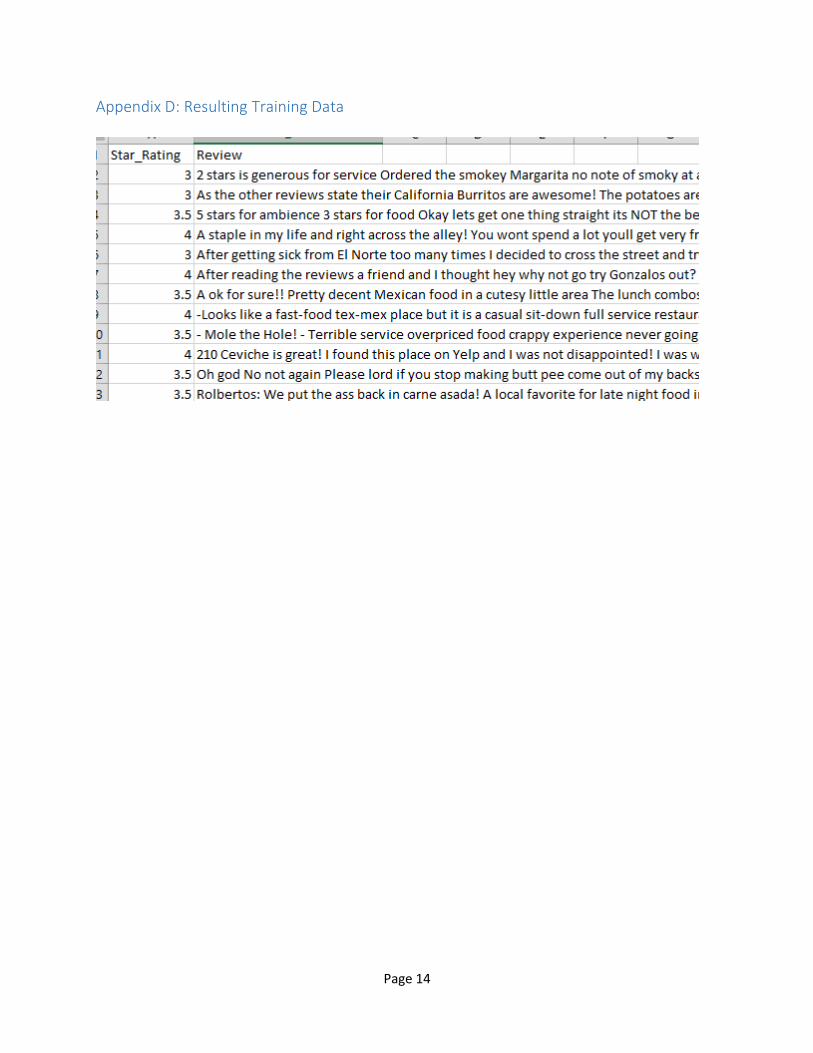
Training Data
The dataset we used to train our model came the reviews extracted using the Import.io API. A random number generator was used to split the data, where 80% was to be used for training data. The training data consist of 2 variables, the star rating and the reviews which consist of all 40 reviews.
Star Rating Restaurant Count Percent
2 8 0.51%
2.5 38 2.42%
3 183 11.63%
3.5 462 29.37%
4 622 39.54%
4.5 220 13.99%
5 40 2.54%
Training Data Sample
Testing Data
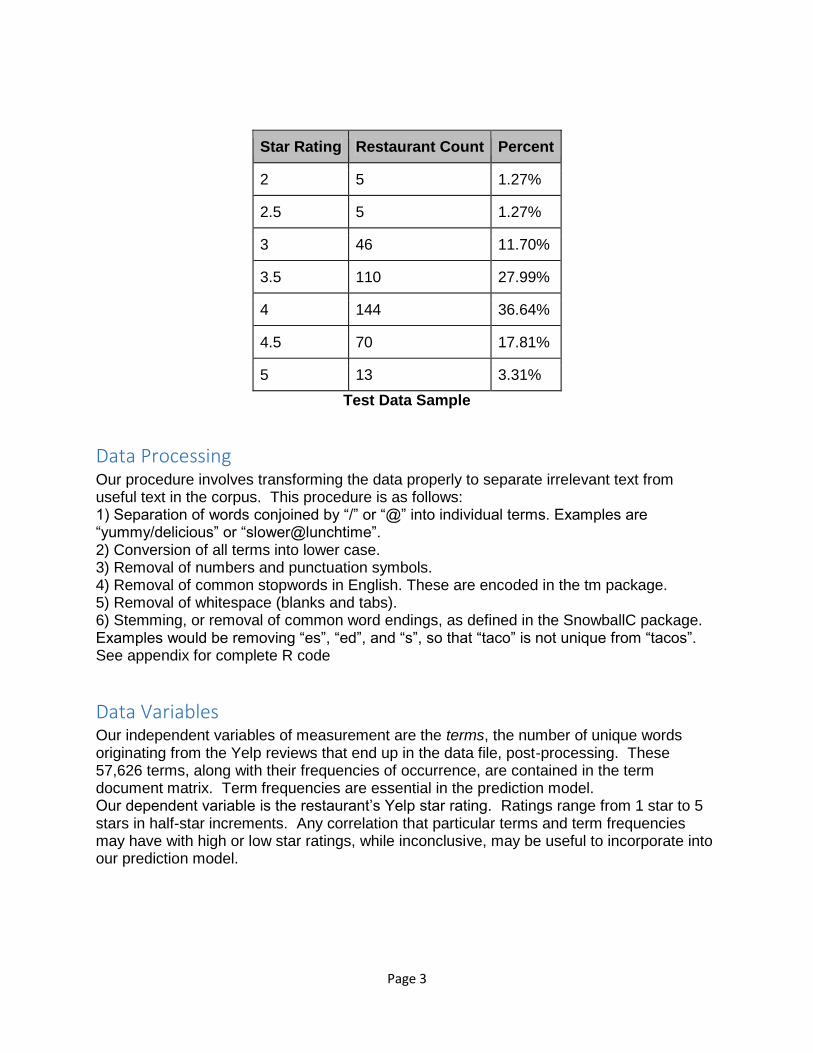
The dataset we used to test our model were the leftover 20% after we formed the Training Data. We made sure that our distribution of rating were very similar to that of the training set. The testing data consist of 2 variables, the star rating and the reviews which consist of all 40 reviews.
Page 3
Star Rating Restaurant Count Percent
2 5 1.27%
2.5 5 1.27%
3 46 11.70%
3.5 110 27.99%
4 144 36.64%
4.5 70 17.81%
5 13 3.31%
Test Data Sample
Data Processing
Our procedure involves transforming the data properly to separate irrelevant text from useful text in the corpus. This procedure is as follows: 1) Separation of words conjoined by “/” or “@” into individual terms. Examples are “yummy/delicious” or “slower@lunchtime”. 2) Conversion of all terms into lower case. 3) Removal of numbers and punctuation symbols. 4) Removal of common stopwords in English. These are encoded in the tm package. 5) Removal of whitespace (blanks and tabs). 6) Stemming, or removal of common word endings, as defined in the SnowballC package. Examples would be removing “es”, “ed”, and “s”, so that “taco” is not unique from “tacos”. See appendix for complete R code
Data Variables
Our independent variables of measurement are the terms, the number of unique words originating from the Yelp reviews that end up in the data file, post-processing. These 57,626 terms, along with their frequencies of occurrence, are contained in the term document matrix. Term frequencies are essential in the prediction model. Our dependent variable is the restaurant’s Yelp star rating. Ratings range from 1 star to 5 stars in half-star increments. Any correlation that particular terms and term frequencies may have with high or low star ratings, while inconclusive, may be useful to incorporate into our prediction model.
Page 4
Model
Our initial attempts were to compare frequencies of rating categories and their correlation with key term frequencies. We ran into a problem with sample sizes for several rating categories, since very few restaurants were rated under a 3. Thus we were unable to provide helpful plots to compare these. We then turned to comparing word clouds of the various ratings of the training set and the test set.
We ran several comparisons between word clouds and term frequencies between the different star ratings. We found some preliminary differences between 2-star restaurants and 5-star restaurants, where reviews of 5-star restaurants seem to be more descriptive while also emphasizing restaurant environment and service. Nonetheless, we were unable to find strong tendencies of certain terms or term frequencies that could help predict the star rating of a restaurant.
In general, we could not make a strong prediction using words clouds and word frequencies. Instead we need to delve more into sentiment analysis which is outside of our current toolset of R. The tool we used is Google Prediction API which took in our data and attempt to categorized and rate restaurants based on the uploaded reviews.
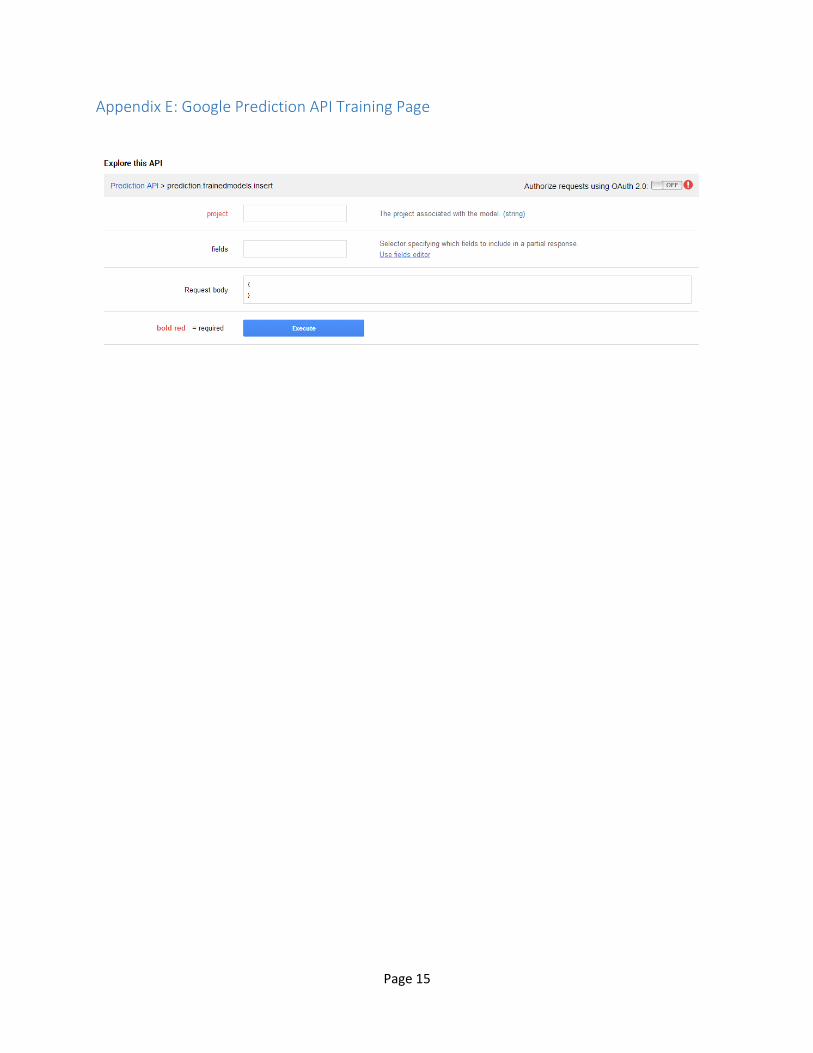
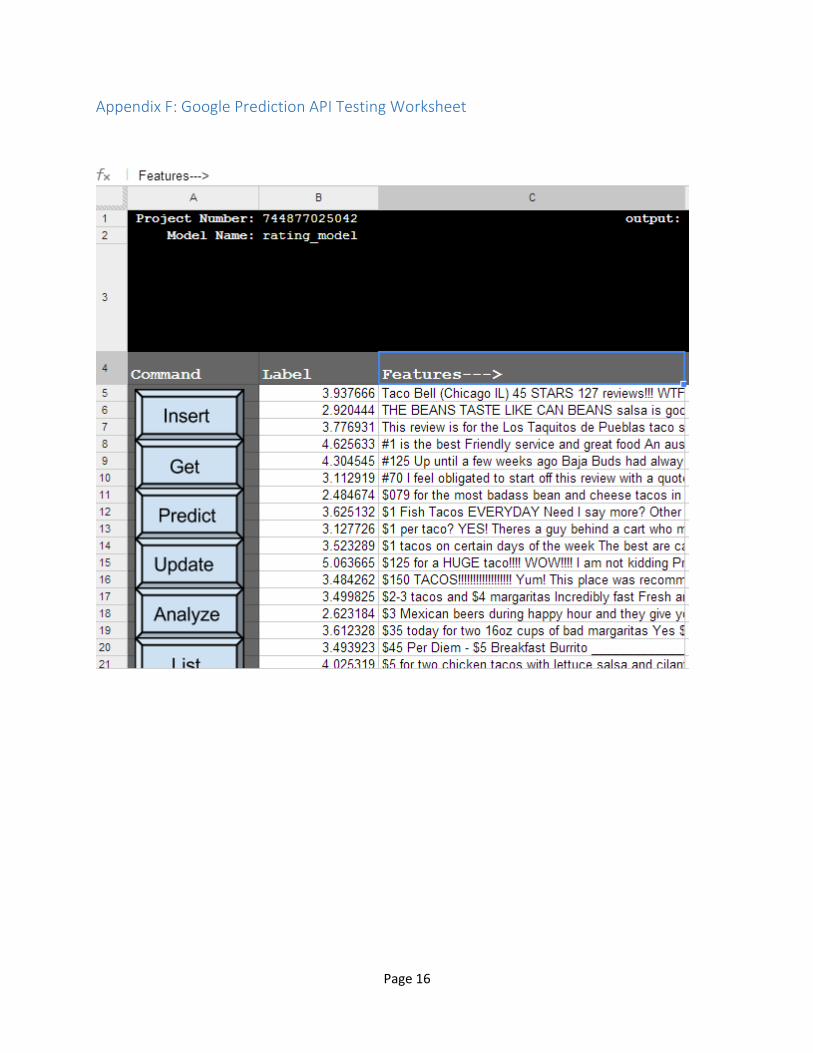
Google Predictive API We wanted to use Google Predictive API to predict the star ratings of the testing dataset. We created a project within Google Developer Council and activated their Predictive API and Cloud Storage API, which was used to hold the training data. The training data is then fed into Google Predictive API in which the star rating was designated as the variable to be predicted while the reviews were inputs. After the model was fully trained, it was then recalled through a specially designed Google Docs Spreadsheet. The reviews from the Testing data was then inputted into the Google Docs Spreadsheet, where the model proceeded to predict star rating. The predicted star ratings is then compared to the actual star rating for later analysis.
Acknowledgement of Biases
There are several areas in which bias can be introduced into the data sets. The first bias may be present in our use of the 8 biggest metropolitan areas as the basis of selecting the Mexican restaurants. These ratings and reviews may differ from in restaurants in rural areas and our prediction model might not be effective in predicting ratings in those areas.
The second potential bias may occur when we selected the first 300 restaurants from Yelp. Yelp has its own sorting algorithm which might impose a certain selection bias in which restaurants are displayed. Although we used a sample size of 300 to compensate for this, there is still a possibility of bias especially in cities with a large number of Mexican restaurants like Los Angeles or San Diego.
Page 5
Even with the selection of the first 300 restaurants in a metropolitan area, there seems to be a rating bias. About 68% of the restaurants in our data set are ranked 3.5 or 4 stars while only 3 percent of restaurants in our data set are ranked 2 or 2.5 stars. This might be the general trend within Yelp ratings or possible selection bias when we search for Mexican restaurants.
We must acknowledge the biases of Yelp reviews in the first place. Yelp captures the opinions of only those who use the internet -- and who use it frequently. While internet users make up a broad sector of the population, customers who actually report their experiences on Yelp represent a narrower band of people, particularly young, middle-class, and slightly more affluent consumers.
Further bias may come from the potentially fake Yelp reviews. Academic researchers are studying the prevalence of dishonest reviews -- some as high as 20%2 -- that are created by restaurant owners and managers with the intention of artificially raising their own Yelp review, or lowering those reviews of competitors. Like the findings of Yelp reviews on business impact, fake reviews are more present on independent restaurants than on chains. The study also shows that fake reviews tend to occur in restaurants that only have few reviews to begin with, giving large weight to any single negative review.
Analysis Results
Our initial attempts were to compare frequencies of rating categories and their correlation with key term frequencies. We ran into a problem with sample sizes for several rating categories. Thus we were unable to provide descriptive plots to compare these.
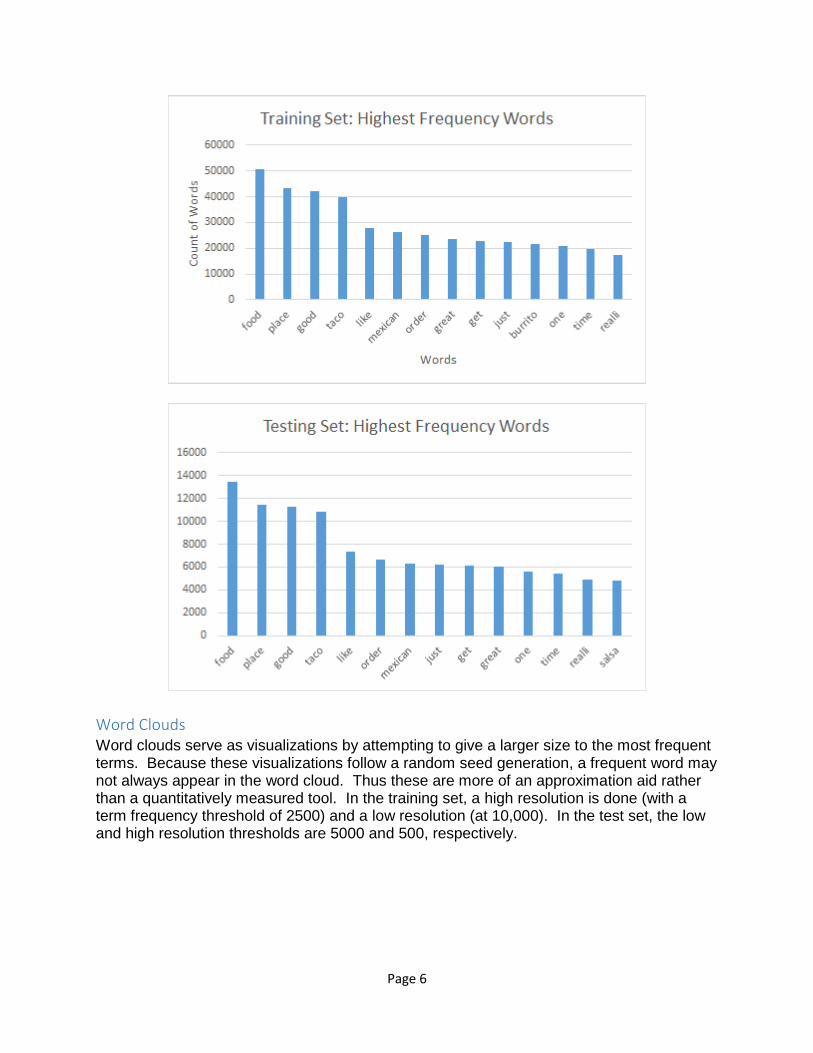
Histograms
Two histograms, one for the training set and another for the test set, show the 14 most frequently-occurring terms in each set. Despite slight variations in the orders of term frequencies, these 14 terms are for the most part common to both the training and test sets. Even the overall patterns take similar shape. For example, after the most frequent term, “food”, the next three terms share similar frequencies before a visible drop in frequency occurs from the fifth word and on.
2 IBID.
Page 6
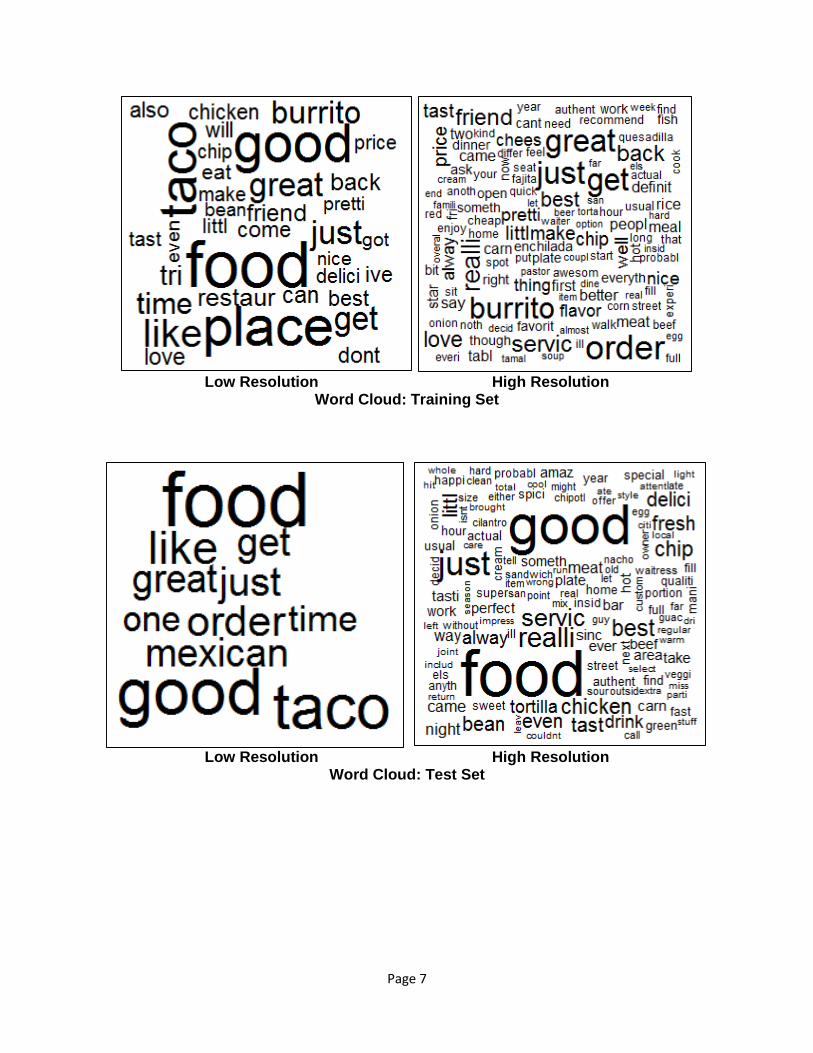
Word Clouds
Word clouds serve as visualizations by attempting to give a larger size to the most frequent terms. Because these visualizations follow a random seed generation, a frequent word may not always appear in the word cloud. Thus these are more of an approximation aid rather than a quantitatively measured tool. In the training set, a high resolution is done (with a term frequency threshold of 2500) and a low resolution (at 10,000). In the test set, the low and high resolution thresholds are 5000 and 500, respectively.
Page 7
Low Resolution High Resolution
Word Cloud: Training Set
Low Resolution High Resolution
Word Cloud: Test Set
Page 8
Evaluation
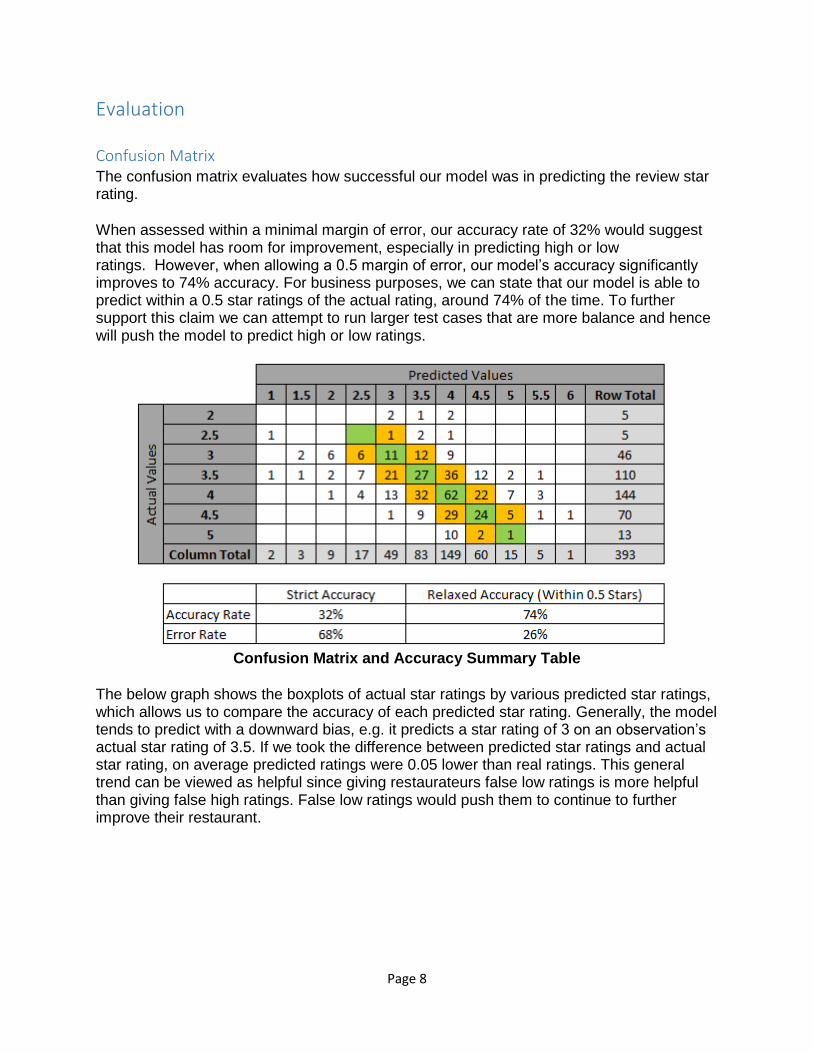
Confusion Matrix
The confusion matrix evaluates how successful our model was in predicting the review star rating.
When assessed within a minimal margin of error, our accuracy rate of 32% would suggest that this model has room for improvement, especially in predicting high or low ratings. However, when allowing a 0.5 margin of error, our model’s accuracy significantly improves to 74% accuracy. For business purposes, we can state that our model is able to predict within a 0.5 star ratings of the actual rating, around 74% of the time. To further support this claim we can attempt to run larger test cases that are more balance and hence will push the model to predict high or low ratings.
Confusion Matrix and Accuracy Summary Table
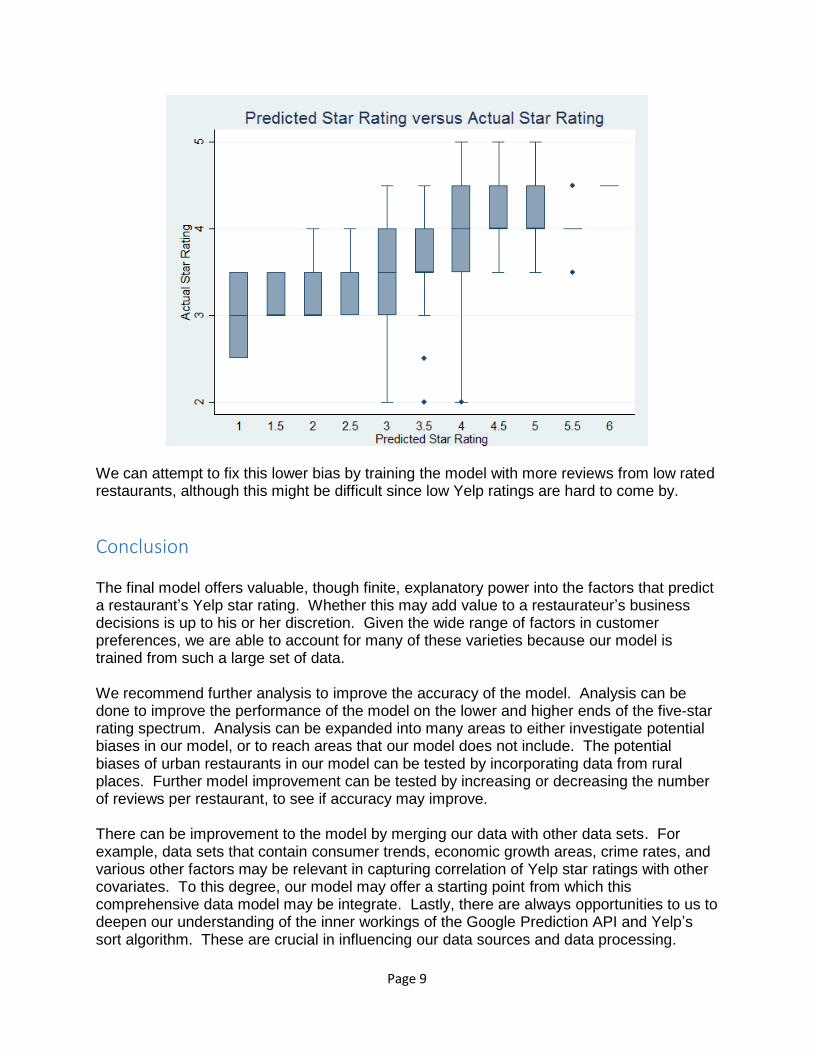
The below graph shows the boxplots of actual star ratings by various predicted star ratings, which allows us to compare the accuracy of each predicted star rating. Generally, the model tends to predict with a downward bias, e.g. it predicts a star rating of 3 on an observation’s actual star rating of 3.5. If we took the difference between predicted star ratings and actual star rating, on average predicted ratings were 0.05 lower than real ratings. This general trend can be viewed as helpful since giving restaurateurs false low ratings is more helpful than giving false high ratings. False low ratings would push them to continue to further improve their restaurant.
Page 9
We can attempt to fix this lower bias by training the model with more reviews from low rated restaurants, although this might be difficult since low Yelp ratings are hard to come by.
Conclusion The final model offers valuable, though finite, explanatory power into the factors that predict a restaurant’s Yelp star rating. Whether this may add value to a restaurateur’s business decisions is up to his or her discretion. Given the wide range of factors in customer preferences, we are able to account for many of these varieties because our model is trained from such a large set of data. We recommend further analysis to improve the accuracy of the model. Analysis can be done to improve the performance of the model on the lower and higher ends of the five-star rating spectrum. Analysis can be expanded into many areas to either investigate potential biases in our model, or to reach areas that our model does not include. The potential biases of urban restaurants in our model can be tested by incorporating data from rural places. Further model improvement can be tested by increasing or decreasing the number of reviews per restaurant, to see if accuracy may improve. There can be improvement to the model by merging our data with other data sets. For example, data sets that contain consumer trends, economic growth areas, crime rates, and various other factors may be relevant in capturing correlation of Yelp star ratings with other covariates. To this degree, our model may offer a starting point from which this comprehensive data model may be integrate. Lastly, there are always opportunities to us to deepen our understanding of the inner workings of the Google Prediction API and Yelp’s sort algorithm. These are crucial in influencing our data sources and data processing.
Page 10
Appendices
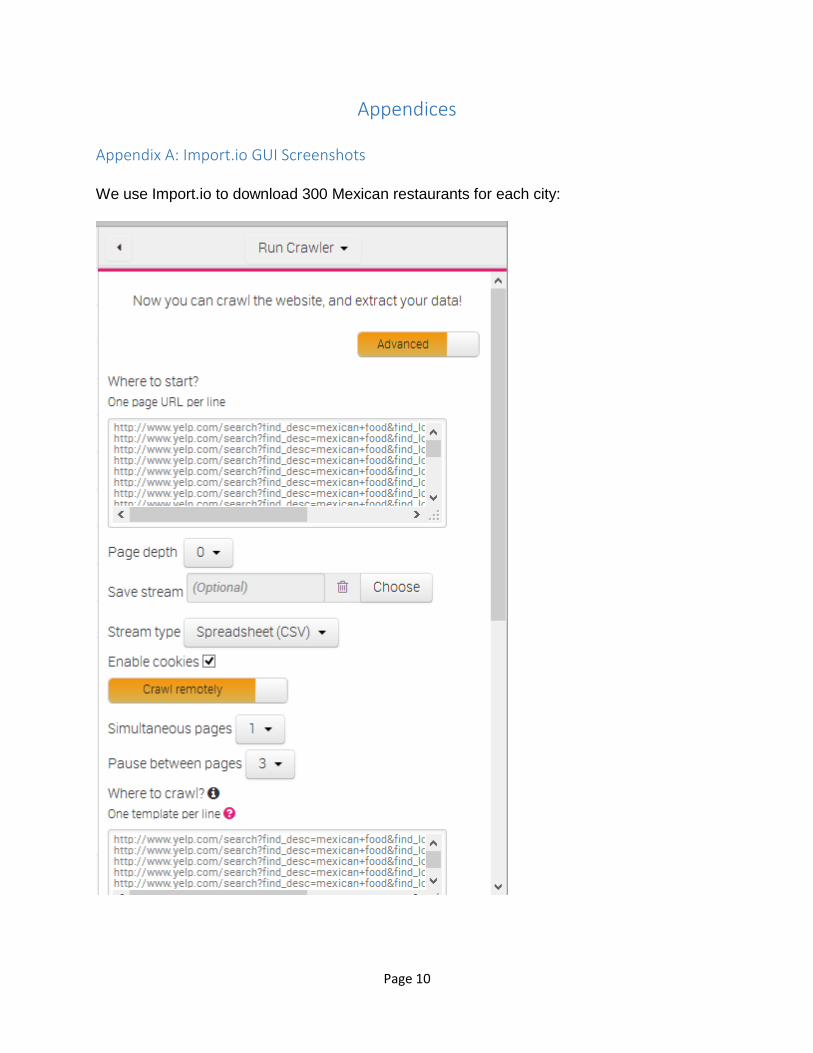
Appendix A: Import.io GUI Screenshots
We use Import.io to download 300 Mexican restaurants for each city:
Page 11
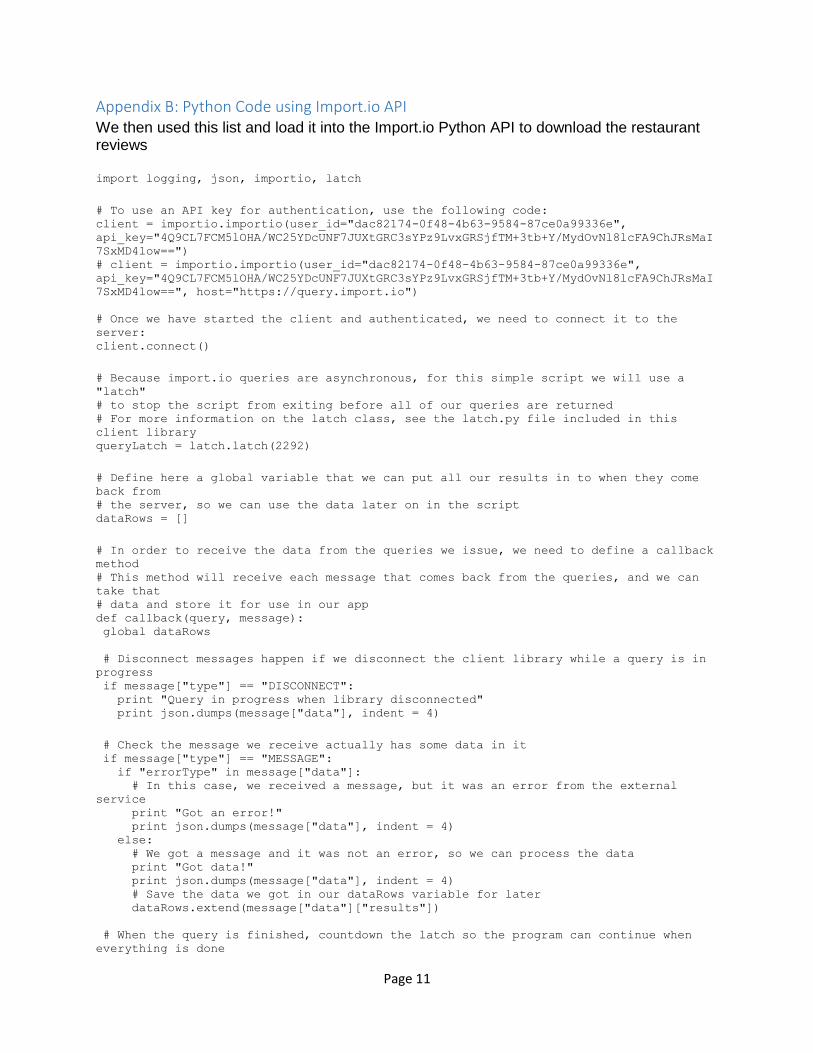
Appendix B: Python Code using Import.io API We then used this list and load it into the Import.io Python API to download the restaurant reviews import logging, json, importio, latch # To use an API key for authentication, use the following code: client = importio.importio(user_id="dac82174-0f48-4b63-9584-87ce0a99336e",
api_key="4Q9CL7FCM5lOHA/WC25YDcUNF7JUXtGRC3sYPz9LvxGRSjfTM+3tb+Y/MydOvNl8lcFA9ChJRsMaI
7SxMD4low==") # client = importio.importio(user_id="dac82174-0f48-4b63-9584-87ce0a99336e",
api_key="4Q9CL7FCM5lOHA/WC25YDcUNF7JUXtGRC3sYPz9LvxGRSjfTM+3tb+Y/MydOvNl8lcFA9ChJRsMaI
7SxMD4low==", host="https://query.import.io") # Once we have started the client and authenticated, we need to connect it to the
server: client.connect() # Because import.io queries are asynchronous, for this simple script we will use a
"latch" # to stop the script from exiting before all of our queries are returned # For more information on the latch class, see the latch.py file included in this
client library queryLatch = latch.latch(2292) # Define here a global variable that we can put all our results in to when they come
back from # the server, so we can use the data later on in the script dataRows = [] # In order to receive the data from the queries we issue, we need to define a callback
method # This method will receive each message that comes back from the queries, and we can
take that # data and store it for use in our app def callback(query, message): global dataRows # Disconnect messages happen if we disconnect the client library while a query is in
progress if message["type"] == "DISCONNECT": print "Query in progress when library disconnected" print json.dumps(message["data"], indent = 4) # Check the message we receive actually has some data in it if message["type"] == "MESSAGE": if "errorType" in message["data"]: # In this case, we received a message, but it was an error from the external
service print "Got an error!" print json.dumps(message["data"], indent = 4) else: # We got a message and it was not an error, so we can process the data print "Got data!" print json.dumps(message["data"], indent = 4) # Save the data we got in our dataRows variable for later dataRows.extend(message["data"]["results"]) # When the query is finished, countdown the latch so the program can continue when
everything is done
Page 12
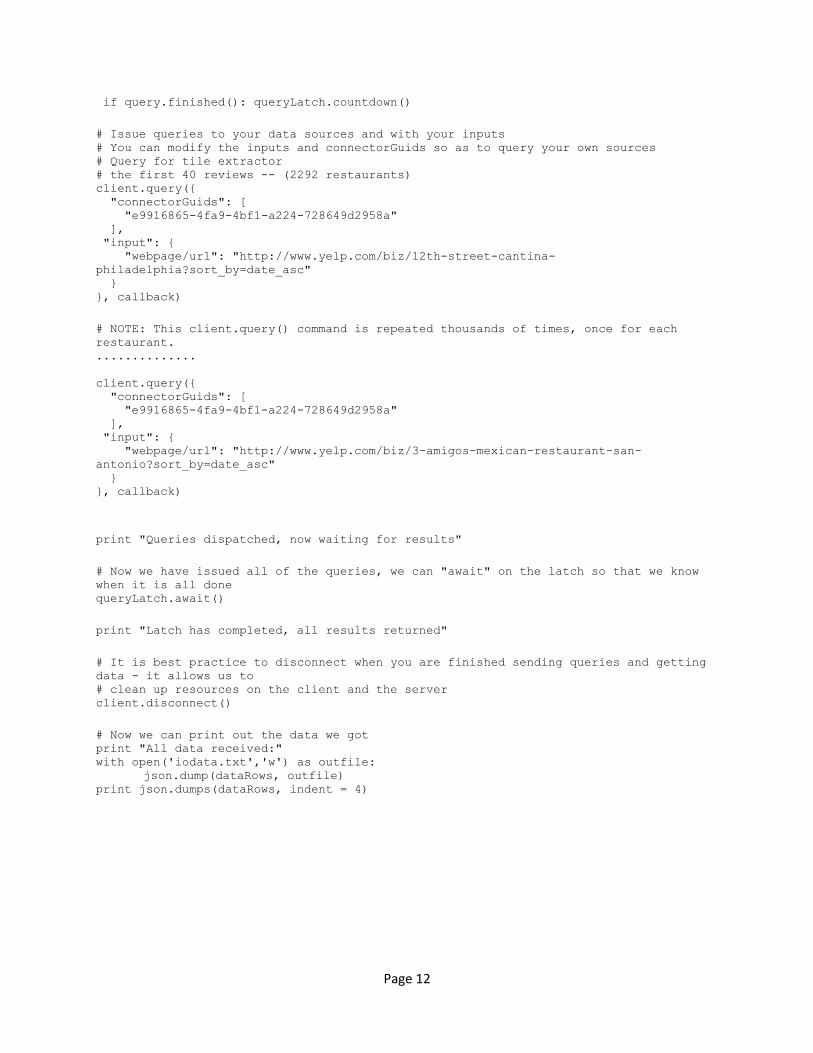
if query.finished(): queryLatch.countdown() # Issue queries to your data sources and with your inputs # You can modify the inputs and connectorGuids so as to query your own sources # Query for tile extractor # the first 40 reviews -- (2292 restaurants) client.query({ "connectorGuids": [ "e9916865-4fa9-4bf1-a224-728649d2958a" ], "input": { "webpage/url": "http://www.yelp.com/biz/12th-street-cantina-
philadelphia?sort_by=date_asc" } }, callback) # NOTE: This client.query() command is repeated thousands of times, once for each
restaurant. .............. client.query({ "connectorGuids": [ "e9916865-4fa9-4bf1-a224-728649d2958a" ], "input": { "webpage/url": "http://www.yelp.com/biz/3-amigos-mexican-restaurant-san-
antonio?sort_by=date_asc" } }, callback)
print "Queries dispatched, now waiting for results" # Now we have issued all of the queries, we can "await" on the latch so that we know
when it is all done queryLatch.await() print "Latch has completed, all results returned" # It is best practice to disconnect when you are finished sending queries and getting
data - it allows us to # clean up resources on the client and the server client.disconnect() # Now we can print out the data we got print "All data received:" with open('iodata.txt','w') as outfile: json.dump(dataRows, outfile) print json.dumps(dataRows, indent = 4)
Page 13
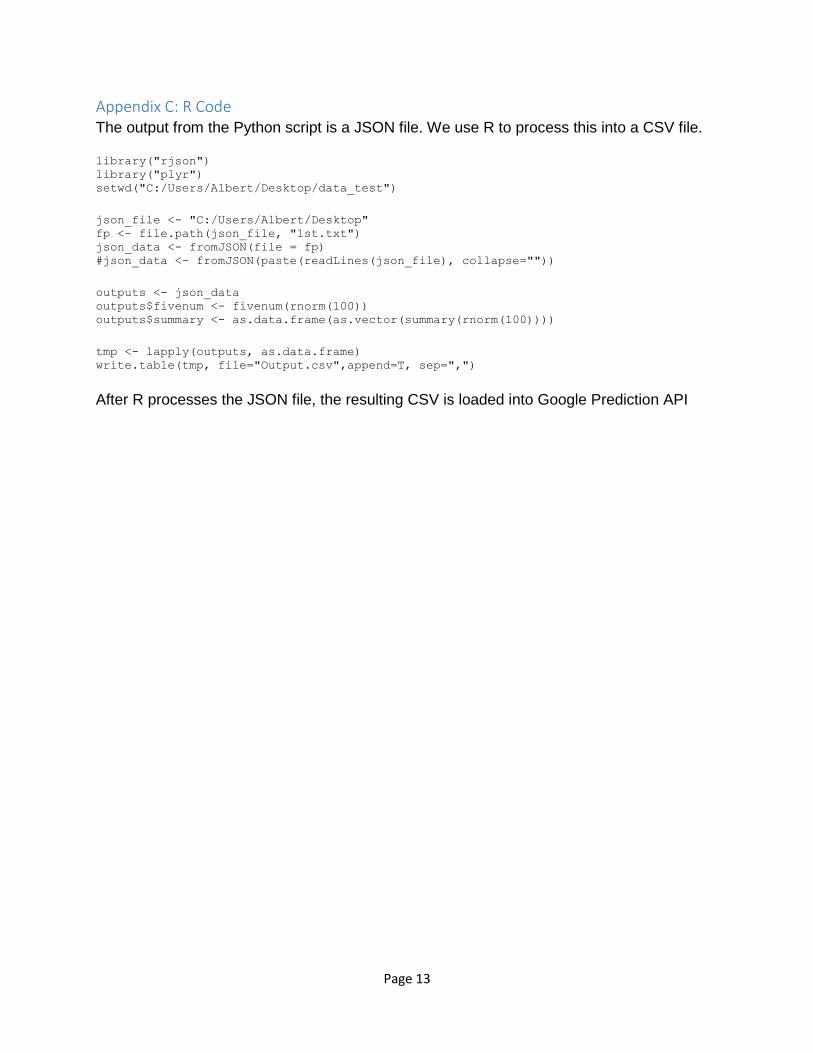
Appendix C: R Code
The output from the Python script is a JSON file. We use R to process this into a CSV file. library("rjson") library("plyr") setwd("C:/Users/Albert/Desktop/data_test") json_file <- "C:/Users/Albert/Desktop" fp <- file.path(json_file, "1st.txt") json_data <- fromJSON(file = fp) #json_data <- fromJSON(paste(readLines(json_file), collapse="")) outputs <- json_data outputs$fivenum <- fivenum(rnorm(100)) outputs$summary <- as.data.frame(as.vector(summary(rnorm(100)))) tmp <- lapply(outputs, as.data.frame) write.table(tmp, file="Output.csv",append=T, sep=",")
After R processes the JSON file, the resulting CSV is loaded into Google Prediction API
Page 14
Appendix D: Resulting Training Data
Page 15
Appendix E: Google Prediction API Training Page
Page 16
Appendix F: Google Prediction API Testing Worksheet