Texas Water Management - Texas Master...
36
Texas Water Management Surface Water Planning, Groundwater Management, Select Water Management Strategies Mike Conner, Certified Texas Master Naturalist 1/19/2016
Transcript of Texas Water Management - Texas Master...

Texas Water ManagementSurface Water Planning, Groundwater Management, Select Water Management
Strategies
Mike Conner, Certified Texas Master Naturalist
1/19/2016

OverviewThe Water Planning Challenge
The Texas State Water Plan
Groundwater Conservation Districts
Select Water Planning Strategies

The Water Planning Challenge Historically, agriculture has dominated water use
Agricultural use is slowly declining
Better practices
Less land used for agriculture
Population growth accounts for almost all increase in future water requirements
Williamson County: 95% of increase in water needs comes from population growth
The Austin area is projected to grow to 8 million people by 2060

The State Water Plan Texas was unprepared for the drought in the 1950’s
This led to the Texas Water Development Board and the Texas State Water Plan.
5 Year Cycles
Just finishing the 2016 plan cycle
The 2021 plan cycle starts this year
60 Year planning horizon
The 2016 plan covers 2020 to 2070

The State Water Plan Identifies: Future water shortages for every water provider in the
state based on drought of record conditions
Projects water needs and evaluates and recommends strategies to meet all water shortages
River and stream segments of unique ecological value
Unique reservoir sites

Role of the State Water Plan Guides water efforts throughout the state
Texas Water Development Board (TWDB) and Texas Commission on Environmental Quality (TCEQ) must be consistent Regulatory
Financing – mostly reduced rate loans, most projects are based on revenue bonds
Does not initiate projects
Does not prevent projects

How the Plan is Developed Texas Water Development Board (TWDB)
Oversees the process
Develops population and water demand projections for all entities using water
Funds and Administers the regional and State water planning processes
Reviews and compiles the Regional Water Plans into the State Water Plan
Makes recommendations to Legislature based on the plan

Regional Water Planning Areas
Milam County

How the Plan is Developed 16 Regional Water Planning Groups
Review water need projections from the TWDB
Evaluate current water supplies in their areas
Project water shortages based on the drought of record (1950’s)
Evaluate strategies to meet projected shortages
Recommend (with public input) strategies to meet all projected shortages
Almost all the work is done by an engineering firm contracted by the regional water planning group


Brazos G Water Planning Group 23 current voting members
Members chosen by solicitation from public and current planning group by 2/3 vote of sitting members present
Tenure: Officers = 2 years; Others = 1 year

Brazos G Water Planning Group Counties Represented: Brazos, Bell, McLennan, Nolan,
Hill, Williamson, Erath, Hood, Knox, Grimes, Taylor, Knox/Haskell/Baylor, Jones, Burleson, and Milam Counties
Interests Represented: Agriculture, Small Business, River Authorities, Groundwater Management Area Representative, Water Utilities, Municipalities, Counties, Water Districts, Industries, Public, Electric Utilities, Environmental
Initially Prepared 2016 Brazos G Regional Water Plan is 1,576 pages. Prepared by David D. Dunn of HDR Engineering, Inc.

Brazos G: Water Strategies Evaluated1. Water Conservation
2. Wastewater Reuse
3. New Reservoirs
4. Acquisition of Existing Supplies
5. Management of Existing Supplies
6. Regional Water Supply Projects
7. Groundwater
8. Aquifer Storage and Recovery (ASR)
9. Brackish Groundwater
10.Miscellaneous Strategies
11.Additional Strategies

Strategy Evaluation Criteria Water Supply – Quantity, Reliability, and Cost
Environmental Issues – All done from available information, no “boots on the ground” work is done. Environmental water needs
Wildlife habitat
Cultural resources
Bays and estuaries
Impact on Other State Water Resources
Threats to Agriculture and Natural Resources
Equitable Comparison of Feasible Strategies

Fundamental Problem
Strategy evaluation Based on standard engineering guidelines and available
information
Leaves room for huge cost errors and project infeasibility.
This can lead to: False confidence
Lost opportunity
Postponement of difficult decisions until they are much more difficult.

Groundwater Conservation Districts Texas has historically followed the “Rule of Capture”
Whoever has the biggest pump gets the most water
Almost no effective legal limits on pumping
Must have some value, not just waste
Can’t be done just to harm a neighbor
Can’t slant well to go under neighbor property
Groundwater Conservation Districts are the alternative
Voluntary: must be voted in

Groundwater Conservation Districts Develop and implement comprehensive
management plans to conserve and protect groundwater resources Protect the aquifer while also protecting
landowner rights, and supporting efficient use of groundwater
Control and prevent waste
Address environmental issues (surface water interaction, subsidence, …)
Cooperate with the Groundwater Management Area

GCD Management Desired Future Conditions (DFCs)
Science is shaky Monitoring Wells – Drawdown How many, who monitors, how often
Modeled Available Groundwater (MAG) Predicts how much water can be undrawn
from an aquifer and maintain DFCs Models are specified by the State, but there
is a lot of technical debate

GCD Management Permits: Manage wells and pumping
Contract and legal Issues
Rules: Require meters, cap open wells, …
Funded by property taxes or well production fees

Selected Water Planning Strategies Reservoirs
The Role of Reservoirs in Texas
Two types: in-channel and off-channel
Groundwater Aquifer Storage Waste Water Reuse Desalination

The Reservoir Strategy Reservoirs are our number one water management
strategy in Texas
But - we have already built all of the really efficient reservoirs and are now looking at much less efficient possibilities

The Reservoir Strategy By 1913, TX had 4 major reservoirs with total storage capacity of
288,340 acre-feet (1 acre-foot is about 326,000 gallons)
By 2012, TX had 188 major (normal capacity of 5000 or more acre-feet) reservoirs with a storage capacity of over 30 million acre-feet
TX has 5,607 square miles of inland water (#1 in contiguous states) followed by Florida (5373), Minnesota (4782), and then Louisiana (4433)
Lake Travis
Area: 18,929 acres,
Storage: 1,953,936 acre-feet,
Generates 93,000kw (about $81,000,000 in electricity per year)

Two Types of Reservoirs:In-Channel
A dam is used to backup the primary flow of a river or stream
The water stored comes from the river or steam that is dammed
Frequently involved in flood control
Frequently used to generate significant electrically

Two Types of Reservoirs:In-Channel
Problems:
Major impact on natural stream flows
Dam is a barrier to aquatic life movement
Silting can reduce the storage capacity drastically and is too costly to remove
Generally floods a very large area (eminent domain)
Loses a lot of water to evaporation
All the good reservoir sites are in use
Two Types of Reservoirs: Off-Channel The stored water primarily comes via pipeline from
an adjacent river or stream
Never used for flood control A dam is still needed to define the reservoir

Two Types of Reservoirs: Off-Channel Pros and Cons:
Allows use of good storage sites that don’t have significant water flow into them
Allows storage of excess flows in the primary river/stream But, requires very large intake pumps and pipelines
to take advantage of excess flows Less impact on natural flows in the primary channel
But, still significant impacts on flowBut, usually destroys one or more small streams or
creeks and their ecosystems

Two Types of Reservoirs: Off-Channel Pros and Cons, Continued:
Less prone to silting
Little barrier to aquatic life movement
But, intake and discharge (if present) can have significant impact on aquatic life
Instead of generating electricity, a large quantity is used for pumping

Phases of Reservoir Implementation
1. Feasibility study and recommendation by water planning process
2. Sponsoring organization formed or identified
3. Initial Studies
Site selection, refinement
Environment assessments
Cultural/Historical assessments
Engineering assessments and refinement
4. Permit acquisition (Army Corps of Engineers, TCEQ water rights, …)
5. Land acquisition (buy or condemn)
6. Build
A 20+ Year Process, After Step #2!

Phases of Reservoir Implementation
Many believe it is no longer feasible to build new reservoirs
in Texas!

Groundwater Texas has vast stores of underground water, but …
Most aquifers recharge very slowly or not at all
Ogallala underlies the American grain belt and does not recharge
Houston is sinking because of drawdown of the Gulf Coast aquifer
Aquifers are very poorly understood
Much underground water is brackish
Underused aquifers are not where the water is needed
142 mile pipeline to take water from here to San Antonio
Aquifer Storage Water can be pumped into an aquifer for storage
Water must not contaminate the storage aquifer
Better than a reservoir as it does not evaporate
However, not really well understood
Allows excess water (from wells, or rivers) to be saved for dry times SAWS plans to store water taken from the Carrizo-Wilcox aquifer here
into the Carrizo-Wilcox aquifer nearer San Antonio to use in droughts
Probably not very feasible to store river surges because the treatment/pumping rate would have to be extreme

Waste Water Reuse Several models:
Non-potable reuse – virtually every municipality already cleans up the waste water to this level today. It is quite practical to pipe this for ag, industrial, or large landscaping projects.
Indirect potable reuse – water is cleaned to current effluent standards and then blended with surface water (lakes, rivers) where it is extracted and treated to potable standards
Direct potable reuse – Water is cleaned to drinking water standards and then redistributed.

Waste Water Reuse Virtually all municipal waste water can be reclaimed at
reasonable cost (but 60% of municipal water is currently lost to irrigation). College Station has started waste water reuse and plans to reuse all
waste water
Estimated cost for direct potable reuse is $10.69 per 1000 gallons, half of which is debt service that would end in 20 years
Bryan has a plan for indirect potable reuse at a cost of $4.84 per 1000 gallons
Numerous municipalities have already implemented non-potable reuse with rates in the $2-$3 per 1000 gallons range

Modern Desalination
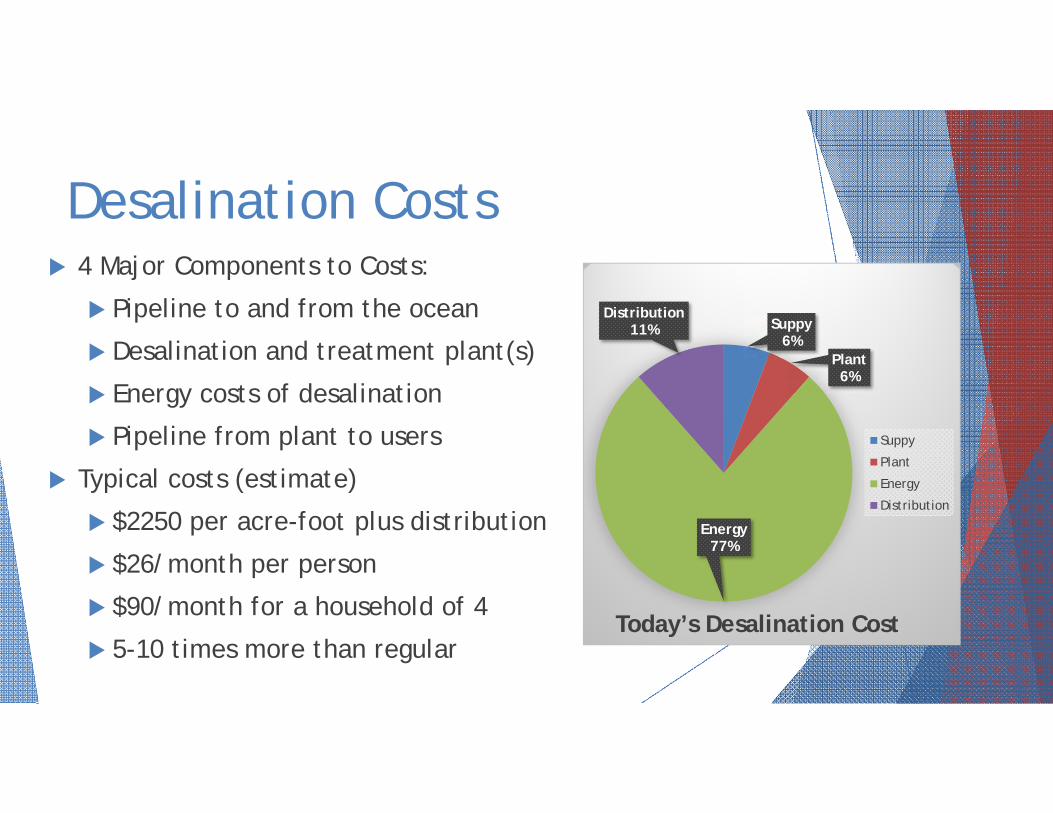
Desalination Costs 4 Major Components to Costs:
Pipeline to and from the ocean
Desalination and treatment plant(s)
Energy costs of desalination
Pipeline from plant to users
Typical costs (estimate)
$2250 per acre-foot plus distribution
$26/month per person
$90/month for a household of 4
5-10 times more than regular
Suppy6%
Plant6%
Energy77%
Distribution11%
Today’s Desalination Cost
Suppy
Plant
Energy
Distribution

Graphene to the Rescue
1-Atom Thick GrapheneMembrane
• Graphene is over 100 times more efficient• Reduce energy cost by ???, maybe 50%, maybe much more• $90 per month goes down to $60 per month and maybe much less• Biggest issue is making the right size hole: 0.8 nanometers
Graphene is super strong: 1-atom thick sheet of carbon
Traditional Membrane