Texas Water Development Board Planning and Conservation Efforts Conservation Vanessa Escobar Cameron...
58
Texas Water Development Board Planning and Conservation Efforts Conservation Vanessa Escobar Cameron Turner John Sutton Conservation Data & Information: Water Resources Planning Tom Barnett Kevin Kluge Erin McAuley Doug Shaw For Water Conservation Advisory Council April 20, 2011
-
Upload
gerard-reynard -
Category
Documents
-
view
213 -
download
0
Transcript of Texas Water Development Board Planning and Conservation Efforts Conservation Vanessa Escobar Cameron...

Texas Water Development Board Planning and Conservation Efforts
Conservation Vanessa EscobarCameron TurnerJohn Sutton
Conservation Data & Information:
Water Resources PlanningTom BarnettKevin KlugeErin McAuleyDoug Shaw
For Water Conservation Advisory Council April 20, 2011

• Data & Information Overview
• Separate & Overlapping functions
• Identify Key Reporting Vehicles
• How Information is being used
Conservation Efforts & Planning Efforts

Agency Mission

Board Members
TWDB Executive
Administration
Water Science &
Conservation
Water Science &
Conservation
FinanceFinance ProjectFinanceProjectFinance
Water ResourcesPlanning &
Information
Water ResourcesPlanning &
Information
Construction Assistance
Construction Assistance
Operations & Administratio
n
Operations & Administratio
n

Water Science &
Conservation
Water Science &
Conservation
Water Resources Planning & Information
Water Resources Planning & Information
Conservation
Surface Water
Groundwater
Water Resources Planning
Flood Planning
TNRIS(Texas Natural Resource Information
System)
Agricultural ConservationIrrigation Water Use estimatesMetering ReportsAg Grant Program
Municipal ConservationConservation PlansAnnual ReportsWater Loss Audits
EducationBest Management PracticesWater IQ School Educational Resources
Regional Water PlanningRegional Planning ProcessStakeholder LiaisonState Water Plan
Water Supply and Strategy AnalysisDatabase Information
Economic & Demographic ResearchState and Regional EstimatesState and Regional Projections
Water Use Surveys & EstimatesWater Use EstimatesGPCD
Innovative Water Technology

Summary: Historic Water Use In Texas

Water Demand Projections (acft)2012 State Water Plan Data
2010 2020 2030 2040 2050 2060
TRAVIS COUNTY
MUNICIPAL 199,677 237,014 274,610 308,229 342,865 369,723
MANUFACTURING 23,002 28,294 38,508 50,483 57,703 64,652
MINING 1,531 1,649 1,727 1,804 1,880 1,935
STEAM ELECTRIC 17,500 18,500 22,500 23,500 27,500 28,500
LIVESTOCK 704 704 704 704 704 704
IRRIGATION 1,126 1,034 951 875 805 741
COUNTY TOTAL 243,540 287,195 339,000 385,595 431,457 466,255

Water supply needs by water use category for 2010-2060.
Texas Water Development Board
Projected Supply - Projected Demand = Projected Needs

Estimates and Projections
Cameron TurnerAgricultural Water Conservation
Doug ShawWater Planning Research and Analysis
Agricultural Water Use:

Annual Irrigation Estimates
• Evapo-transpiration (ET)
• USDA-Farm Service Agency(FSA)
• Groundwater Conservation Districts
• TCEQ

TWDB Crop Categories
• Cotton• Sorghum• Corn• Rice• Wheat• Other Grain• Forage, Hay & Pasture• Peanuts• Soybeans and Other Oil Crops• Vineyard• Orchard• Alfalfa• Sugarcane• Vegetables• Other Crops

Irrigation Estimates by Crop Type
EstimatedCrop WaterNeed (in/ac)
= (Reference ET x Crop Coefficient) -Effective Rainfall
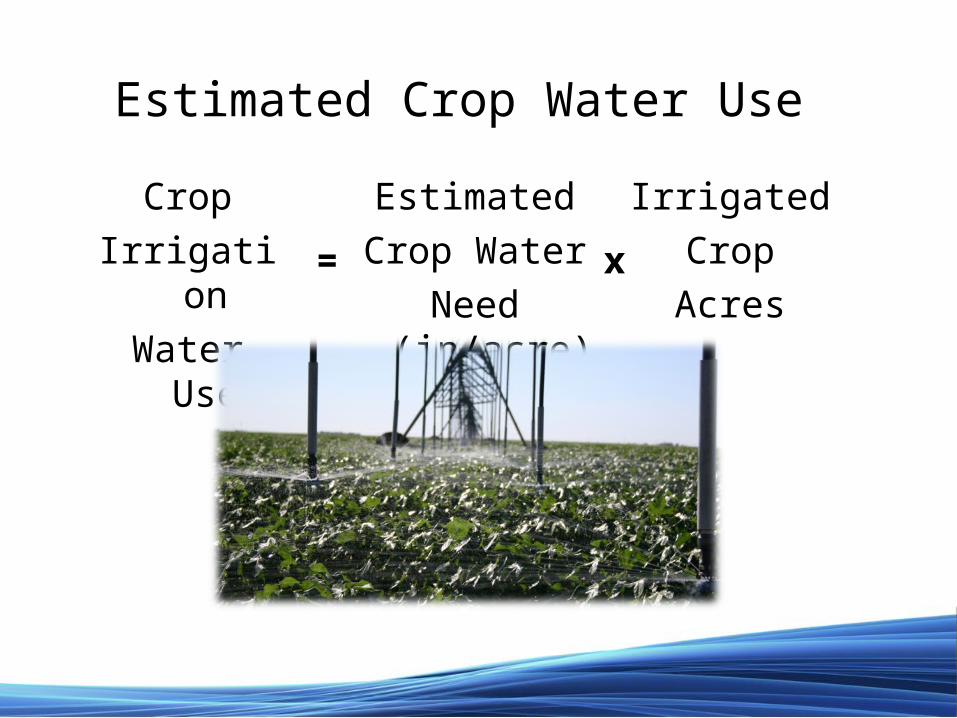
Estimated Crop Water Use
CropIrrigation
Water Use=
EstimatedCrop Water
Need (in/acre)
IrrigatedCropAcres
x

County Crop Initial Acres
Initial Rate
InitialAcre-Feet
Revised Acres
Revised Rate
RevisedAcre-Feet
CARSON COTTON 16,576.8 14.0 19,339.6 16,576.8 8.3 11,466.0
CARSON SORGHUM 4,984.7 11.0 4,569.3 4,984.7 9.6 3,988.0
CARSON CORN 21,323.1 22.0 39,092.4 21,323.1 20.0 35,539.0
CARSON WHEAT 13,463.4 26.0 29,170.7 13,463.4 14.0 15,707.0
CARSON OTHER_GRAIN 901.1 20.0 1,501.8 901.1 14.0 1,051.0
CARSON FORAGE_PASTURE 1,869.8 16.0 2,493.1 1,869.8 6.3 982.0
CARSON SOY_OIL 912.1 14.0 1,064.1 912.1 15.0 1,140.0
CARSON ALFALFA 608.6 18.0 912.9 608.6 17.4 882.0
CARSON OTHER 1,438.8 6.0 719.4 1,438.8 6.0 719.0
CARSON FAILED 1,533.7 4.0 511.2 1,533.7 4.0 511.0
CARSON TOTALS 63,612.1 99,374.5 63,612.1 71,985.0
Draft Irrigation Estimates
Comments and RevisionsCounty Crop
Initial Acres
Initial Rate
InitialAcre-Feet
CARSON COTTON 16,576.8 14.0 19,339.6
CARSON SORGHUM 4,984.7 11.0 4,569.3
CARSON CORN 21,323.1 22.0 39,092.4
CARSON WHEAT 13,463.4 26.0 29,170.7
CARSON OTHER_GRAIN 901.1 20.0 1,501.8
CARSON FORAGE_PASTURE 1,869.8 16.0 2,493.1
CARSON SOY_OIL 912.1 14.0 1,064.1
CARSON ALFALFA 608.6 18.0 912.9
CARSON OTHER 1,438.8 6.0 719.4
CARSON FAILED 1,533.7 4.0 511.2
CARSON TOTALS 63,612.1 99,374.5
Example: 2009 irrigation estimates for Carson County with revised irrigation rates and acre-feet according to Panhandle GCD comments.

2012 State Water Plan

Projections for the
2012 State Water Plan
Figure 2.2 – Projected Water Demands (acre-feet/year)Taken from “Water for Texas: Summary of 2011 Regional Water Plans”

Livestock Water UseAlthough Livestock Water Use represents a small portion of Total Water Use in the State, We are all very aware of how important the livestock industry is to the State of Texas, it’s history and it’s future.

Livestock Water Use
Livestock Water Use Coefficients (gallons/day)
• Dairy Cattle: 75 • Cattle: 15• Hogs: 11• Sheep: 2• Goats: .5• Horses: 12• Laying Hens: 90/1,000 birds• Broilers: 15/1,000 birds
TWDB Staff calculates annual Livestock water use for each County by gathering Livestock population data from Texas Agriculture Statistics Service (TASS) and Applying livestock water use coefficients.

Plans, Audits,& Reports
John SuttonMunicipal Water Conservation
Erin McAuleyWater Planning Research and Analysis
Municipal Water Use:

Required by TWDB or TCEQ for many utilities:• Water conservation plans Utility Profile • Annual reports• Water loss surveys• 5-year implementation reports • Drought contingency plans• Water Use Survey
Purpose:• Water conservation is a critical element to meeting the State's long-term water
needs • For water utilities and their customers, conservation programs are often more
economical because they can postpone or eliminate the need for new infrastructure
Conservation & Planning Reporting Requirements

TCEQ TWDB

Water Conservation Plan (WCP), 31 TAC Chapter 363, Subchapter A, Rule 363.15
The purpose of a WCP is to establish specific and quantified 5- and 10-year goals for water use. The WCP should establish a schedule for achieving those targets and goals, establish a method of tracking progress, and establish a water rate structure which is cost-based and which does not encourage the excessive use of water.
Water Conservation Plans

Utility Profile ~ is part of WCP• Evaluates water and wastewater systems• Identifies customer use characteristics, water conservation opportunities, and potential targets and goals. • Assists with water conservation plan development and ensures that important information and data is considered when preparing the water conservation plan and its target and goals.Information includes:•population served•number of connections•water supply system data•history of water use•waste water system data

Water Conservation PlansApplicable to Entities With•TWDB loans greater than $500,000•Surface water right through TCEQ•3,300 or more connections
ComponentsWCP should contain long-term elements such as ongoing education activities, metering, water accounting and estimated water savings from water reuse and recycling activities, leak detection and repair and other conservation activities.
Utility Profile Targets & Goals
GPCD & Water Loss Minimum Requirements
Non-promotional RatesEducation & Outreach
Drought Contingency PlanOther Checklist RequirementsFrequencyEvery 5 years


Water Conservation Annual Report (AR), 31 TAC Chapter 363, Subchapter A, Rule 363.15(g)
An Annual Report is required from each entity that submits a WCP. The Annual Report shall report annual progress in implementing each of the minimum requirements in the WCP. As the report form is completed an entity should review their WCP to see if they are making progress towards meeting stated goals.
*5year –Implementation Reports prepared for the TCEQ providing the required information may be submitted to the TWDB to fulfill this reporting requirement.
Annual Reports

Annual ReportsApplicable to Entities with• TWDB loans greater than $500,000• 3,300 or more connections• Surface water right through TCEQ* Anyone with a requirement to have a Water Conservation Plan
ComponentsThe Annual Report collects utility data on: Targets and Goals GPCDWater Savings Water Loss Educational Programs Rebate & Retrofit Programs Rate Structures Metering & Meter Repairs
FrequencyDue annually by May 1

AverageGoal
Average ReportedMinimum Maximum
Meeting5-Year Goal
Gallons per Capita per Day (GPCD)
147 156 43 454 42%
Residential GPCD
NA 101 37 294 NA
Water Loss
12% 11% 0% 42% 64%
Annual Report Data Submitted in Fiscal Year 2010

5 - year Implementation Report
TCEQ 5-year Implementation Report, 30 TAC Chapter 288, Subchapter B
A water conservation plan is required from each entity with a non-irrigation surface water right greater than 1,000 ac-ft/yr or an irrigation surface water right greater than 10,000 ac-ft/yr through TCEQ.
The 5-year Implementation Report shall summarize the annual progress in implementing the 5-year goals in the WCP.
Submit to TCEQ by May 1, 2014, and every five years thereafter.

Water Loss Survey
Water Loss Survey, 31 TAC Chapter 358, Subchapter B, Rule 358.6
The purpose of a Water Loss Survey is to help conserve the state’s water resources by reducing water loss occurring in the systems of drinking water utilities. A Water Loss Survey is required by all retail water utilities.

Water Loss Survey
• The TWDB Water Audit Worksheet is a "top down" audit and is referred to as a "desktop" exercise using existing estimations and records.
• Data is used in TWDB loan applications and in regional water planning studies.
• Assists the utility to improve their delivery system and to reduce revenue losses.
• Due to TWDB by March 31, 2011, and every five years thereafter.

Drought Contingency Plan (DCP), 30 TAC Chapter 288, Subchapter B
All wholesale public water suppliers, retail public water suppliers serving 3,300 or more connections, and irrigation districts must submit a DCP. Retail public water suppliers serving less than 3,300 connections must prepare and adopt a DCP and make the plan available upon request.
Often times the DCP is a component of the Water Conservation Plan.
• Submit DCP to TCEQ by May 1, 2014, and every five years thereafter.• Provide a copy of DCP to Regional Planning Group.
Drought Contingency Plans

Drought Contingency Plans
The Drought Contingency (Emergency Demand Management) Plan is a strategy or combination of strategies for responding to temporary and potentially recurring water supply shortages and other supply emergencies.
• contains “triggers” to implement levels in required reductions in use of water
• may include activities that are considered normal water conservation practices

Municipal Water Use Data: Annual Water Uses Survey
• Distributed annually to over 4000 public water systems and municipal-type systems

Water Use Survey
Water Use Survey, Texas Water Code §16.012 (m)
The purpose of the Survey is to gather data to be used for long-term water supply planning.
The new online survey can be accessed here: http://www.twdb.state.tx.us/wrpi/wus/online.asp
Submit a Water Use Survey to TWDB annually.

Entities Surveyed• Municipal entities that use
ground and surface water– City owned systems (1,000)– Water districts (700)– Water supply corporations (750)– Private utilities supplying
residential, commercial, and institutional water (1,500)
• Mandatory response required by the Texas Water Code

Water Uses Survey: What Information is Collected
• Water source information: – Groundwater – Surface water – Reuse
• Purchased water• Volume of intake

Water Uses Survey: What Information is Collected
• Sales– Wholesale water sales to other systems– Sales to large industrial firms
• System information– PWS ID– Population served– Connections by category– Categorized sales volumes: SF, MF, C/I

Water Uses Survey: How the Data is Used
• Groundwater pumping volumes used by groundwater conservation districts
• Data is used in the regional water planning process
• Water demand for municipal and industrial needs are projected out 50 years at the county level

Regional Water Planning Process

Per-Person Water Use in Planning
• Reported annually for cities (>500 population)• Net Water Use
– Includes water use of residential, commercial, and institutional users
– Includes self-supplied water users inside city– No water sales to large industrial users– No retail water sales to customers outside of city limits
• Population – Texas State Data Center July estimates

Residential GPCD

HDR Service Area Boundaries Project

Accessing WUS Data
• Water Uses Survey data is available here: http://www.twdb.state.tx.us/wrpi/wus/2008est/2008wus.asp
4) Residential GPCD is the estimated water use for single family and multi-family residences, expressed on a per capita (population) basis. These estimates, based on responses to questions recently added to the annual water use survey, are being published for the first time. The pilot display of this data should be viewed in the context that, since the reporting of such data had not been historically required, different systems may categorize and report residential water use differently. A dash ( - ) indicates that the primary utility for the city did not report realistic residential volumes in the 2008 survey.
No Return - The primary water utility for this city failed to return a 2008 water use survey.

Plans, Audits,& Reports
John SuttonMunicipal Water Conservation
Tom BarnettWater Planning Research and Analysis
Industrial Water Use:

Required by TWDB or TCEQ:• Water conservation plans • Annual reports• 5-year implementation reports • Drought contingency plans• Water Use Survey
Purpose:• Water conservation is a very critical element to meeting the State's long-
term water needs • For industries, conservation programs are often economical because
they can reduce operating and production costs, met environmental needs, and play a role in positive marketing.
Conservation & Planning Reporting Requirements

Industrial Water Data:Annual Water Use Survey
Distributed each year in January to roughly 2200 industrial facilities:
- Manufacturing Facilities- Mining Operations- Steam Electric Plants

2008 Water Use Survey Estimates

Industrial Water Use Survey: What We Ask For
In addition to basic system and water source information:
1. NAICS code – North American Industrial Classification System2. Number of employees3. Sales to other facilities4. Electric power generation

Manufacturing: Sector-Level Analysis

Manufacturing: Sector-Level Analysis


Mining Water Demand
Estimates and projections for the next planning cycle will be done by the Bureau of Economic Geology at UT-Austin
Sector Share of Mining Water Use Region of Concentration
Oil & Gas 40% Barnett Shale (fracking) and Permian Basin
Aggregates 30% Distributed widely, concentrated around major metro areas
Coal 20% Lignite belt in Central and East Texas
Other (mostly sand) 10% Distributed widely


Steam Electric Water Demand
• Types of power plants in Texas– Steam Turbines– Gas Turbines– Combined Cycle– Nuclear– Hydroelectric– Alternative (wind/solar)
• Different types of plants have different water-use coefficients• Water use in this sector is dominated by cooling process and
pollution control

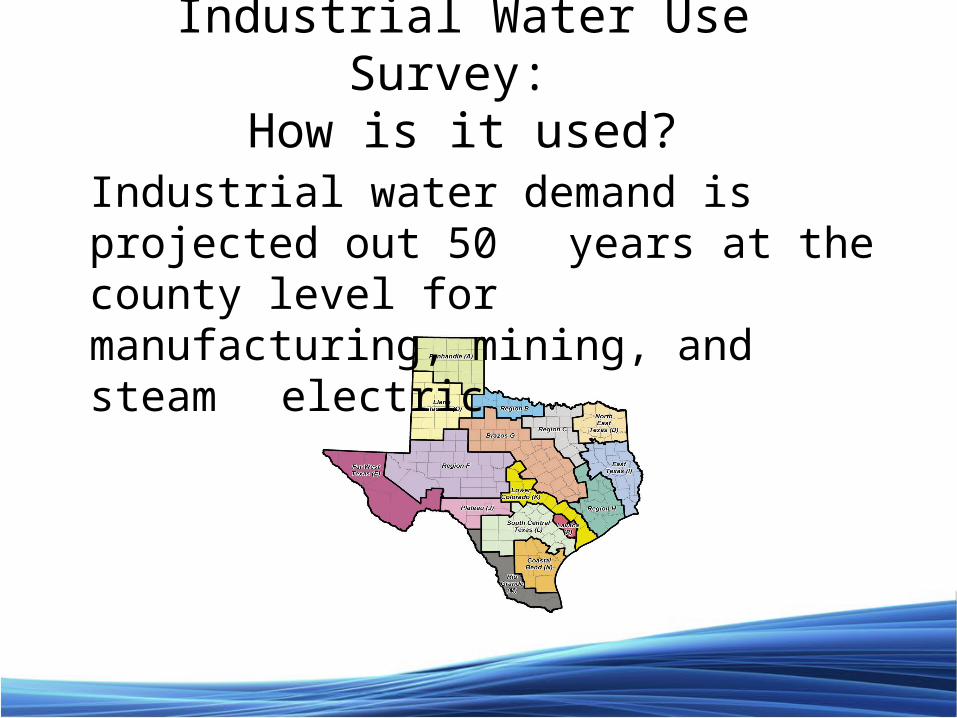
Industrial Water Use Survey: How is it used?
Industrial water demand is projected out 50 years at the county level for
manufacturing, mining, and steam electric

John Sutton
512-463-7988
Tom Barnett
512-463-4209
Cameron Turner
512-936-6090
Doug Shaw
512-463-1711
Erin McAuley
512-463-3538
Vanessa Escobar
512-463-1667