
Texas Student Data System
22
This document was supported by the Michael & Susan Dell Foundation and created by Double Line Partners, LLC. ©2010 Michael & Susan Dell Foundation. All rights reserved. Revised 09/30/2010 T exas S tudent D ata S ystem Middle School Snapshot Collection For more information about the Texas Student Data System please visit www.TexasStudentDataSystem.org All names, addresses, titles, telephone numbers, assessments, programs, student information, and all other data represented in this guide are fictitious. Any resemblance to any individuals or any organization is purely coincidental.
Transcript of Texas Student Data System
This document was supported by the Michael & Susan Dell Foundation and created by Double Line Partners, LLC.
©2010 Michael & Susan Dell Foundation. All rights reserved. Revised 09/30/2010
TexasStudentDataSystem
Middle School Snapshot CollectionFor more information about the Texas Student Data System please visit www.TexasStudentDataSystem.org
All names, addresses, titles, telephone numbers, assessments, programs, student information, and all other data represented in this guide are �ctitious. Any resemblance to any individuals or any organization is purely coincidental.
This document was supported by the Michael & Susan Dell Foundation and created by Double Line Partners, LLC.
©2010 Michael & Susan Dell Foundation. All rights reserved.
Revised 09/30/2010
TexasStudentDataSystem
Student Snapshot Collection
All names, addresses, titles, telephone numbers, assessments, programs, student information, and all other data represented in this guide are �ctitious. Any resemblance to any individuals or any organization is purely coincidental.
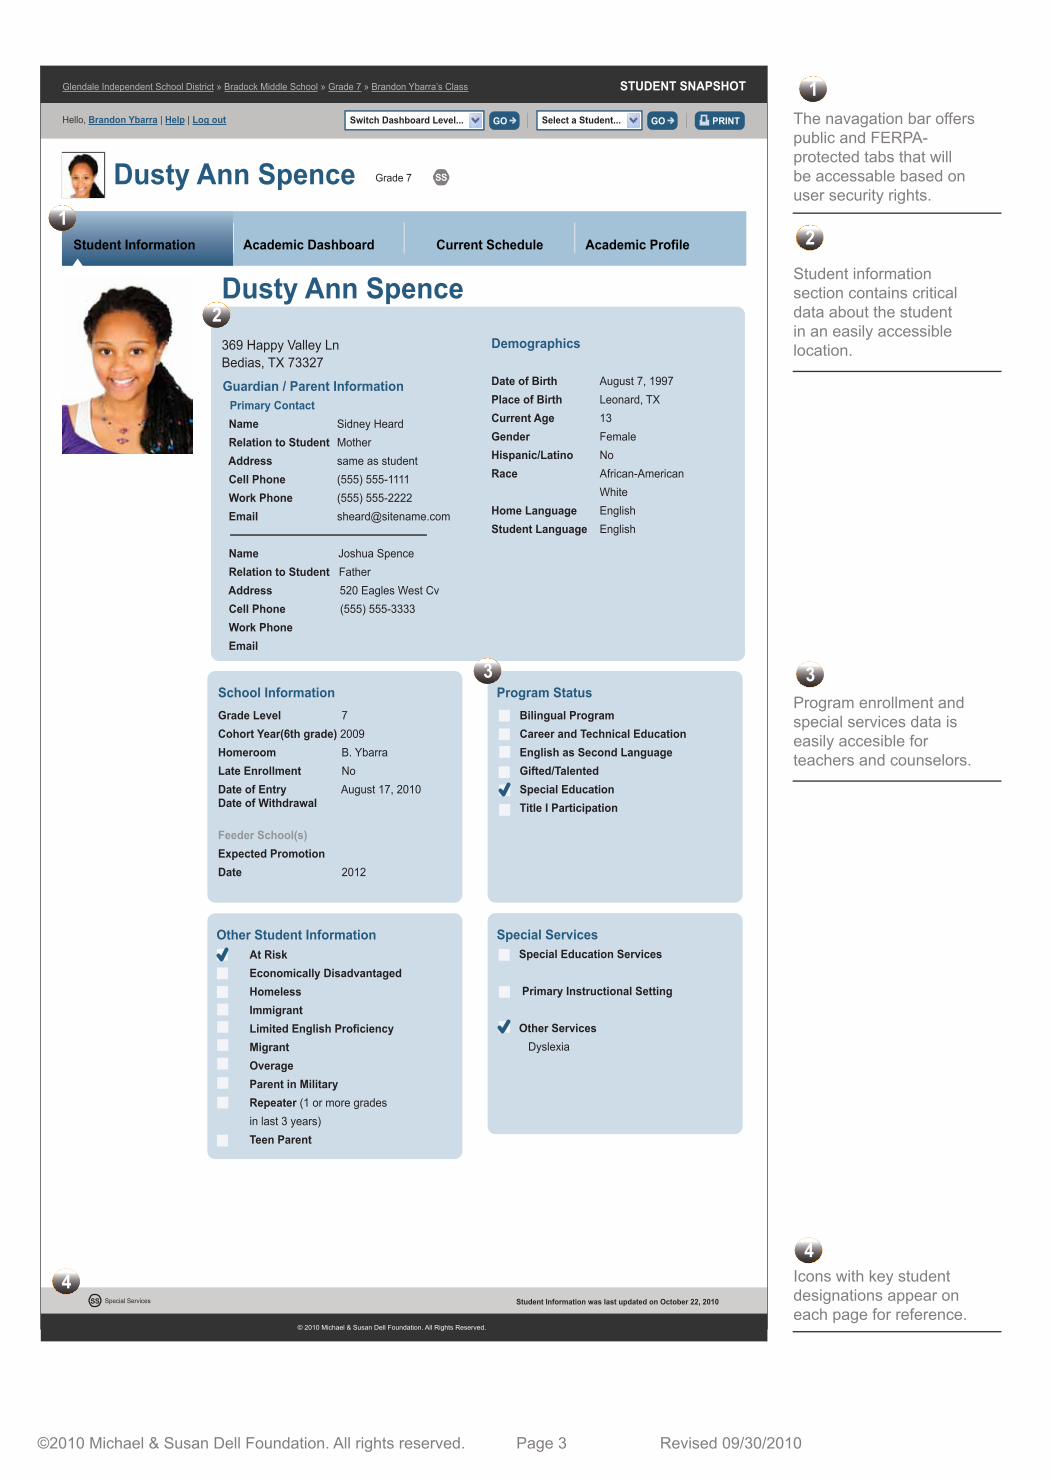
369 Happy Valley LnBedias, TX 73327
Grade Level 7Cohort Year(6th grade) 2009Homeroom B. Ybarra Late Enrollment NoDate of Entry August 17, 2010Date of Withdrawal
Feeder School(s) Expected Promotion Date 2012
Dusty Ann Spence
Guardian / Parent Information Primary Contact Name Sidney Heard Relation to Student Mother Address same as student Cell Phone (555) 555-1111 Work Phone (555) 555-2222 Email [email protected]
Name Joshua Spence Relation to Student Father Address 520 Eagles West Cv Cell Phone (555) 555-3333 Work Phone Email
Demographics
Date of Birth August 7, 1997 Place of Birth Leonard, TXCurrent Age 13Gender FemaleHispanic/Latino NoRace African-American WhiteHome Language EnglishStudent Language English
School Information
Other Student InformationAt RiskEconomically DisadvantagedHomelessImmigrantLimited English ProficiencyMigrantOverageParent in MilitaryRepeater (1 or more grades in last 3 years) Teen Parent
Dusty Ann Spence
STUDENT SNAPSHOT
Hello, Brandon Ybarra | Help | Log out
Student Information Current Schedule Academic ProfileAcademic Dashboard
Glendale Independent School District » Bradock Middle School » Grade 7 » Brandon Ybarra’s Class
Switch Dashboard Level... GO Select a Student... GO PRINT
Grade 7
Special Services Special Education Services
Primary Instructional Setting Other Services Dyslexia
SS
© 2010 Double Line Partners LLC. All Rights Reserved© 2010 Michael & Susan Dell Foundation. All Rights Reserved.
Special ServicesSS Student Information was last updated on October 22, 2010
Bilingual ProgramCareer and Technical EducationEnglish as Second LanguageGifted/TalentedSpecial EducationTitle I Participation
Program Status
©2010 Michael & Susan Dell Foundation. All rights reserved. Page 3 Revised 09/30/2010
The navagation bar offerspublic and FERPA- protected tabs that willbe accessable based onuser security rights.
Student informationsection contains criticaldata about the studentin an easily accessiblelocation.
1
21
2
Program enrollment andspecial services data iseasily accesible forteachers and counselors.
33
Icons with key student designations appear oneach page for reference.
44
SUMMARY STATUS
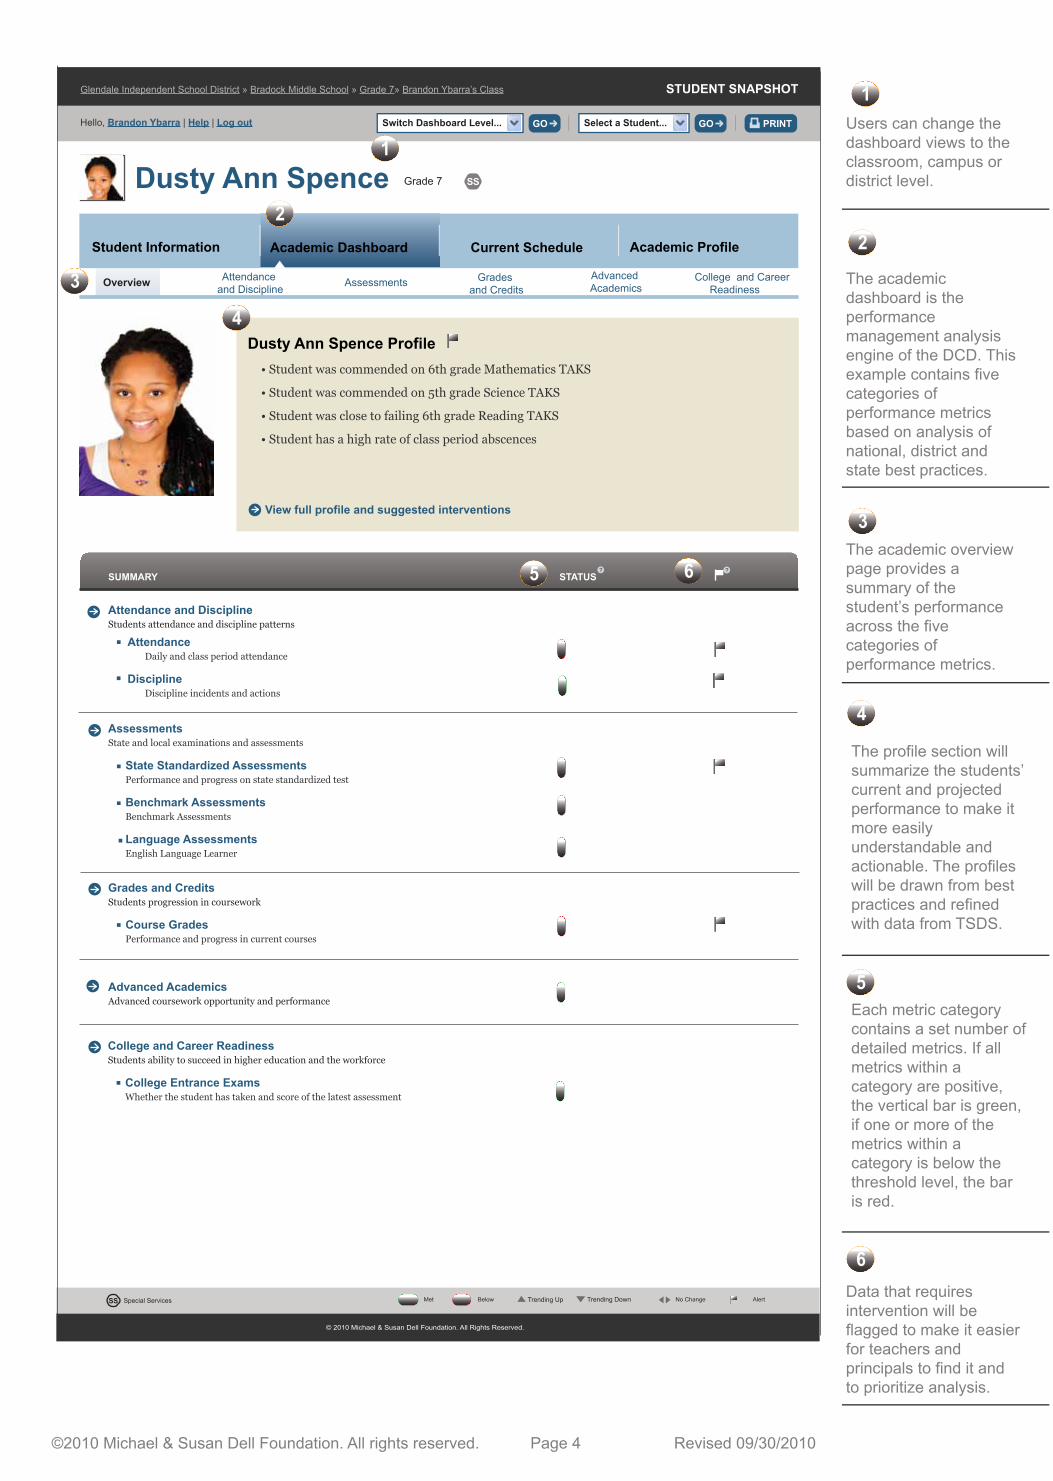
Dusty Ann Spence Profile
View full profile and suggested interventions
• Student was commended on 6th grade Mathematics TAKS
• Student was commended on 5th grade Science TAKS
• Student was close to failing 6th grade Reading TAKS
• Student has a high rate of class period abscences
?
Dusty Ann Spence Grade 7
STUDENT SNAPSHOT
Hello, Brandon Ybarra | Help | Log out
Student Information Academic Profile
Glendale Independent School District » Bradock Middle School » Grade 7» Brandon Ybarra’s Class
Switch Dashboard Level... GO Select a Student... GO PRINT
Attendance Daily and class period attendance
Discipline Discipline incidents and actions
Attendance and DisciplineOverview Advanced
AcademicsAssessments
Current ScheduleAcademic Dashboard
College and Career Readiness
Grades and Credits
Attendance and DisciplineStudents attendance and discipline patterns
AssessmentsState and local examinations and assessments
State Standardized Assessments Performance and progress on state standardized test
Benchmark Assessments Benchmark Assessments
Language Assessments English Language Learner
Grades and CreditsStudents progression in coursework
Course Grades Performance and progress in current courses
Advanced AcademicsAdvanced coursework opportunity and performance
College and Career ReadinessStudents ability to succeed in higher education and the workforce
College Entrance Exams Whether the student has taken and score of the latest assessment
?
SS
© 2010 Michael & Susan Dell Foundation. All Rights Reserved.
Met Below AlertNo ChangeSpecial ServicesSS Trending Up Trending Down
©2010 Michael & Susan Dell Foundation. All rights reserved. Page 4 Revised 09/30/2010
Users can change thedashboard views to theclassroom, campus ordistrict level.
The academicdashboard is theperformancemanagement analysisengine of the DCD. Thisexample contains fivecategories ofperformance metricsbased on analysis ofnational, district andstate best practices.
The academic overviewpage provides asummary of thestudent’s performanceacross the fivecategories ofperformance metrics.
The profile section willsummarize the students’current and projectedperformance to make itmore easilyunderstandable andactionable. The profileswill be drawn from bestpractices and refinedwith data from TSDS.
Each metric categorycontains a set number ofdetailed metrics. If allmetrics within acategory are positive,the vertical bar is green,if one or more of themetrics within acategory is below thethreshold level, the baris red.
Data that requiresintervention will beflagged to make it easierfor teachers andprincipals to find it andto prioritize analysis.
1
2
3
4
5
6
1
2
3
4
5 6
Dusty Ann Spence
Student Information Current Schedule Academic HistoryAcademic Dashboard
Daily Attendance Rate (Through October 22, 2010) % of days student is in attendance
Last Four Weeks
Last Eight Weeks
Year to Date
Discipline Referrals (Through October 22, 2010) Log of discipline incidents and actions year to date
95%
98%
98%
ATTENDANCE AND DISCIPLINE
More ...
More ...
ATTENDANCE STATUS VALUE TREND DETAILS
Class Period Absence Rate (Through October 22, 2010) % of class periods missed
Last Four Weeks
Last Eight Weeks
Year to Date
11%
6%
7%
16
16
21
More ...
Grade 7
Student Information Academic Profile
STUDENT SNAPSHOT
Hello, Brandon Ybarra | Help | Log out
Glendale Independent School District » Bradock Middle School » Grade 7» Brandon Ybarra’s Class
Switch Dashboard Level... GO Select a Student... GO PRINT
Disciplinary Incidents (Excluding School Code of Conduct) 2
School Code of Conduct OK 1
HIGH
1
1
1
OverviewAttendance
and DisciplineAdvancedAcademics
Assessments
Current ScheduleAcademic Dashboard
College and Career Readiness
Grades and Credits
DISCIPLINE
LEGEND
More ...
More ...
More ...
More ...
More ...
? ? ? ? ?
STATUS VALUE TREND DETAILS? ? ? ? ?
SS
© 2010 Michael & Susan Dell Foundation. All Rights Reserved.
Met Below AlertNo ChangeSpecial ServicesSS Trending Up Trending Down
Tardy Rate (Through October 22, 2010) % of tardies in a given period
Last Four Weeks
Last Eight Weeks
Year to Date
11%
6%
7%
16
16
21
More ...
More ...
More ...
©2010 Michael & Susan Dell Foundation. All rights reserved. Page 5 Revised 09/30/2010
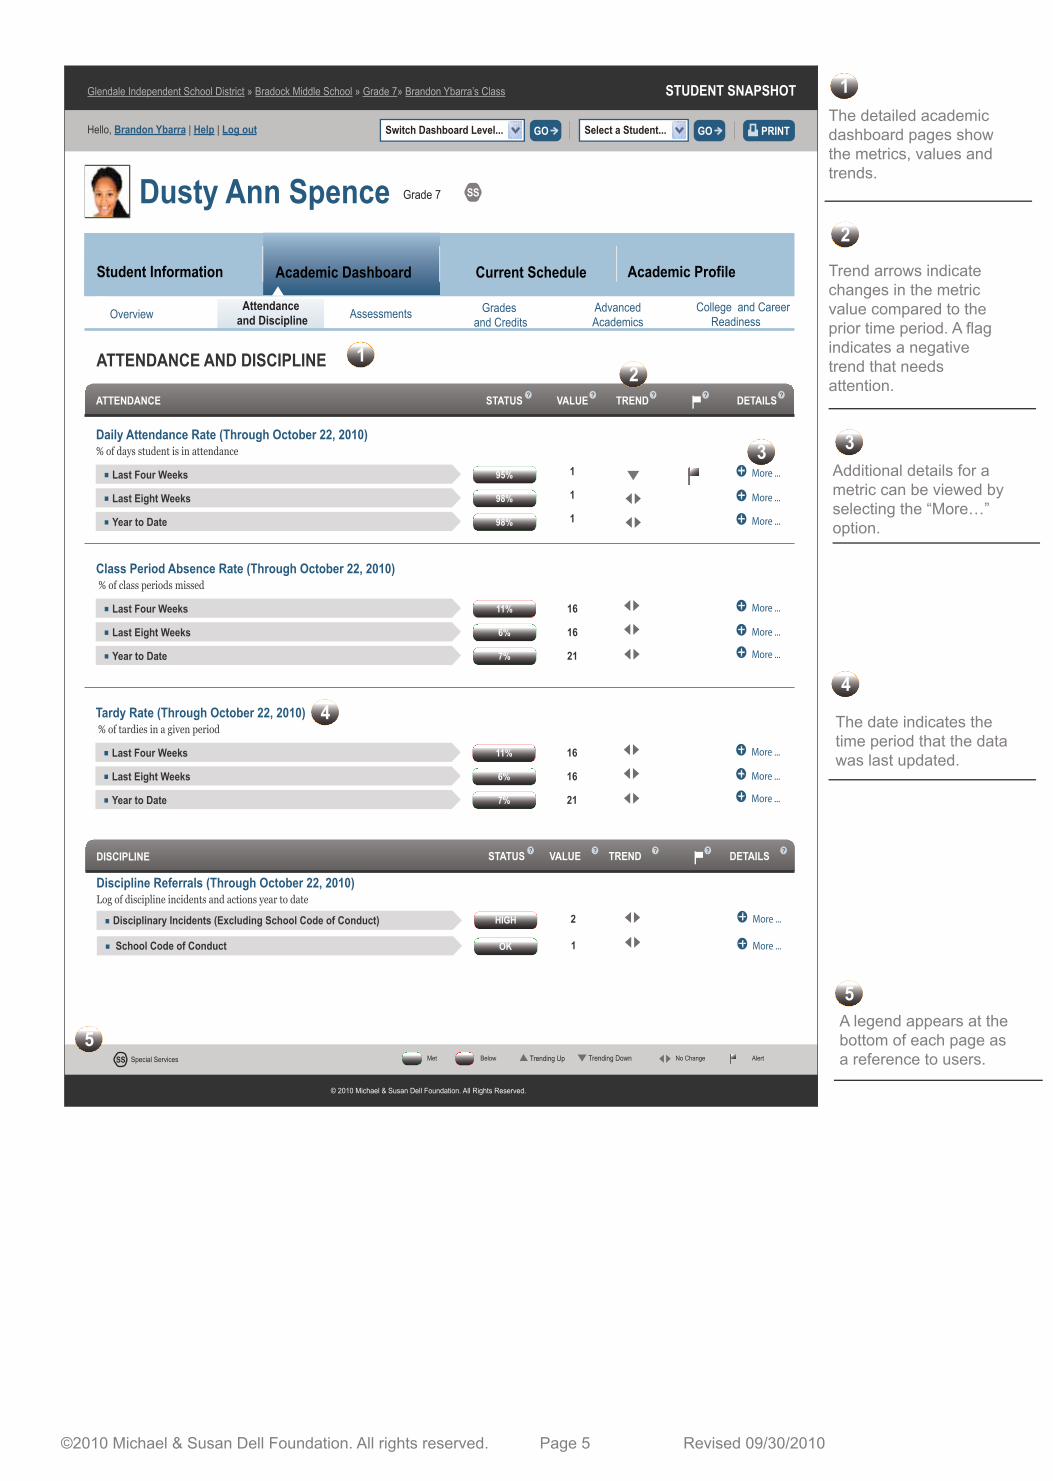
The detailed academicdashboard pages showthe metrics, values andtrends.
Trend arrows indicatechanges in the metricvalue compared to theprior time period. A flagindicates a negativetrend that needsattention.
Additional details for ametric can be viewed byselecting the “More…”option.
The date indicates thetime period that the datawas last updated.
A legend appears at thebottom of each page asa reference to users.
1
2
3
4
5
12
3
4
5
Dusty Ann Spence Grade 7
STUDENT SNAPSHOT
Hello, Brandon Ybarra | Help | Log out
Student Information Academic Profile
Glendale Independent School District » Bradock Middle School » Grade 7 » Brandon Ybarra’s Class
Switch Dashboard Level... GO Select a Student... GO PRINT
MET
Attendance and Discipline
Overview AdvancedAcademics
ASSESSMENTS
STATE STANDARDIZED ASSESSMENTS
TAKS - MTest scores and whether met standard
TAKS - AltTest scores and whether met standard
TAKS PerformanceTest scores and whether met standard
Assessments
Current ScheduleAcademic Dashboard
College and Career Readiness
Grades and Credits
2105
2110
2405
2415
More ...
More ...
More ...
More ...
STATUS VALUE TREND DETAILS? ? ? ? ?
More ...
SS
Texas Projection Measure (TPM)# of subjects projected to meet TAKS standard at Grade 8/total subjects
More ...
AT GOAL 2105
2405 ELA / Reading
Math
Science
Social Studies
More ...
More ...
More ...
More ...
AT GOAL
© 2010 Michael & Susan Dell Foundation. All Rights Reserved.
Met Below AlertNo ChangeSpecial ServicesSS Trending Up Trending Down
Benchmark Assessment MasteryMastery of content in core courses
BENCHMARK ASSESSMENTS STATUS TREND DETAILSVALUE
LANGUAGE ASSESMENTS STATUS TREND DETAILSVALUE
English Language LearnerTest scores and level
TELPAS (2009) More ...
? ? ? ?
? ? ? ? ?
?
MET
BELOW
ELA / Reading (BOY 2010)
Math (BOY 2010)
Science (EOY 2010)
Social Studies (EOY 2010)
70%
More ...
More ...
More ...
More ...METMore ...
More ...
ELA / Reading (2010 6th Grade TAKS)
Writing (2008 4th Grade TAKS)
Math (2010 6th Grade TAKS)
Science (2009 5th Grade TAKS)
Social Studies
90%
85%
68%
MET
N/A
MET
COMMENDED
COMMENDED
©2010 Michael & Susan Dell Foundation. All rights reserved. Page 6 Revised 09/30/2010
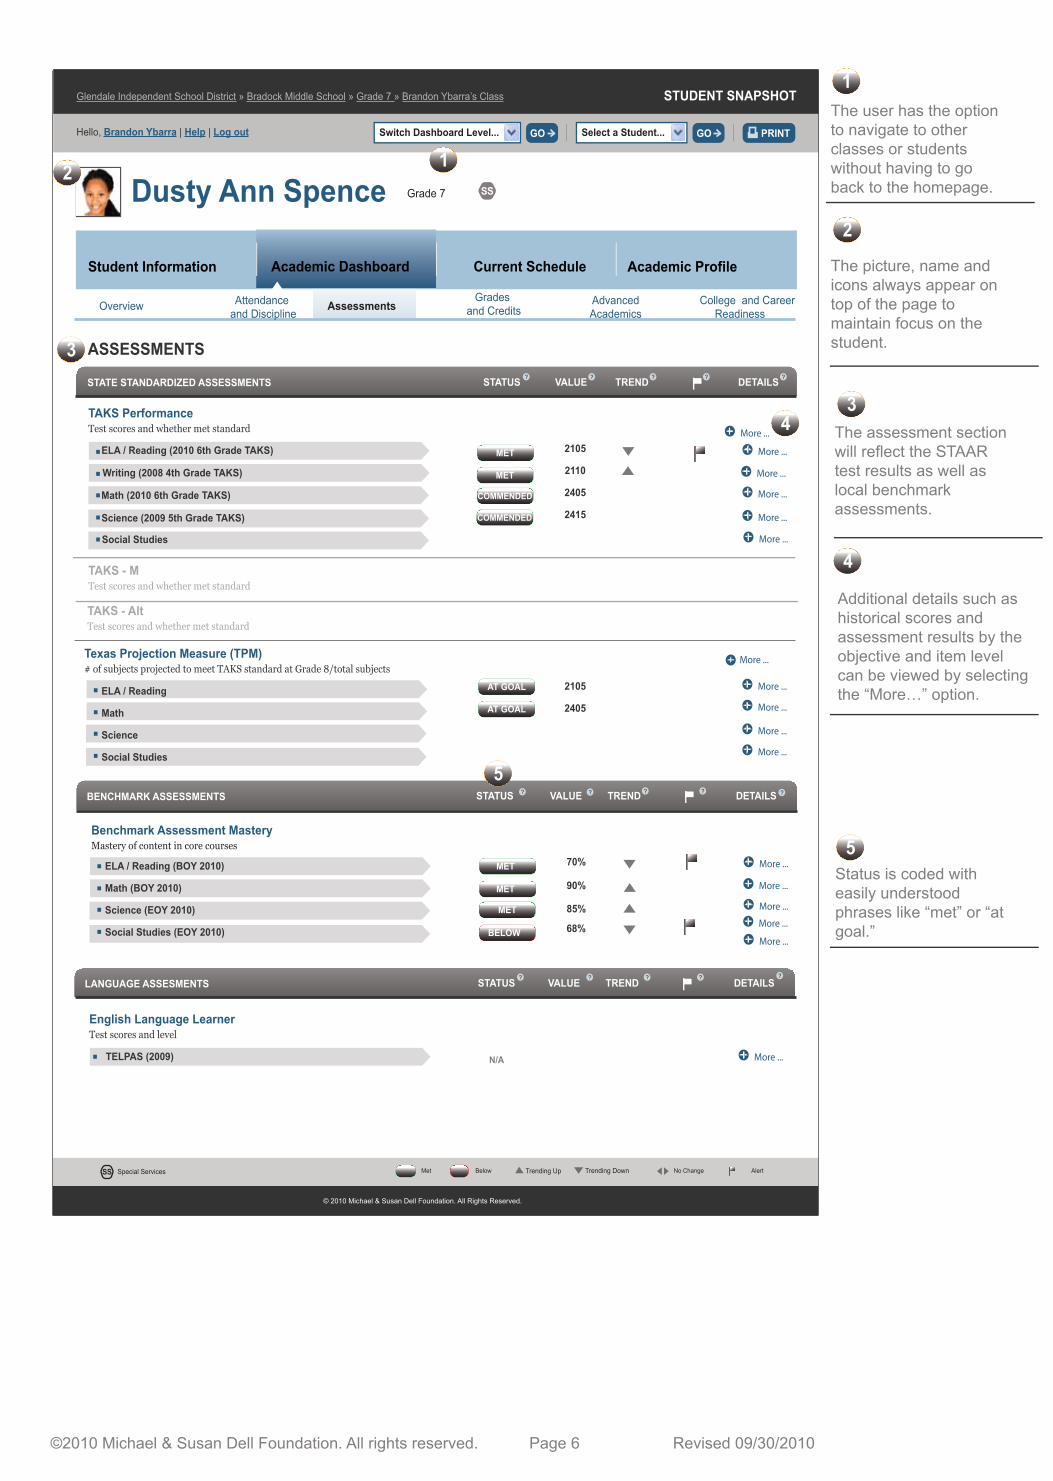
The user has the optionto navigate to otherclasses or studentswithout having to goback to the homepage.
The picture, name andicons always appear ontop of the page tomaintain focus on thestudent.
The assessment sectionwill reflect the STAARtest results as well aslocal benchmarkassessments.
Additional details such as historical scores and assessment results by theobjective and item levelcan be viewed by selecting the “More…” option.
Status is coded witheasily understoodphrases like “met” or “atgoal.”
1
2
3
4
5
12
3
4
5
Grades Below 70% Level (Through Third Grading Period)Number of classes with grades below 70%for the last grading period ON TRACK
Algebra I (Through Third Grading Period)Whether student has taken; score of latest assessment
Taken or enrolled by 8th grade
Passing or has passed by 8th grade
1 below 70%
1/7
1/7
More ...
More ...
COURSE GRADES
More ...
Class Grades (Through Third Grading Period)Mastery of content in core courses
Failing
# course grades dropping 10% or more
# courses repeating
Dusty Ann Spence Grade 7
STUDENT SNAPSHOT
Hello, Brandon Ybarra | Help | Log out
Student Information Academic History
Glendale Independent School District » Bradock Middle School » Grade 7 » Brandon Ybarra’s Class
Switch Dashboard Level... GO Select a Student... GO PRINT
Attendance and DisciplineOverview Advanced
Academics
Grades and Credits
Assessments
Current ScheduleAcademic Dashboard
College and Career Readiness
Grades and Credits
STATUS VALUE TREND DETAILS? ? ? ? ?
More ...
SS
© 2010 Michael & Susan Dell Foundation. All Rights Reserved.
Met Below AlertNo ChangeSpecial ServicesSS Trending Up Trending Down
YES
YES
NO
Pre Algebra (Through Third Grading Period)Whether student has taken; score of latest assessment
Taken or enrolled by 7th grade
Passing or has passed by 7th grade
YES
90
More ...
More ...YES
N/A
N/A
0/7
©2010 Michael & Susan Dell Foundation. All rights reserved. Page 7 Revised 09/30/2010
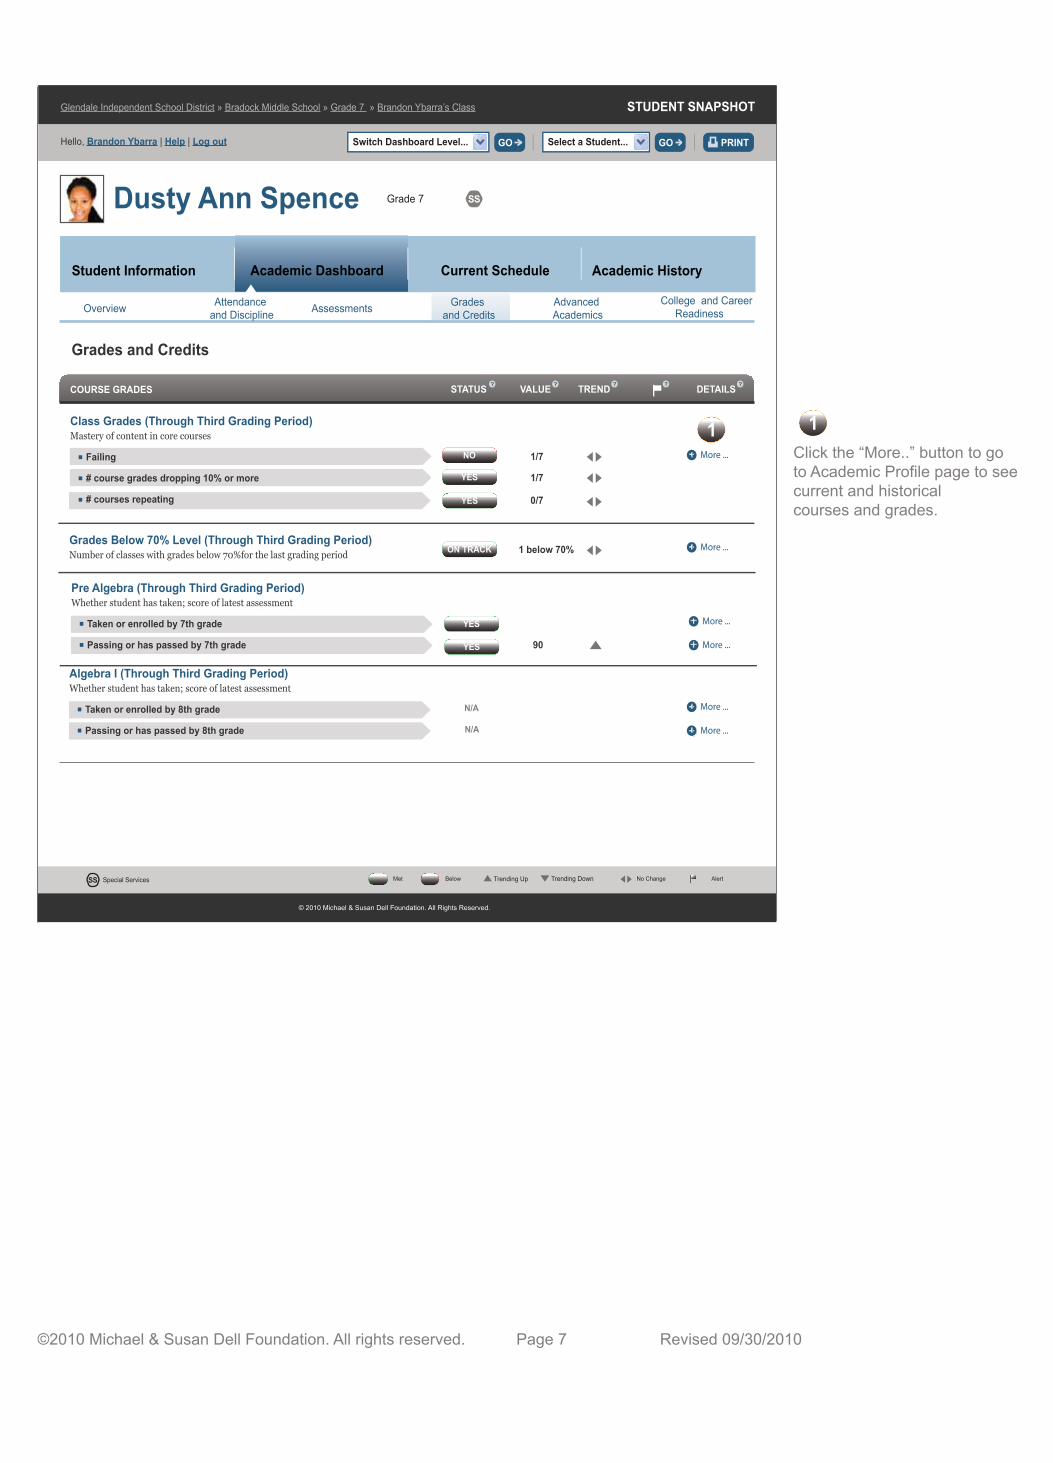
Click the “More..” button to go to Academic Profile page to see current and historicalcourses and grades.
11
?
Advanced Course Potential (Through April 2010)Achieving success on tests (eligible) vs number of current pre-AP/advanced courses
ELA/Reading YES
ADVANCED ACADEMICS
ADVANCED COURSE POTENTIAL PSAT 80+ PERCENTILE
TAKS COMMENDED ENROLLED
STUDENT SNAPSHOT
Hello, Brandon Ybarra | Help | Log out
Student Information Academic Profile
Glendale Independent School District » Bradock Middle School » Grade 7 » Brandon Ybarra’s Class
Switch Dashboard Level... GO Select a Student... GO PRINT
Dusty Ann Spence Grade 7
Mathematics NO
Science
Social Studies
Advanced Course Enrollment, Completion and MasteryAchieving success through enrollment, completion and mastery of last year’s pre-AP/advanced courses
ELA/Reading
ADVANCED COURSE ENROLLMENT, COMPLETION AND MASTERY ENROLLED COMPLETION MASTERY
Mathematics
Science
Social Studies
NO
YES
NO
NO
YES
NO
NO
N/A N/A N/A
Attendance and DisciplineOverview
Advanced AcademicsAssessments
Current ScheduleAcademic Dashboard
College and Career Readiness
Grades and Credits
More ...
More ...
More ...
More ...
DETAILS
More ...
More ...
More ...
More ...
DETAILS
? ? ? ?
? ?? ?
YES
NO
NO
YES
NO
NO
YES
NO
NO
N/A N/A N/A
SS
© 2010 Michael & Susan Dell Foundation. All Rights Reserved.
Met Below AlertNo ChangeSpecial ServicesSS Trending Up Trending Down
©2010 Michael & Susan Dell Foundation. All rights reserved. Page 8 Revised 09/30/2010
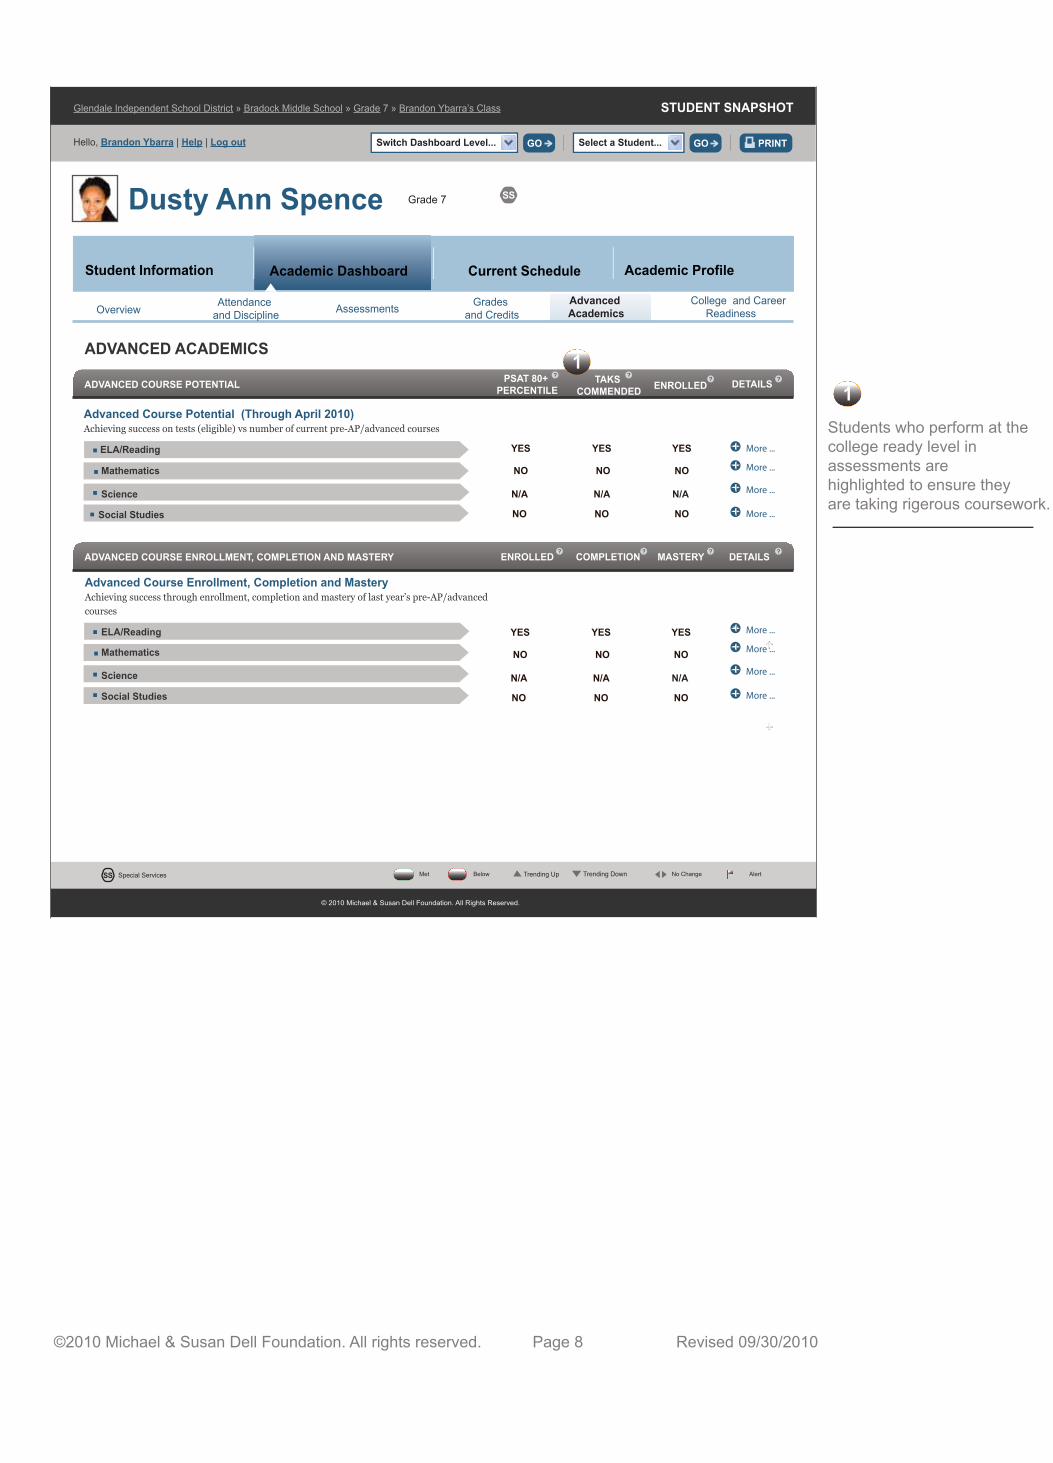
Students who perform at the college ready level in assessments are highlighted to ensure theyare taking rigerous coursework.
11
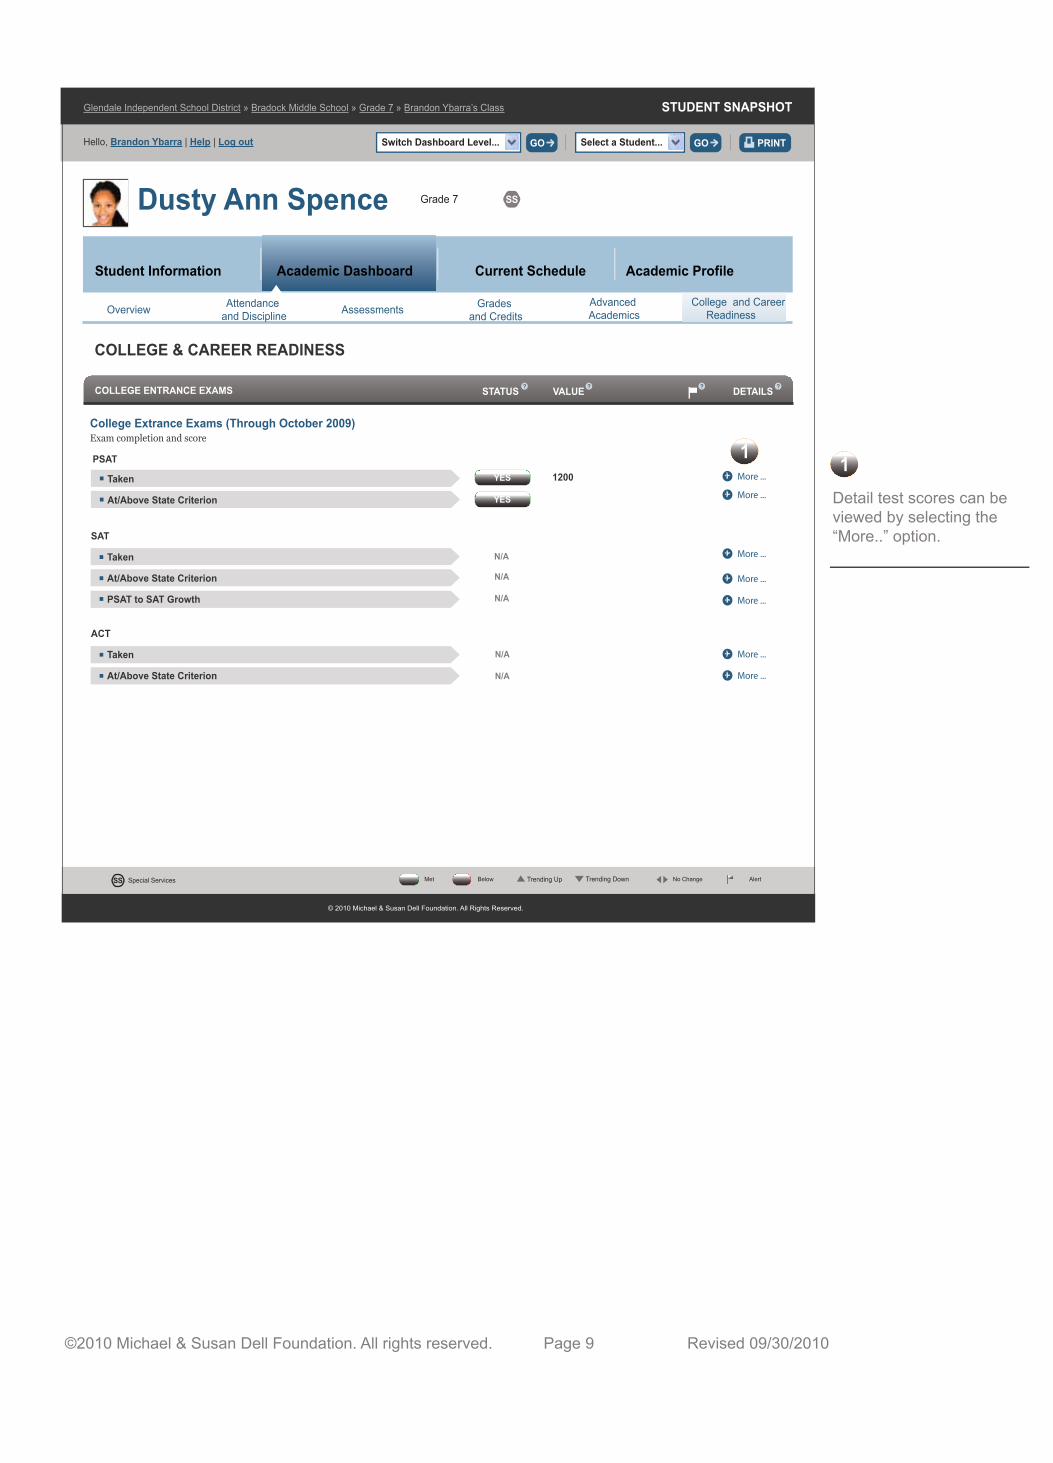
COLLEGE & CAREER READINESS
YES
YES
College Extrance Exams (Through October 2009)Exam completion and score
PSAT
N/A
N/A
More ...
SAT
Taken
At/Above State Criterion
PSAT to SAT Growth
ACT
Taken
At/Above State Criterion
More ...
More ...
STUDENT SNAPSHOT
Hello, Brandon Ybarra | Help | Log out
Student Information Academic Profile
Glendale Independent School District » Bradock Middle School » Grade 7 » Brandon Ybarra’s Class
Switch Dashboard Level... GO Select a Student... GO PRINT
Dusty Ann Spence
N/A
N/A
Taken
At/Above State Criterion
More ...
Grade 7
Attendance and DisciplineOverview
Advanced AcademicsAssessments
COLLEGE ENTRANCE EXAMS
Current ScheduleAcademic Dashboard
College and Career Readiness
Grades and Credits
COLLEGE READINESS INDICATORS
More ...
More ...
More ...
STATUS VALUE DETAILS? ? ?
DETAILS
1200
SS
© 2010 Michael & Susan Dell Foundation. All Rights Reserved.
Met Below AlertNo ChangeSpecial ServicesSS Trending Up Trending Down
?
N/A
©2010 Michael & Susan Dell Foundation. All rights reserved. Page 9 Revised 09/30/2010
Detail test scores can be viewed by selecting the “More..” option.
11

This document was supported by the Michael & Susan Dell Foundation and created by Double Line Partners, LLC.
©2010 Michael & Susan Dell Foundation. All rights reserved.
Revised 09/30/2010
TexasStudentDataSystem
Classroom Snapshot Collection
All names, addresses, titles, telephone numbers, assessments, programs, student information, and all other data represented in this guide are �ctitious. Any resemblance to any individuals or any organization is purely coincidental.
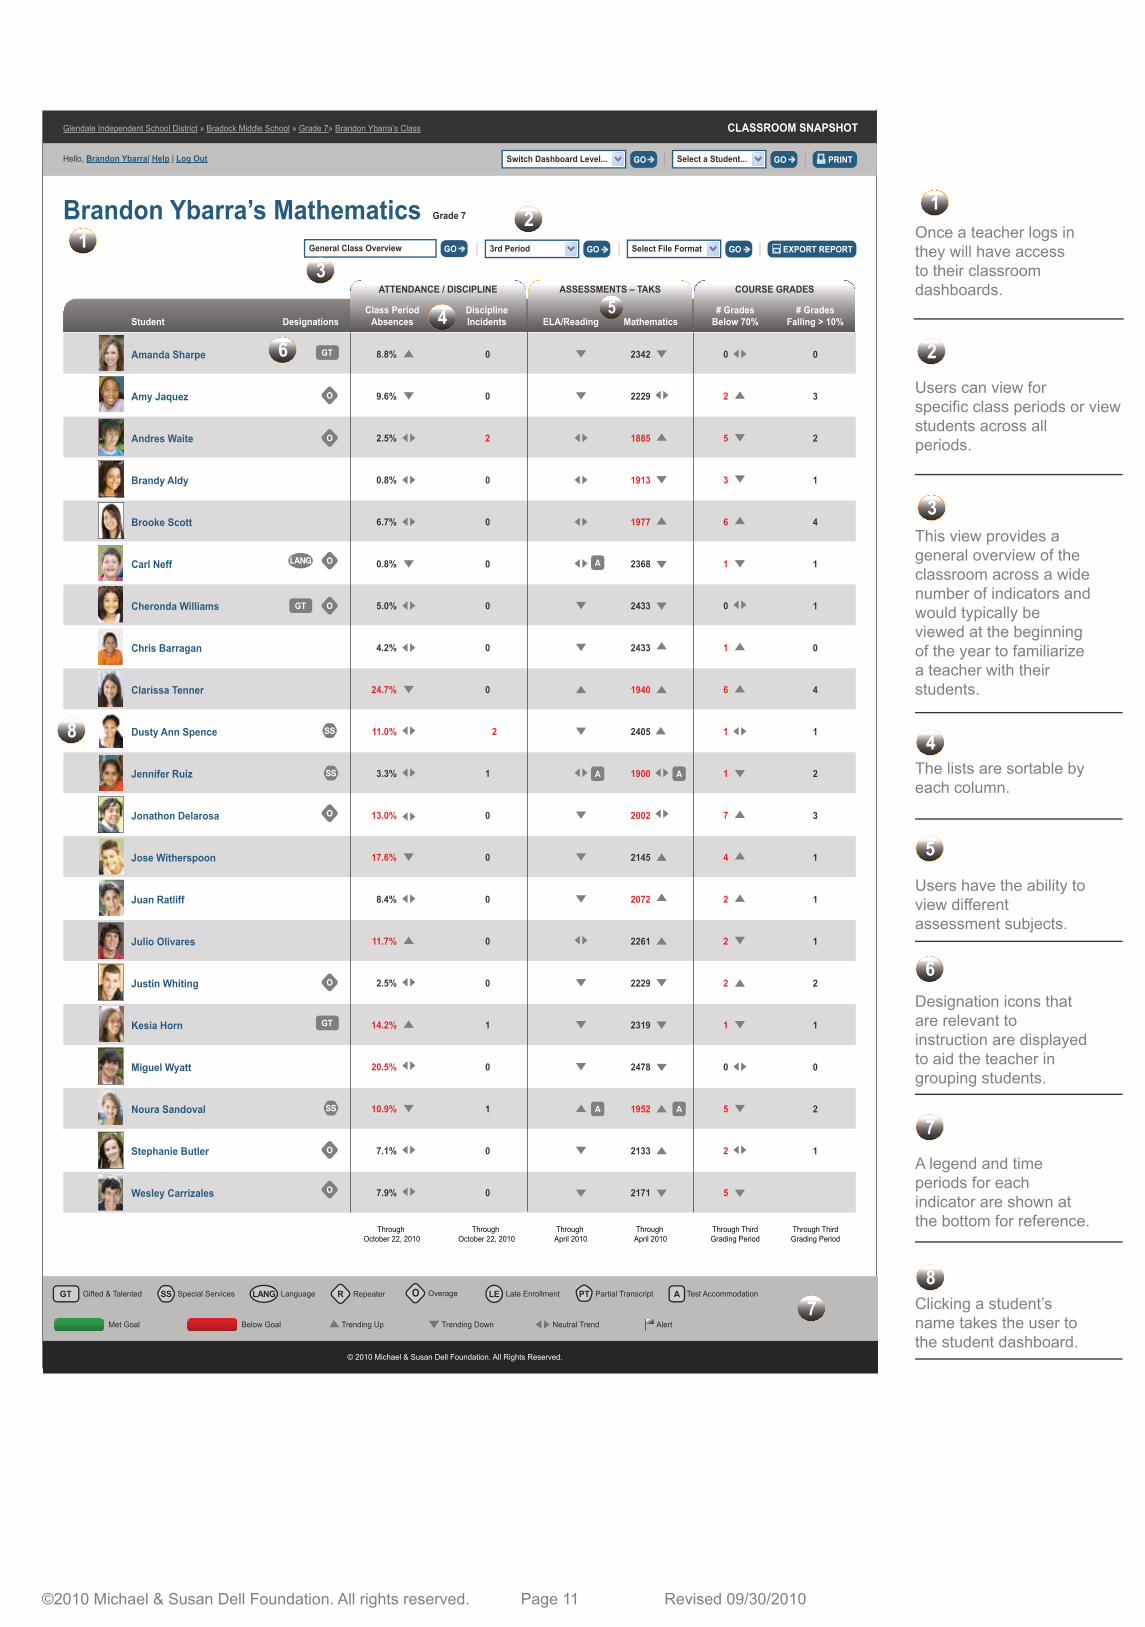
Once a teacher logs in they will have access to their classroomdashboards.
Users can view forspecific class periods or viewstudents across allperiods.
This view provides ageneral overview of theclassroom across a widenumber of indicators andwould typically beviewed at the beginningof the year to familiarizea teacher with theirstudents.
The lists are sortable byeach column.
Users have the ability toview differentassessment subjects.
Designation icons thatare relevant toinstruction are displayedto aid the teacher ingrouping students.
A legend and timeperiods for eachindicator are shown atthe bottom for reference.
Clicking a student’sname takes the user tothe student dashboard.
©2010 Michael & Susan Dell Foundation. All rights reserved. Page 11 Revised 09/30/2010
1
2
3
4
5
6
7
8
Student
0
0
2
0
0
0
0
0
0
2
1
0
0
0
0
0
1
0
1
0
0
2342
2229
1885
1913
1977
2368
2433
2433
1940
2405
1900
2002
2145
2072
2261
2229
2319
2478
1952
2133
2171
0
3
2
1
4
1
1
0
4
1
2
3
1
1
1
2
1
0
2
1
0
2
5
3
6
1
0
1
6
1
1
7
4
2
2
2
1
0
5
2
5
ATTENDANCE / DISCIPLINE
Class PeriodAbsences
DisciplineIncidents
ASSESSMENTS – TAKS COURSE GRADES
MathematicsDesignations# Grades
Below 70%# Grades
Falling > 10%ELA/Reading
8.8%
9.6%
2.5%
0.8%
6.7%
0.8%
5.0%
4.2%
24.7%
11.0%
3.3%
13.0%
17.6%
8.4%
11.7%
2.5%
14.2%
20.5%
10.9%
7.1%
7.9%
Amanda Sharpe
Amy Jaquez
Andres Waite
Brandy Aldy
Brooke Scott
Carl Neff
Cheronda Williams
Chris Barragan
Clarissa Tenner
Dusty Ann Spence
Jennifer Ruiz
Jonathon Delarosa
Jose Witherspoon
Juan Ratliff
Julio Olivares
Justin Whiting
Kesia Horn
Miguel Wyatt
Noura Sandoval
Stephanie Butler
Wesley Carrizales
© 2010 Michael & Susan Dell Foundation. All Rights Reserved.
LanguageSpecial Services Late Enrollment Partial TranscriptGifted & Talented Test AccommodationRepeater OverageO
Trending Up Trending Down Neutral TrendMet Goal Below Goal Alert
General Class Overview GO
Brandon Ybarra’s Mathematics Grade 7
CLASSROOM SNAPSHOT
Hello, Brandon Ybarra| Help | Log Out
Glendale Independent School District » Bradock Middle School » Grade 7» Brandon Ybarra’s Class
Switch Dashboard Level... GO Select a Student... GO PRINT
Select File Format GO3rd Period GO EXPORT REPORT
Through October 22, 2010
Through April 2010
Through April 2010
Through ThirdGrading Period
Through ThirdGrading Period
Through October 22, 2010
12
3
4 5
6
7
8
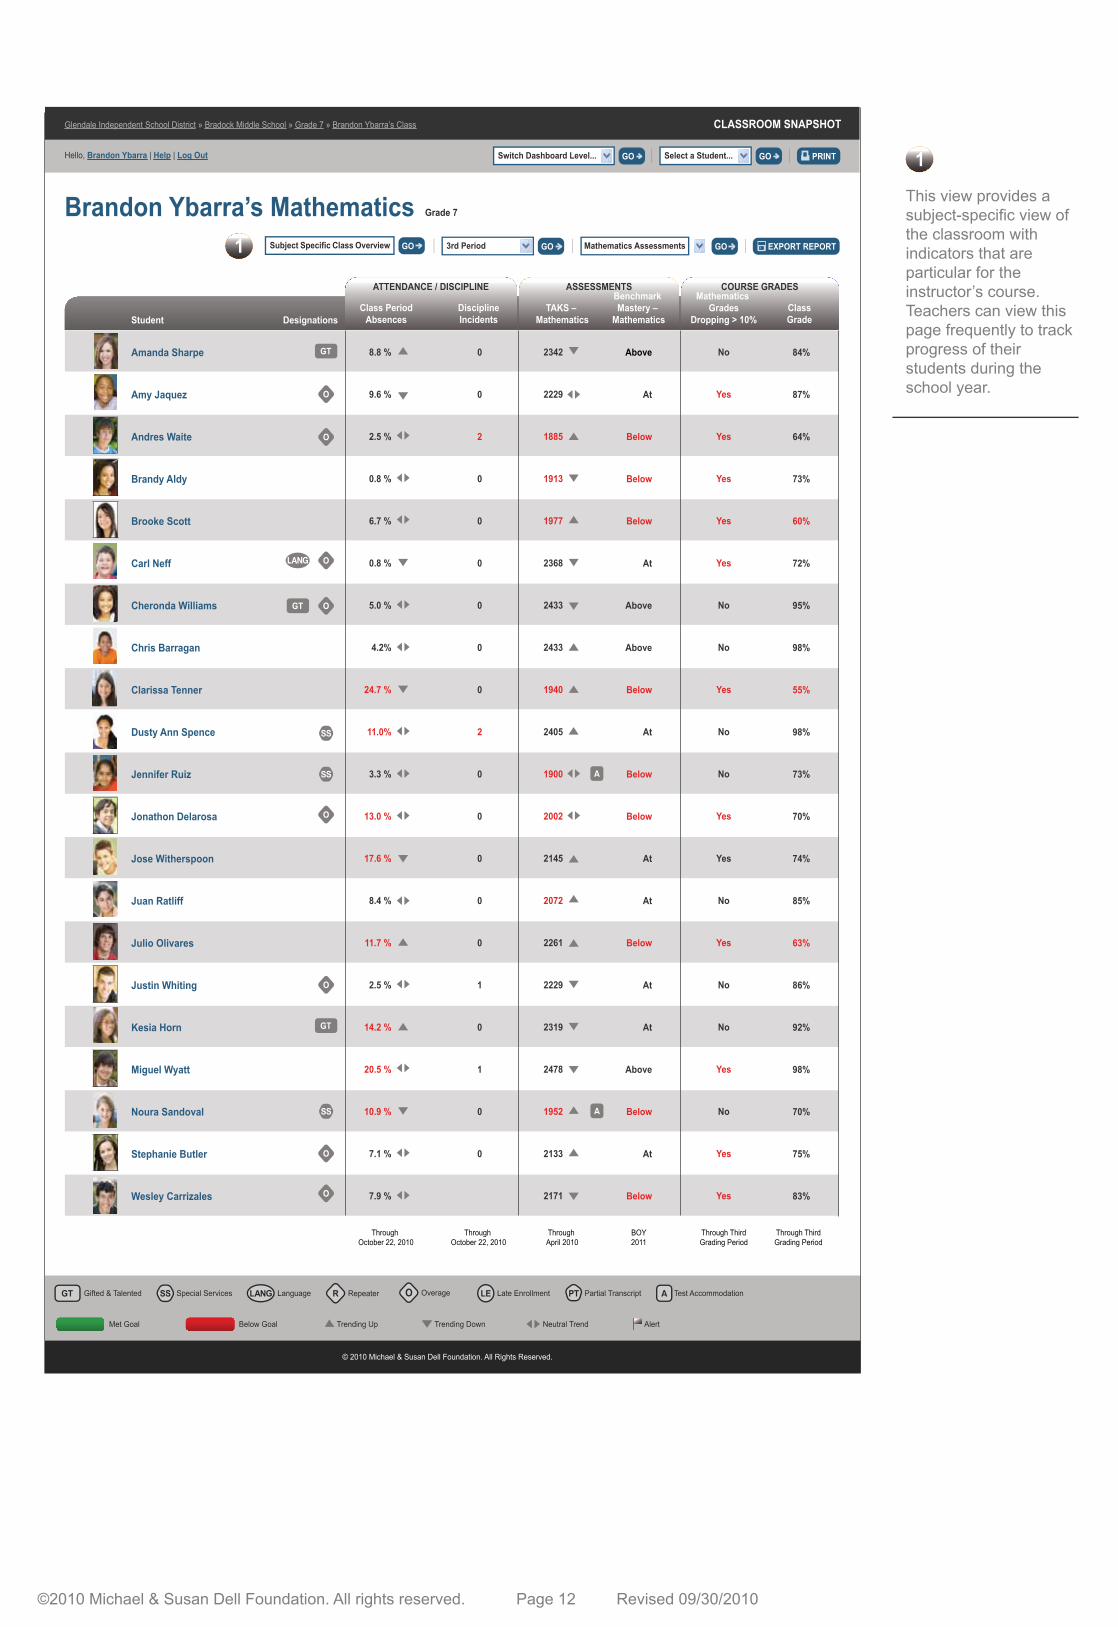
This view provides asubject-specific view ofthe classroom withindicators that areparticular for theinstructor’s course.Teachers can view thispage frequently to trackprogress of theirstudents during theschool year.
©2010 Michael & Susan Dell Foundation. All rights reserved. Page 12 Revised 09/30/2010
Amanda Sharpe
Amy Jaquez
Andres Waite
Brandy Aldy
Brooke Scott
Carl Neff
Cheronda Williams
Chris Barragan
Clarissa Tenner
Dusty Ann Spence
Jennifer Ruiz
Jonathon Delarosa
Jose Witherspoon
Juan Ratliff
Julio Olivares
Justin Whiting
Kesia Horn
Miguel Wyatt
Noura Sandoval
Stephanie Butler
Wesley Carrizales
2342
2229
1885
1913
1977
2368
2433
2433
1940
2405
1900
2002
2145
2072
2261
2229
2319
2478
1952
2133
2171
8.8 %
9.6 %
2.5 %
0.8 %
6.7 %
0.8 %
5.0 %
4.2%
24.7 %
11.0%
3.3 %
13.0 %
17.6 %
8.4 %
11.7 %
2.5 %
14.2 %
20.5 %
10.9 %
7.1 %
7.9 %
0
0
2
0
0
0
0
0
0
2
0
0
0
0
0
1
0
1
0
0
Above
At
Below
Below
Below
At
Above
Above
Below
At
Below
Below
At
At
Below
At
At
Above
Below
At
Below
84%
87%
64%
73%
60%
72%
95%
98%
55%
98%
73%
70%
74%
85%
63%
86%
92%
98%
70%
75%
83%
No
Yes
Yes
Yes
Yes
Yes
No
No
Yes
No
No
Yes
Yes
No
Yes
No
No
Yes
No
Yes
Yes
Through October 22, 2010
Through April 2010
BOY2011
Through ThirdGrading Period
Through ThirdGrading Period
Through October 22, 2010
© 2010 Michael & Susan Dell Foundation. All Rights Reserved.
LanguageSpecial Services Late Enrollment Partial TranscriptGifted & Talented Test AccommodationRepeater Overage
Trending Up Trending Down Neutral TrendMet Goal Below Goal Alert
Subject Specific Class Overview GO
Brandon Ybarra’s Mathematics Grade 7
CLASSROOM SNAPSHOT
Hello, Brandon Ybarra | Help | Log Out
Glendale Independent School District » Bradock Middle School » Grade 7 » Brandon Ybarra’s Class
Switch Dashboard Level... GO Select a Student... GO PRINT
Mathematics Assessments GO3rd Period GO EXPORT REPORT
ATTENDANCE / DISCIPLINE
Class PeriodAbsences
DisciplineIncidents
ASSESSMENTS COURSE GRADESBenchmark Mastery –
MathematicsTAKS –
Mathematics
Mathematics Grades
Dropping > 10%ClassGradeStudent Designations
O
1
1
Through April 2010
<70% Correct70% to 99% Correct100% Correct
© 2010 Michael & Susan Dell Foundation. All Rights Reserved.
LanguageSpecial Services Late Enrollment Partial TranscriptGifted & Talented Test AccommodationRepeater Overage
Trending Up Trending Down Neutral TrendMet Goal Below Goal Alert
Andres Waite 1885
Juan Ratliff 2072
Amanda Sharpe 2342
Amy Jaquez 2229
Brandy Aldy 1913
Brooke Scott 1977
Carl Neff 2368
Cheronda Williams 2433
Chris Barragan 2433
Clarissa Tenner 1940
Dusty Ann Spence 2405
Jonathon Delarosa 2002
Jose Witherspoon 2145
Kesia Horn 2319
Miguel Wyatt 2478
Noura Sandoval 1952
Stephanie Butler 2133
Wesley Carrizales 2171
Jennifer Ruiz 1900
Justin Whiting 2229
Julio Olivares 2261
Detail View GO
Brandon Ybarra’s Mathematics Grade 7
CLASSROOM SNAPSHOT
Hello, Brandon Ybarra | Help | Log Out
Glendale Independent School District » Bradock Middle School » Grade 7 » Brandon Ybarra’s Class
Switch Dashboard Level... GO Select a Student... GO PRINT
Select File Format GOSubject Area GO EXPORT REPORT
Student Mathematical
Process and ToolsTAKS
Mathematics
Numbers, Operations and
Quantitative Reasoning
Patterns, Relationships
and Algebraic ReasoningGeometry and
Spatial Reasoning MeasurementProbability
and Statistics
O
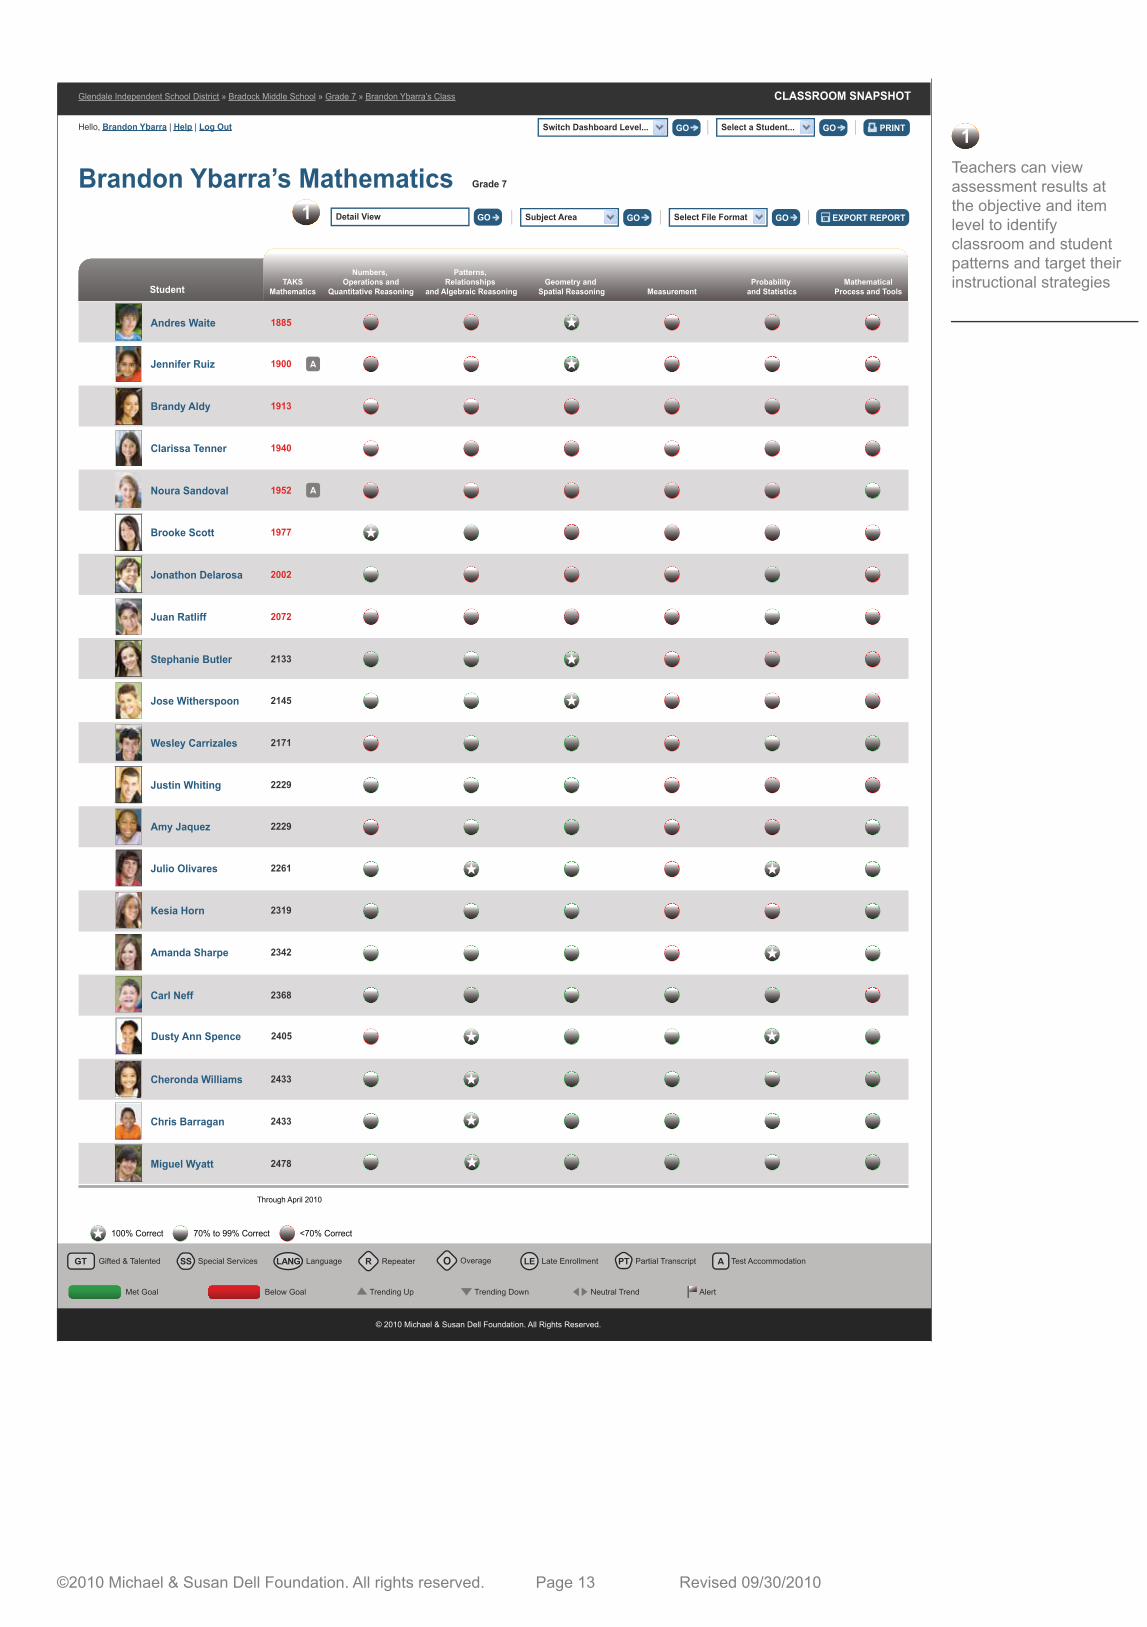
Teachers can viewassessment results atthe objective and itemlevel to identifyclassroom and studentpatterns and target theirinstructional strategies
1
1
©2010 Michael & Susan Dell Foundation. All rights reserved. Page 13 Revised 09/30/2010

This document was supported by the Michael & Susan Dell Foundation and created by Double Line Partners, LLC.
©2010 Michael & Susan Dell Foundation. All rights reserved.
Revised 09/30/2010
TexasStudentDataSystem
Campus Snapshot Collection
All names, addresses, titles, telephone numbers, assessments, programs, student information, and all other data represented in this guide are �ctitious. Any resemblance to any individuals or any organization is purely coincidental.
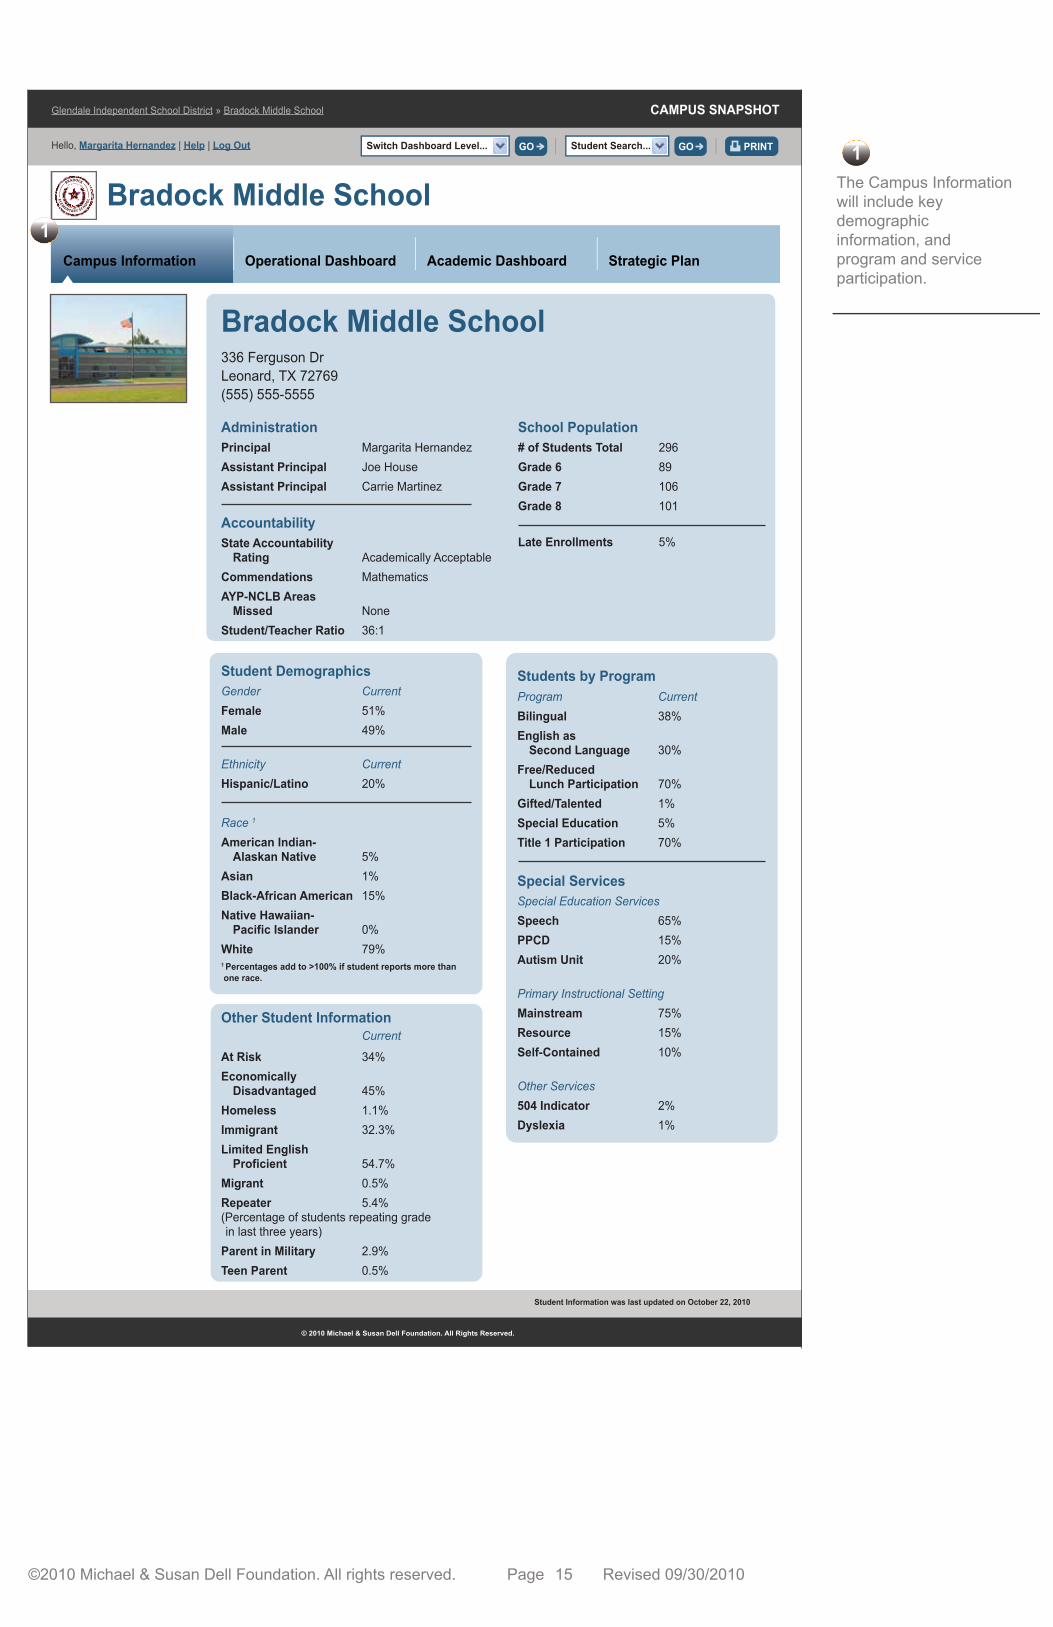
336 Ferguson DrLeonard, TX 72769(555) 555-5555
AdministrationPrincipal Margarita HernandezAssistant Principal Joe HouseAssistant Principal Carrie Martinez
AccountabilityState Accountability Rating Academically AcceptableCommendations MathematicsAYP-NCLB Areas Missed NoneStudent/Teacher Ratio 36:1
At Risk 34%Economically Disadvantaged 45%Homeless 1.1%Immigrant 32.3%Limited English Proficient 54.7%Migrant 0.5%Repeater 5.4%(Percentage of students repeating grade in last three years)Parent in Military 2.9%Teen Parent 0.5%
Bradock Middle School
Other Student Information Current
School Population# of Students Total 296Grade 6 89Grade 7 106Grade 8 101
Late Enrollments 5%
Students by ProgramProgram Current Bilingual 38%English as Second Language 30%Free/Reduced Lunch Participation 70%Gifted/Talented 1%Special Education 5%Title 1 Participation 70%
Special ServicesSpecial Education Services Speech 65%PPCD 15%Autism Unit 20%
Primary Instructional Setting Mainstream 75%Resource 15%Self-Contained 10%
Other Services504 Indicator 2%Dyslexia 1%
Student DemographicsGender Current Female 51%Male 49%
Ethnicity Current Hispanic/Latino 20%
Race 1
American Indian- Alaskan Native 5%Asian 1%Black-African American 15%Native Hawaiian- Pacific Islander 0%White 79%1 Percentages add to >100% if student reports more than one race.
BRADOCK
ELEM
E N TA R Y SC HOO
L
© 2010 Michael & Susan Dell Foundation. All Rights Reserved.
Student Information was last updated on October 22, 2010
Bradock Middle School
CAMPUS SNAPSHOT
Hello, Douglas Allen | Help | Log out
Campus Information Master Schedule Strategic PlanAcademic Dashboard
Glendale Independent School District » Bradock High School
Switch Dashboard Level... GO Select a Grade... GO PRINT
CAMPUS SNAPSHOT
Hello, Margarita Hernandez | Help | Log Out
Campus Information Operational Dashboard Strategic PlanAcademic Dashboard
Glendale Independent School District » Bradock Middle School
Switch Dashboard Level... GO Student Search... GO PRINT
The Campus Informationwill include keydemographicinformation, andprogram and serviceparticipation.
1
1
©2010 Michael & Susan Dell Foundation. All rights reserved. Page 15 Revised 09/30/2010
CAMPUS SNAPSHOT
Hello, Margarita Hernandez | Help | Log out
Glendale Independent School District » Bradock Middle School
Switch Dashboard Level... GO Student Search... GO PRINT
Bradock Middle School
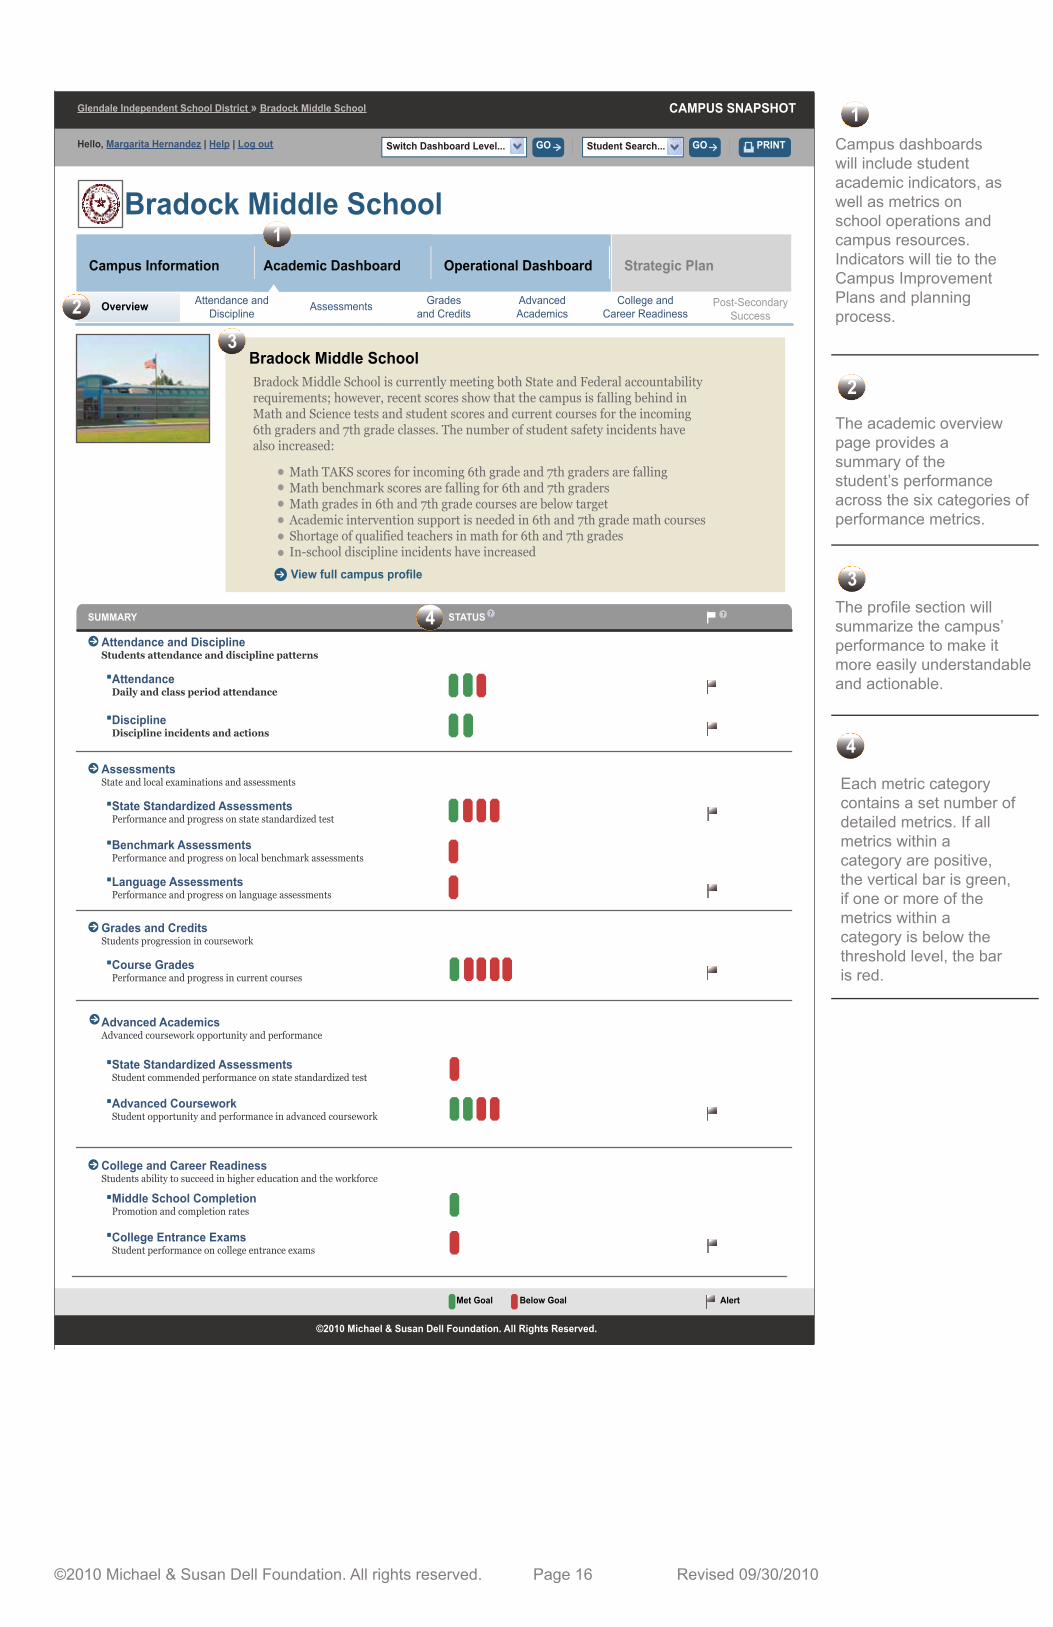
Bradock Middle School is currently meeting both State and Federal accountability requirements; however, recent scores show that the campus is falling behind in Math and Science tests and student scores and current courses for the incoming 6th graders and 7th grade classes. The number of student safety incidents have also increased:
Bradock Middle School
Math TAKS scores for incoming 6th grade and 7th graders are fallingMath benchmark scores are falling for 6th and 7th gradersMath grades in 6th and 7th grade courses are below targetAcademic intervention support is needed in 6th and 7th grade math coursesShortage of qualified teachers in math for 6th and 7th gradesIn-school discipline incidents have increased
Gradesand CreditsOverview College and
Career ReadinessAdvancedAcademics
Post-Secondary Success
Attendance and Discipline Assessments
Campus Information Strategic PlanAcademic Dashboard Operational Dashboard
SUMMARY STATUS ?
Attendance and DisciplineStudents attendance and discipline patterns
AttendanceDaily and class period attendance
DisciplineDiscipline incidents and actions
AssessmentsState and local examinations and assessments
State Standardized AssessmentsPerformance and progress on state standardized test
Benchmark AssessmentsPerformance and progress on local benchmark assessments
Advanced AcademicsAdvanced coursework opportunity and performance
Grades and CreditsStudents progression in coursework
Course GradesPerformance and progress in current courses
College and Career ReadinessStudents ability to succeed in higher education and the workforce
Middle School CompletionPromotion and completion rates
College Entrance ExamsStudent performance on college entrance exams
State Standardized AssessmentsStudent commended performance on state standardized test
Advanced CourseworkStudent opportunity and performance in advanced coursework
Language AssessmentsPerformance and progress on language assessments
?
Met Goal Below Goal Alert
©2010 Michael & Susan Dell Foundation. All Rights Reserved.
View full campus profile
Campus dashboardswill include studentacademic indicators, aswell as metrics onschool operations andcampus resources.Indicators will tie to theCampus ImprovementPlans and planningprocess.
The academic overviewpage provides asummary of thestudent’s performanceacross the six categories ofperformance metrics.
The profile section willsummarize the campus’performance to make itmore easily understandable and actionable.
Each metric categorycontains a set number ofdetailed metrics. If allmetrics within acategory are positive,the vertical bar is green,if one or more of themetrics within acategory is below thethreshold level, the baris red.
1
2
3
4
1
2
3
4
©2010 Michael & Susan Dell Foundation. All rights reserved. Page 16 Revised 09/30/2010
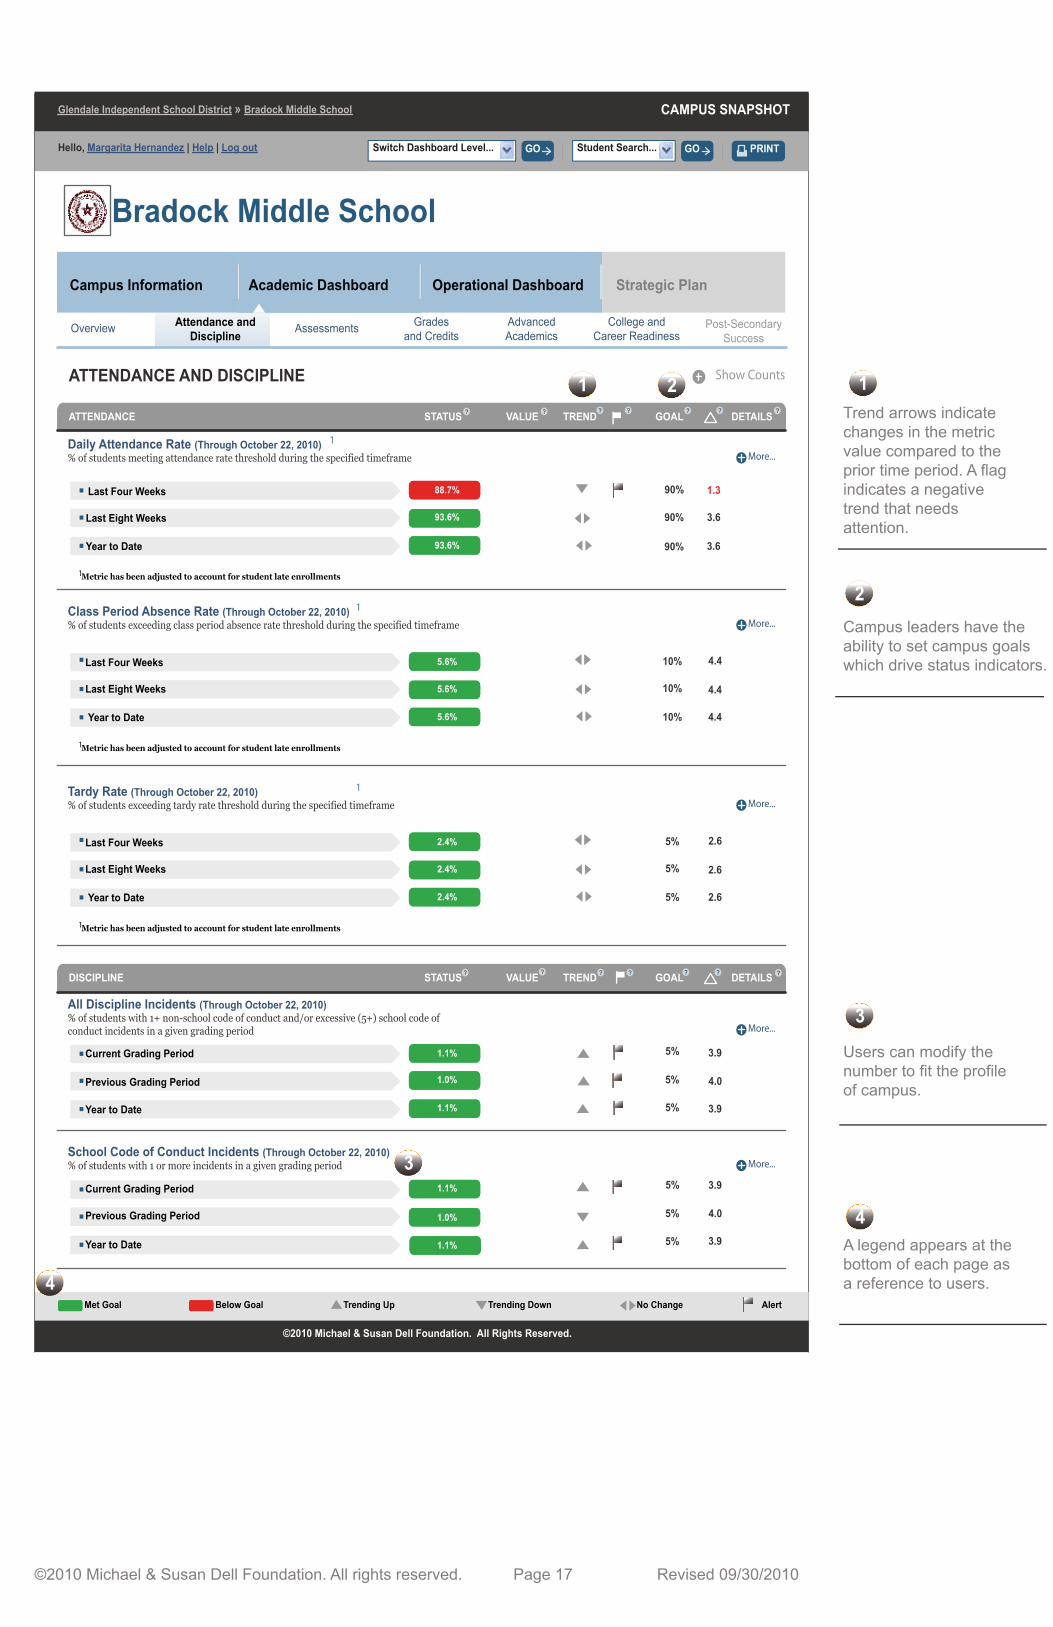
Trend arrows indicatechanges in the metricvalue compared to theprior time period. A flagindicates a negativetrend that needsattention.
Users can modify thenumber to fit the profileof campus.
A legend appears at thebottom of each page asa reference to users.
1
3
4
Show Counts
CAMPUS SNAPSHOT
Hello, Margarita Hernandez | Help | Log out
Glendale Independent School District » Bradock Middle School
Switch Dashboard Level... GO Student Search... GO PRINT
ATTENDANCE AND DISCIPLINE
Bradock Middle School
ATTENDANCE
Daily Attendance Rate (Through October 22, 2010)% of students meeting attendance rate threshold during the specified timeframe More...
Class Period Absence Rate (Through October 22, 2010)% of students exceeding class period absence rate threshold during the specified timeframe More...
DISCIPLINE
All Discipline Incidents (Through October 22, 2010)% of students with 1+ non-school code of conduct and/or excessive (5+) school code of conduct incidents in a given grading period More...
School Code of Conduct Incidents (Through October 22, 2010)% of students with 1 or more incidents in a given grading period More...
1Metric has been adjusted to account for student late enrollments
1Metric has been adjusted to account for student late enrollments
Gradesand CreditsOverview College and
Career ReadinessAdvancedAcademics
Post-Secondary Success
Attendance and Discipline Assessments
Campus Information Strategic PlanAcademic Dashboard Operational Dashboard
1
1
No ChangeMet Goal Below Goal Alert
©2010 Michael & Susan Dell Foundation. All Rights Reserved.
Trending Up Trending Down
STATUS TREND GOAL DETAILSVALUE
STATUS TREND GOAL DETAILSVALUE
Last Four Weeks
Last Eight Weeks
Year to Date
Last Four Weeks
Last Eight Weeks
Year to Date
Current Grading Period
Previous Grading Period
Year to Date
Current Grading Period
Previous Grading Period
Year to Date
? ? ? ? ? ? ?
? ? ? ? ? ? ?
88.7%
93.6%
93.6%
5.6%
5.6%
5.6%
1.1%
1.0%
1.1%
1.1%
1.0%
1.1%1.1%
90%
90%
90%
1.3
3.6
3.6
10%
10%
10%
4.4
4.4
4.4
5%
5%
5%
3.9
4.0
3.9
5%
5%
5%
3.9
4.0
3.9
Tardy Rate (Through October 22, 2010)% of students exceeding tardy rate threshold during the specified timeframe More...
1Metric has been adjusted to account for student late enrollments
1
Last Four Weeks
Last Eight Weeks
Year to Date
2.4%
2.4%
2.4%
5%
5%
5%
2.6
2.6
2.6
1 2
4
©2010 Michael & Susan Dell Foundation. All rights reserved. Page 17 Revised 09/30/2010
Campus leaders have the ability to set campus goalswhich drive status indicators.
2
3
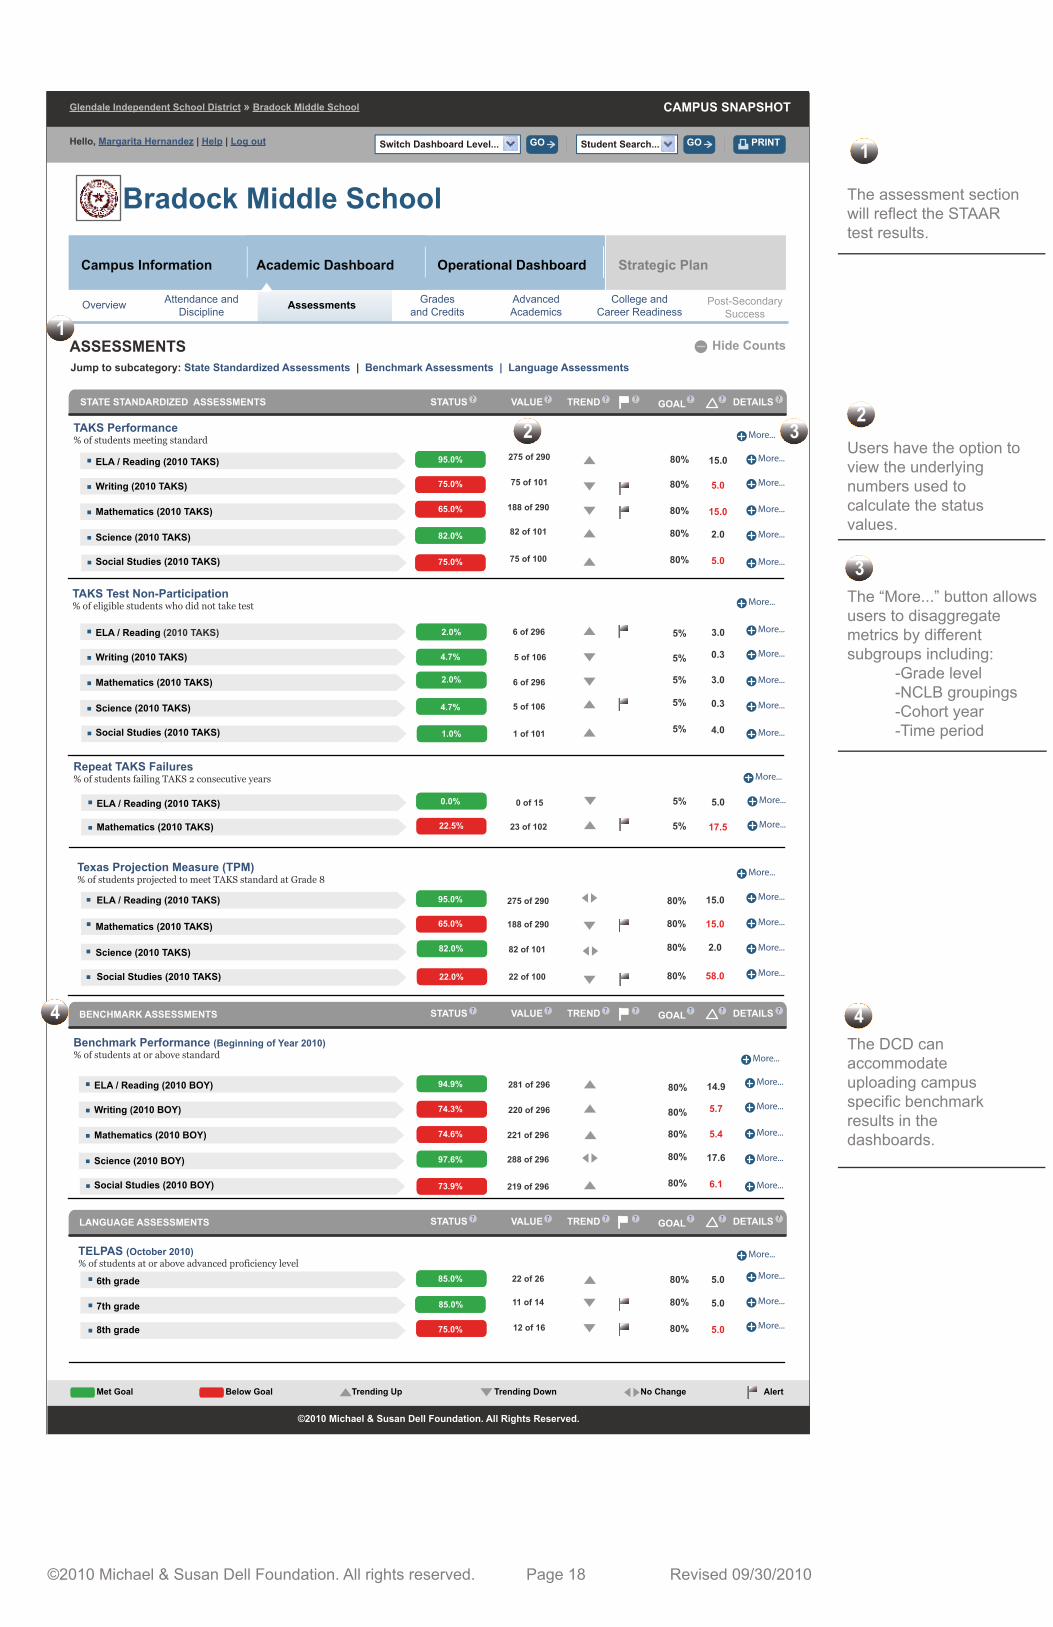
Users have the option toview the underlyingnumbers used tocalculate the statusvalues.
The assessment sectionwill reflect the STAAR test results.
The DCD canaccommodateuploading campusspecific benchmarkresults in thedashboards.
1
2
4
Texas Projection Measure (TPM)% of students projected to meet TAKS standard at Grade 8
CAMPUS SNAPSHOT
Hello, Margarita Hernandez | Help | Log out
Glendale Independent School District » Bradock Middle School
Switch Dashboard Level... GO Student Search... GO PRINT
ASSESSMENTS
TAKS Test Non-Participation% of eligible students who did not take test
STATE STANDARDIZED ASSESSMENTS
BENCHMARK ASSESSMENTS
TELPAS (October 2010)% of students at or above advanced proficiency level
TAKS Performance% of students meeting standard
Bradock Middle School
Jump to subcategory: State Standardized Assessments | Benchmark Assessments | Language Assessments
LANGUAGE ASSESSMENTS
Benchmark Performance (Beginning of Year 2010)% of students at or above standard
More...
More...
More...
More...
More...
More...
More...
More...
More...
More...
More...
More...
More...
More...
More...
Gradesand CreditsOverview College and
Career ReadinessAdvancedAcademics
Post-Secondary Success
Attendance and Discipline Assessments
Campus Information Strategic PlanAcademic Dashboard Operational Dashboard
No ChangeMet Goal Below Goal Alert
©2010 Michael & Susan Dell Foundation. All Rights Reserved.
Trending Up Trending Down
STATUS TREND GOAL DETAILSVALUE? ? ? ? ? ? ?
STATUS TREND GOAL DETAILSVALUE? ? ? ? ? ? ?
STATUS TREND GOAL DETAILSVALUE? ? ? ? ? ? ?
Hide Counts
ELA / Reading (2010 TAKS)
Writing (2010 TAKS)
Mathematics (2010 TAKS)
Science (2010 TAKS)
More...Social Studies (2010 TAKS)
ELA / Reading (2010 TAKS)
Mathematics (2010 TAKS)
95.0%
75.0%
65.0%
82.0%
75.0%
95%
95.0%
65.0%
82.0%
85.0%
80.0%
75.0%
22 of 26
11 of 14
12 of 16
22 of 100
82 of 101
188 of 290
275 of 290
82.0%
22.0%
85.0%
Repeat TAKS Failures % of students failing TAKS 2 consecutive years
More...
More...
More...
More...
ELA / Reading (2010 TAKS)
Writing (2010 TAKS)
Mathematics (2010 TAKS)
Science (2010 TAKS)
More...Social Studies (2010 TAKS)
More...
More...
More...
ELA / Reading (2010 TAKS)
Mathematics (2010 TAKS)
Science (2010 TAKS)
Social Studies (2010 TAKS)
More...
More...
More...
More...
More...
ELA / Reading (2010 BOY)
Writing (2010 BOY)
Mathematics (2010 BOY)
Science (2010 BOY)
More...Social Studies (2010 BOY)
6th grade
7th grade
8th grade
4.7%
4.7%
2.0%
1.0%
11.0%
0.0%
22.5%
94.9%
74.3%
74.6%
97.6%
73.9% 219 of 296
288 of 296
221 of 296
220 of 296
281 of 296
23 of 102
0 of 15
1 of 101
5 of 106
6 of 296
5 of 106
6 of 296
75 of 100
82 of 101
188 of 290
75 of 101
275 of 290
2.0%
80%
80%
80%
80%
80%
15.0
5.0
15.0
2.0
5.0
5%
5%
5%
5%
5%
3.0
0.3
3.0
0.3
4.0
5%
5%
5.0
17.5
80%
80%
80%
80%
15.0
15.0
2.0
58.0
80%
80%
80%
80%
80%
14.9
5.7
5.4
17.6
6.1
80%
80%
80%
5.0
5.0
5.0
1
2
4
©2010 Michael & Susan Dell Foundation. All rights reserved. Page 18 Revised 09/30/2010
The “More...” button allowsusers to disaggregatemetrics by differentsubgroups including: -Grade level -NCLB groupings -Cohort year -Time period
3
3
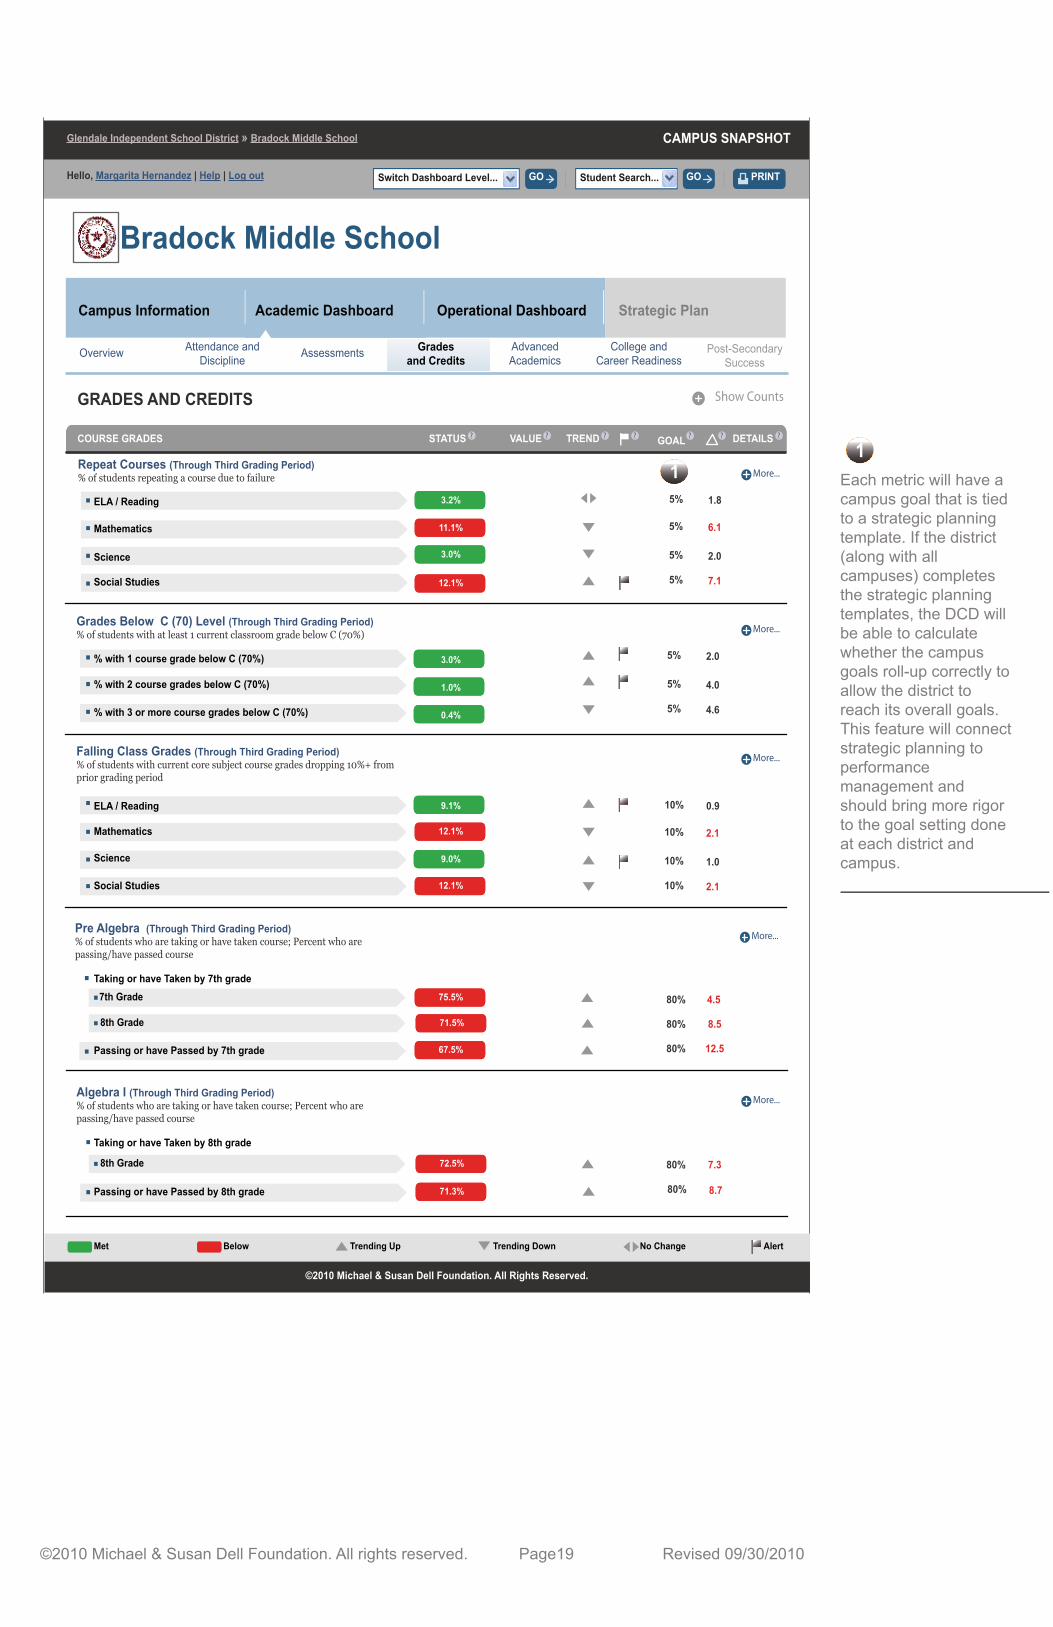
Each metric will have acampus goal that is tiedto a strategic planningtemplate. If the district(along with allcampuses) completesthe strategic planningtemplates, the DCD willbe able to calculatewhether the campusgoals roll-up correctly toallow the district toreach its overall goals.This feature will connectstrategic planning toperformancemanagement andshould bring more rigorto the goal setting doneat each district andcampus.
1
CAMPUS SNAPSHOT
Hello, Margarita Hernandez | Help | Log out
Glendale Independent School District » Bradock Middle School
Switch Dashboard Level... GO Student Search... GO PRINT
GRADES AND CREDITS
Algebra I (Through Third Grading Period)% of students who are taking or have taken course; Percent who are passing/have passed course
Grades Below C (70) Level (Through Third Grading Period)% of students with at least 1 current classroom grade below C (70%)
Falling Class Grades (Through Third Grading Period)% of students with current core subject course grades dropping 10%+ from prior grading period
Bradock Middle School
Repeat Courses (Through Third Grading Period)% of students repeating a course due to failure
COURSE GRADES
More...
More...
More...
More...
Gradesand CreditsOverview College and
Career ReadinessAdvancedAcademics
Post-Secondary Success
Attendance and Discipline Assessments
Campus Information Strategic PlanAcademic Dashboard Operational Dashboard
STATUS TREND GOAL DETAILSVALUE
No ChangeMet Below Alert
©2010 Michael & Susan Dell Foundation. All Rights Reserved.
Trending Up Trending Down
? ? ? ? ? ? ?
ELA / Reading
Mathematics
Science
Social Studies
% with 1 course grade below C (70%)
% with 2 course grades below C (70%)
% with 3 or more course grades below C (70%)
ELA / Reading
Mathematics
Science
Social Studies
Pre Algebra (Through Third Grading Period)% of students who are taking or have taken course; Percent who are passing/have passed course
More...
Taking or have Taken by 7th grade
Taking or have Taken by 8th grade
Passing or have Passed by 8th grade
Show Counts
3.2%
11.1%
12.1%
3.0%
9.1%
9.0%
3.0%
1.0%
0.4%
12.1%
12.1%
76.1%
67.5%
71.3%
5%
5%
5%
5%
1.8
6.1
2.0
7.1
5%
5%
5%
2.0
4.0
4.6
10%
10%
10%
10%
0.9
2.1
1.0
2.1
80% 12.5
80% 8.7
7th Grade
8th Grade
75.5%
71.5%
80% 4.5
80% 8.5
Passing or have Passed by 7th grade
8th Grade 72.5% 80% 7.3
1
©2010 Michael & Susan Dell Foundation. All rights reserved. Page19 Revised 09/30/2010
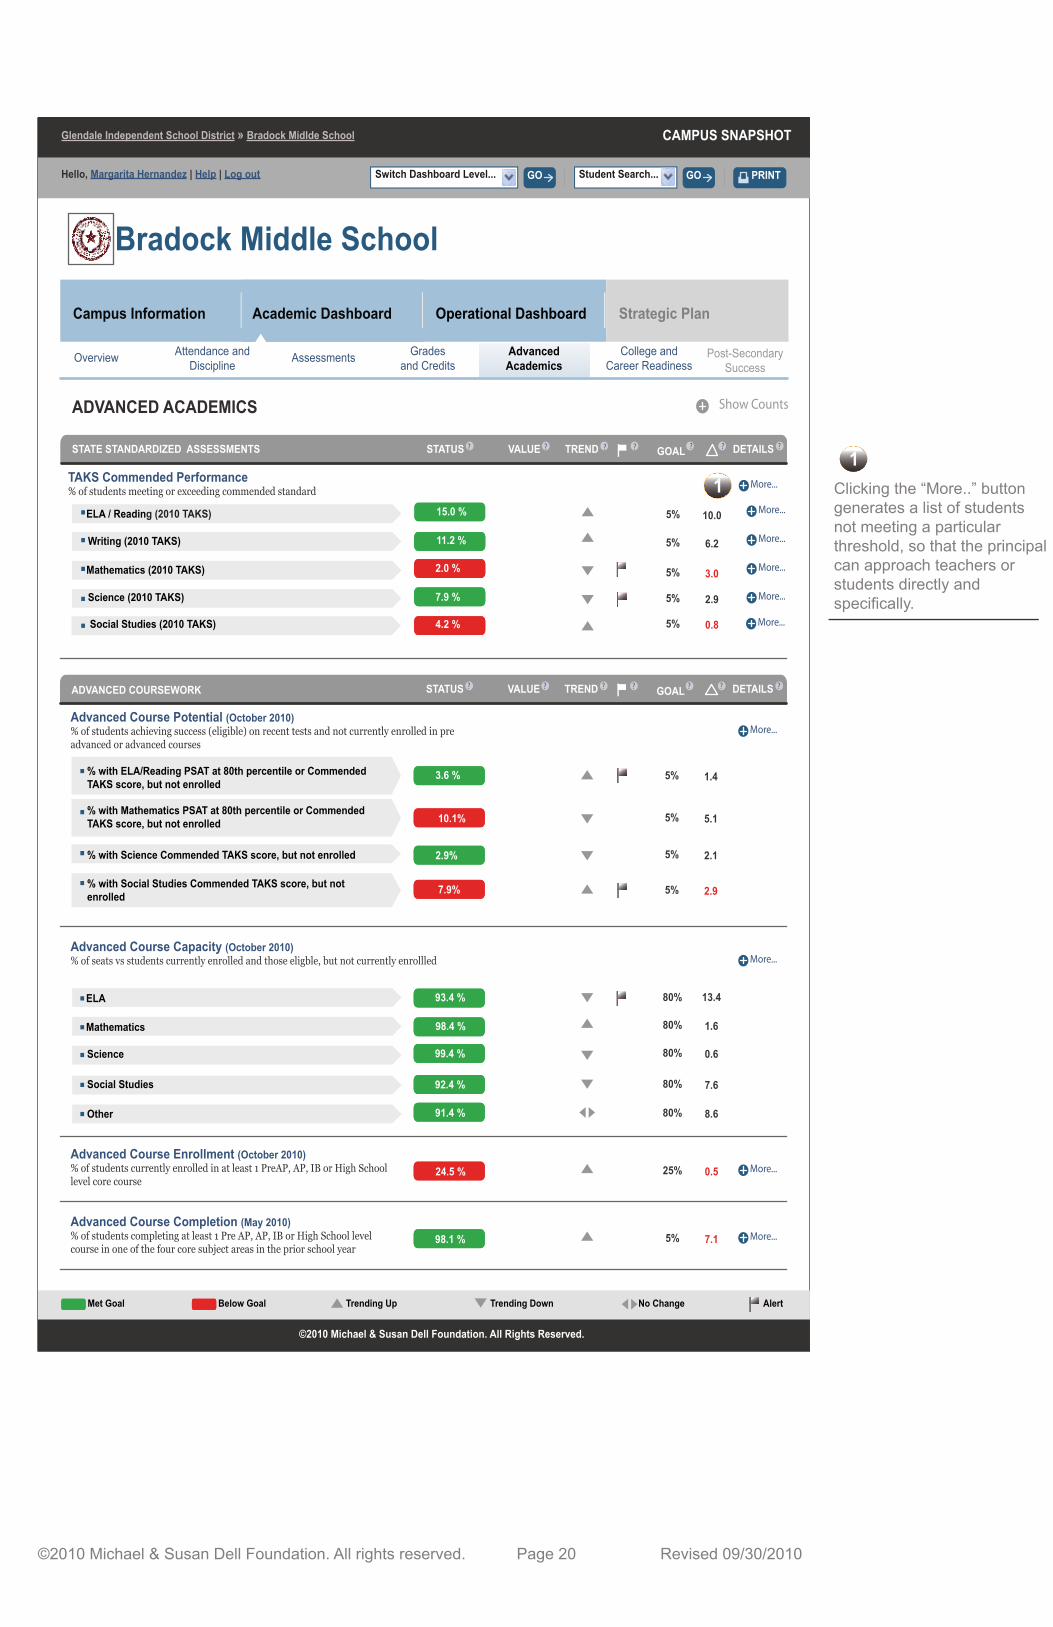
Clicking the “More..” buttongenerates a list of studentsnot meeting a particularthreshold, so that the principalcan approach teachers or students directly and specifically.
1
CAMPUS SNAPSHOT
Hello, Margarita Hernandez | Help | Log out
Glendale Independent School District » Bradock Midlde School
Switch Dashboard Level... GO Student Search... GO PRINT
ADVANCED ACADEMICS
Bradock Middle School
ADVANCED COURSEWORK
Advanced Course Potential (October 2010)% of students achieving success (eligible) on recent tests and not currently enrolled in pre advanced or advanced courses
% with ELA/Reading PSAT at 80th percentile or Commended TAKS score, but not enrolled
More...
Advanced Course Capacity (October 2010)% of seats vs students currently enrolled and those eligble, but not currently enrollled
ELA
ELA / Reading (2010 TAKS)
Advanced Course Enrollment (October 2010)% of students currently enrolled in at least 1 PreAP, AP, IB or High School level core course
More...
More...
Advanced Course Completion (May 2010)% of students completing at least 1 Pre AP, AP, IB or High School level course in one of the four core subject areas in the prior school year
More...
Gradesand CreditsOverview College and
Career ReadinessAdvancedAcademics
Post-Secondary Success
Attendance and Discipline Assessments
Campus Information Strategic PlanAcademic Dashboard Operational Dashboard
TAKS Commended Performance% of students meeting or exceeding commended standard
STATE STANDARDIZED ASSESSMENTS
More...
More...
More...
More...
More...
No ChangeMet Goal Below Goal Alert
©2010 Michael & Susan Dell Foundation. All Rights Reserved.
Trending Up Trending Down
STATUS TREND GOAL DETAILSVALUE? ? ? ? ? ? ?
STATUS TREND GOAL DETAILSVALUE? ? ? ? ? ? ?
Writing (2010 TAKS)
Mathematics (2010 TAKS)
Science (2010 TAKS)
Social Studies (2010 TAKS)
% with Mathematics PSAT at 80th percentile or Commended TAKS score, but not enrolled
% with Science Commended TAKS score, but not enrolled
% with Social Studies Commended TAKS score, but not enrolled
Mathematics
Science
Social Studies
Other
15.0 %
11.2 %
2.0 %
4.2 %
7.9 %
More...
3.6 %
10.1%
7.9%
2.9%
93.4 %
98.4 %
99.4 %
92.4 %
91.4 %
24.5 %
98.1 %
Show Counts
5%
5%
5%
5%
10.0
6.2
3.0
2.9
5% 0.8
5%
5%
5%
1.4
5.1
2.1
5% 2.9
80%
80%
80%
13.4
1.6
0.6
80% 7.6
80% 8.6
25% 0.5
5% 7.1
1
©2010 Michael & Susan Dell Foundation. All rights reserved. Page 20 Revised 09/30/2010
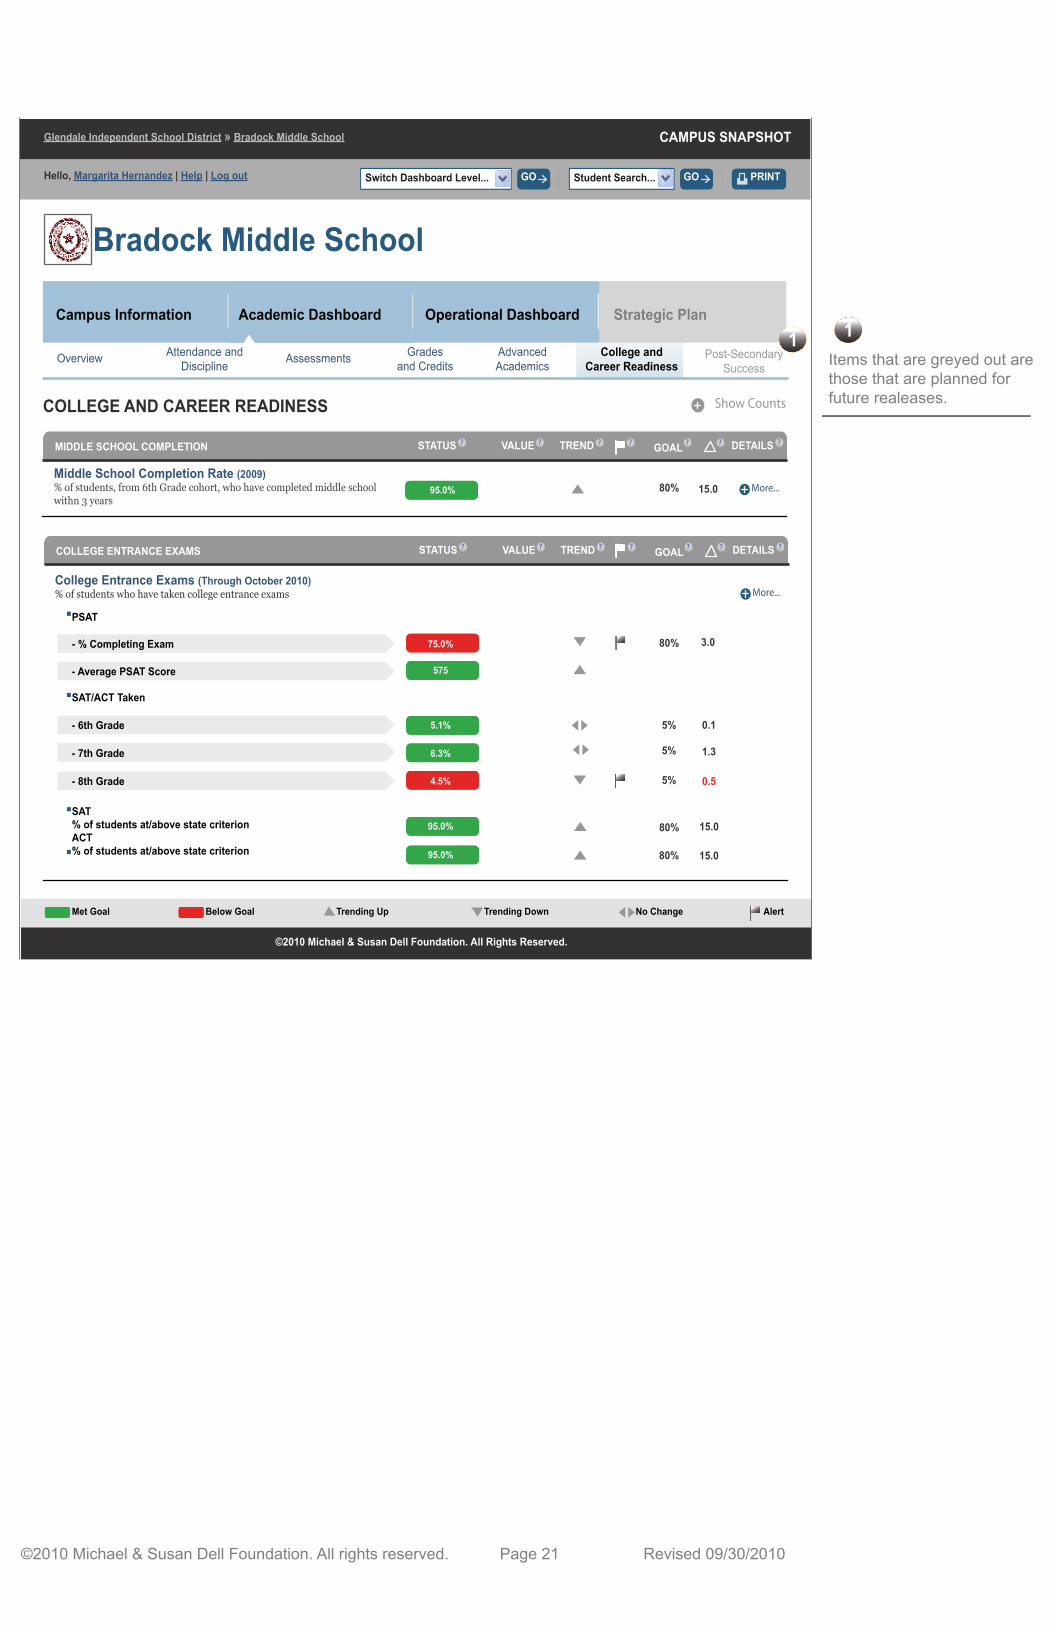
Items that are greyed out arethose that are planned forfuture realeases.
1
CAMPUS SNAPSHOT
Hello, Margarita Hernandez | Help | Log out
Glendale Independent School District » Bradock Middle School
Switch Dashboard Level... GO Student Search... GO PRINT
COLLEGE AND CAREER READINESS
Gradesand CreditsOverview College and
Career ReadinessAdvancedAcademics
Post-Secondary Success
Attendance and Discipline Assessments
Campus Information Strategic PlanAcademic Dashboard Operational Dashboard
Bradock Middle School
More...
MIDDLE SCHOOL COMPLETION
COLLEGE ENTRANCE EXAMS
College Entrance Exams (Through October 2010)% of students who have taken college entrance exams More...
Middle School Completion Rate (2009)% of students, from 6th Grade cohort, who have completed middle school withn 3 years
SAT% of students at/above state criterionACT% of students at/above state criterion
No ChangeMet Goal Below Goal Alert
©2010 Michael & Susan Dell Foundation. All Rights Reserved.
Trending Up Trending Down
STATUS TREND GOAL DETAILSVALUE? ? ? ? ? ? ?
STATUS TREND GOAL DETAILSVALUE? ? ? ? ? ? ?
PSAT
SAT/ACT Taken
- % Completing Exam
- Average PSAT Score
- 6th Grade
- 7th Grade
- 8th Grade
95.0%
Show Counts
75.0%
575
5.1%
6.3%
4.5%
95.0%
95.0%
80%
5%
5%
5%
3.0
0.1
1.3
0.5
80%
80%
15.0
15.0
80% 15.0
1
©2010 Michael & Susan Dell Foundation. All rights reserved. Page 21 Revised 09/30/2010
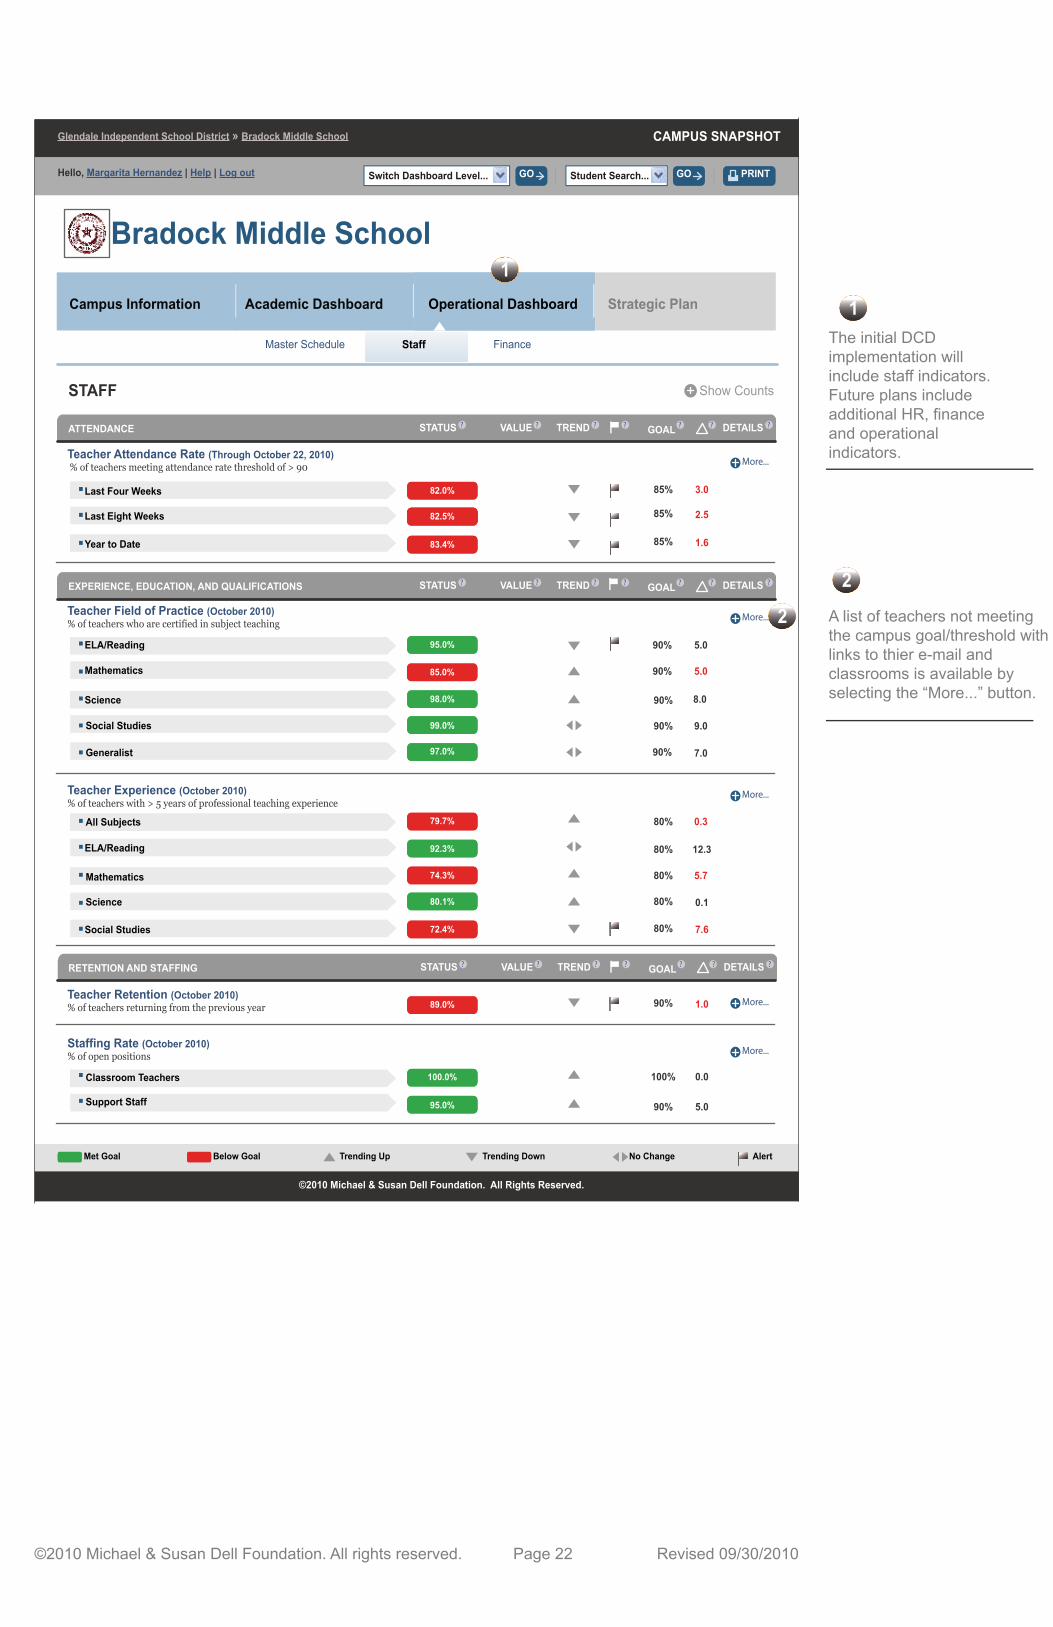
The initial DCDimplementation willinclude staff indicators.Future plans includeadditional HR, financeand operationalindicators.
1
CAMPUS SNAPSHOT
Hello, Margarita Hernandez | Help | Log out
Glendale Independent School District » Bradock Middle School
Switch Dashboard Level... GO Student Search... GO PRINT
STAFF
Bradock Middle School
ATTENDANCE
Teacher Attendance Rate (Through October 22, 2010) % of teachers meeting attendance rate threshold of > 90 More...
More...
Master Schedule Staff Finance
Campus Information Strategic PlanAcademic Dashboard Operational Dashboard
Teacher Retention (October 2010)% of teachers returning from the previous year
Teacher Field of Practice (October 2010)% of teachers who are certified in subject teaching
More...
Teacher Experience (October 2010)% of teachers with > 5 years of professional teaching experience
More...
Staffing Rate (October 2010)% of open positions More...
EXPERIENCE, EDUCATION, AND QUALIFICATIONS
RETENTION AND STAFFING
No ChangeMet Goal Below Goal Alert
©2010 Michael & Susan Dell Foundation. All Rights Reserved.
Trending Up Trending Down
STATUS TREND GOAL DETAILSVALUE? ? ? ? ? ? ?
STATUS TREND GOAL DETAILSVALUE? ? ? ? ? ? ?
STATUS TREND GOAL DETAILSVALUE? ? ? ? ? ? ?
Show Counts
Last Four Weeks
Last Eight Weeks
Year to Date
ELA/Reading
Mathematics
Science
Social Studies
Generalist
All Subjects
ELA/Reading
Mathematics
Science
Social Studies
Classroom Teachers
Support Staff
82.0%
82.5%
83.4%
85.0%
95.0%
98.0%
99.0%
97.0%
79.7%
92.3%
80.1%
89.0%
100.0%
95.0%
72.4%
85%
85%
85%
3.0
2.5
1.6
90%
90%
90%
5.0
5.0
8.0
90%
90%
80%
9.0
7.0
0.3
80%
80%
80%
12.3
5.7
0.1
80% 7.6
90% 1.0
100% 0.0
90% 5.0
74.3%
1
©2010 Michael & Susan Dell Foundation. All rights reserved. Page 22 Revised 09/30/2010
A list of teachers not meetingthe campus goal/threshold with links to thier e-mail and classrooms is available by selecting the “More...” button.
2
2


