Texas Regional Collaboratives for Excellence in Science and Mathematics Teaching
39
Texas Regional Collaboratives for Excellence in Science and Mathematics Teaching Carol L. Fletcher, Ph.D. TRC Assistant Director/R&D Coordinator TRC Thirteen Annual Meeting TRC/T-STEM Summit June 27, 2007 Program Overview
description
Texas Regional Collaboratives for Excellence in Science and Mathematics Teaching. Program Overview. Carol L. Fletcher, Ph.D. TRC Assistant Director/R&D Coordinator TRC Thirteen Annual Meeting TRC/T-STEM Summit June 27, 2007. TRC - Who We Are. - PowerPoint PPT Presentation
Transcript of Texas Regional Collaboratives for Excellence in Science and Mathematics Teaching

Texas Regional Collaborativesfor Excellence in Science and Mathematics Teaching
Carol L. Fletcher, Ph.D.TRC Assistant Director/R&D Coordinator
TRC Thirteen Annual MeetingTRC/T-STEM SummitJune 27, 2007
Program Overview
2
Texas Regional Collaboratives for Excellence in Science and Mathematics TeachingTexas Regional Collaboratives for Excellence in Science and Mathematics Teaching
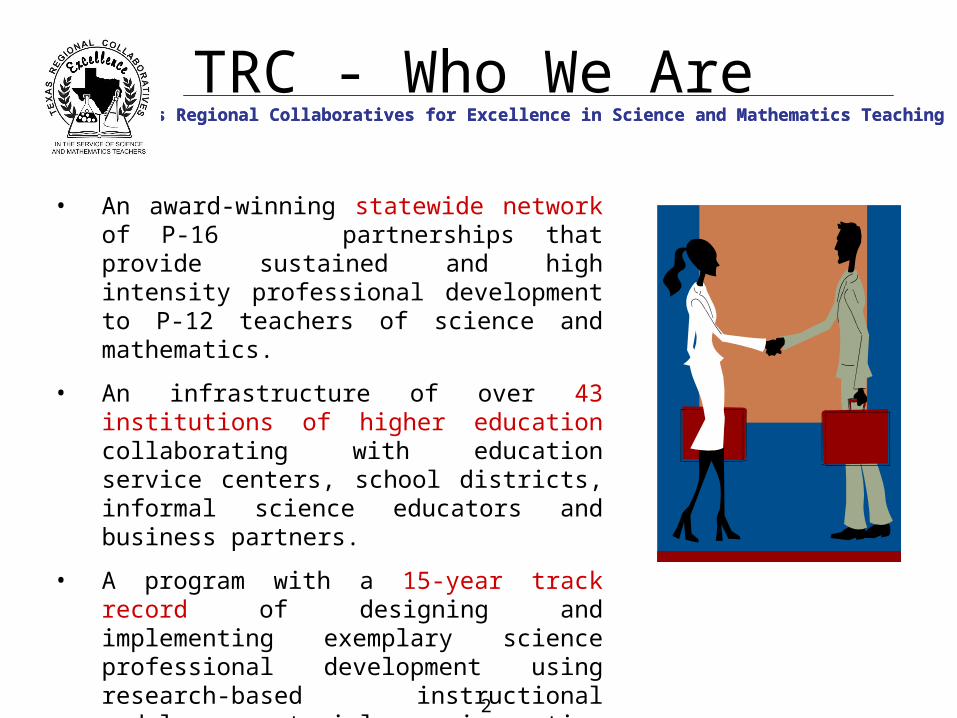
TRC - Who We Are
• An award-winning statewide network of P-16 partnerships that provide sustained and high intensity professional development to P-12 teachers of science and mathematics.
• An infrastructure of over 43 institutions of higher education collaborating with education service centers, school districts, informal science educators and business partners.
• A program with a 15-year track record of designing and implementing exemplary science professional development using research-based instructional models, materials, innovative technology, and best practices.
3
Texas Regional Collaboratives for Excellence in Science and Mathematics TeachingTexas Regional Collaboratives for Excellence in Science and Mathematics Teaching
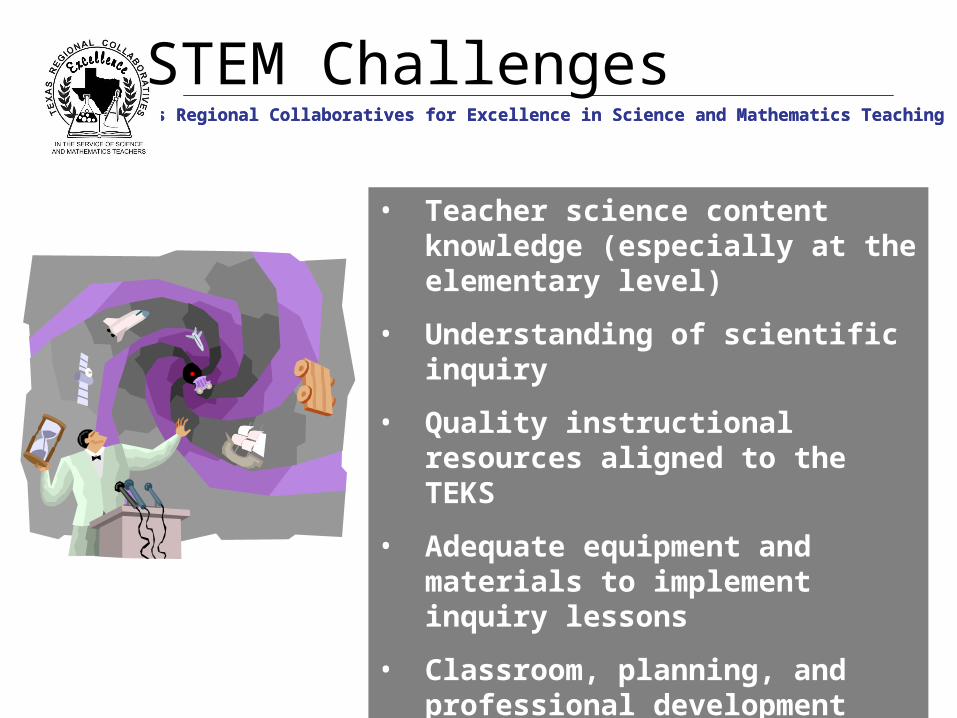
• Teacher science content knowledge (especially at the elementary level)
• Understanding of scientific inquiry
• Quality instructional resources aligned to the TEKS
• Adequate equipment and materials to implement inquiry lessons
• Classroom, planning, and professional development time
STEM Challenges
4
Texas Regional Collaboratives for Excellence in Science and Mathematics TeachingTexas Regional Collaboratives for Excellence in Science and Mathematics Teaching
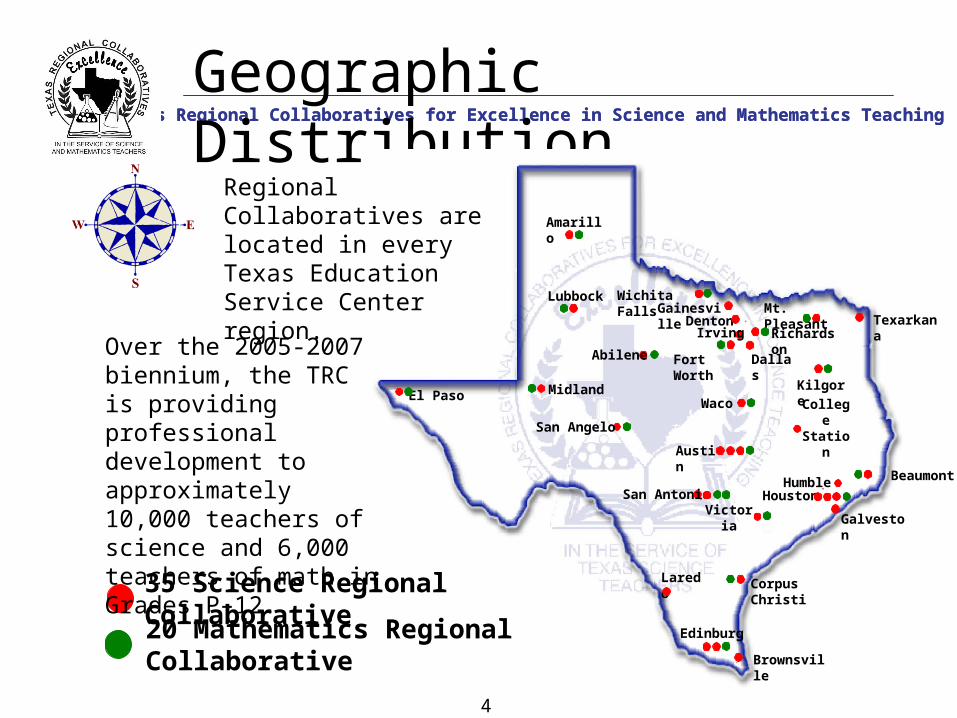
Geographic Distribution
Austin
Amarillo
Lubbock
Abilene
Denton
KilgoreWaco
Houston
Galveston
Corpus Christi
Brownsville
Edinburg
San Antonio
GainesvilleWichita Falls
Fort Worth
Mt. Pleasant
El Paso
Victoria
College Station
San Angelo
Midland
Irving Richardson
Dallas
Laredo
Texarkana
Humble
35 Science Regional Collaborative
Over the 2005-2007 biennium, the TRC is providing professional development to approximately 10,000 teachers of science and 6,000 teachers of math in Grades P–12.
Beaumont
Regional Collaboratives are located in every Texas Education Service Center region.
20 Mathematics Regional Collaborative
5
Texas Regional Collaboratives for Excellence in Science and Mathematics TeachingTexas Regional Collaboratives for Excellence in Science and Mathematics Teaching
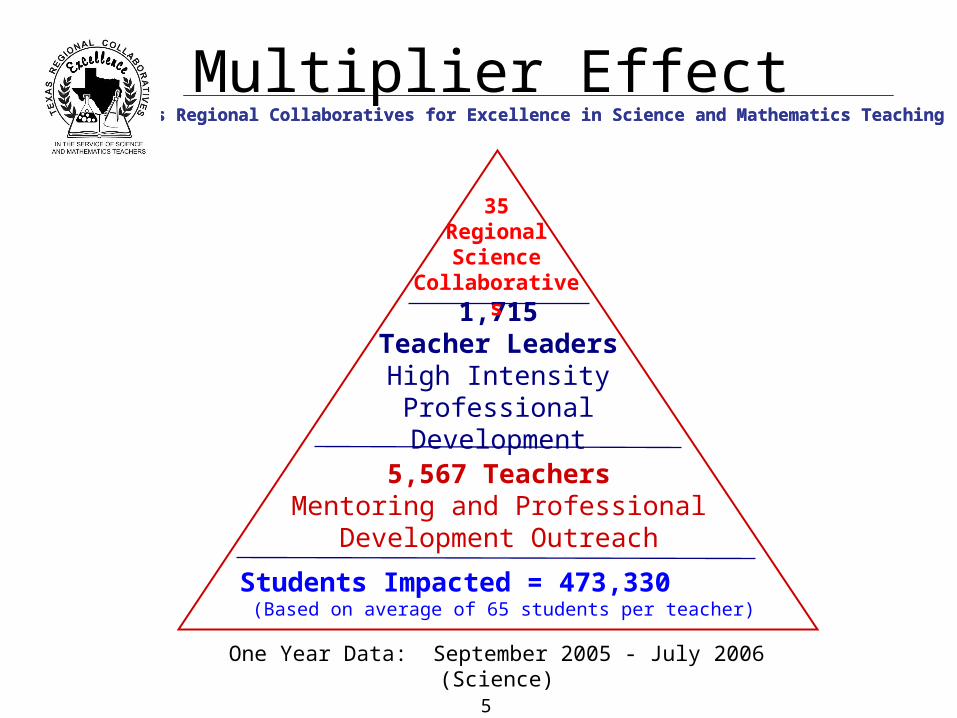
1,715Teacher Leaders
High IntensityProfessional Development
5,567 TeachersMentoring and Professional
Development Outreach
35RegionalScience
Collaboratives
Students Impacted = 473,330
(Based on average of 65 students per teacher)
One Year Data: September 2005 - July 2006 (Science)
Multiplier Effect
6
Texas Regional Collaboratives for Excellence in Science and Mathematics TeachingTexas Regional Collaboratives for Excellence in Science and Mathematics Teaching
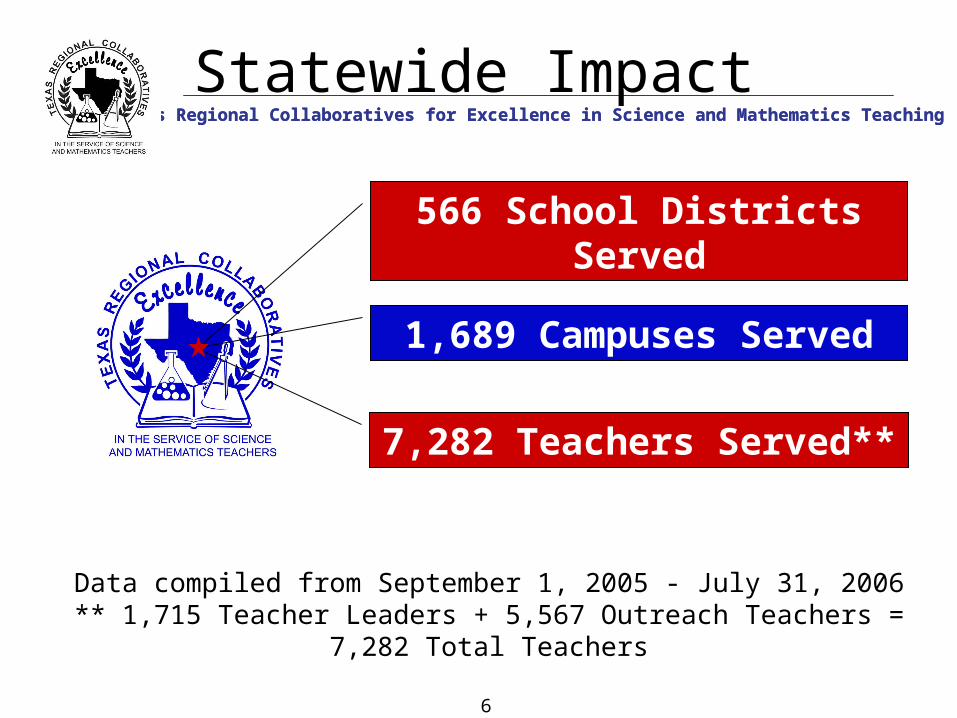
566 School Districts Served
1,689 Campuses Served
7,282 Teachers Served**
Data compiled from September 1, 2005 - July 31, 2006** 1,715 Teacher Leaders + 5,567 Outreach Teachers = 7,282 Total Teachers
Statewide Impact
7
Texas Regional Collaboratives for Excellence in Science and Mathematics TeachingTexas Regional Collaboratives for Excellence in Science and Mathematics Teaching
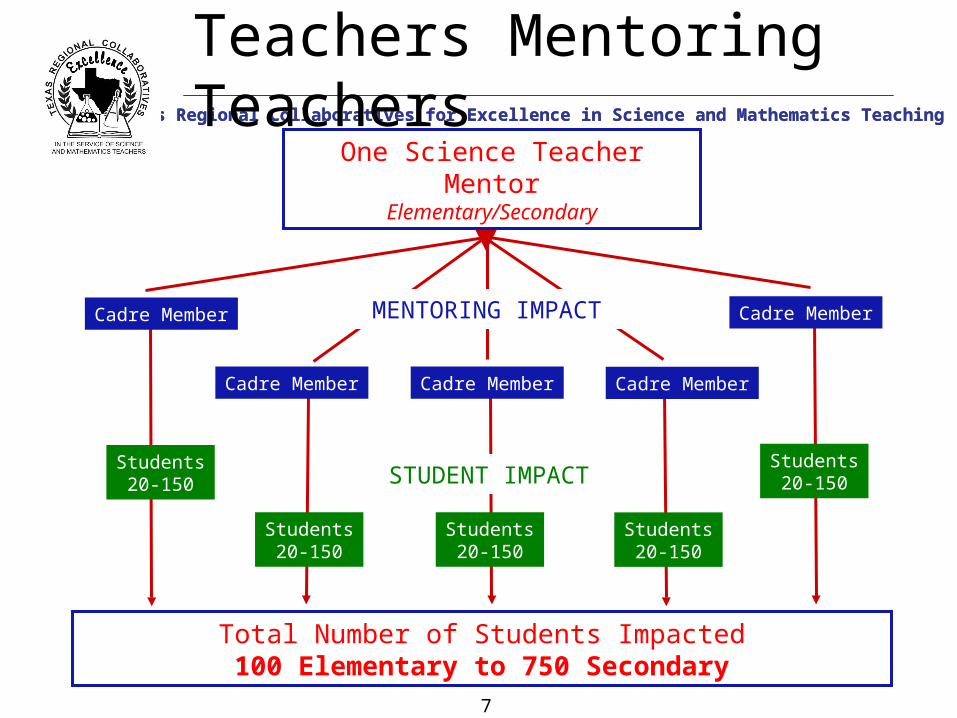
Total Number of Students Impacted100 Elementary to 750 Secondary
Students20-150
Students20-150
Students20-150
Students20-150
Students20-150
One Science Teacher MentorElementary/Secondary
Cadre Member
Cadre Member Cadre Member Cadre Member
Cadre Member
Teachers Mentoring Teachers
MENTORING IMPACT
STUDENT IMPACT

8
Texas Regional Collaboratives for Excellence in Science and Mathematics TeachingTexas Regional Collaboratives for Excellence in Science and Mathematics Teaching
Educator Demographics - Teaching Level
Data based on a sample of 771 teachers for funding period September 2002 - May 2004
47.9%
33.9%
16.2%
2.0%
0%
20%
40%
60%
80%
100%
Teaching Level
Elementary
Middle School
High School
Other
9
Texas Regional Collaboratives for Excellence in Science and Mathematics TeachingTexas Regional Collaboratives for Excellence in Science and Mathematics Teaching
Educator Demographics - Teaching Level
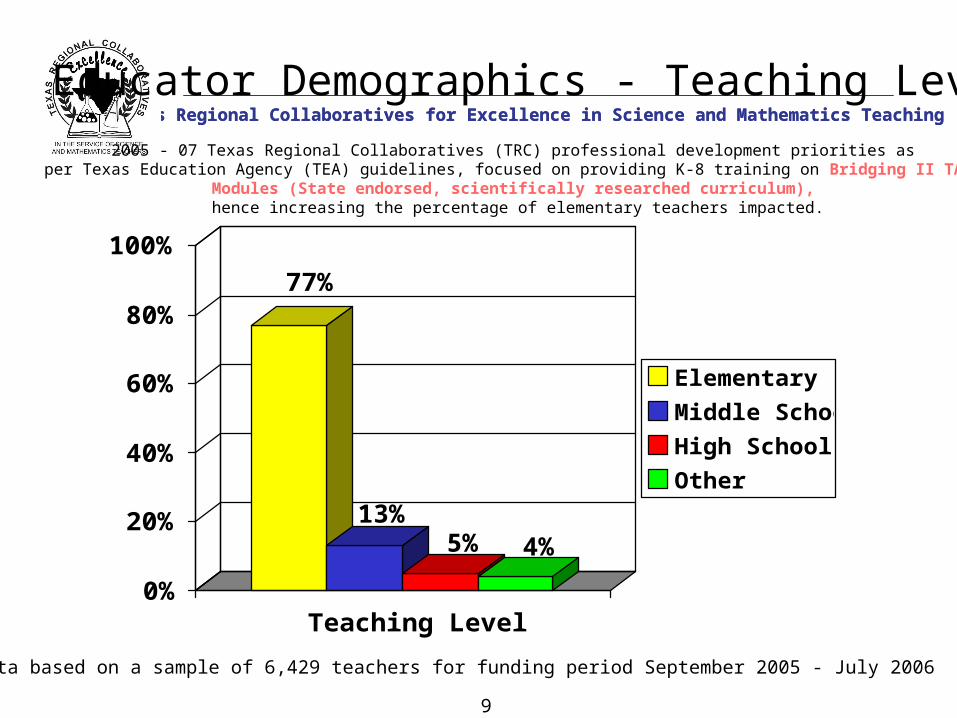
Data based on a sample of 6,429 teachers for funding period September 2005 - July 2006
77%
13%5% 4%
0%
20%
40%
60%
80%
100%
Teaching Level
Elementary
Middle School
High School
Other
2005 - 07 Texas Regional Collaboratives (TRC) professional development priorities as per Texas Education Agency (TEA) guidelines, focused on providing K-8 training on Bridging II TAKS
Modules (State endorsed, scientifically researched curriculum), hence increasing the percentage of elementary teachers impacted.
10
Texas Regional Collaboratives for Excellence in Science and Mathematics TeachingTexas Regional Collaboratives for Excellence in Science and Mathematics Teaching
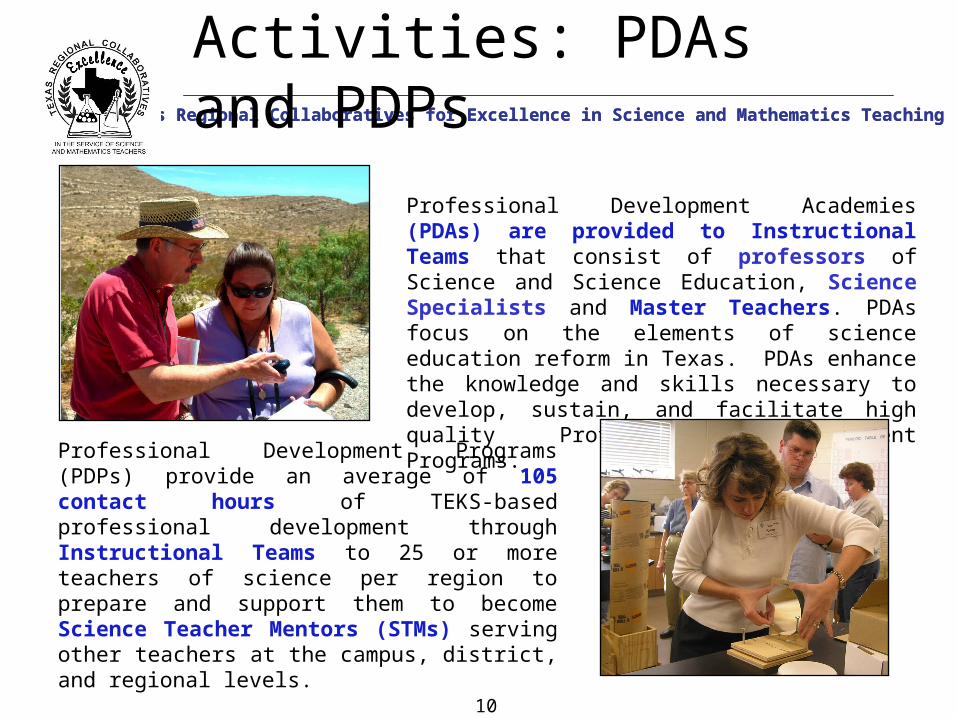
Activities: PDAs and PDPs
Professional Development Programs (PDPs) provide an average of 105 contact hours of TEKS-based professional development through Instructional Teams to 25 or more teachers of science per region to prepare and support them to become Science Teacher Mentors (STMs) serving other teachers at the campus, district, and regional levels.
Professional Development Academies (PDAs) are provided to Instructional Teams that consist of professors of Science and Science Education, Science Specialists and Master Teachers. PDAs focus on the elements of science education reform in Texas. PDAs enhance the knowledge and skills necessary to develop, sustain, and facilitate high quality Professional Development Programs.
11
Texas Regional Collaboratives for Excellence in Science and Mathematics TeachingTexas Regional Collaboratives for Excellence in Science and Mathematics Teaching
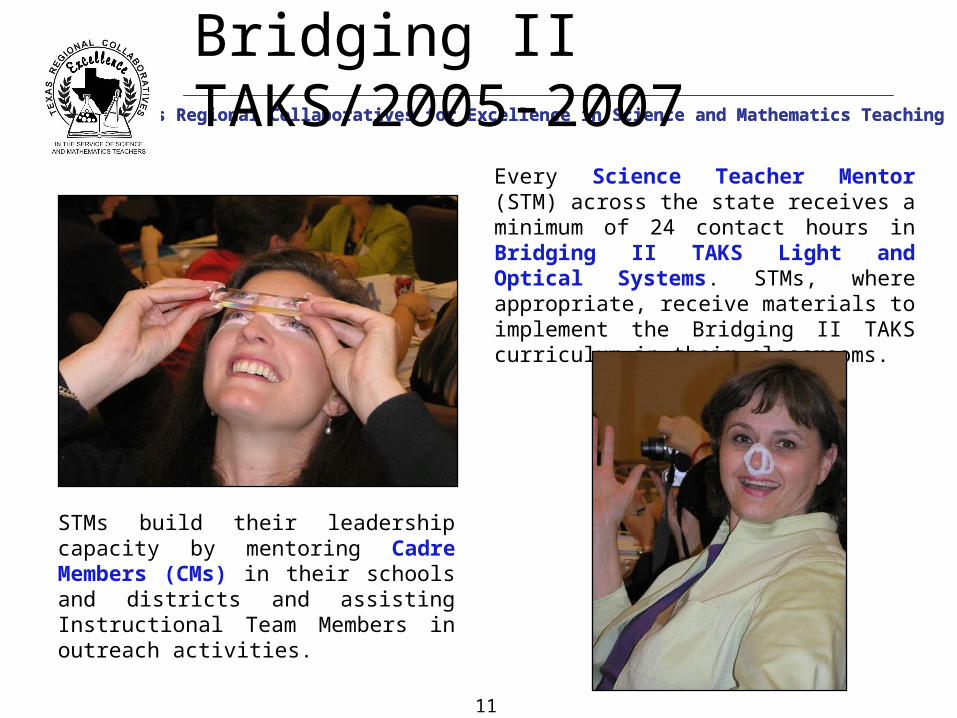
Bridging II TAKS/2005-2007
STMs build their leadership capacity by mentoring Cadre Members (CMs) in their schools and districts and assisting Instructional Team Members in outreach activities.
Every Science Teacher Mentor (STM) across the state receives a minimum of 24 contact hours in Bridging II TAKS Light and Optical Systems. STMs, where appropriate, receive materials to implement the Bridging II TAKS curriculum in their classrooms.

12
Texas Regional Collaboratives for Excellence in Science and Mathematics TeachingTexas Regional Collaboratives for Excellence in Science and Mathematics Teaching
PDA Schedule 2006-07
Dates Title
August 27-30, 2006 GLOBE Program Trainer of Trainers
October 19-20, 2006 Earth Science Revolution I PDA
November 16-17, 2006 Earth Science Revolution II PDA
November 29-30, 2006 Earth Science Revolution III PDA
February 12, 2007 Texas Science Diagnostic PDA
March 12-13, 2007 Viewing Earth From Space PDA
March 23-24, 2007 EC Science
July 16 – 20, 2007
July 30 – August 1, 2007
Physics
July 30 – August 1, 2007
August 6 - 8, 2007
K-8 Geosciences
MarkYour
Calendar!
13
Texas Regional Collaboratives for Excellence in Science and Mathematics TeachingTexas Regional Collaboratives for Excellence in Science and Mathematics Teaching
Mathematics Regional Collaboratives
• TMT3 – Teaching Math TEKS through Technology
• MTR – Math TEKS Refinement
• MTC – Math TEKS Connections
• MAP – Math Achievement Project
• MELL – Math for English Language Learners
• Twenty Regional Collaboratives for Excellence in Mathematics Teaching
• Focused on training in five math modules developed in Texas with TEA support
• Activities began July 1, 2006
14
Texas Regional Collaboratives for Excellence in Science and Mathematics TeachingTexas Regional Collaboratives for Excellence in Science and Mathematics Teaching
Program Evaluation – Three Components
TRC program evaluation examines three primary areas of impact:
Teacher Science Content Knowledge
Teacher Practice
Student Achievement
15
Texas Regional Collaboratives for Excellence in Science and Mathematics TeachingTexas Regional Collaboratives for Excellence in Science and Mathematics Teaching
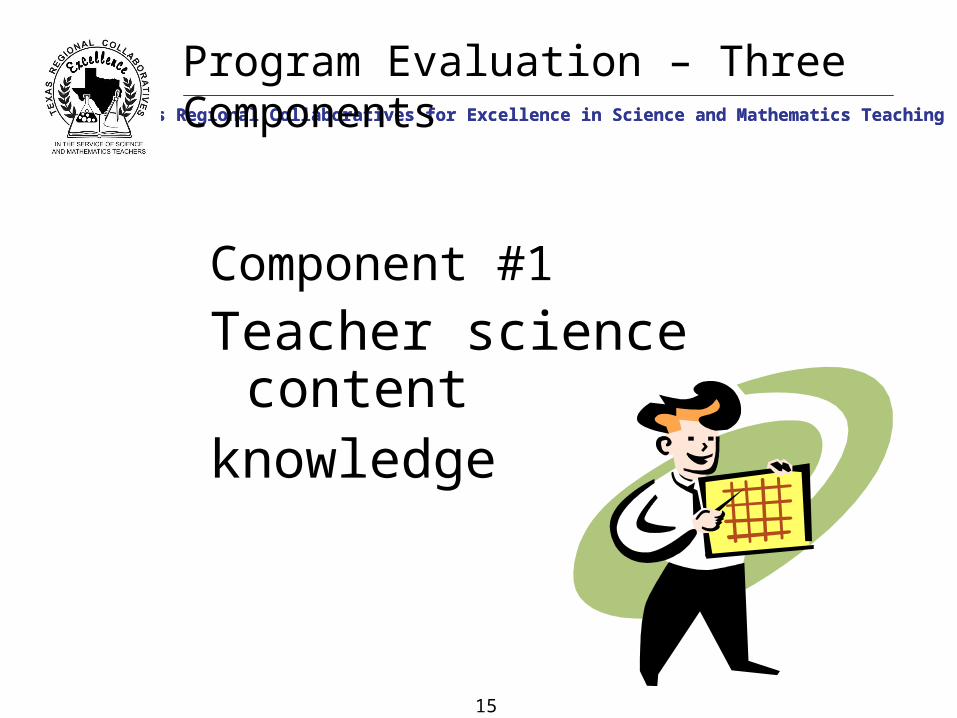
Program Evaluation – Three Components
Component #1
Teacher science content knowledge

16
Texas Regional Collaboratives for Excellence in Science and Mathematics TeachingTexas Regional Collaboratives for Excellence in Science and Mathematics Teaching
Impact on Teachers: Science Content Knowledge
Tests
52
83
0
20
40
60
80
100
Mean
sco
res
Texas Regional Collaboratives Overall Gains in Teacher Science Knowledge 2002-2003
Pretests
Posttests
Data represents combined mean scores of 12 different assessments, 8 Regional Collaborative Sites, and approximately 250 teachers.

17
Texas Regional Collaboratives for Excellence in Science and Mathematics TeachingTexas Regional Collaboratives for Excellence in Science and Mathematics Teaching
Statewide Impact on Teachers: Science Content Knowledge
60
84
0
20
40
60
80
100
Mea
n S
core
sAverage STM Science Content
Knowledge Gains 2005-06
Pre-test
Post-test
Summary of 21 different tests of science content knowledge administered to classroom teachers. Test content covered a range of topics including physics, chemistry, biology, earth science, and science process skills.

18
Texas Regional Collaboratives for Excellence in Science and Mathematics TeachingTexas Regional Collaboratives for Excellence in Science and Mathematics Teaching
Impact on Teachers: Physics Content Knowledge
Summary of results from a pre test and post test given to Instructional Team Members (ITMS) before and after training in a professional development module on Integrated Physics and Chemistry. ITMs were then responsible for training STMs in their respective Regional Collaboratives.
ITM Knowledge of Integrated Physics and Chemistry (2005)
81
89
50
60
70
80
90
100
Mea
n S
core
pre test
post test
19
Texas Regional Collaboratives for Excellence in Science and Mathematics TeachingTexas Regional Collaboratives for Excellence in Science and Mathematics Teaching
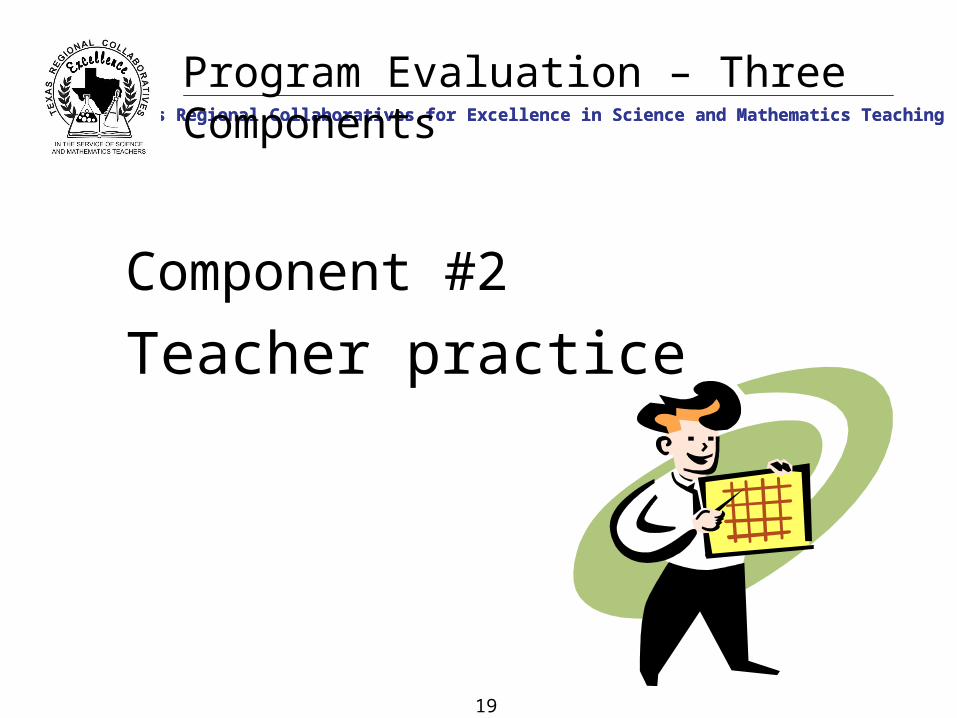
Program Evaluation – Three Components
Component #2
Teacher practice
20
Texas Regional Collaboratives for Excellence in Science and Mathematics TeachingTexas Regional Collaboratives for Excellence in Science and Mathematics Teaching
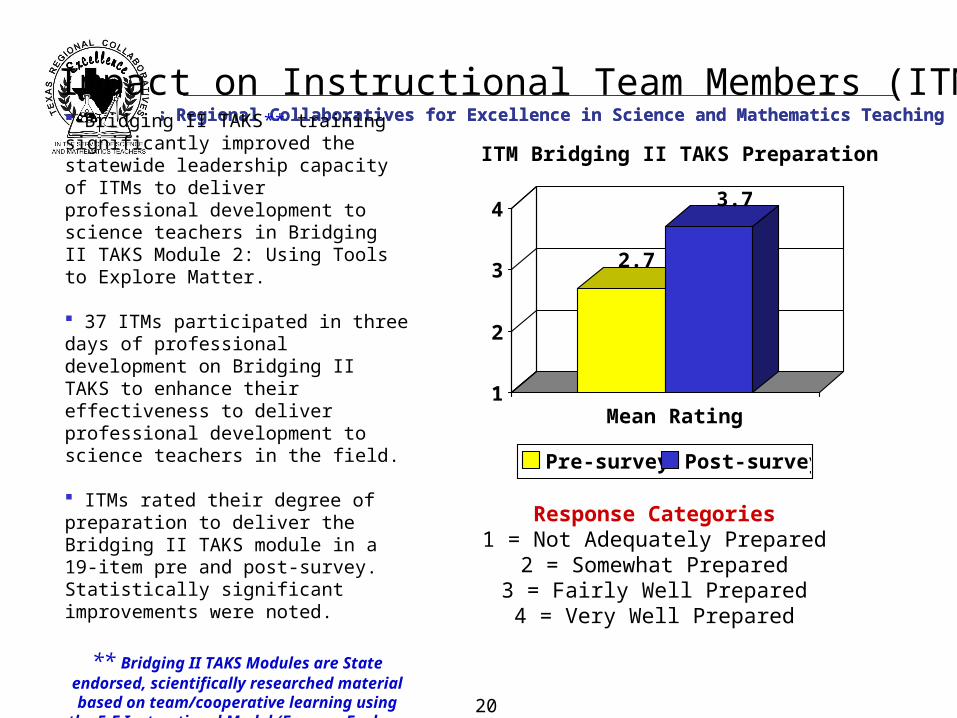
Impact on Instructional Team Members (ITMs)
Bridging II TAKS** training significantly improved the statewide leadership capacity of ITMs to deliver professional development to science teachers in Bridging II TAKS Module 2: Using Tools to Explore Matter.
37 ITMs participated in three days of professional development on Bridging II TAKS to enhance their effectiveness to deliver professional development to science teachers in the field.
ITMs rated their degree of preparation to deliver the Bridging II TAKS module in a 19-item pre and post-survey. Statistically significant improvements were noted.
** Bridging II TAKS Modules are State endorsed, scientifically researched material based on team/cooperative learning using
the 5-E Instructional Model (Engage, Explore, Explain, Elaborate, Evaluate)
2.7
3.7
1
2
3
4
Mean Rating
ITM Bridging II TAKS Preparation (2004)
Pre-survey Post-survey
Response Categories1 = Not Adequately Prepared
2 = Somewhat Prepared3 = Fairly Well Prepared4 = Very Well Prepared
21
Texas Regional Collaboratives for Excellence in Science and Mathematics TeachingTexas Regional Collaboratives for Excellence in Science and Mathematics Teaching
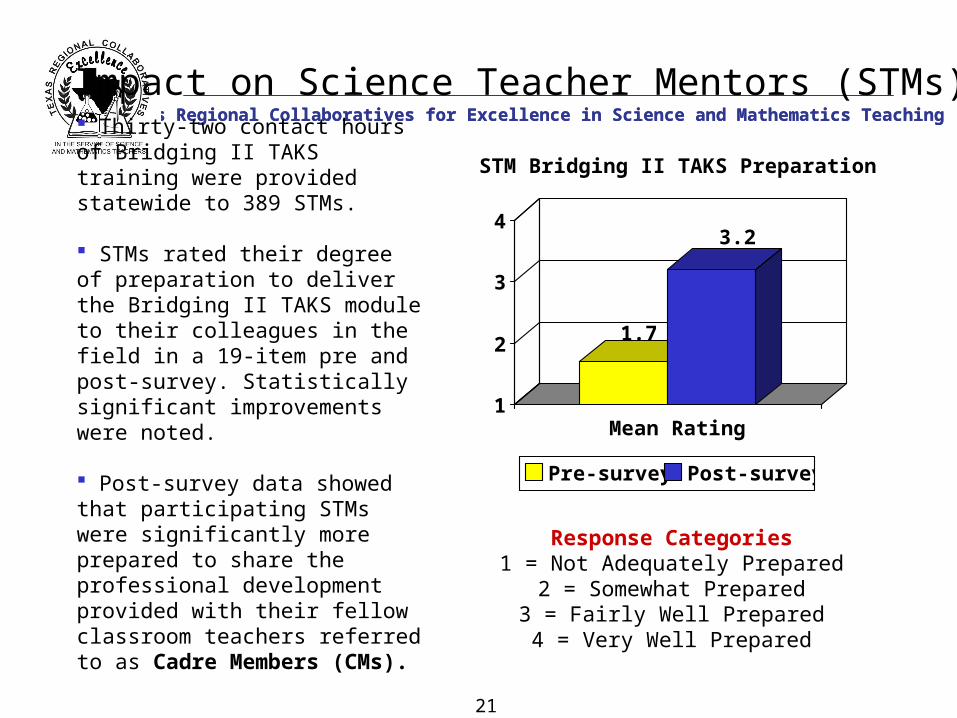
Impact on Science Teacher Mentors (STMs)
Thirty-two contact hours of Bridging II TAKS training were provided statewide to 389 STMs.
STMs rated their degree of preparation to deliver the Bridging II TAKS module to their colleagues in the field in a 19-item pre and post-survey. Statistically significant improvements were noted.
Post-survey data showed that participating STMs were significantly more prepared to share the professional development provided with their fellow classroom teachers referred to as Cadre Members (CMs).
1.7
3.2
1
2
3
4
Mean Rating
STM Bridging II TAKS Preparation (2004)
Pre-survey Post-survey
Response Categories1 = Not Adequately Prepared
2 = Somewhat Prepared3 = Fairly Well Prepared4 = Very Well Prepared
22
Texas Regional Collaboratives for Excellence in Science and Mathematics TeachingTexas Regional Collaboratives for Excellence in Science and Mathematics Teaching
80
2011
89
0
20
40
60
80
100
Percent of Teachers
Pre-Survey Post-Survey
Improvement in Teacher Preparation to Provide Instruction in BIITAK 2004-05
Less than AdequatelyPrepared
Adequately or Very WellPrepared
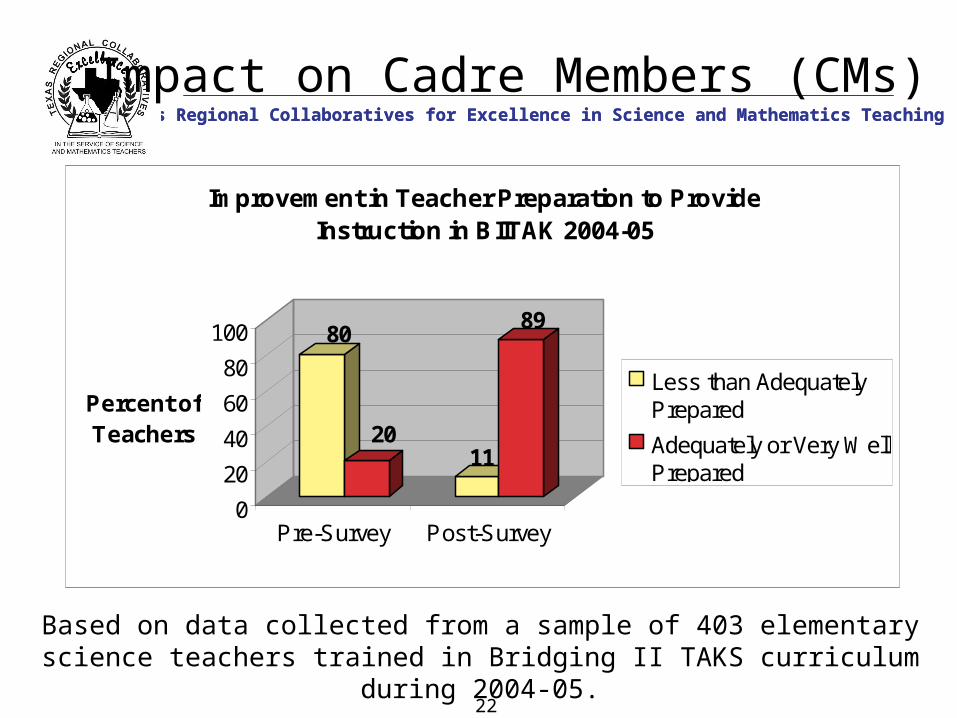
Impact on Cadre Members (CMs)
Based on data collected from a sample of 403 elementary science teachers trained in Bridging II TAKS curriculum during 2004-05.

23
Texas Regional Collaboratives for Excellence in Science and Mathematics TeachingTexas Regional Collaboratives for Excellence in Science and Mathematics Teaching
Impact on Science Teacher Mentors (STMs)
37
63
8
92
0
20
40
60
80
100
Per
cen
t o
f Te
ach
ers
Pre-survey Post-survey
Improvement in STM Preparation to Provide Instruction in BIITAKS 2005-06
Less than adequatelypreparedAdequately or verywell prepared
Based on data collected from a sample of 493 K-8 science teachers trained in Bridging II TAKS curriculum during 2005-06.
24
Texas Regional Collaboratives for Excellence in Science and Mathematics TeachingTexas Regional Collaboratives for Excellence in Science and Mathematics Teaching
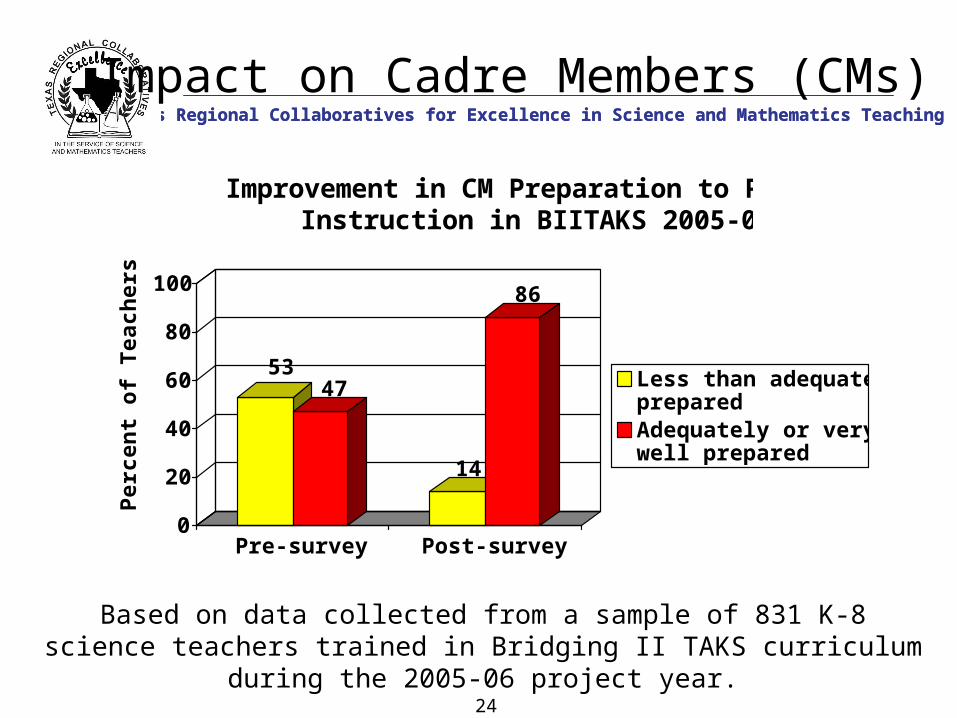
Impact on Cadre Members (CMs)
5347
14
86
0
20
40
60
80
100
Per
cen
t o
f Te
ach
ers
Pre-survey Post-survey
Improvement in CM Preparation to Provide Instruction in BIITAKS 2005-06
Less than adequatelypreparedAdequately or verywell prepared
Based on data collected from a sample of 831 K-8 science teachers trained in Bridging II TAKS curriculum during the 2005-06 project year.
25
Texas Regional Collaboratives for Excellence in Science and Mathematics TeachingTexas Regional Collaboratives for Excellence in Science and Mathematics Teaching
Program Evaluation – Three Components
Component #3
Student Achievement
26
Texas Regional Collaboratives for Excellence in Science and Mathematics TeachingTexas Regional Collaboratives for Excellence in Science and Mathematics Teaching
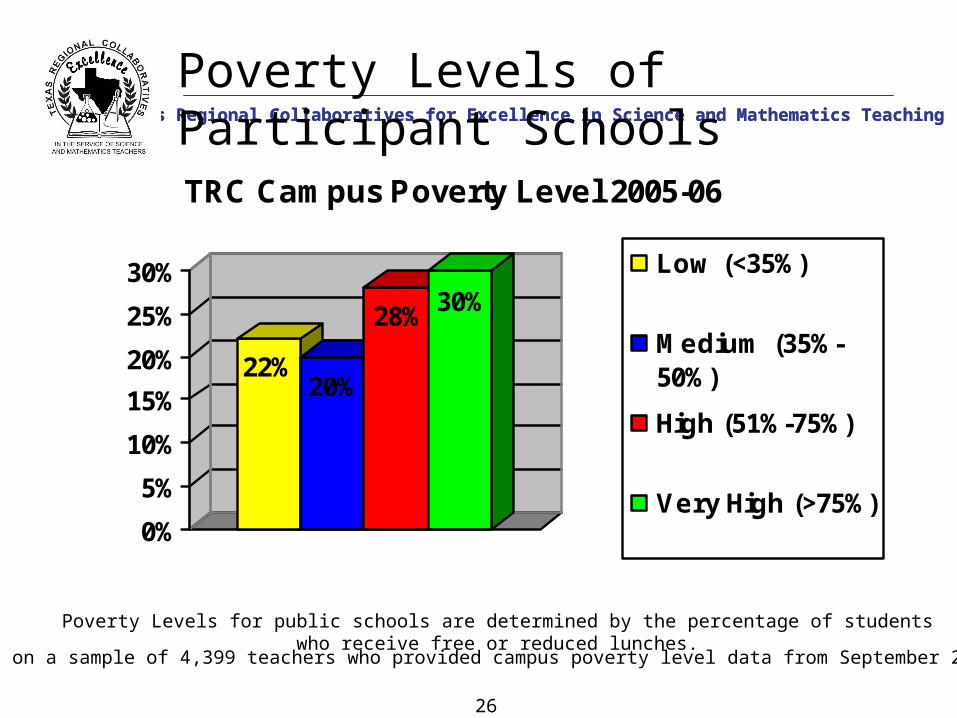
Poverty Levels of Participant Schools
Poverty Levels for public schools are determined by the percentage of students who receive free or reduced lunches.
Percentages based on a sample of 4,399 teachers who provided campus poverty level data from September 2005 – July 2006.
22%20%
28% 30%
0%
5%
10%
15%
20%
25%
30%
TRC Campus Poverty Level 2005-06
Low (<35%)
Medium (35%-50%)
High (51%-75%)
Very High (>75%)

27
Texas Regional Collaboratives for Excellence in Science and Mathematics TeachingTexas Regional Collaboratives for Excellence in Science and Mathematics Teaching
Title I Status of Participating Campuses
Percentage of Teachers at Campuses Eligible for Title I Funding
Title I
Not Title I 79%
21%
Based on a sample of 6,450 Teachers reporting campus Title I status from September 2005 - July 2006
28
Texas Regional Collaboratives for Excellence in Science and Mathematics TeachingTexas Regional Collaboratives for Excellence in Science and Mathematics Teaching
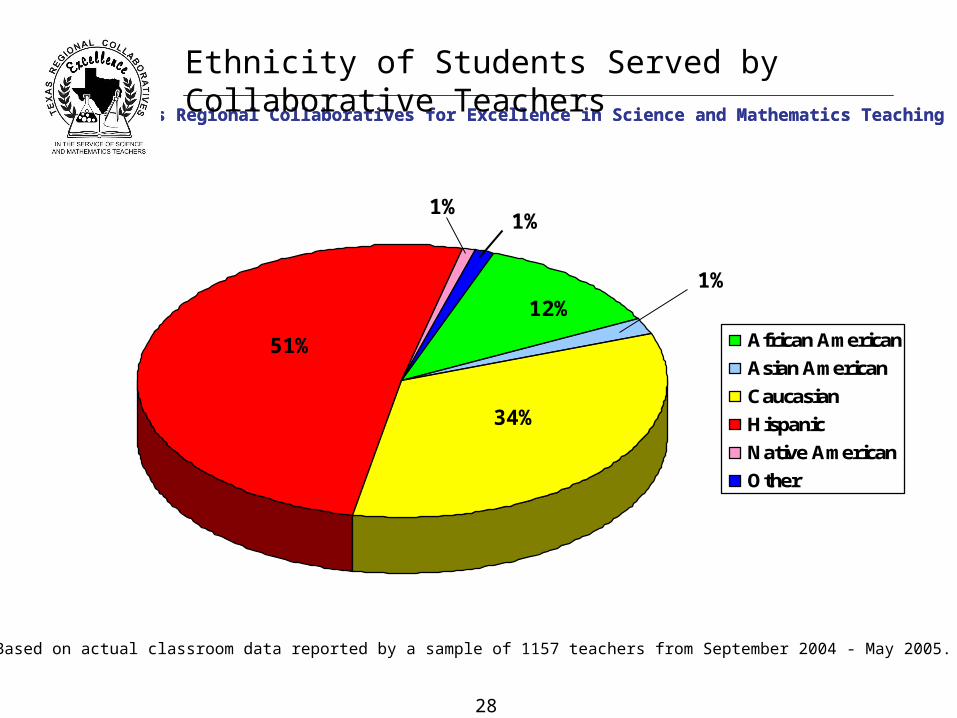
Ethnicity of Students Served by Collaborative Teachers
African American
Asian American
Caucasian
Hispanic
Native American
Other
12%
34%
51%
1%
Based on actual classroom data reported by a sample of 1157 teachers from September 2004 - May 2005.
1%
1%
29
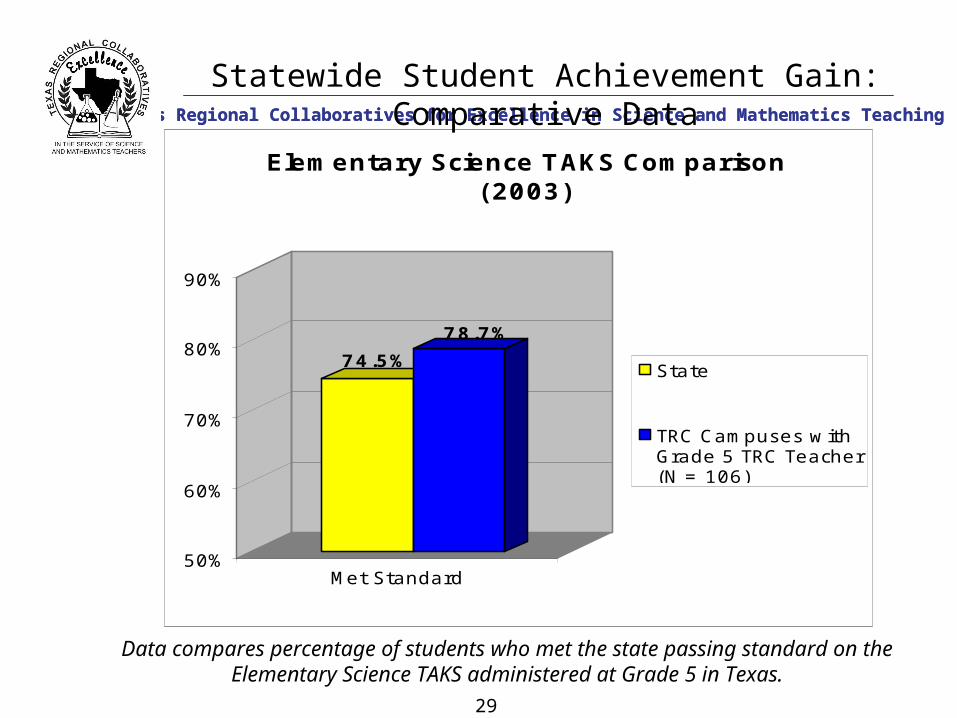
Texas Regional Collaboratives for Excellence in Science and Mathematics TeachingTexas Regional Collaboratives for Excellence in Science and Mathematics Teaching
74.5%
78.7%
50%
60%
70%
80%
90%
Met Standard
Elementary Science TAKS Comparison (2003)
State
TRC Campuses withGrade 5 TRC Teacher(N = 106)
Statewide Student Achievement Gain: Comparative Data
Data compares percentage of students who met the state passing standard on the Elementary Science TAKS administered at Grade 5 in Texas.
30
Texas Regional Collaboratives for Excellence in Science and Mathematics TeachingTexas Regional Collaboratives for Excellence in Science and Mathematics Teaching
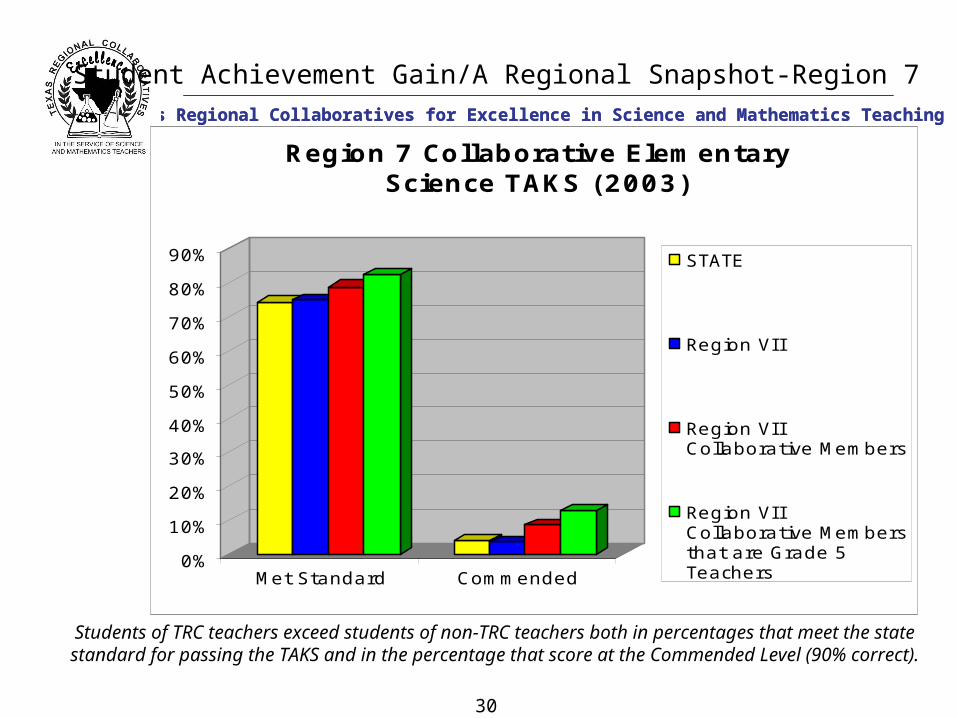
Student Achievement Gain/A Regional Snapshot-Region 7
0%
10%
20%
30%
40%
50%
60%
70%
80%
90%
Met Standard Commended
Region 7 Collaborative Elementary Science TAKS (2003)
STATE
Region VI I
Region VI ICollaborative Members
Region VI ICollaborative Membersthat are Grade 5Teachers
Students of TRC teachers exceed students of non-TRC teachers both in percentages that meet the state standard for passing the TAKS and in the percentage that score at the Commended Level (90% correct).
31
Texas Regional Collaboratives for Excellence in Science and Mathematics TeachingTexas Regional Collaboratives for Excellence in Science and Mathematics Teaching
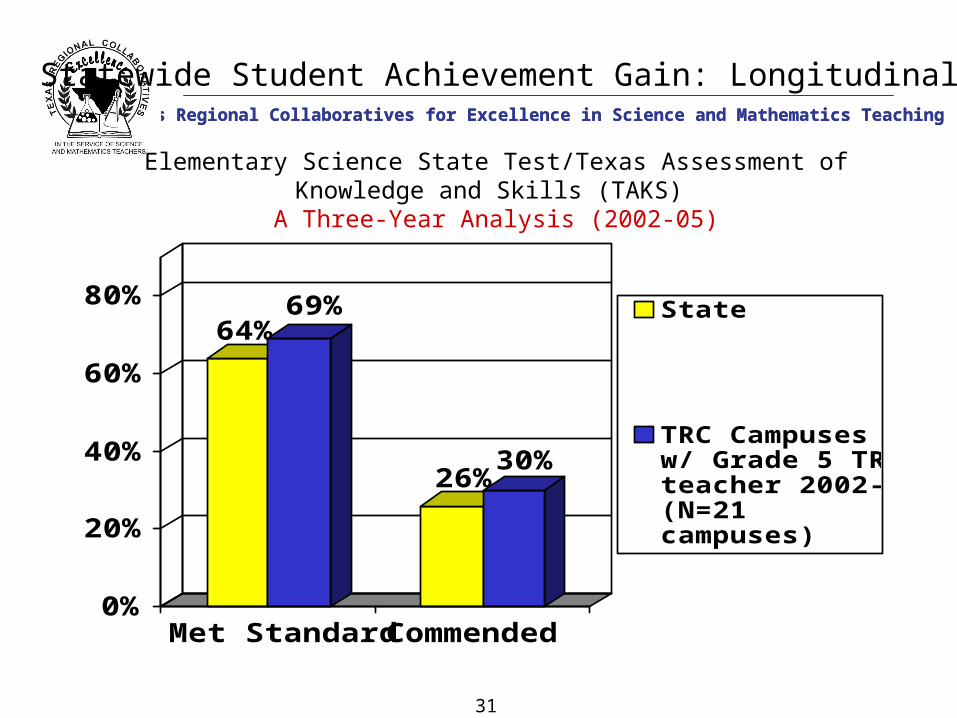
Statewide Student Achievement Gain: Longitudinal Data
64%69%
26%30%
0%
20%
40%
60%
80%
Met Standard Commended
State
TRC Campusesw/ Grade 5 TRCteacher 2002-05(N=21campuses)
Elementary Science State Test/Texas Assessment of Knowledge and Skills (TAKS)
A Three-Year Analysis (2002-05)
32
Texas Regional Collaboratives for Excellence in Science and Mathematics TeachingTexas Regional Collaboratives for Excellence in Science and Mathematics Teaching
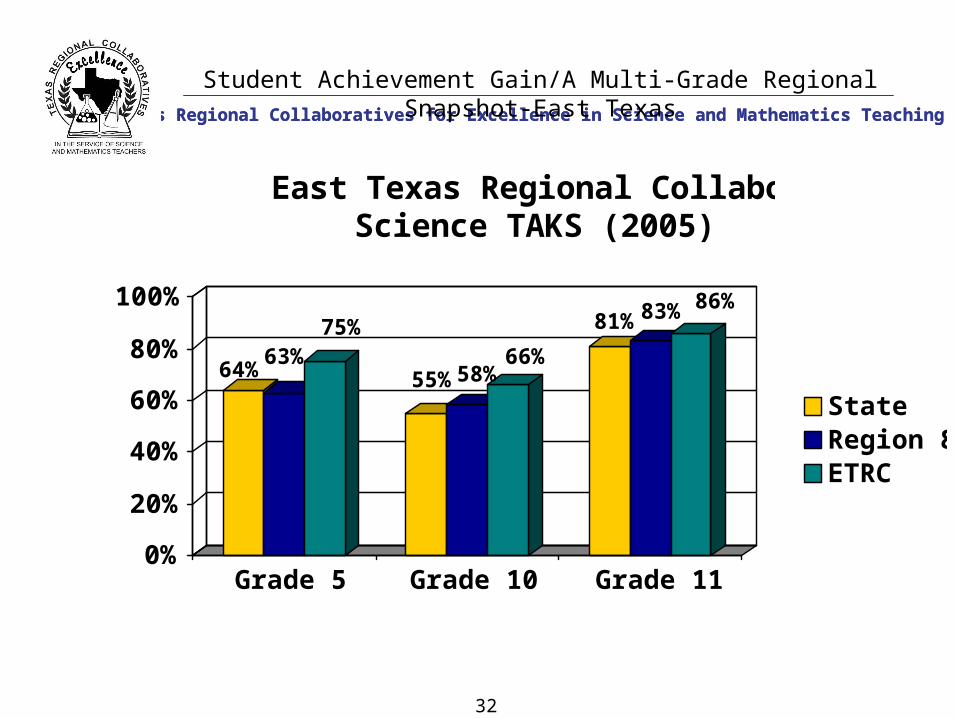
Student Achievement Gain/A Multi-Grade Regional Snapshot-East Texas
64%63%
75%
55%58%66%
81% 83% 86%
0%
20%
40%
60%
80%
100%
Grade 5 Grade 10 Grade 11
East Texas Regional Collaborative Science TAKS (2005)
StateRegion 8ETRC
33
Texas Regional Collaboratives for Excellence in Science and Mathematics TeachingTexas Regional Collaboratives for Excellence in Science and Mathematics Teaching
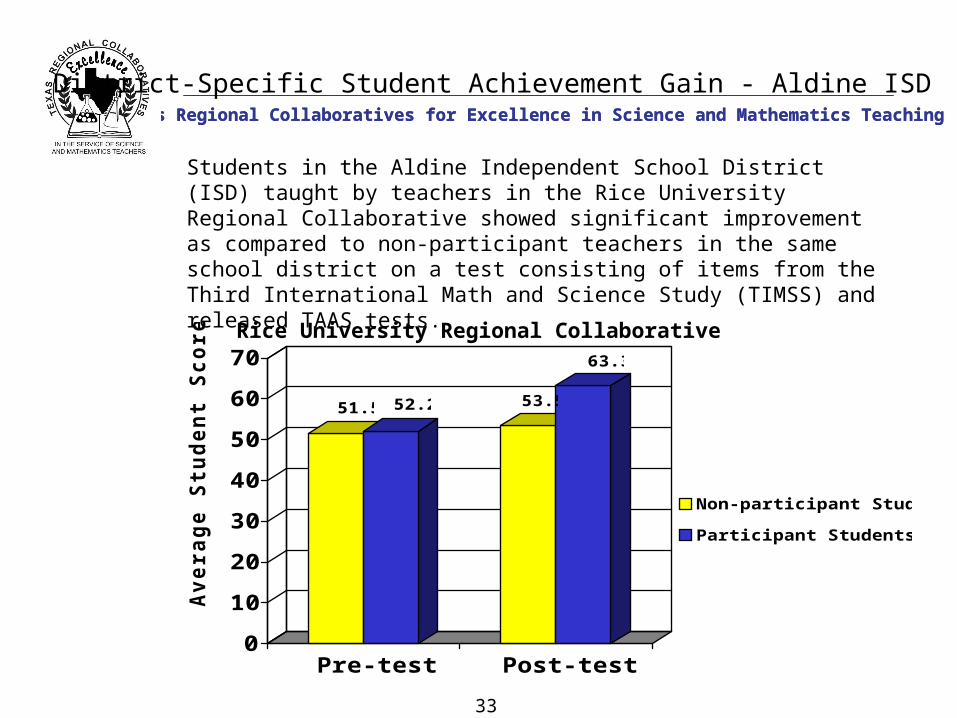
Students in the Aldine Independent School District (ISD) taught by teachers in the Rice University Regional Collaborative showed significant improvement as compared to non-participant teachers in the same school district on a test consisting of items from the Third International Math and Science Study (TIMSS) and released TAAS tests.
District-Specific Student Achievement Gain - Aldine ISD
51.5 52.2 53.5
63.3
0
10
20
30
40
50
60
70
Av
era
ge
Stu
de
nt
Sc
ore
Pre-test Post-test
Non-participant Students
Participant Students
Rice University Regional Collaborative

34
Texas Regional Collaboratives for Excellence in Science and Mathematics TeachingTexas Regional Collaboratives for Excellence in Science and Mathematics Teaching
TAKS Improvements for AISD/TRC/AMD Focus Schools
010203040506070
2005 2006
TAKS Administration
Pe
rce
nt
Me
eti
ng
S
tan
da
rd
AISD/AMDFocusSchools
All AISDSchools
District-Specific Student Achievement Gain - Austin ISD
CLOSING THE GAP: 25 Austin Independent School District (AISD) schools that received intervention through the support of the TRC and Advanced Micro Devices (AMD) posted significantly greater gains on the elementary TAKS test than other AISD schools. TRC support contributed to closing the gap in achievement between these high poverty, high minority schools and the rest of the district.
35
Texas Regional Collaboratives for Excellence in Science and Mathematics TeachingTexas Regional Collaboratives for Excellence in Science and Mathematics Teaching
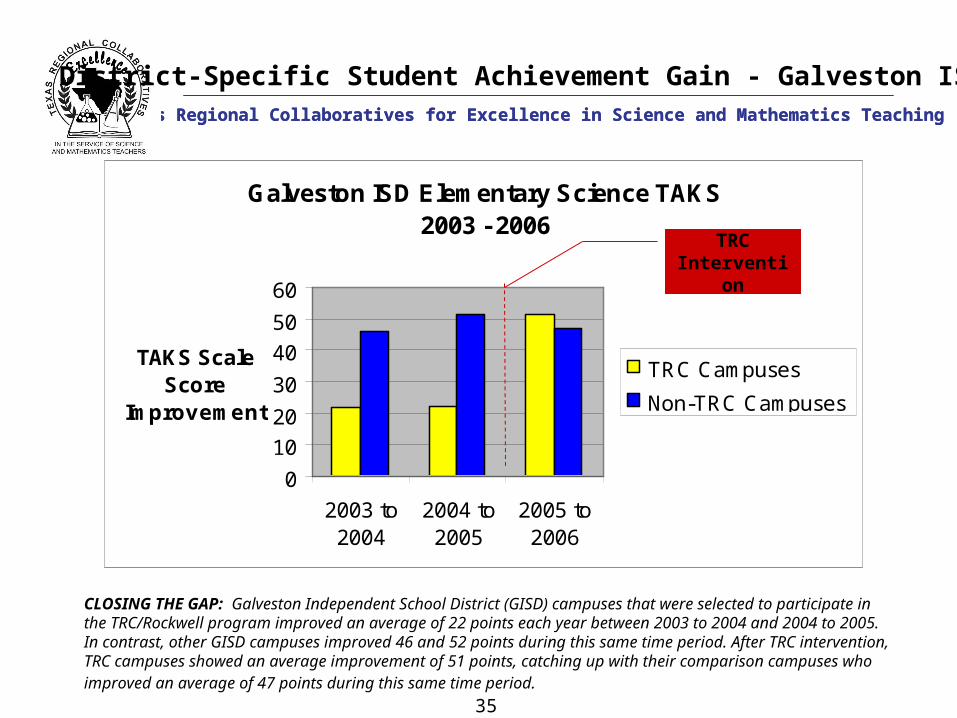
Galveston ISD Elementary Science TAKS 2003 - 2006
0
10
20
30
40
50
60
2003 to2004
2004 to2005
2005 to2006
TAKS Scale Score
Improvement
TRC Campuses
Non-TRC Campuses
CLOSING THE GAP: Galveston Independent School District (GISD) campuses that were selected to participate in the TRC/Rockwell program improved an average of 22 points each year between 2003 to 2004 and 2004 to 2005. In contrast, other GISD campuses improved 46 and 52 points during this same time period. After TRC intervention, TRC campuses showed an average improvement of 51 points, catching up with their comparison campuses who improved an average of 47 points during this same time period.
TRC Intervention
District-Specific Student Achievement Gain - Galveston ISD
36
Texas Regional Collaboratives for Excellence in Science and Mathematics TeachingTexas Regional Collaboratives for Excellence in Science and Mathematics Teaching
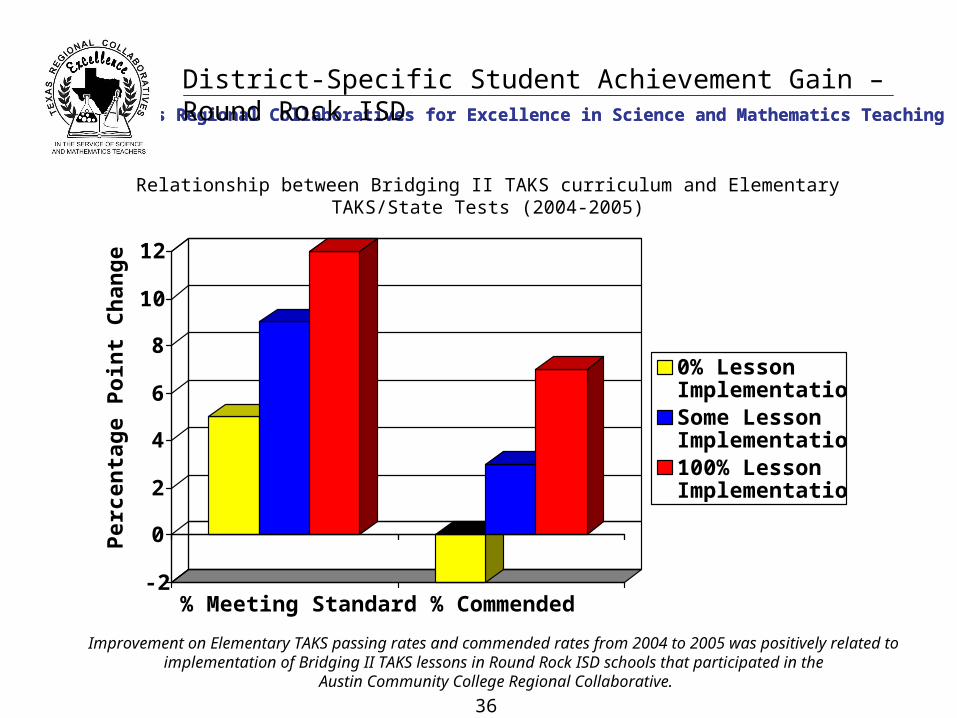
District-Specific Student Achievement Gain – Round Rock ISD
-2
0
2
4
6
8
10
12
Per
cen
tag
e P
oin
t C
han
ge
% Meeting Standard % Commended
0% LessonImplementationSome LessonImplementation100% LessonImplementation
Improvement on Elementary TAKS passing rates and commended rates from 2004 to 2005 was positively related to implementation of Bridging II TAKS lessons in Round Rock ISD schools that participated in the
Austin Community College Regional Collaborative.
Relationship between Bridging II TAKS curriculum and Elementary TAKS/State Tests (2004-2005)

37
Texas Regional Collaboratives for Excellence in Science and Mathematics TeachingTexas Regional Collaboratives for Excellence in Science and Mathematics Teaching
Preliminary 2007 Science TAKS Data for Collaborative Schools
TAKS 2005
% Mtg Standards
TAKS 2006
% Mtg Standards
TAKS 2007
% Mtg Standards
TAKS 2005
% Com- mended
TAKS 2006
% Com- mended
TAKS 2007
% Com-mended
67% 68%
72%
18% 18% 27% Schools in 1st year of
participation +1 +4 +0 +9
84%
92%
93% 46% 48% 59% Schools in 2nd year of
participation +8 +1 +2 +11
73%
81%
83%
35%
36%
44%
Collaborative
Schools +8 +2 +1 +8
Only seven schools from the current cohort were participating in the Collaborative in 2005.
Round Rock ISD: Two-Year TAKS Data
38
Texas Regional Collaboratives for Excellence in Science and Mathematics TeachingTexas Regional Collaboratives for Excellence in Science and Mathematics Teaching
Contact Information
• Kamil A. Jbeily, Ph.D. Executive Director Texas Regional Collaboratives 512-471-9460 [email protected]
• Carol L. Fletcher, Ph.D. Assistant Director/R&D Coordinator Texas Regional Collaboratives 512-232-5690 [email protected]
• Mary Hobbs, Ph.D. Coordinator for Science
Initiatives Texas
Regional Collaboratives 512-471-8729 [email protected]
www.theTRC.org

39
Texas Regional Collaboratives for Excellence in Science and Mathematics TeachingTexas Regional Collaboratives for Excellence in Science and Mathematics Teaching
Regional Dialogue Room Assignments
T-STEM Center Region Regional Collaboratives Room
El Centro del Futuro: ESC Region 1 in Edinburg, partnering with UT-Pan Am, 13 school districts, and the UT Dana Center
All Collaboratives in Region 1
Del Valle
Transformation 2013: ESC Region 13 in Austin, partnering with ESC Region 20 in San Antonio, the UT-Austin College of Engineering, San Antonio ISD, and Taylor ISD
All Collaboratives in Region 13 and 20
Chennault
North Texas STEM: Texas A&M, partnering with Dallas ISD, and ESC Region 10 in Richardson
All Collaboratives in Region 10
Lantana
Texas Tech T-STEM: Texas Tech, partnering with Lubbock ISD and ESC Regions 15, 16, 17, and 18, which are housed in San Angelo, Amarillo, Lubbock, and Midland
All Collaboratives in Regions 15 through 18
Del Valle
El Paso T-STEM: UT-El Paso partnering with 12 school districts in the El Paso area, and ESC Region 19 in El Paso
All Collaboratives in Region 19
Lantana
East Texas STEM: UT-Tyler partnering with ESC Regions 6, 7, and 8 and Tyler ISD
All Collaboratives in Region 6 through 8
Del Valle
Southeast Regional T-STEM: UT-Medical Branch partnering with Galveston ISD and others in Region 3, 4, and 5
All Collaboratives in Region 3. 4, and 5
Chennault