Texas State University April 8, 2013 Round Rock, TX Applied Demography: Some Texas Examples.
Upload
april-dorseyCategory
view
216download
0
Texas Demography: Change,
Projections, and English Learners
Lloyd Potter
Texas Education Agency April 8, 2010
Sources of Growth
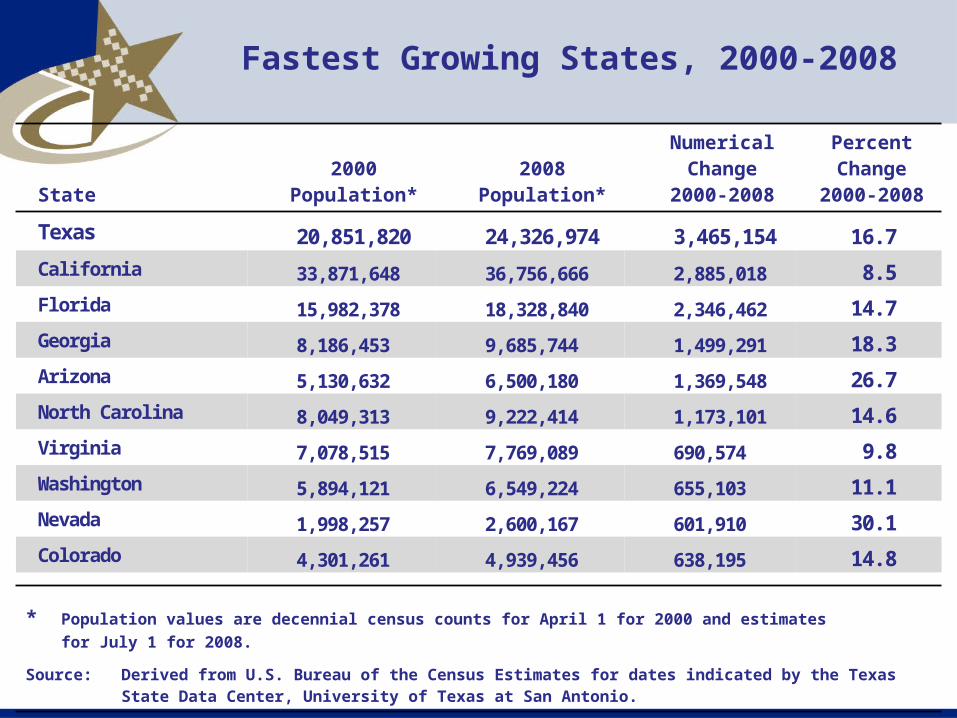
Fastest Growing States, 2000-2008
State2000
Population*2008
Population*
NumericalChange
2000-2008
PercentChange
2000-2008
Texas 20,851,820 24,326,974 3,465,154 16.7
California 33,871,648 36,756,666 2,885,018 8.5
Florida 15,982,378 18,328,840 2,346,462 14.7
Georgia 8,186,453 9,685,744 1,499,291 18.3
Arizona 5,130,632 6,500,180 1,369,548 26.7
North Carolina 8,049,313 9,222,414 1,173,101 14.6Virginia 7,078,515 7,769,089 690,574 9.8Washington 5,894,121 6,549,224 655,103 11.1Nevada 1,998,257 2,600,167 601,910 30.1Colorado 4,301,261 4,939,456 638,195 14.8
* Population values are decennial census counts for April 1 for 2000 and estimatesfor July 1 for 2008.
Source: Derived from U.S. Bureau of the Census Estimates for dates indicated by the Texas State Data Center, University of Texas at San Antonio.
Percent ChangeDue to
Year* PopulationNumerical
ChangeNatural
IncreaseNet
MigrationPercentChange
NaturalIncrease
NetMigration
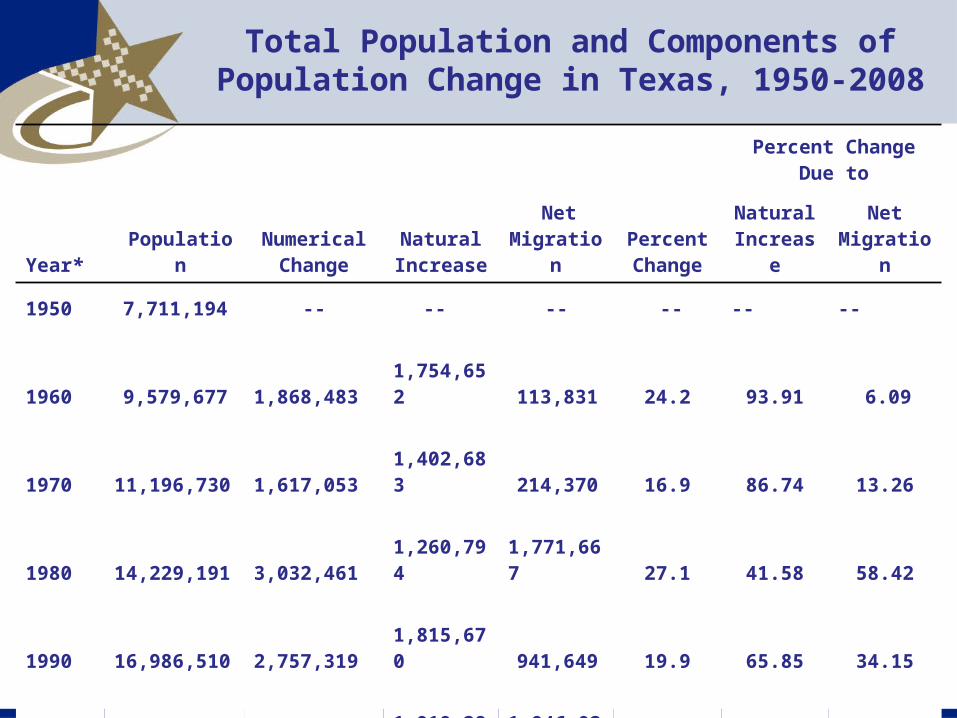
1950 7,711,194 -- -- -- -- -- --
1960 9,579,677 1,868,483 1,754,652 113,831 24.2 93.91 6.09
1970 11,196,730 1,617,053 1,402,683 214,370 16.9 86.74 13.26
1980 14,229,191 3,032,461 1,260,794 1,771,667 27.1 41.58 58.42
1990 16,986,510 2,757,319 1,815,670 941,649 19.9 65.85 34.15
2000 20,851,820 3,865,310 1,919,281 1,946,029 22.8 49.65 50.35
2008 24,326,974 3,475,154 1,884,947 1,563,694 16.7 54.20 45.00
* All values for the decennial dates are for the indicated census year. Values for 2008 is for July 1 as estimated by the U.S. Bureau of the Census.
Source: Derived from U.S. Bureau of the Census Estimates for dates indicated by the Texas State Data Center, University of Texas at San Antonio.
Total Population and Components of Population Change in Texas, 1950-2008
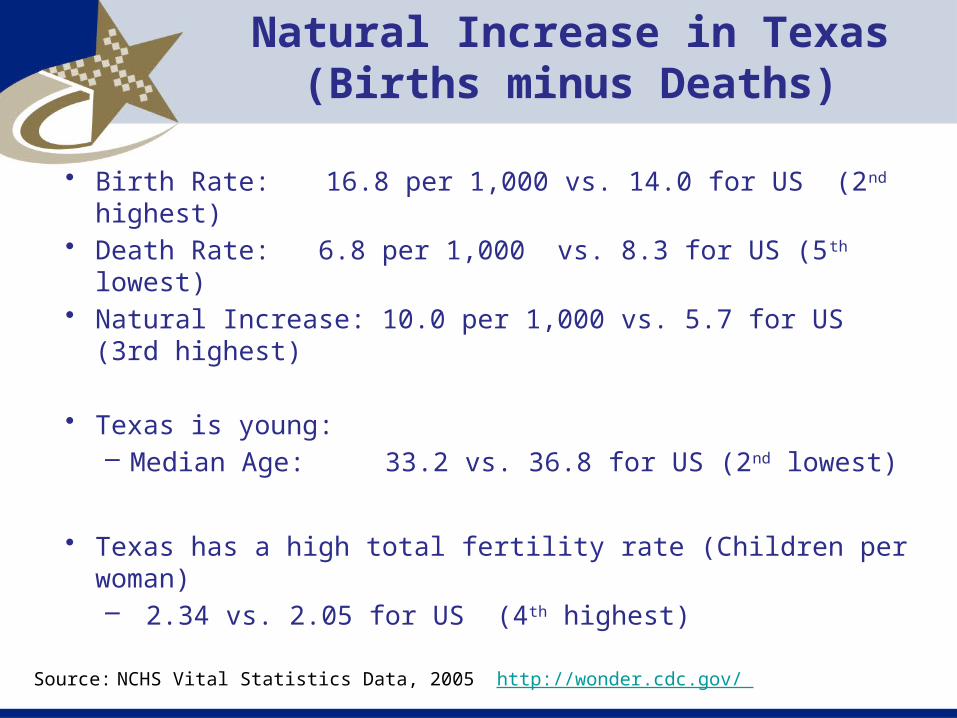
• Birth Rate: 16.8 per 1,000 vs. 14.0 for US (2nd highest)
• Death Rate: 6.8 per 1,000 vs. 8.3 for US (5th lowest)• Natural Increase: 10.0 per 1,000 vs. 5.7 for US (3rd
highest)
• Texas is young: – Median Age: 33.2 vs. 36.8 for US (2nd lowest)
• Texas has a high total fertility rate (Children per woman)– 2.34 vs. 2.05 for US (4th highest)
Source: NCHS Vital Statistics Data, 2005 http://wonder.cdc.gov/
Natural Increase in Texas(Births minus Deaths)
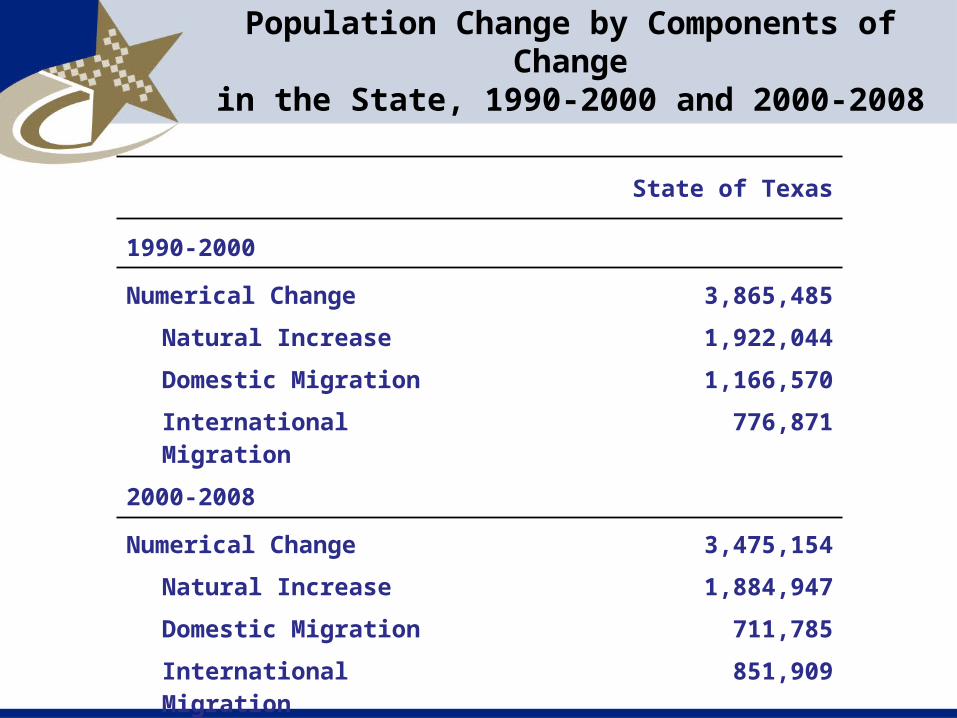
Population Change by Components of Changein the State, 1990-2000 and 2000-2008
State of Texas
1990-2000
Numerical Change 3,865,485
Natural Increase 1,922,044
Domestic Migration 1,166,570
International Migration 776,871
2000-2008
Numerical Change 3,475,154
Natural Increase 1,884,947
Domestic Migration 711,785
International Migration 851,909
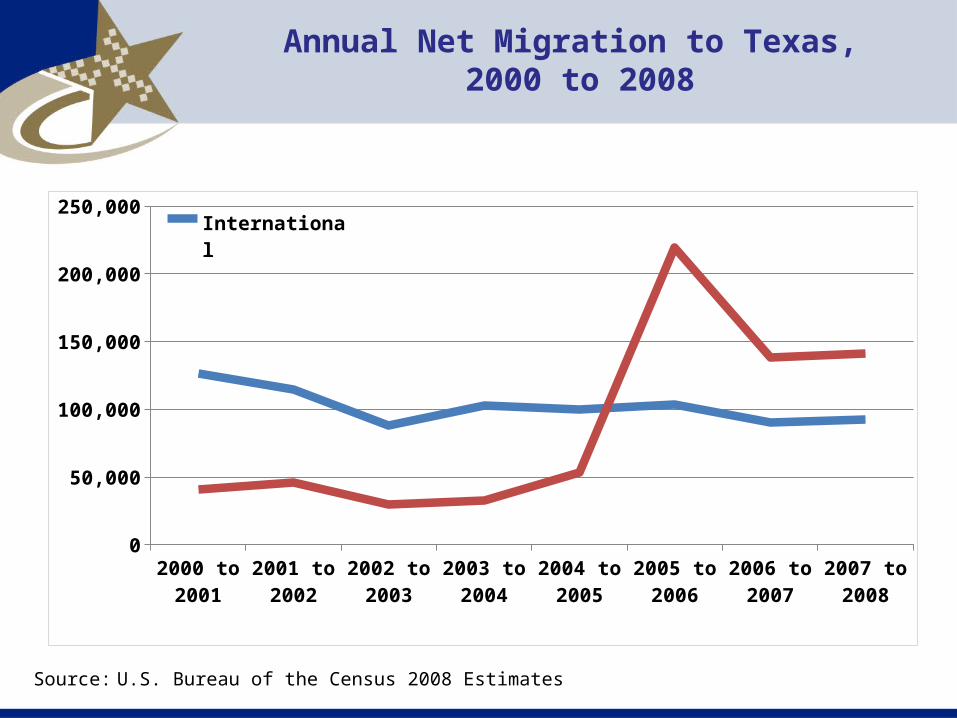
2000 to 2001
2001 to 2002
2002 to 2003
2003 to 2004
2004 to 2005
2005 to 2006
2006 to 2007
2007 to 2008
0
50,000
100,000
150,000
200,000
250,000InternationalState-to-State
Source: U.S. Bureau of the Census 2008 Estimates
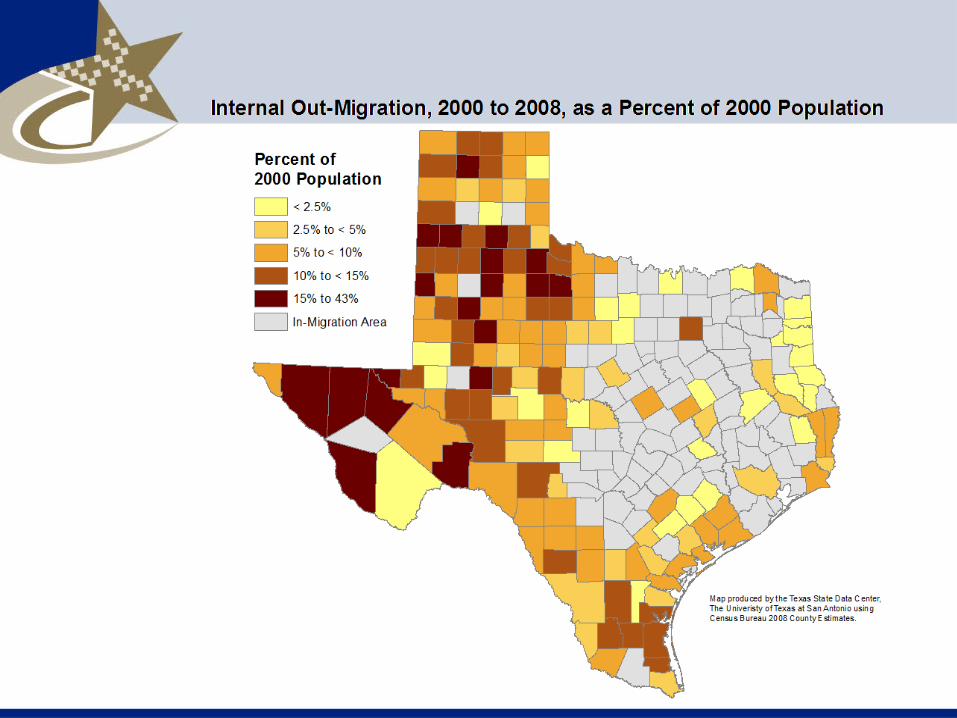
Annual Net Migration to Texas, 2000 to 2008
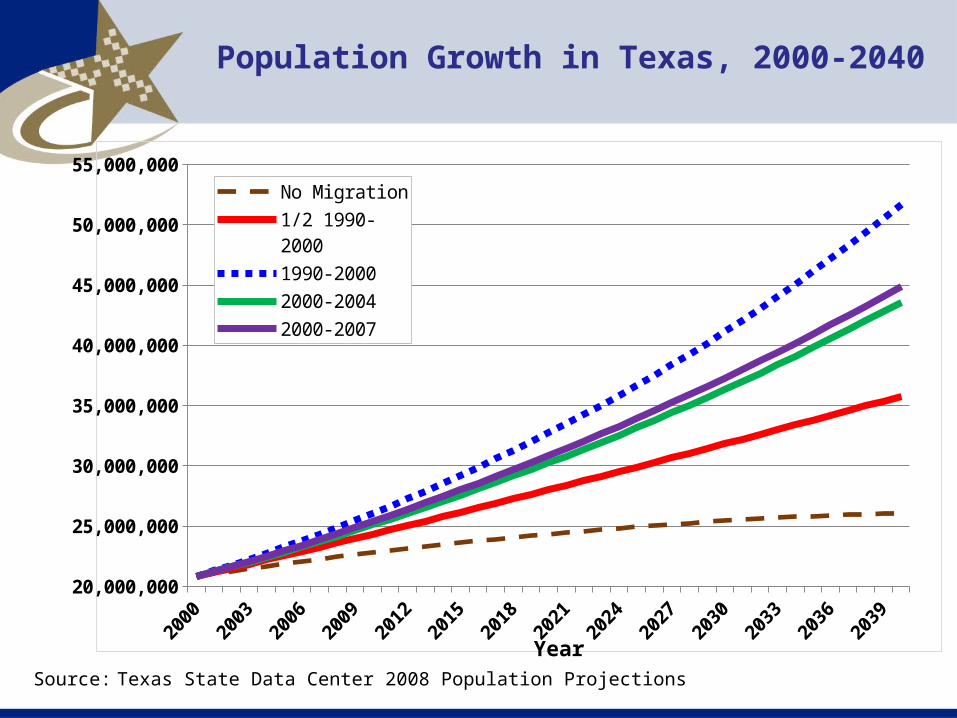
20,000,000
25,000,000
30,000,000
35,000,000
40,000,000
45,000,000
50,000,000
55,000,000
No Migration1/2 1990-20001990-20002000-20042000-2007
Source: Texas State Data Center 2008 Population Projections
Year
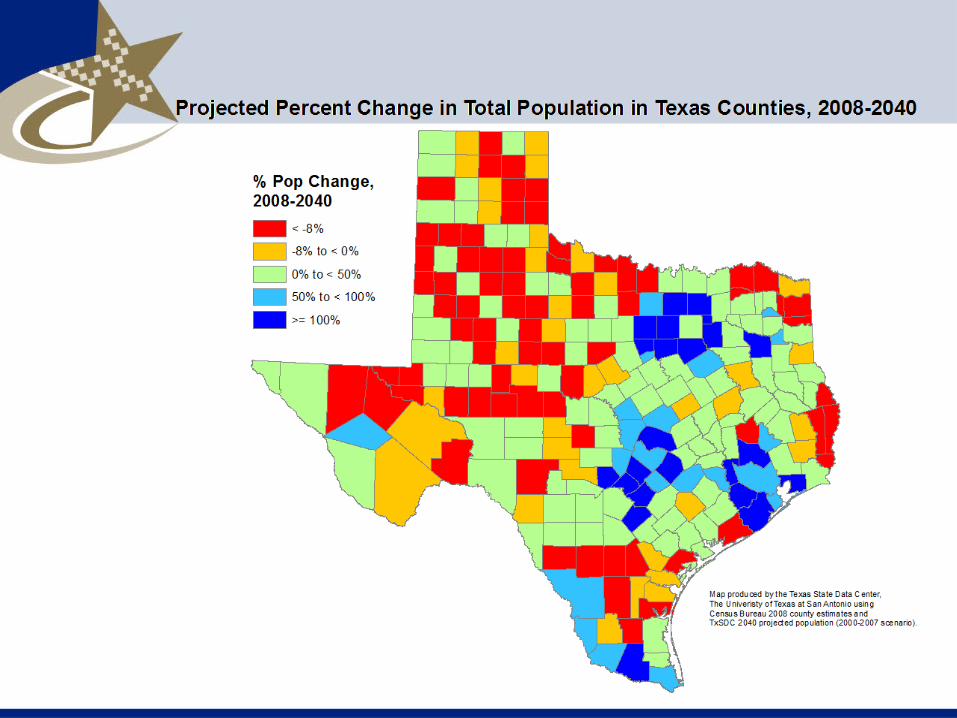
Population Growth in Texas, 2000-2040
Changes in Age Structure
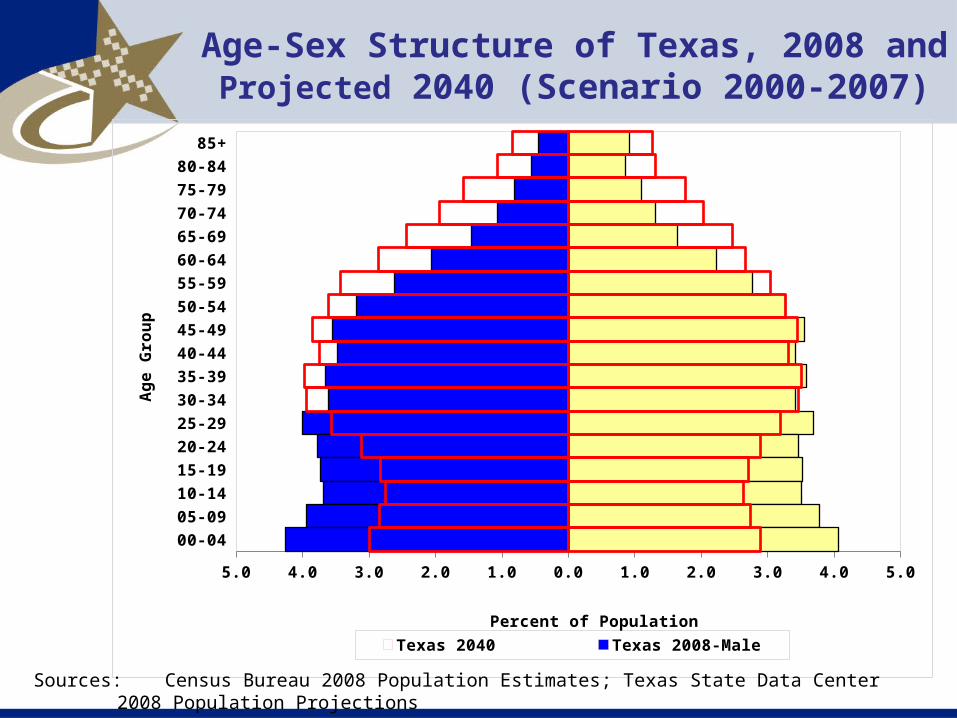
Age-Sex Structure of Texas, 2008 andProjected 2040 (Scenario 2000-2007)
00-04
05-09
10-14
15-19
20-24
25-29
30-34
35-39
40-44
45-49
50-54
55-59
60-64
65-69
70-74
75-79
80-84
85+
5.0 4.0 3.0 2.0 1.0 0.0 1.0 2.0 3.0 4.0 5.0
Texas 2040 Texas 2008-Male Texas 2008-Female
Percent of Population
Ag
e G
rou
p
Sources: Census Bureau 2008 Population Estimates; Texas State Data Center 2008 Population Projections
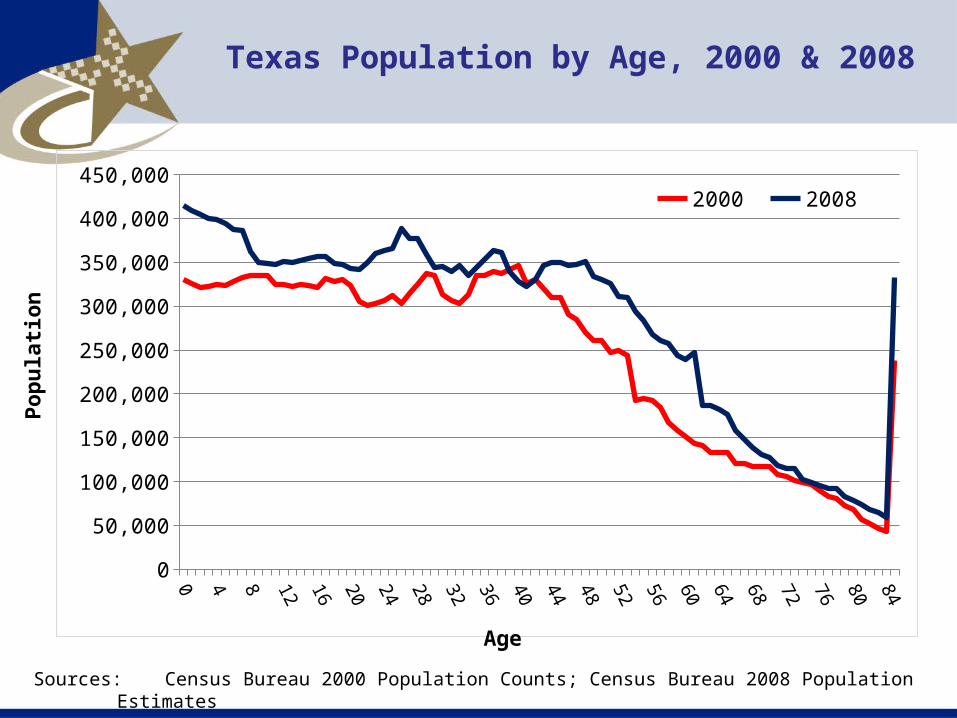
0 3 6 9 12 15 18 21 24 27 30 33 36 39 42 45 48 51 54 57 60 63 66 69 72 75 78 81 84
0
50,000
100,000
150,000
200,000
250,000
300,000
350,000
400,000
450,0002000 2008
Sources: Census Bureau 2000 Population Counts; Census Bureau 2008 Population Estimates
Age
Po
pu
lati
on
Texas Population by Age, 2000 & 2008
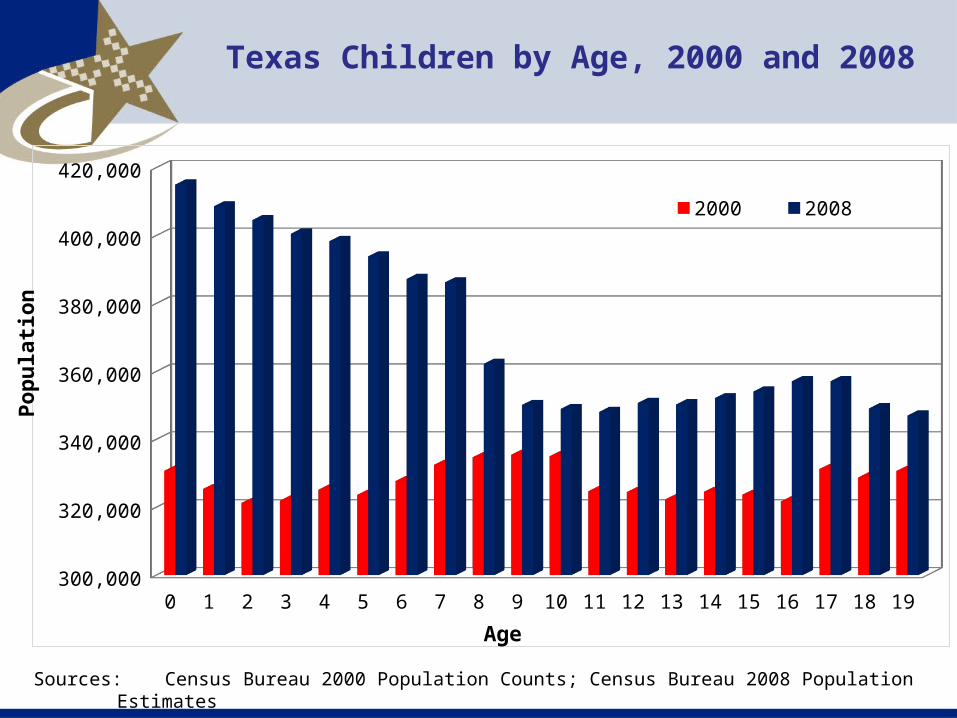
0 1 2 3 4 5 6 7 8 9 10 11 12 13 14 15 16 17 18 19300,000
320,000
340,000
360,000
380,000
400,000
420,000
2000 2008
Sources: Census Bureau 2000 Population Counts; Census Bureau 2008 Population Estimates
Po
pu
lati
on
Age
Texas Children by Age, 2000 and 2008
Changes in Ethnic Composition
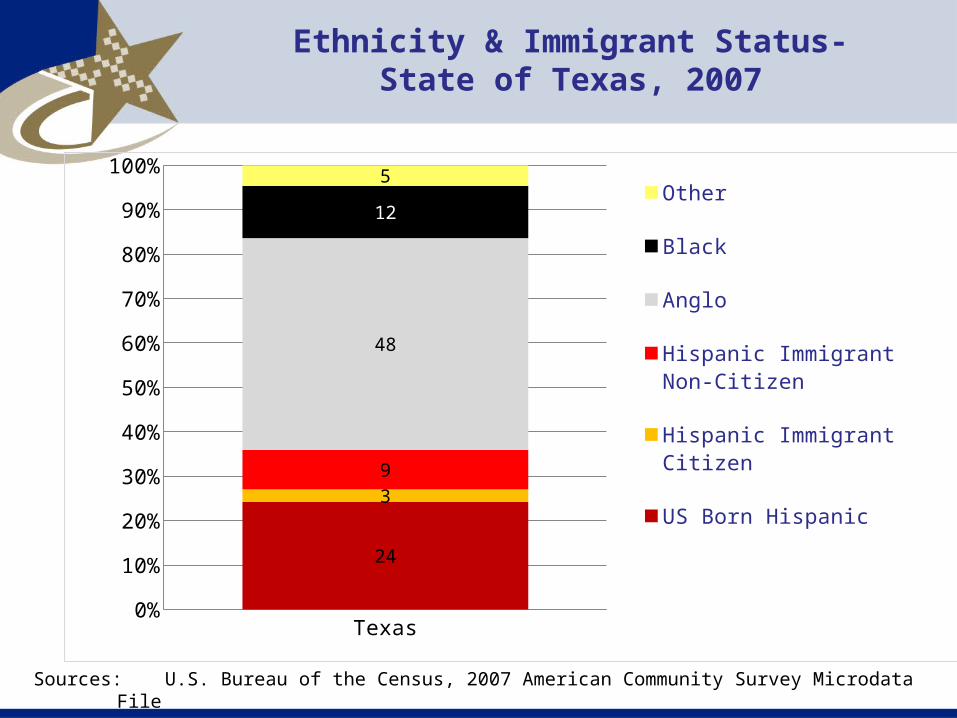
Texas0%
10%
20%
30%
40%
50%
60%
70%
80%
90%
100%
24
39
48
12
5Other
Black
Anglo
Hispanic Immigrant Non-Citizen
Hispanic Immigrant Cit-izen
US Born Hispanic
Sources: U.S. Bureau of the Census, 2007 American Community Survey Microdata File
Ethnicity & Immigrant Status-State of Texas, 2007
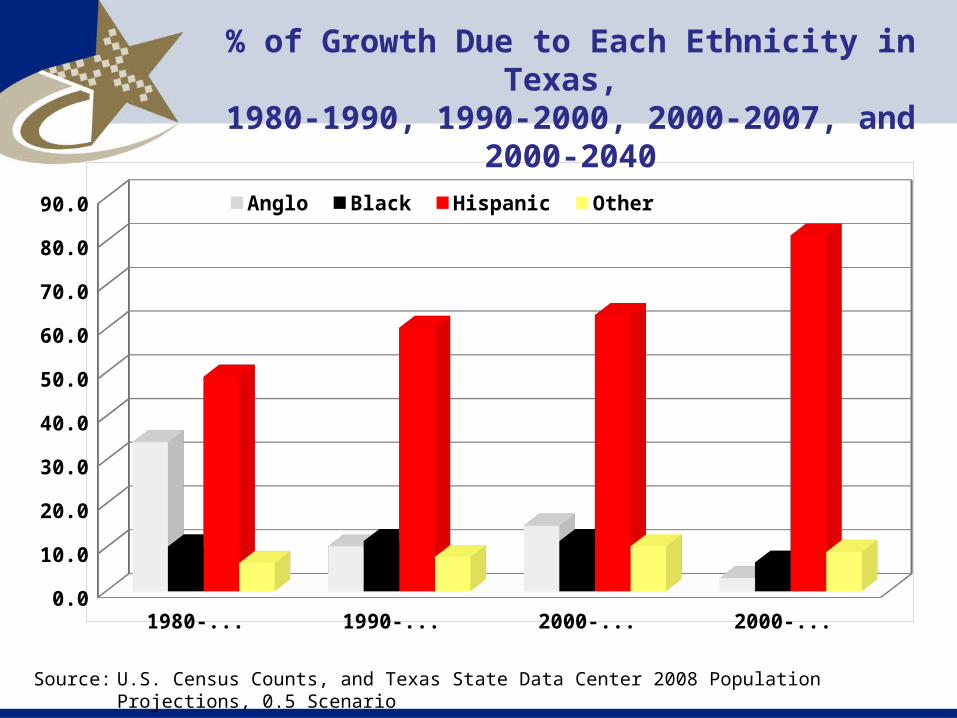
1980-1990 1990-2000 2000-2007 2000-20400.0
10.0
20.0
30.0
40.0
50.0
60.0
70.0
80.0
90.0 Anglo Black Hispanic Other
% of Growth Due to Each Ethnicity in Texas, 1980-1990, 1990-2000, 2000-2007, and 2000-2040
Source: U.S. Census Counts, and Texas State Data Center 2008 Population Projections, 0.5 Scenario

Projected Percent of Net Change Attributable to Each Race/Ethnicity Group for 2000-2040*
*Using U.S. Census count for 2000 and Texas State Data Center 1.0 population projection scenario for 2040.
Anglo4.2%
Black5.6%
Hispanic77.6%
Other12.6%
2000
2002
2004
2006
2008
2010
2012
2014
2016
2018
2020
2022
2024
2026
2028
2030
2032
2034
2036
2038
2040
0%
10%
20%
30%
40%
50%
60%
70%
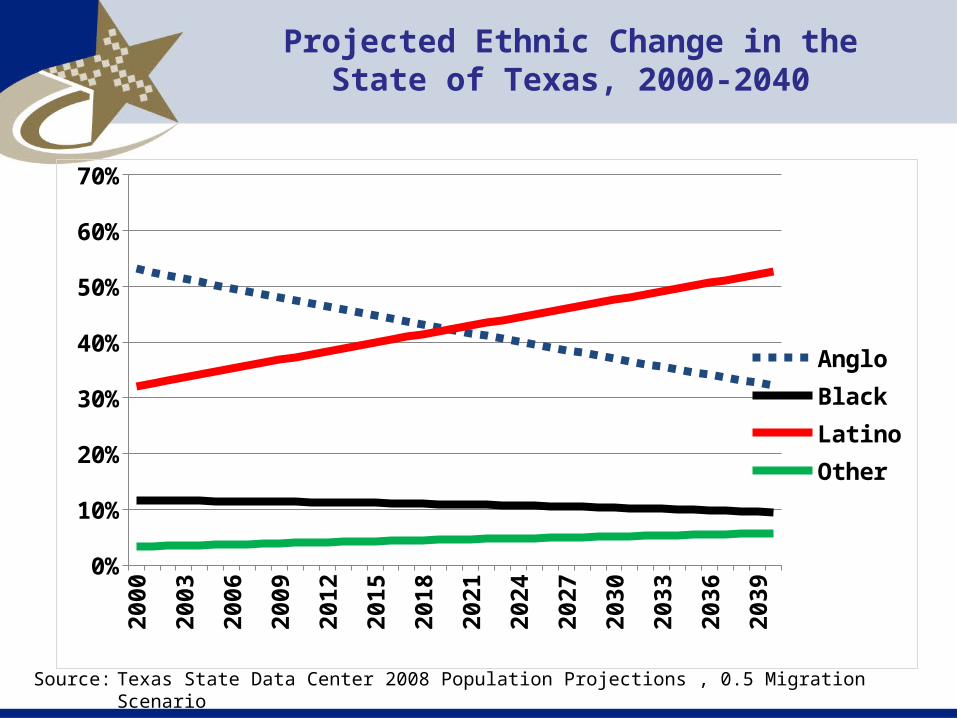
AngloBlackLatinoOther
Source: Texas State Data Center 2008 Population Projections , 0.5 Migration Scenario
Projected Ethnic Change in theState of Texas, 2000-2040
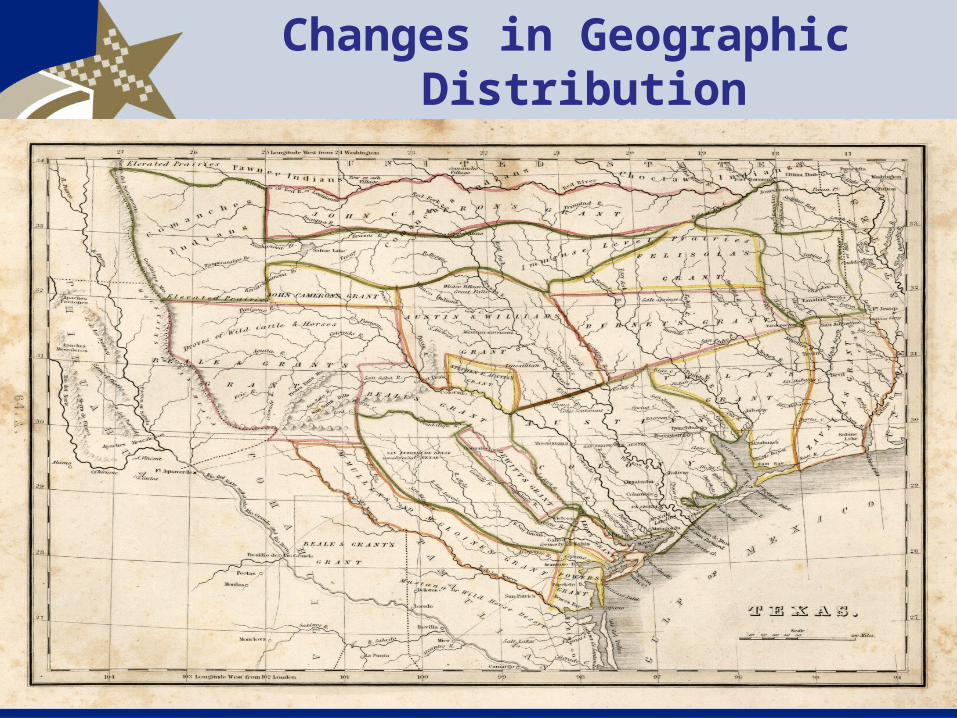
Changes in Geographic Distribution
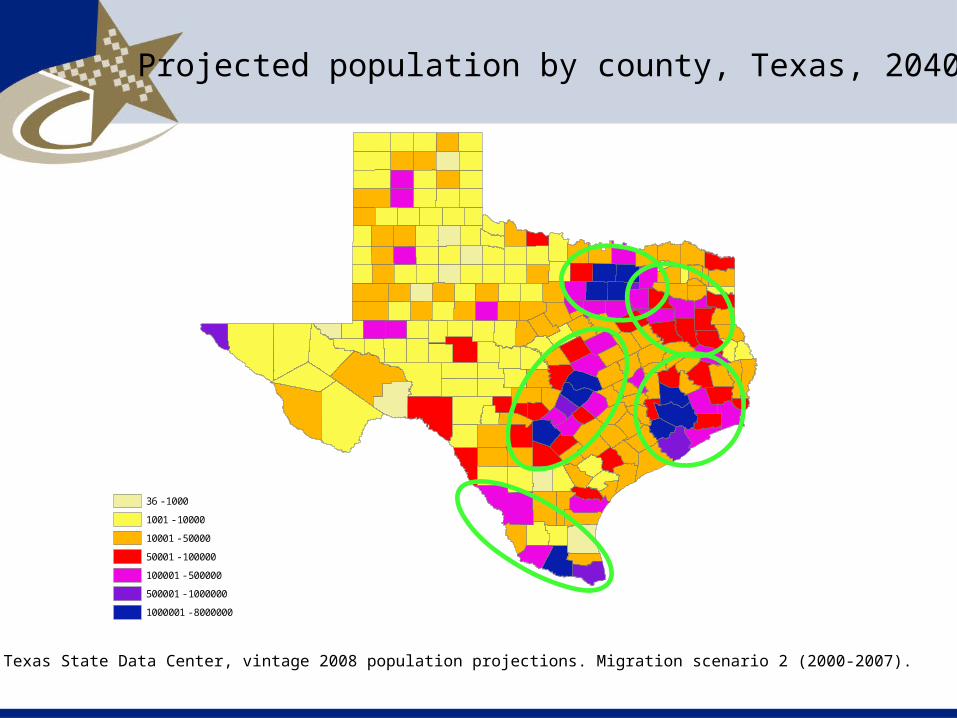
2040 Population
P_40
36 - 1000
1001 - 10000
10001 - 50000
50001 - 100000
100001 - 500000
500001 - 1000000
1000001 - 8000000
Projected population by county, Texas, 2040
Texas State Data Center, vintage 2008 population projections. Migration scenario 2 (2000-2007).
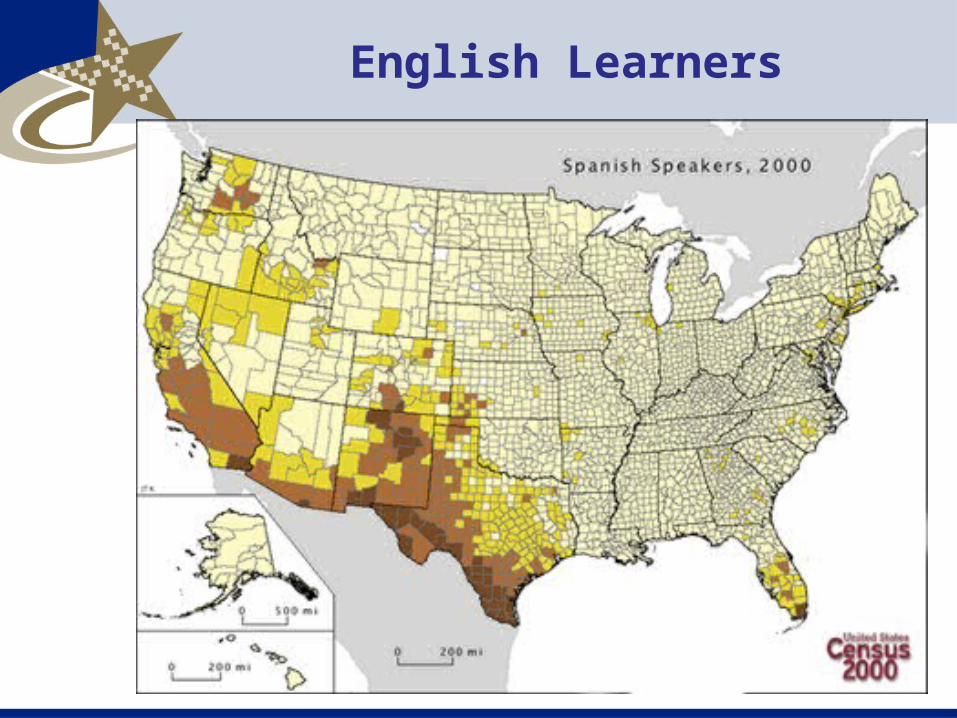
English Learners
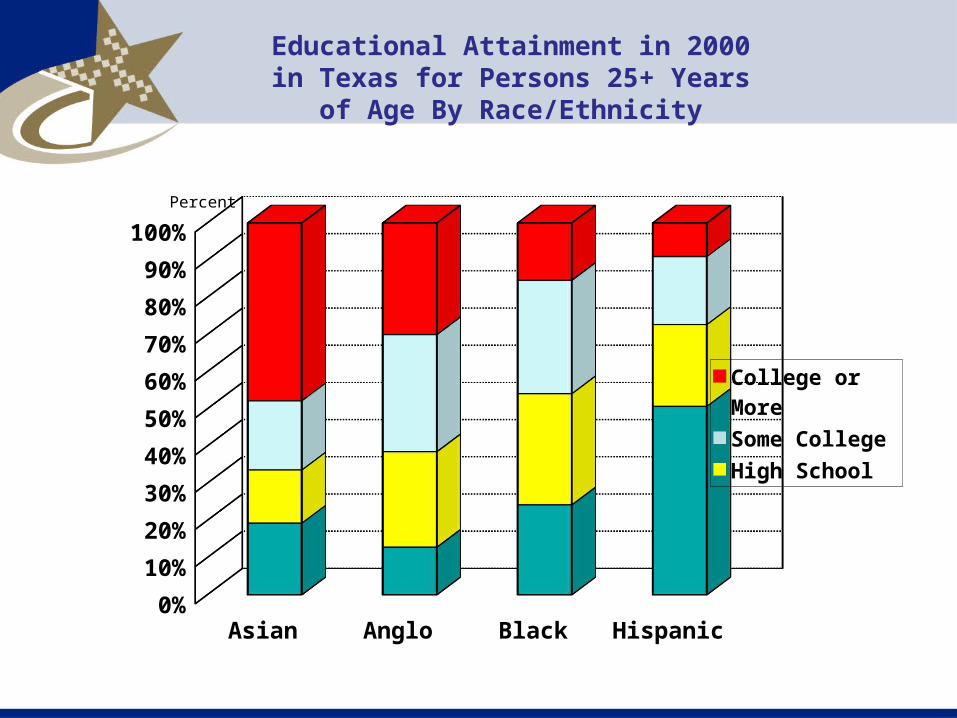
Educational Attainment in 2000 in Texas for Persons 25+ Years
of Age By Race/Ethnicity
HispanicBlackAngloAsian0%
10%
20%
30%
40%
50%
60%
70%
80%
90%
100%
College or More
Some College
High School
< High School
Percent
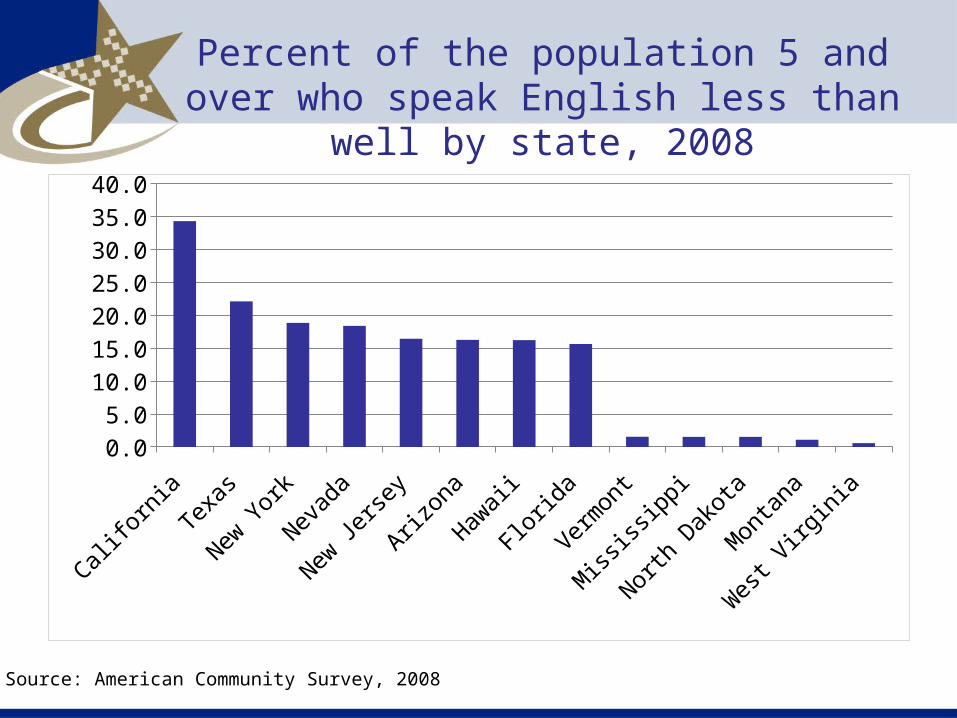
Percent of the population 5 and over who speak English less than well by state, 2008
Califo
rnia
Texas
New Y
ork
Nevad
a
New Je
rsey
Arizon
a
Hawaii
Florida
Verm
ont
Miss
issipp
i
North
Dak
ota
Mon
tana
Wes
t Virg
inia
0.0
5.0
10.0
15.0
20.0
25.0
30.0
35.0
40.0
Source: American Community Survey, 2008
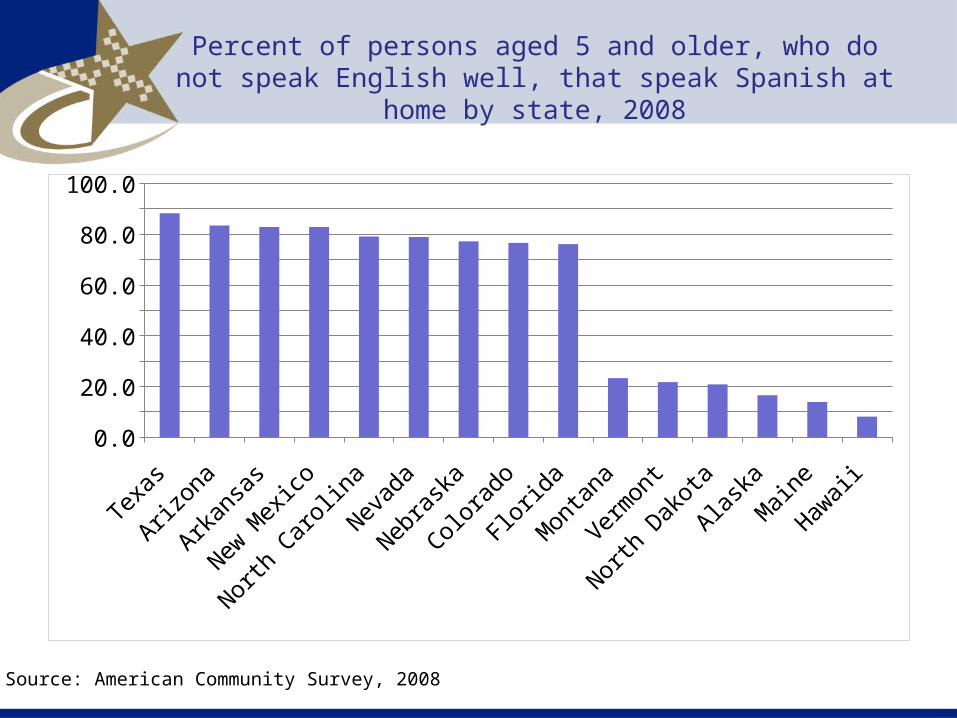
Percent of persons aged 5 and older, who do not speak English well, that speak Spanish at home by state, 2008
Texas
Arizon
a
Arkan
sas
New M
exico
North
Car
olina
Nevad
a
Nebra
ska
Colora
do
Florida
Mon
tana
Verm
ont
North
Dak
ota
Alaska
Main
e
Hawaii
0.0
10.020.030.040.050.060.070.080.090.0
100.0
Source: American Community Survey, 2008
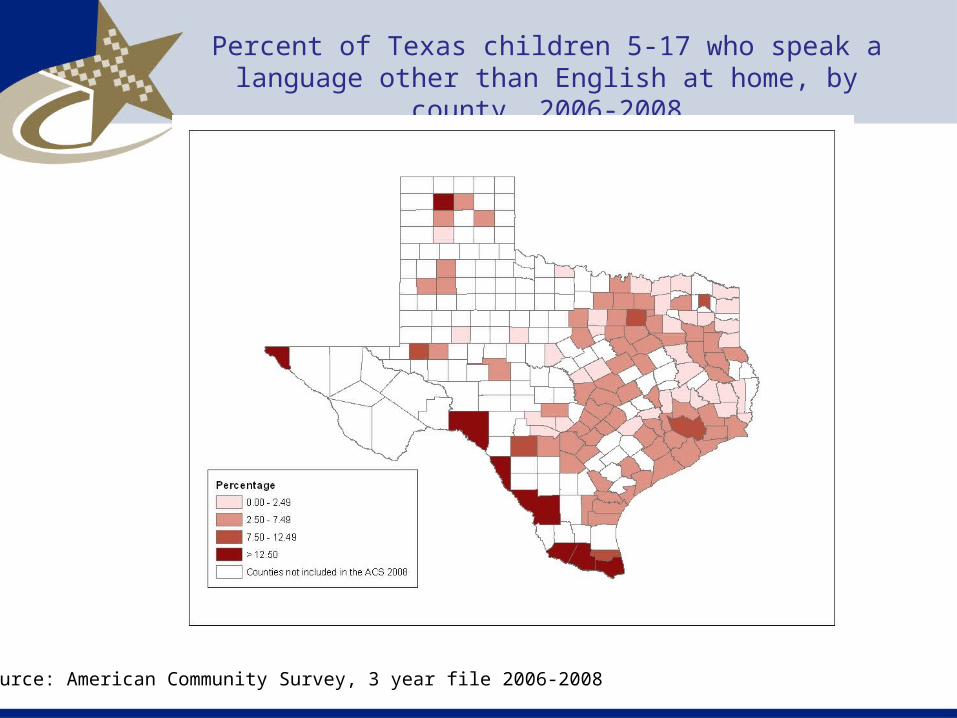
Percent of Texas children 5-17 who speak a language other than English at home, by county, 2006-2008
Source: American Community Survey, 3 year file 2006-2008
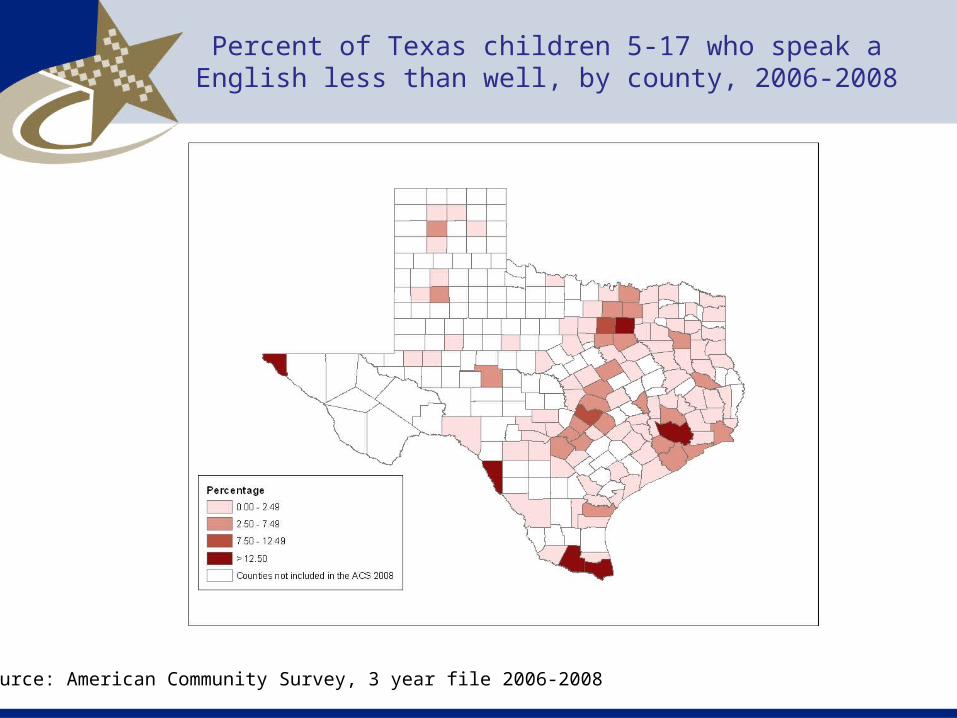
Percent of Texas children 5-17 who speak a English less than well, by county, 2006-2008
Source: American Community Survey, 3 year file 2006-2008
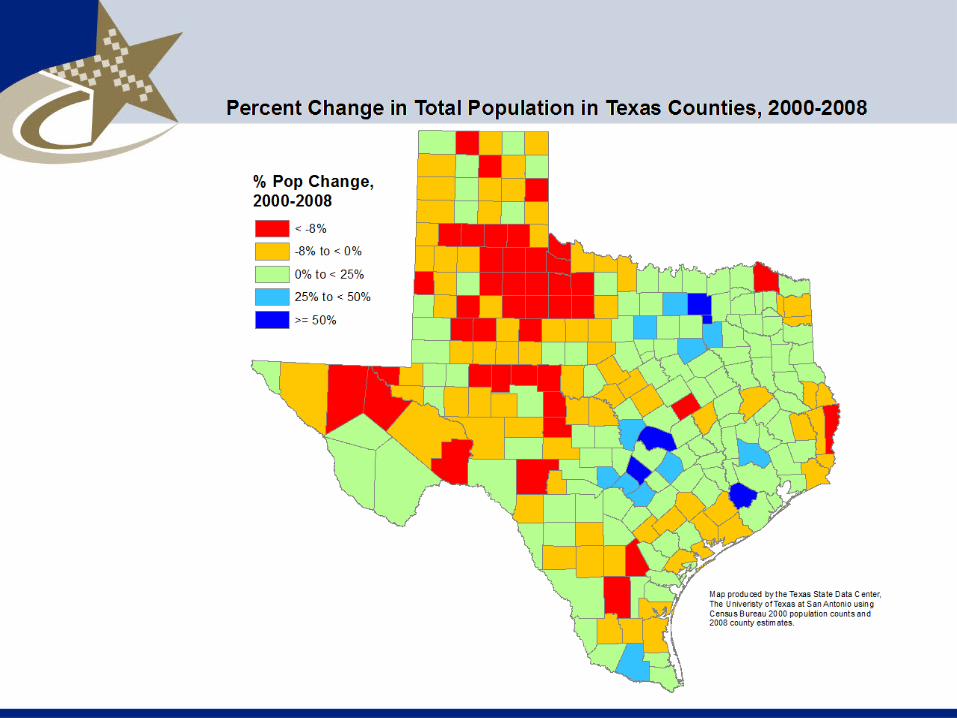
• Continued growth of Texas population• Growth driven by both natural increase and in-
migration (internal and international)• Aging of the population with growing base• Continued growth of Hispanic population relative
to other ethnic/racial groups• Increased concentration of population in major
urbanized areas• Large numbers of English learning students in
major urban areas and in border urban areas
Major Points
Lloyd B. Potter, Ph.D., M.P.H
University of Texas at San Antonio210-458-6530
Texas State Data Center