Tests of the Overreaction Hypothesis and the Timing of ... 1_1_5.pdf · Tests of the Overreaction...
24
Journal of Applied Finance & Banking, vol.1, no.1, 2011, 107-130 ISSN: 1792-6580 (print version), 1792-6599 (online) International Scientific Press, 2011 Tests of the Overreaction Hypothesis and the Timing of Mean Reversals on the JSE Securities Exchange (JSE): the Case of South Africa Heng-Hsing Hsieh 1 and Kathleen Hodnett 2 Abstract This paper examines the overreaction hypothesis on the JSE Securities Exchange (JSE) documented by Page and Way [5] and Muller [4] over a longer and more recent period from 01 January 1993 to 31 March 2009. The mean reversals due to investor overreaction are found to be stronger for the past winner and loser portfolios with longer formation periods. Similar to the results of De Bondt and Thaler [1] and Page and Way [5], the loser portfolios exhibit stronger mean reversals than their winner counterparts over the examination period. The delayed mean reversals for the winner portfolios might be attributable to behavioral biases such as fear of regret or being reference dependent, which cause investors to hold on too long to the past winners. The strength of mean reversals is found to be cyclical and fluctuates around the South African business cycle. Study results also suggest that contrarian investing could be a safe haven during the financial market turmoil due to their low correlations with the market during the economic downturn. JEL classification numbers: G11 Keywords: Overreaction, Mean reversal, Market timing, Contrarian, Momentum 1 University of Cape Town. e-mail: [email protected] 2 University of Cape Town. e-mail: [email protected] Article Info: Revised : March 16, 2011. Published online : May 31, 2011
Transcript of Tests of the Overreaction Hypothesis and the Timing of ... 1_1_5.pdf · Tests of the Overreaction...

Journal of Applied Finance & Banking, vol.1, no.1, 2011, 107-130 ISSN: 1792-6580 (print version), 1792-6599 (online) International Scientific Press, 2011
Tests of the Overreaction Hypothesis and the
Timing of Mean Reversals on the JSE Securities
Exchange (JSE): the Case of South Africa
Heng-Hsing Hsieh1 and Kathleen Hodnett2
Abstract
This paper examines the overreaction hypothesis on the JSE Securities Exchange
(JSE) documented by Page and Way [5] and Muller [4] over a longer and more
recent period from 01 January 1993 to 31 March 2009. The mean reversals due to
investor overreaction are found to be stronger for the past winner and loser
portfolios with longer formation periods. Similar to the results of De Bondt and
Thaler [1] and Page and Way [5], the loser portfolios exhibit stronger mean
reversals than their winner counterparts over the examination period. The delayed
mean reversals for the winner portfolios might be attributable to behavioral biases
such as fear of regret or being reference dependent, which cause investors to hold
on too long to the past winners. The strength of mean reversals is found to be
cyclical and fluctuates around the South African business cycle. Study results also
suggest that contrarian investing could be a safe haven during the financial market
turmoil due to their low correlations with the market during the economic
downturn.
JEL classification numbers: G11 Keywords: Overreaction, Mean reversal, Market timing, Contrarian, Momentum
1 University of Cape Town. e-mail: [email protected] 2 University of Cape Town. e-mail: [email protected] Article Info: Revised : March 16, 2011. Published online : May 31, 2011

108 Tests of the overreaction hypothesis… the case of South Africa
1 Introduction The weak-form efficient market hypothesis states that investors cannot
consistently outperform the market by using historical price patterns. In a market
where share prices systematically overshoot as a result of investor overreaction,
the reversals of share prices should be predictable to provide arbitrage investment
opportunities [1]. Thus, the overreaction hypothesis is in direct contradiction to
the efficient market hypothesis. Investor overreaction could be attributed to the
persistent overweighting of recent information and underweighting of long-term
fundamental information by irrational investors [1]. The herd behaviour of
investors discussed in Shiller [2] and the representativeness behavioural bias
quoted in Nofsinger [3] could also contribute to the overpricing of past winners
and the underpricing of past losers. Given that the long-term fundamentals remain
the same, the overstated or understated share prices would be expected to correct
to their long-term fundamental values [4].
If investor overreaction is present in the equity market, profitable strategies can be
devised by buying past losers and selling past winners when the market is ready to
correct (that is, when mean reversal takes place). This contrarian-based investment
style is termed the reverse relative strength strategy since it bets on the lower
historical relative strength of the shares in the market. The profitability of the
reverse relative strength strategy might be cyclical since the strategy is based on
market sentiment that fluctuates throughout different states of the economy. Thus,
there might exist specific timing for investor overreaction and the subsequent
mean reversals of the past winners and losers. Since investors are most aggressive
in an overheated bull market, the market reversals are likely to be strongest when
the speculative bubble developed during the bull market eventually bursts.
This paper examines the existence of investor overreaction on the JSE Securities
Exchange (JSE) documented by Page and Way [5] and Muller [4] over a longer
and more recent period from 01 January 1993 to 31 March 2009 (a total of 195

H. Hsieh and K.E. Hodnett 109
months). In the case where investor overreaction is found to be present on the JSE,
the paper undertakes to determine whether the mean reversals of past winners and
losers are cyclical and the implications for the reverse relative strength strategy on
the JSE over the examination period. The investigation of the timing of reversals
on the JSE is possible since the examination period covers the financial market
turmoil of 2003 and the stock market crashes of mid-1998 and late 2008.
2 Review of Prior Literature
De Bondt and Thaler [1] test the overreaction hypothesis on the New York Stock
Exchange (NYSE) by examining the average cumulative abnormal returns (ACAR)
of the prior winner and loser portfolios over the period from 01 January 1933 to
31 December 1982. The prior 36-month loser portfolios outperform their winner
counterparts by 24.6% 36 months after formation, on average, over the
examination period. The loser portfolios are found to accumulate positive
abnormal returns while the winner portfolios accumulate negative abnormal
returns since formation. The outperformance of the loser portfolios is less
significant for the portfolios formed using shorter formation periods. In addition,
the mean reversals of the loser portfolios are three times stronger than the mean
reversals of the winner portfolios on average in terms of their 36-month ACARs.
However, due to the fact that the majority of the positive abnormal returns of the
loser portfolios are earned in January, the study results might be due to the
tax-loss selling effect for the losers.
In a follow-up paper, De Bondt and Thaler [6] re-evaluate their prior tests by
including factors such as firm size, seasonality and market risk in the research.
The January excess returns are found to be negatively related to prior December
excess returns for the past winners, which serves as an evidence of capital gains
tax lock-in effect for the past winners. On the other hand, the proposed tax-loss
selling for the losers was not found in the study. In general, the re-evaluation

110 Tests of the overreaction hypothesis… the case of South Africa
supports the overreaction hypothesis in that the mean reversals of past winners and
losers cannot be explained by the size effect and market risk. However, Chan [7]
argues that the market risk of losers increases while the market risk of winners
decreases over time. When the risk changes are controlled for, the abnormal
returns between prior losers and winners appear to be insignificant over the period
from 01 January 1933 to 31 December 1985.
Chopra, Lakonishok and Ritter [8] perform regression analysis on the abnormal
returns of prior winners and losers on the NYSE over the period from 01 January
1931 to 31 December 1986. The results reveal that significant differences in the
abnormal returns of prior losers and winners are realised even when the
time-varying betas are taken into account. Furthermore, Chopra et al [8] argue that
since size, prior returns and betas are interrelated in general, any study that
attempts to relate security performance to just one or two of these factors would
suffer from an omitted variable bias. When these three factors are incorporated in
a multiple regression analysis, the study results indicate that prior losers
outperform prior winners by 4.8% on average for the 5 years after formation after
controlling for size and beta. The degree of mean reversion is nevertheless
stronger for smaller firms. The authors attribute this result to the fact that large
firms are held predominantly by institutional investors and hence are less subject
to investor overreactions as opposed to smaller firms that are held by individual
investors.
Jegadeesh and Titman [9], on the other hand, examine the returns to buying prior
winners and selling prior losers as a form of relative strength strategy on the
NYSE and the American Stock Exchange (AMEX) over the period from 01
January 1965 to 31 December 1989 based on 3- to 12-month prior returns. They
found that significant abnormal returns are available for the short-term relative
strength strategies in the first year after formation and subsequently dissipates in
the following 2 years. This finding, in conjunction with the positive correlation

H. Hsieh and K.E. Hodnett 111
between the length of the formation period and the degree of the mean reversal
documented by De Bondt and Thaler [1], imply that the momentum of short-term
momentum portfolios are non-exhaustive and are indications of their near-term
performance after formation.
Schiereck, De Bondt and Weber [10] investigate the profitability of contrarian and
momentum investing on the Frankfurt Stock Exchange (FSE) over the period from
01 January 1961 to 31 December 1991. The momentum strategies formed based
on prior 6-month and 12-month winners are found to outperform the passive
investing in the DAX stock index by the largest margin amongst other strategies
over the examination period. On the other hand, the contrarian strategies formed
based on prior 36-, 48- and 60-month losers outperform the DAX stock index over
the examination period.
Chan, Hameed and Tong [11] analyse the profitability of momentum investing in
the international equity market indices over the period from 01 January 1980 to 30
June 1995. The 23 equity market indices that are available for constructing the
relative strength strategies include 9 countries from the Asia-Pacific region, 11
countries from Europe, 2 countries from North America and South Africa. The
relative strength strategy is implemented by buying the winner country indices and
simultaneously selling the loser country indices based on 1-, 2-, 4-, 12- and
26-week prior returns of the respective indices. The results indicate that
momentum profits are statistically significant for short holding periods of less than
4 weeks. Forner and Marhuenda [12] investigate the profitability of momentum
and contrarian strategies in the Spanish Stock Exchange over the period from 01
January 1963 to 31 December 1997. The results indicate that the 12-month
momentum strategy and the 60-month contrarian strategy yield significant positive
abnormal returns over the examination period.
Page and Way [5] test the overreaction hypothesis on the Johannesburg Stock
Exchange (now the JSE Securities Exchange) over the period from 01 July 1974
112 Tests of the overreaction hypothesis… the case of South Africa
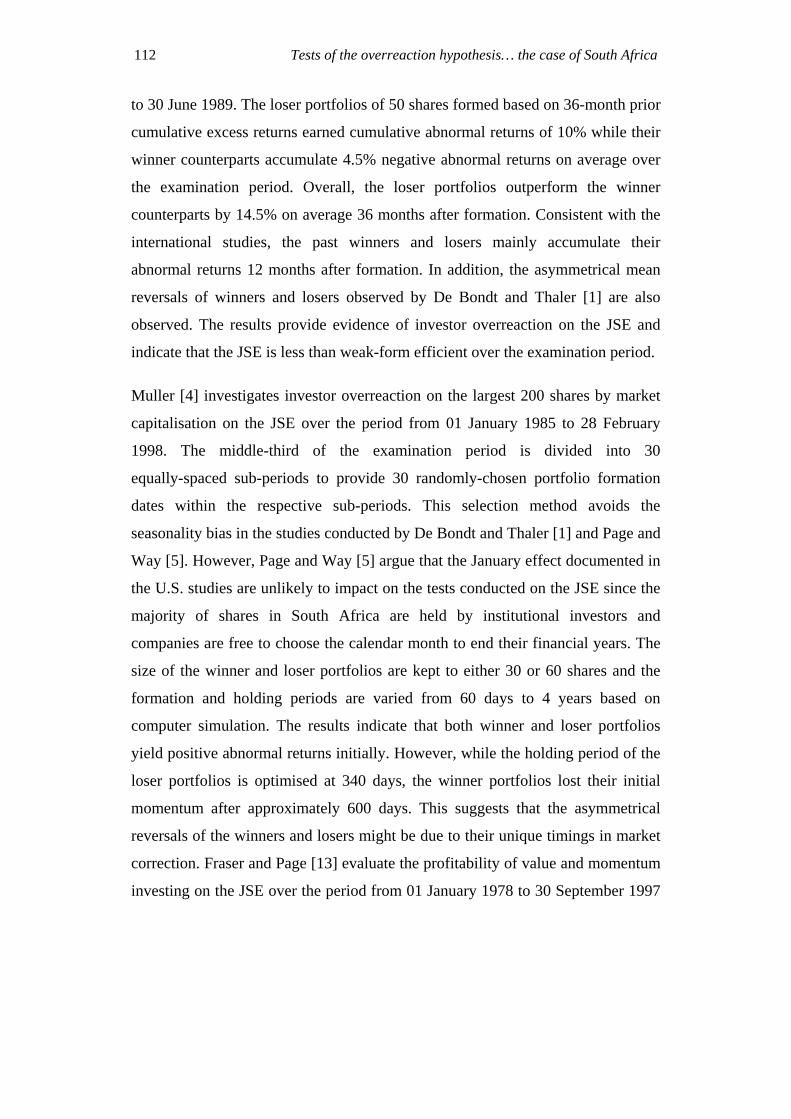
to 30 June 1989. The loser portfolios of 50 shares formed based on 36-month prior
cumulative excess returns earned cumulative abnormal returns of 10% while their
winner counterparts accumulate 4.5% negative abnormal returns on average over
the examination period. Overall, the loser portfolios outperform the winner
counterparts by 14.5% on average 36 months after formation. Consistent with the
international studies, the past winners and losers mainly accumulate their
abnormal returns 12 months after formation. In addition, the asymmetrical mean
reversals of winners and losers observed by De Bondt and Thaler [1] are also
observed. The results provide evidence of investor overreaction on the JSE and
indicate that the JSE is less than weak-form efficient over the examination period.
Muller [4] investigates investor overreaction on the largest 200 shares by market
capitalisation on the JSE over the period from 01 January 1985 to 28 February
1998. The middle-third of the examination period is divided into 30
equally-spaced sub-periods to provide 30 randomly-chosen portfolio formation
dates within the respective sub-periods. This selection method avoids the
seasonality bias in the studies conducted by De Bondt and Thaler [1] and Page and
Way [5]. However, Page and Way [5] argue that the January effect documented in
the U.S. studies are unlikely to impact on the tests conducted on the JSE since the
majority of shares in South Africa are held by institutional investors and
companies are free to choose the calendar month to end their financial years. The
size of the winner and loser portfolios are kept to either 30 or 60 shares and the
formation and holding periods are varied from 60 days to 4 years based on
computer simulation. The results indicate that both winner and loser portfolios
yield positive abnormal returns initially. However, while the holding period of the
loser portfolios is optimised at 340 days, the winner portfolios lost their initial
momentum after approximately 600 days. This suggests that the asymmetrical
reversals of the winners and losers might be due to their unique timings in market
correction. Fraser and Page [13] evaluate the profitability of value and momentum
investing on the JSE over the period from 01 January 1978 to 30 September 1997

H. Hsieh and K.E. Hodnett 113
based on the results of the cross-sectional regression analysis. Test results indicate
that value investing and momentum investing independently explain the 1-month
leading cross-sectional returns on the JSE.
The results from the prior local and international research discussed above suggest
that return momentum is non-exhaustive for the winner and loser portfolios with
12 months or shorter formation periods. On the other hand, significant mean
reversals are observed for portfolios with 36-months or longer formation periods.
In addition, the mean reversals are asymmetrical for the winner and loser
portfolios in that the loser portfolios are found to earn greater positive cumulative
abnormal returns than the negative abnormal returns accumulated by their winner
counterparts. The mean reversals in the international studies are partially
explained by the January effect, the firm size effect and the changing risk of the
past winners and losers since formation. In South Africa, seasonality biases are
less pronounced since companies are free to choose their tax reporting month and
the majority of the shares are held by institutional investors as opposed to
individual investors.
3 Research Methodology
The monthly values of the total return index of the companies comprising the
FTSE/JSE All Share Index are obtained from DataStream International in the
finance research laboratory at the University of Cape Town over the period from
01 January 1988 to 31 March 2009. As of 01 April 2009, there are 166 shares in
the database. The research sample is subject to survivorship bias due to the fact
that only shares that are still in existence are available in the database. Muller [4]
suggests that the survivorship bias can be mitigated by excluding smaller shares in
the sample since the larger shares are less likely to be delisted. Thus, the research
sample is reduced by selecting the top 100 shares by market capitalisation. Page
and Way [5] support this method by arguing that the abnormal returns for the

114 Tests of the overreaction hypothesis… the case of South Africa
larger well-established companies would likely to be smaller and hence place a
higher standard for testing the overreaction hypothesis.
The market proxy employed in this research is a monthly-rebalanced,
equally-weighted portfolio of all sample shares available in each month of the
examination period. The choice of the market proxy is in line with the
methodology adopted by Page and Way [5] and Muller [4]. Constructing the
market proxy from the sample shares ensures that fair comparison is drawn
between the performance of the pre-specified portfolios and the performance of
the pool where the portfolios select their constituents from. The choice of an
equally-weighted market proxy over the cap-weighted proxy is based on the
argument of Hsu [14] that the cap-weighted portfolios are mean-variance
inefficient portfolios. More specifically, the periodic rebalancing of the
cap-weighted portfolio involves buying overvalued shares and selling undervalued
shares in an overreacted market. Thus, the use of such proxy would introduce a
bias in the investigation of the overreaction hypothesis.
The momentum attributes examined in this research are prior 12-month, 36-month,
and 60-month sample share returns. These attributes are calculated from the total
return index that incorporates both the capital appreciation from the share price
and the dividend yield. The past L-month return momentum of share i at the
beginning of month t (that is, month t-1) is computed using Equation 1.
1)( ,
,1, −=
−−
−−
L1ti
1titi TRI
TRILMOM (1)
where:
L = 12, 36, or 60;
TRIi,t-1 = the total return index of share i in month t-1; and
TRIi,t-1-L = the total return index of share i in month t-1-L.
The sample shares at the beginning of each quarter (that is, 01 January, 01 April,

H. Hsieh and K.E. Hodnett 115
01 July and 01 October in the calendar year) are ranked based on their respective
values for each momentum attribute over the period from 01 January 1993 to 31
March 2006. There are in total 53 quarters in this period. The top-ranked 20 shares
at the beginning of each quarter are grouped to form the equally-weighted winner
portfolio for each momentum attribute. Similarly, the bottom-ranked 20 shares are
grouped to form the equally-weighted loser portfolio for each momentum attribute.
Thus, there are 53 winner portfolios and 53 loser portfolios in total for each
momentum attribute under examination. Constructing winner and loser portfolios
quarterly as opposed to any particular month of the calendar year ensures that the
test results are free from the seasonality bias in the studies conducted by De Bondt
and Thaler [1, 6] and Page and Way [5].
Following the methodology of De Bondt and Thaler [1], the performance of the
winner and loser portfolios are evaluated monthly based on their cumulative
average residual returns (CAR) for each of the 36 months after portfolio formation.
The K-month CAR of portfolio P formed at the beginning of month t (that is,
month t-1) is the average of the cumulative residual returns (CR) for the shares in
the portfolio as shown in Equation 2, where the K-month CR of the jth share in the
portfolio is computed using Equation 3.
20
)()(
20
11,
1,
∑=
−
− = jtj
tP
KCRKCAR (2)
⎟⎟⎠
⎞⎜⎜⎝
⎛−−⎟
⎟⎠
⎞⎜⎜⎝
⎛−=
−
+−
−
+−− 11)(
1,
1,
1,
1,1,
tM
KtM
tj
Ktjtj TRI
TRITRI
TRIKCR (3)
where:
K = 1, 2, 3… 36; and
M = the monthly-rebalanced equally-weighted market proxy
of sample shares.

116 Tests of the overreaction hypothesis… the case of South Africa
The post-formation monthly CARs for portfolios formed in each of the 53 quarters
are averaged to obtain the K-month average cumulative abnormal returns (ACAR)
for the respective momentum portfolios. Comparing the ACAR of the winner
portfolio to that of the loser portfolio provides an indication as to whether there
exists a potentially successful reverse relative strength strategy over the
examination period. If the ACAR for the winner portfolio is positive while the
ACAR for the loser portfolio is negative for a particular momentum attribute, a
profitable strategy would be to long the winner portfolio and simultaneously short
the loser portfolio with the expectation that the historical relative performance will
continue. On the other hand, if the ACAR for the winner portfolio is negative
while the ACAR for the loser portfolio is positive, a profitable reverse relative
strength strategy can be established by longing the loser portfolio and
simultaneously shorting the winner portfolio to exploit the mean reversal of the
respective momentum portfolios.
A relative strength (or reverse relative strength) strategy is only profitable if the
winner and the loser portfolios have consistent CARs over time. In other words,
the long portfolio should accumulate positive abnormal returns and the short
portfolio should accumulate negative abnormal returns consistently over time. As
a result, the correlation coefficient between the abnormal returns of the long and
short portfolios of a successful relative strength (or reverse relative strength)
strategy would be significantly negative. This is true despite the fact that the
returns of both the long and the short portfolios are positively correlated with the
return of the market proxy as they represent the components of the market proxy.
To evaluate the above hypothesis, the correlation coefficients between the
post-formation momentum portfolio returns and market proxy returns are
computed for each of the momentum portfolios formed at the beginning of each of
the 53 quarters in the examination period. The correlation coefficients between
these 53 post-formation portfolio returns and the market proxy returns are

H. Hsieh and K.E. Hodnett 117
subsequently averaged to indicate the degree to which each momentum portfolio
and the market proxy move in tandem. The same method is applied to compute the
average correlation coefficients between the post-formation monthly abnormal
returns of the winner and the loser portfolios for each momentum attribute.
In order to test whether there exists a specific market timing of the mean reversal
over the examination period, a monthly-rebalanced reverse relative strength
strategy for the momentum attribute that exhibits the most significant mean
reversal is implemented from 01 January 1993 to 31 March 2009. At the
beginning of each month, the new loser and winner portfolios (of 20 shares in
each portfolio) are formed, and the loser less winner spread earned from the
previous month is reinvested into the new loser portfolio. Simultaneously, the
short position in the new winner portfolio is revised to equate the investment held
long in the new loser portfolio. From 01 January 1996, the prior 36-month
cumulative per rand (South African currency) long spread of the reverse relative
strength strategy is computed monthly to examine the consistency of the market
reversal throughout the examination period.
Following the methodology of Jegadeesh and Titman [9], the market model is
used to evaluate the risk-adjusted performance of the reverse relative strength
strategy as shown in Equation 4. The monthly per rand long spread in excess of
the risk-free rate is regressed on the market risk premium for the 14 overlapping
36-month periods with a 12-month moving window. The first period is from 01
January 1993 to 31 December 1995, the second period is from 01 January 1994 to
31 December 1996 and the last period is from 01 January 2006 to 31 December
2008.
( ) tSpreadttMSpreadSpreadttWinnerLoser RfRRfSpread ,,, εβα +−×+=−− (4)
where:
tMR , = the return on the market proxy in month t;

118 Tests of the overreaction hypothesis… the case of South Africa
tRf = the return on the risk-free proxy (90-day Treasury bill)
in month t;
Spreadα = the per-rand long return in excess of the risk-adjusted
return estimated by the market model over the
regression period;
Spreadβ = the sensitivity of the per-rand strategy return to movements
of the market risk premium; and
tSpread ,ε = the random error of the regression in month t.
The intercept term (alpha) of the regression indicates the risk-adjusted abnormal
return of the reverse relative strength strategy while the slope (beta) of the
regression is a measure of systematic risk for the strategy. The statistical
significance of the alpha and beta in each of the 14 overlapping periods are
examined at the 5% significance level.
4 Results
4.1 Post-formation performance of winner and loser portfolios
The post-formation ACARs of the past 60-month momentum portfolios (MOM60),
the past 12-month momentum portfolios (MOM12) and the past 36-month
momentum portfolios (MOM36) are demonstrated in Figure 1, Figure 2 and
Figure 3 respectively. The ACARs of the winner portfolios are marked by solid
dots while the ACARs of the loser portfolios are marked by empty dots. The
ACARs obtained from quarterly-formed portfolios with overlapping
post-formation periods are less prone to seasonality bias and are smoother than the
ACARs obtained from the annually-formed portfolios in the studies conducted by
De Bondt and Thaler [1] and Page and Way [5].

H. Hsieh and K.E. Hodnett 119
-20%
-10%
0%
10%
20%
30%
40%
0 3 6 9 12 15 18 21 24 27 30 33 36
Months After Portfolio Formation
Ave
rage
Cum
Abn
orm
al R
etur
ns (A
CA
R)
Figure 1: Post-formation performance of MOM60 Winners and Losers
It is apparent that the loser portfolios outperform their winner counterparts for the
MOM60, MOM12 and MOM36 portfolios in terms of their 36-month ACARs.
The mean reversal is most obvious for the MOM60 portfolios, and least apparent
in the post-formation performance of the MOM12 portfolios. Figure 1 shows that
the MOM60 losers outperform the market proxy by 34.06%, while the MOM60
winners underperform the market by 11.32% on average 36 months after
formation over the examination period. The MOM60 losers accumulate positive
abnormal returns while the MOM60 winners accumulate negative abnormal
returns at an increasing rate. In addition, the observed reversals for the MOM60
winner and loser portfolios take place immediately after their formation.
120 Tests of the overreaction hypothesis… the case of South Africa
-20%
-10%
0%
10%
20%
30%
40%
0 3 6 9 12 15 18 21 24 27 30 33 36
Months After Portfolio Formation
Ave
rage
Cum
Abn
orm
al R
etur
ns (A
CA
R)
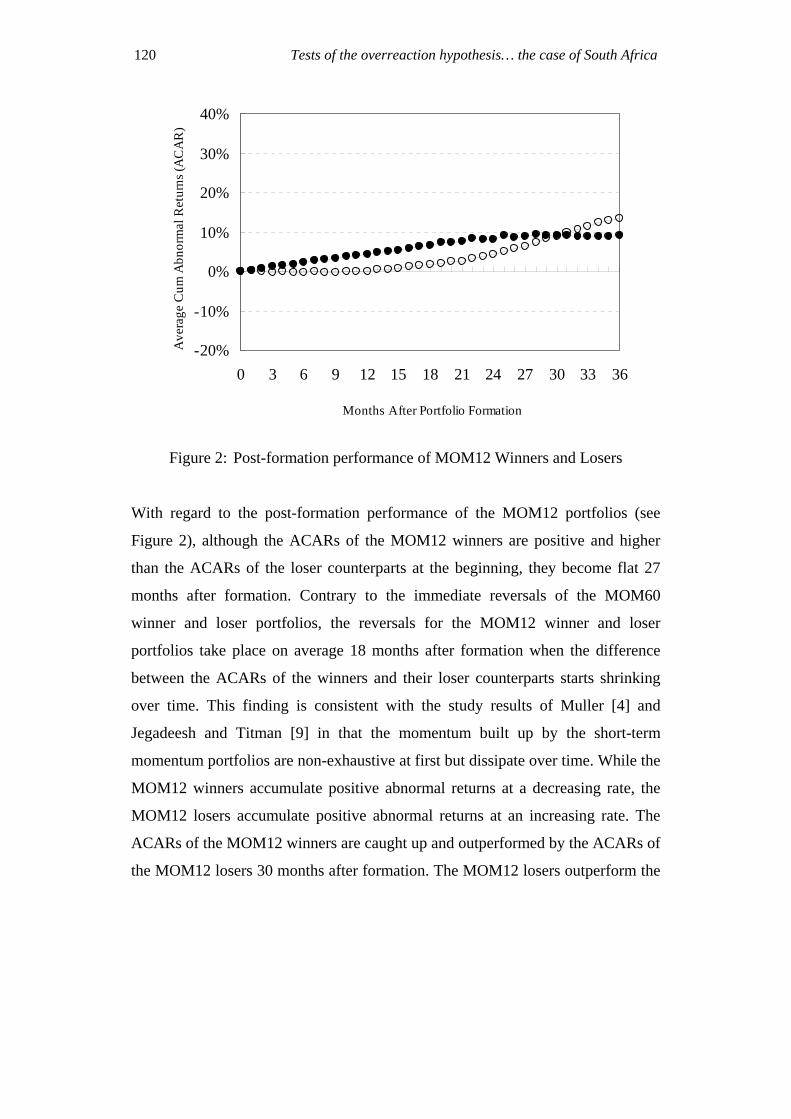
Figure 2: Post-formation performance of MOM12 Winners and Losers
With regard to the post-formation performance of the MOM12 portfolios (see
Figure 2), although the ACARs of the MOM12 winners are positive and higher
than the ACARs of the loser counterparts at the beginning, they become flat 27
months after formation. Contrary to the immediate reversals of the MOM60
winner and loser portfolios, the reversals for the MOM12 winner and loser
portfolios take place on average 18 months after formation when the difference
between the ACARs of the winners and their loser counterparts starts shrinking
over time. This finding is consistent with the study results of Muller [4] and
Jegadeesh and Titman [9] in that the momentum built up by the short-term
momentum portfolios are non-exhaustive at first but dissipate over time. While the
MOM12 winners accumulate positive abnormal returns at a decreasing rate, the
MOM12 losers accumulate positive abnormal returns at an increasing rate. The
ACARs of the MOM12 winners are caught up and outperformed by the ACARs of
the MOM12 losers 30 months after formation. The MOM12 losers outperform the

H. Hsieh and K.E. Hodnett 121
market proxy by 13.35%, while the MOM12 winners outperform the market by
8.99% on average 36 months after formation over the examination period.
The post-formation performance of the MOM36 portfolios (see Figure 3) are
somewhere in between that of the MOM12 and MOM60 portfolios. Similar to the
post performance of the MOM60 portfolios, the MOM36 winners accumulate
negative abnormal returns while the MOM36 losers accumulate positive abnormal
returns 36 months after formation. However, the reversals for the MOM36
portfolios are not as drastic compared to that of the MOM60 portfolios. The
MOM36 losers outperform the market proxy by 29.33%, while the MOM60
winners underperform the market by 7.89% on average 36 months after formation
over the examination period (compared to 34.06% and 11.32% for the MOM60
losers and winners respectively). In addition, the ACARs of the MOM36 winners
are positive since formation and eventually turn negative 20 months after
formation.
When the post-formation ACARs of MOM60, MOM12 and MOM36 are
examined collectively, it is found that the reversals for the losers are much greater
than their winner counterparts in terms of the absolute values of the ACARs 36
months after formation. More specifically, the losers accumulate much greater
ACARs than the winner counterparts 36 months after formation. The greater
reversals of the losers are also evident in that the reversals take place (that is,
where the graph kinks) much earlier for the losers than it is for the winner
counterparts. This test result is in line with most of the local and international
studies discussed earlier, which suggests that investors are more prompt in
acquiring past losers than letting go of past winners.

122 Tests of the overreaction hypothesis… the case of South Africa
-20%
-10%
0%
10%
20%
30%
40%
0 3 6 9 12 15 18 21 24 27 30 33 36
Months After Portfolio Formation
Ave
rage
Cum
Abn
orm
al R
etur
ns (A
CA
R)
Figure 3: Post-formation performance of MOM36 Winners and Losers.
4.2 Correlation analysis
The average correlation coefficients between the post-formation monthly returns
of the momentum portfolios and the market proxy are displayed in Panel A of
Table 1. Panel B of Table 1 demonstrates the average correlation coefficients
between the post-formation monthly abnormal returns of the winners and their
loser counterparts for the respective momentum attributes.
The t-statistics that are significant at a 5% level for the correlation coefficients are
in italics and highlighted in bold. It is apparent in Panel A of Table 1 that the
post-formation returns of all momentum portfolios are positively significantly
correlated with the returns of the market proxy as they are part of the market
proxy.
H. Hsieh and K.E. Hodnett 123
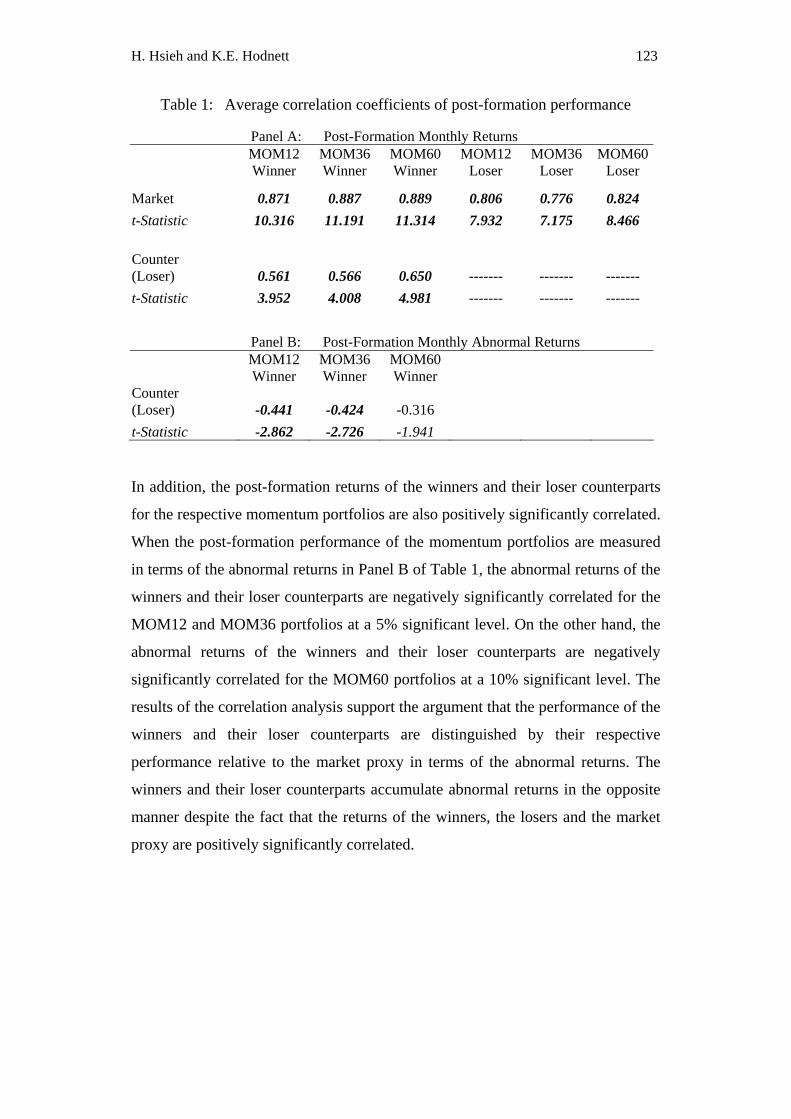
Table 1: Average correlation coefficients of post-formation performance
Panel A: Post-Formation Monthly Returns MOM12 MOM36 MOM60 MOM12 MOM36 MOM60 Winner Winner Winner Loser Loser Loser
Market 0.871 0.887 0.889 0.806 0.776 0.824 t-Statistic 10.316 11.191 11.314 7.932 7.175 8.466 Counter (Loser) 0.561 0.566 0.650 ------- ------- ------- t-Statistic 3.952 4.008 4.981 ------- ------- -------
Panel B: Post-Formation Monthly Abnormal Returns MOM12 MOM36 MOM60 Winner Winner Winner Counter (Loser) -0.441 -0.424 -0.316 t-Statistic -2.862 -2.726 -1.941
In addition, the post-formation returns of the winners and their loser counterparts
for the respective momentum portfolios are also positively significantly correlated.
When the post-formation performance of the momentum portfolios are measured
in terms of the abnormal returns in Panel B of Table 1, the abnormal returns of the
winners and their loser counterparts are negatively significantly correlated for the
MOM12 and MOM36 portfolios at a 5% significant level. On the other hand, the
abnormal returns of the winners and their loser counterparts are negatively
significantly correlated for the MOM60 portfolios at a 10% significant level. The
results of the correlation analysis support the argument that the performance of the
winners and their loser counterparts are distinguished by their respective
performance relative to the market proxy in terms of the abnormal returns. The
winners and their loser counterparts accumulate abnormal returns in the opposite
manner despite the fact that the returns of the winners, the losers and the market
proxy are positively significantly correlated.
124 Tests of the overreaction hypothesis… the case of South Africa
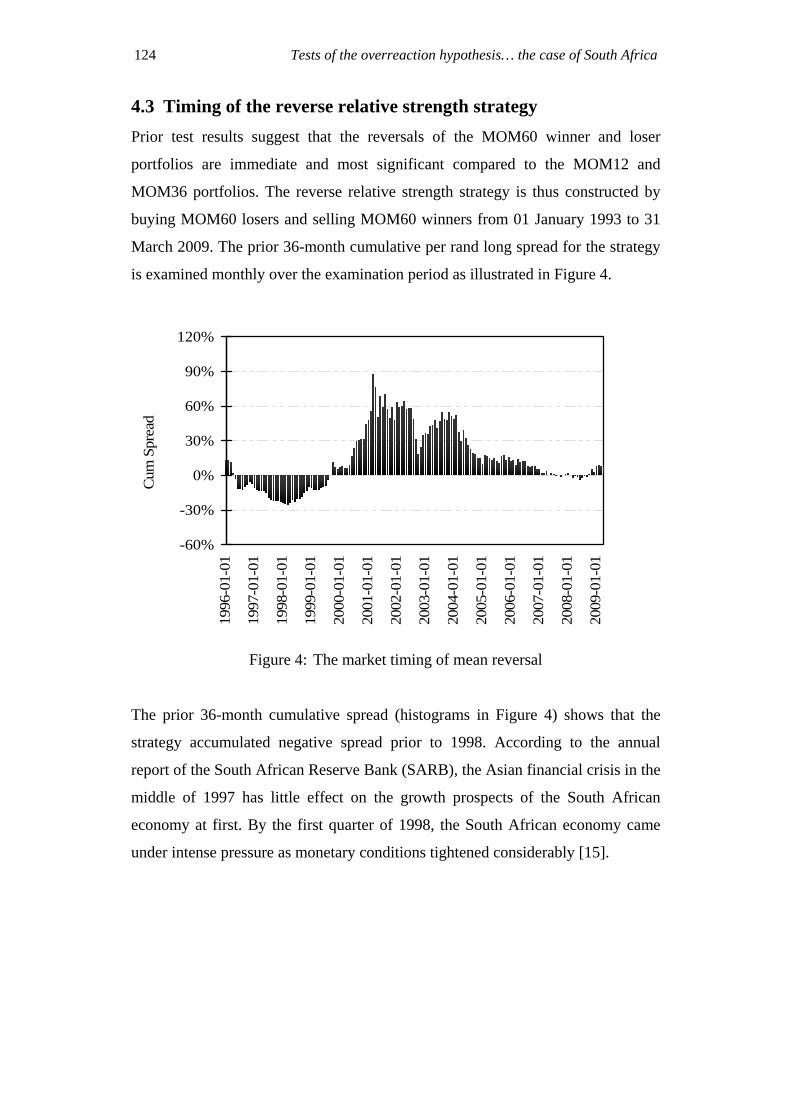
4.3 Timing of the reverse relative strength strategy Prior test results suggest that the reversals of the MOM60 winner and loser
portfolios are immediate and most significant compared to the MOM12 and
MOM36 portfolios. The reverse relative strength strategy is thus constructed by
buying MOM60 losers and selling MOM60 winners from 01 January 1993 to 31
March 2009. The prior 36-month cumulative per rand long spread for the strategy
is examined monthly over the examination period as illustrated in Figure 4.
-60%
-30%
0%
30%
60%
90%
120%
1996
-01-
01
1997
-01-
01
1998
-01-
01
1999
-01-
01
2000
-01-
01
2001
-01-
01
2002
-01-
01
2003
-01-
01
2004
-01-
01
2005
-01-
01
2006
-01-
01
2007
-01-
01
2008
-01-
01
2009
-01-
01
Cum
Spr
ead
Figure 4: The market timing of mean reversal
The prior 36-month cumulative spread (histograms in Figure 4) shows that the
strategy accumulated negative spread prior to 1998. According to the annual
report of the South African Reserve Bank (SARB), the Asian financial crisis in the
middle of 1997 has little effect on the growth prospects of the South African
economy at first. By the first quarter of 1998, the South African economy came
under intense pressure as monetary conditions tightened considerably [15].

H. Hsieh and K.E. Hodnett 125
The reverse relative strength strategy starts accumulating positive returns since the
first quarter of 1998 until the downward change in the outlook of the world
economy in 2001. According to the annual report of SARB, the considerable
depreciation of the rand during 2001 helped to cushion the effect of the downward
change in the outlook of the global economy. The weighted average value of the
rand lost more than 30% in 2001. The domestic economy showed great resilience
and maintained its growth in real output in 2001. The strong growth in the export
sector (especially the resources) has provided impetus for continuous growth in
the economy. The domestic expenditures from both the public and private sectors
were also expanding into 2002 [16, 17].
After a sharp fall of the cumulative spread of the reverse relative strength strategy
in the July 2002, the strategy started accumulating positive returns again in 2003.
The stock market lost almost a third of its value since the peak in May 2002 to the
end of the first quarter 2003. This is primarily due to the strong recovery of the
rand coupled with weak global economic growth, war in Iraq and the threat of the
SARS virus. The real economic growth in the domestic economy decelerated to
merely 2% annually for 2003 [18].
The global economy grew briskly for both developed and developing countries
since late 2003. Lower interest rates environment, growth-oriented fiscal policies
and higher prices for export commodities such as gold and platinum resulted in the
real domestic output to rise above 3% in 2004. The cumulative spread for the
reverse relative strength strategy has since diminished to the negative territory
until the global financial market crisis in 2008 and recovered gradually thereafter.
The timing of mean reversals is also revealed by the periodic risk-adjusted
performance of the reverse relative strength strategy demonstrated in Table 2. All
of the 14 regressions are significant at the 5% significance level as the p-value of
the regression slopes indicated by beta are far less than 5% as shown in Table 2.

126 Tests of the overreaction hypothesis… the case of South Africa
The statistically significant regression intercepts, alpha, are highlighted in bold.
Table 2: Risk-adjusted performance of the reverse relative strength strategy
Period: (1)
`93-`95
(2)
`94-`96
(3)
`95-`97
(4)
`96-`98
(5)
`97-`99
(6)
`98-`00
(7)
`99-`01
R2 30% 39% 42% 21% 16% 19% 26%
Alpha 0.016 0.012 0.010 0.019 0.039 0.055 0.053
p-Alpha 0.460 0.260 0.256 0.271 0.052 0.004 0.000
Beta 1.676 1.054 1.043 0.701 0.648 0.664 0.837
p-Beta 0.001 0.000 0.000 0.005 0.017 0.008 0.002
Period: (8)
`00-`02
(9)
`01-`03
(10)
`02-`04
(11)
`03-`05
(12)
`04-`06
(13)
`05-`07
(14)
`06-`08
R2 41% 32% 38% 44% 45% 59% 48%
Alpha 0.039 0.047 0.025 0.022 0.015 0.013 0.024
p-Alpha 0.000 0.000 0.016 0.034 0.164 0.111 0.002
Beta 1.052 0.844 1.007 1.057 1.082 1.103 0.699
p-Beta 0.000 0.000 0.000 0.000 0.000 0.000 0.000
Observing the p-value of alpha indicates that the risk-adjusted abnormal returns
become less significant towards the market meltdown in 1998 and 2008. On the
contrary, the reversals are strongest (indicated by significant alpha in period 6 and
period 14) immediately after the crises. The extreme swings of alpha around the
crises might be an indication of the extreme switch of investor sentiment from
positive to negative. In addition, the swings of the beta coefficients from above
average (beta > 1.0) to below average (i.e. beta < 1.0) during market downturns in
periods 4, 9 and 14 suggest that contrarian investing is a safe haven in the
financial market turmoil in 1998, 2003 and 2008. This result implies that the
correlations between the returns on the reverse relative strength strategy (and
hence the strength of mean reversal) and the market returns are likely to be low
during turbulent times. It is also observed that the beta coefficients of the reverse

H. Hsieh and K.E. Hodnett 127
relative strength strategy increase over time when investor confidence is gradually
restored post-crises.
5 Conclusion
When the post-formation performance of the winner and loser portfolios are
examined based on their 36-month ACARs since formation, the losers of the
MOM12, MOM36 and MOM60 portfolios outperform their winner counterparts
over the examination period from 01 January 1993 to 31 March 2009. The mean
reversals are most significant for the MOM60 portfolios and least significant for
the MOM12 portfolios. The prior momentum carried by the MOM12 and MOM36
winners is non-exhaustive and the winner portfolios continue to accumulate
positive abnormal returns after formation. Whereas the ACARs of the MOM36
winners eventually turn negative 20 months after formation, the ACARs of the
MOM12 winners become flat 27 months but remain positive 36 months after
formation. The test results suggest that there exists a saturation point for the past
winners and losers to continue their prior trends. The mean reversal is likely to
take place once the saturation point is reached.
When the post-formation performance of the winner portfolios are compared to
their loser counterparts, it is found that the degree of mean reversal is stronger for
the losers than their winner counterparts. The asymmetrical reversals of past
winners and losers imply that market correction is more prompt for the losers than
it is for the winners. The delayed correction for the winners might be attributed to
the behavioural biases outlined in Nofsinger [3] such as fear of regret or being
reference dependent. Fear of regret causes investors to hold on too long to the past
winners. Investors could also be unwilling to sell their past winners at a price
lower than the historical peak price.

128 Tests of the overreaction hypothesis… the case of South Africa
The result of the correlation analysis reveals that the performance of the winner
portfolios and their loser counterparts are distinguished by their performance
relative to the market proxy (that is, their abnormal returns), despite the fact that
their returns are all positively significantly correlated. Examining the monthly
prior 36-month cumulative spread of the MOM60 reverse relative strength
strategy suggests that mean reversals are likely to take place when investors are
less confident about the future prospects of the economy. The regression analysis
of the reverse relative strength strategy support this argument in that the
risk-adjusted abnormal returns represented by the alpha of the regressions are
most significant immediately after the market crash. The alpha of the regression
diminishes over time and become less significant towards the market meltdowns
in 1998 and 2008. The swings of the beta coefficients from above- to
below-average during economic crises suggest that contrarian investing is a safe
haven in the financial market turmoil through the low correlation between the
return of the contrarian investing and the market returns. In conclusion, the study
found that mean reversals, as a consequence of investor overreaction, are strongest
immediately after the market crash. The profitability of the reverse relative
strength strategy is thus determined by the prevailing market sentiment of the
investors.
ACKNOWLEDGEMENTS We acknowledge the use of the Finance
Research Laboratory in the School of Management Studies at the University of
Cape Town. We thank Professor Paul van Rensburg of Salient Quants Asset
Management for his professional insights and views.
H. Hsieh and K.E. Hodnett 129
References
[1] W. F. M. De Bondt and R. H. Thaler, Does the Stock Market Overreact? The
Journal of Finance, 40(3), (1985), 793-805.
[2] R. J. Shiller, Irrational Exuberance, Princeton: Princeton University Press,
2005.
[3] J. R. Nofsinger, The Psychology of Investing, Prentice Hall, Third edition,
2005.
[4] C. Muller, Investor Overreaction on the Johannesburg Stock Exchange,
Investment Analysts Journal, 49, (1999), 5-17.
[5] M. J. Page and C. V. Way, Stock Market Over-reaction: The South African
Evidence, Investment Analysts Journal, 36, 1992/1993, 35-49.
[6] W. F. M. De Bondt and R. H. Thaler, Further Evidence on Investor
Overreaction and Stock Market Seasonality, The Journal of Finance, 42(3),
(1987), 557-581.
[7] K. C. Chan, On the Contrarian Investment Strategy, The Journal of Business,
61(2), (1988), 147-163.
[8] N. Chopra, J. Lakonishok and J. R. Ritter, Measuring Abnormal Performance:
Do Stocks Overreact? Journal of Financial Economics, 31, (1992), 235-268.
[9] N. Jegadeesh and S. Titman, Returns to Buying Winners and Selling Losers:
Implications for Stock Market Efficiency, The Journal of Finance, 48(1),
(1993), 65-91.
[10] D. Schiereck, W. De Bondt and M. Weber, Contrarian and Momentum
Strategies in Germany, Financial Analysts Journal, 55(6), (1999), 104-116.
[11] K. Chan, A. Hameed and W. Tong, Profitability of Momentum Strategies in
the International Equity Markets, The Journal of Financial and Quantitative
Analysis, 35(2), (2000), 153-172.
[12] C. Forner and J. Marhuenda, Contrarian and Momentum Strategies in the
Spanish Stock Market, European Financial Management, 9(1), (2003),
67-88.

130 Tests of the overreaction hypothesis… the case of South Africa
[13] E. Fraser and M. Page, Value and Momentum Strategies: Evidence from the
Johannesburg Stock Exchange, Investment Analysts Journal, 51, (2000),
14-22.
[14] J. C. Hsu, Cap-Weighted Portfolios are Sub-Optimal Portfolios, Journal of
Investment Management, 14(3), (2006), 1-10.
[15] South African Reserve Bank Annual Economic Report, 1998.
[16] South African Reserve Bank Annual Economic Report, 2001.
[17] South African Reserve Bank Annual Economic Report, 2002.
[18] South African Reserve Bank Annual Economic Report, 2003.