
Testing Uncovered Interest Rate Parity: The Case of HungaryBilson (1981) analyses uncovered interest...
35
CEU eTD Collection Testing Uncovered Interest Rate Parity: The Case of Hungary By Sophio Bendiashvili Submitted to Central European University Department of Economics In partial fulfillment of the requirements for the degree of Master of Arts Supervisor: Professor Robert Lieli Budapest, Hungary 2011
Transcript of Testing Uncovered Interest Rate Parity: The Case of HungaryBilson (1981) analyses uncovered interest...

CE
UeT
DC
olle
ctio
n
Testing Uncovered Interest Rate Parity:
The Case of Hungary
By Sophio Bendiashvili
Submitted to
Central European University
Department of Economics
In partial fulfillment of the requirements for the degree of Master of Arts
Supervisor: Professor Robert Lieli
Budapest, Hungary
2011

CE
UeT
DC
olle
ctio
n
i
Abstract
I propose three methods to investigate the validity of the Uncovered Interest Rate Parity (UIP)
condition in Hungary: (i) excess return investigation, (ii) the UIP regression equation, and (iii)
bivariate Vector Error Correction Model (VECM). Using one, five and ten year government
bond interest rates for Hungary (domestic), the European Central Bank (ECB), the Federal
Reserve Bank of the US (US), and the Weighted Average (WA) of the ECB and US interest
rates (foreign) depending on their contribution to Hungarian economy, I find out that the
results are quite mixed and ambiguous, varying depending on the methods and the time period
used for investigation. Generally, the conclusion is that the UIP condition in Hungary is more
likely to hold for one year interest rates in relationship with the European Central Bank
interest rates.
Key words: the uncovered interest rate parity, the UIP regression equation, bivariate VECM,
Excess return.

CE
UeT
DC
olle
ctio
n
ii
Acknowledgment
I would like to express special thanks to my supervisor Professor: Robert
Lieli, for his great support, advices and comments throughout the writing
of this thesis.
I am very grateful to my friends Alen Dzanic, Károly Godány, and Kálmán
G. Szabó for their help.

CE
UeT
DC
olle
ctio
n
iii
Table of Contents
Introduction ............................................................................................................................1
1. Literature Review ............................................................................................................4
2. Data description ..............................................................................................................8
3. Uncovered Interest Rate Parity (UIP)............................................................................ 10
4. Empirical Methodology ................................................................................................. 12
5. Empirical Evidence ....................................................................................................... 14
5.1 ADF and KPSS tests ............................................................................................... 14
5.2 Informal Check....................................................................................................... 16
5.3 UIP Regression Equation ........................................................................................ 18
5.4 Vector Error Correction Model ............................................................................... 21
6. Summary of the Results ................................................................................................. 25
Conclusion ........................................................................................................................... 28
References ............................................................................................................................ 30

CE
UeT
DC
olle
ctio
n
1
Introduction
The relationship between exchange rate and interest rate has been an active topic in
international economics already for decades; the condition that equalizes domestic (it) and
foreign interest rate (it*) spread with exchange rate yield is called, Uncovered Interest Rate
Parity condition (UIP). In simpler term, it means that investors compare returns on assets
based on their expectations of the depreciation rate. For example if investor invests in
domestic currency, the rate of return on investments will be (1+ it), while in case of investing
abroad the yield would be (1+𝑖𝑡∗)(𝑠𝑡+1
𝑒 𝑠𝑡 ), where 𝑠𝑡+1𝑒 is the future expected exchange rate
and 𝑠𝑡 is the spot exchange rate. Hence investors decide where to invest based on their
expectations about the future exchange rate since they need to convert the foreign currency
into the domestic currency. The UIP condition is motivated by ruling out arbitrage
opportunity across countries, and assumes that investors are risk neutral, and have rational
expectations about their investments.
Whether interest rate differential is an unbiased predictor of the exchange rate
movements (when the slope coefficient for interest rate spread in the UIP equation (equation
5) equals to unity) has been a matter of investigation by many researchers. The overall picture
of the UIP hypothesis is that in the short-run (less than 12 months) domestic and foreign
interest rate differential is very poor estimator of the exchange rate movements. Bilson (1981)
found negative slope coefficients and explained it, by the existence of foreign exchange risk
premium. McCallum (1994) suggests that, there is heterogeneity in the slope coefficient
depending on the exchange rate regime. It is widely found that the UIP hypothesis is rejected
because of excess returns on investments, which is also explained by Lewis (1994) as the
foreign exchange rate risk premium, and the market inefficiency.

CE
UeT
DC
olle
ctio
n
2
According to the literature the UIP condition is likely to hold at longer (more than one
year) maturity interest rates. Chinn and Meredith (2005), Chinn (2006) found positive slope
coefficient, close to unity especially for Netherlands and Switzerland versus the US.
For my investigation I use one, five and ten year government bond interest rates for
Hungary (Hungary) versus the same maturity European Central Bank (ECB), Federal Reserve
bank (Fed) and the weighted average (WA) of the foreign interest rates (foreign), according to
their contribution to Hungarian economy.
Testing the uncovered interest rate parity condition in Hungary is especially
interesting because of transition period to European Union, switching from crawling peg to
the floating exchange rate regime and full capital liberalization on May, 2001. The aim of the
paper is to estimate the validity of the UIP condition in Hungary, using different methods over
the period of May, 2001-December, 2010.
. First, as a precondition for the following methods to make sense, I test the unit-root
processes in the domestic interest rates (it), foreign interest rates (i*t), forward premium (it-i
*t),
exchange rates (st), and the exchange rates yields (∆st). Second, I use three different methods
to investigate the uncovered interest rate parity condition: (i) Using it,k - i*t,k- ∆St,t+k
differential, the first method visualizes on the graph the process of excess return, where
∆St,t+k is the log exchange rate yield, and it,k , i*t,k are domestic and foreign interest rates
respectively. (ii)The second method embodies the uncovered interest rate parity condition into
the regression equation. The UIP equation investigates whether domestic and foreign interest
rate differential is an unbiased estimator of the exchange rate yield, in other word, whether
interest rate spread and the exchange rate yield are equalized. (iii) Third method is bivarite
Vector Error Correction Model (VECM), which investigate the co-integrating relationships
between domestic and foreign interest rates, implied by the UIP equation. For VECM and the

CE
UeT
DC
olle
ctio
n
3
UIP regression equation the sample is divided into two periods, whole time period (May,
2001-December, 2010), and the period after the EU accession (May,2001-December, 2010) in
order to investigate the difference in Hungarian interest rate market between the two periods.
Overall picture of the results looks quite mixed and ambiguous. The excess return
investigation reports that the only evidence in favor of the uncovered interest rate parity is for
one year interest rates between Hungary versus the European Central Bank and the weighted
average interest rates. The UIP regression equation states no evidence to support the UIP
condition in Hungary. However, VECM contradicts the UIP regression equation and states
that the only evidence in favor of the UIP condition in Hungary is during the second half of
the sample for one year interest rates for Hungary versus the ECB and the WA interest rates.
Hence, the result differs depending on the methods, and the sample periods.
The paper is structured in the following way: Section 1 reviews literature, with several
interesting developments about the uncovered interest rate parity during the last decades being
discussed. Section 2 presents data description. Section 3 Reviews the uncovered interest rate
parity, summarizes the UIP condition and states the regression equation. Section 4 presents
empirical methodology, and describes separately each methodology used for investigation.
Section 5 provides the results for each method. Section 6 discusses, summarizes and gives
economic intuitions based on the obtained results. The paper ends with the conclusion.

CE
UeT
DC
olle
ctio
n
4
1. Literature Review
The overall impression about the uncovered interest rate parity puzzle is that, the UIP
condition is more likely to hold in the long-run than, in the short-run. The deviation from the
UIP condition in the short-run is the result of exchange rate risk premium in the country,
however, in the long-run the consistent results for the UIP condition are driven by the fact
that, the exchange rates are determined by the economic fundamentals (Chinn and Meredith,
2005).
Bilson (1981) analyses uncovered interest rate parity condition by using one,three six
and twelve months forward rates for nine currencies, (US, Canada, Swiss, UK, Belgium,
France, Germany, Italy, Netherlands, and Japan) over the period of 1974-1980 years. The
author finds that the Hypothesis (b=1) for UIP equation is strongly rejected. The slope
coefficient is negative in all cases. The result implies that the spot exchange rate is a better
estimator of future spot rates than forward rate, since the first differences of exchange rates
are serially uncorrelated and behave like a random walk without drift. Longworth (1981)
supports Bilson’s finding about the failure of the UIP condition. The author examines US and
Canadian 30-day rates, and finds that, almost each year’s spot rate offered a better forecast for
future spot rate, than did the current forward rate.
Froot and Thaler (1990) provide possible explanations about deviations from UIP
condition (when b≠1). According to the authors, there are two possible interpretations when
b<1. It is the result of time varying exchange rate risk premium, or expectation errors under
the assumption of risk neutrality and that the exchange rate risks are fully diversifiable. Under
time varying risk premium when b≠1 interest rate movements are driven by changes in
exchange rate risk premium. For example when b<1, a one percentage increase in interest rate
differential between countries leads to less than one percent expected depreciation in domestic

CE
UeT
DC
olle
ctio
n
5
currency. Under Expectation errors risk premium is constant, so the change in interest rate
differential fully reflects the expected change in the exchange rate.
Lewis (1994) presents a survey about excess return puzzle. The author estimates
USD/DM and USD/ JPY rates over the 1975-1989 years, for short term financial instruments
(less than 12 months). He rejects UIP hypothesis and claims that the excess returns are the
result of foreign exchange risk premium, and market inefficiency.
McCallum (1994) argues that the deviation from UIP condition can be the result of
monetary policy behavior. Using Dollar exchange rates against Yen, British Pound and DM
for short-term interest rates, the author found out that the UIP condition is regime dependent.
The UIP failure is the outcome of monetary policy regime to smooth interest rates and actions
against high exchange rate volatility.
Flood and Rose (2002) study uncovered interest rate parity for 13 developed and 10
developing countries during the 1990s. Most of these countries overcame the currency crisis
in 1990s: Finland, Italy, Sweden, and the United Kingdom from developed countries and
Argentina, Brazil, the Czech Republic, Hong Kong SAR, Indonesia, Korea, Malaysia,
Mexico, Russia, and Thailand from developing countries. They took high frequency data
(daily) and used Germany as core currency for European countries, and the United States for
the rest of the countries including Germany. The authors found that, the UIP condition works
better after 1990s (the slope coefficient of UIP regression is close to unity), which implies that
high interest rate currencies started to depreciate during the crisis. Also they discovered
heterogeneity in slope coefficient, especially according to the exchange rate regime. For
floating regime it is constantly better (close to one) than for fixed. The authors could not find
any significant difference between developed and developing countries.

CE
UeT
DC
olle
ctio
n
6
Bruggemann and Lutkepohl (2005) investigate short (3month financial instrument
rates) and long-term (10year bond rate) relationship between exchange rate and interest rate of
the US and the Euro area over the period of January, 198- December, 2004. The analysis is
based on univariate unit root test and VECM. The results supports UIP condition for all four
interest rates (US short and long term, Euro area short and long term rates). The authors found
that the interest rates follow non-stationary process, while US and Euro area interest rates
spread is stable over time. The authors also found strong evidence about European interest
rate dependence on the US interest rate changes but not vice versa.
Chinn and Meredith (2005) investigate both short (up to 12month) and long (5year
yields) term interest rates, and its relationship with exchange rate movements for the US,
Canada, Germany and the UK over the period of 1980-2000. The authors find results for
short-term interest rates, similar to most of the other authors. The average slope coefficient of
UIP equation is about -0.8, which is consistent with Froot and Thaler’s (1990) finding. On the
other side long-term bonds give more promising results, compared to the commonly rejected
UIP condition in the short-run. The slope coefficient of UIP equation has a correct sign and is
close to unity. Especially for Canadian and German currencies, the slope coefficient is very
close to one, (1.1 and 0.9 respectively). The authors specify that the failure of UIP in the short
run is the outcome of exchange rate risk premiums. However in the long run excepted
changes in the exchange rate are determined by economic “fundamentals”, which makes the
relationship between exchange rate and interest rates consistent with the uncovered interest
rate parity condition.
Chinn (2006) investigates non-G7 developed countries (Denmark, Finland, Ireland,
Spain, Norway, Netherlands, Sweden and Switzerland) over the period of 1996-2004 and the
UIP equation is based on 5-year government bonds. The results of the regression implies that

CE
UeT
DC
olle
ctio
n
7
the slope coefficients for Netherlands and Switzerland are statistically significant and close to
unity while the hypotheses (b=1) for other countries are rejected.
Weber (2010) examined US, European relationship based on long-run interest rate
equilibrium. The data contains monthly 10 year government bond rates over the period of
January, 1990-June, 2006. The analysis is based on a backward recursive estimation of co-
integration and trivariate VECM. The paper shows that since the middle of 1990s, the UIP
condition does not hold any more, which is explained by central banks reactions on interest
rate volatilities, intended to establish a common currency in the Euro area. Through trivariate
VECM (interest rates and exchange rate) stationary long-term equilibrium is established,
which is explained by the common stochastic trend for European interest rates and Eurodollar
rates, which is again driven by central bank reactions.

CE
UeT
DC
olle
ctio
n
8
2. Data description
Domestic interest rates are monthly averages of one, five, and ten year Hungarian
government bonds rates. The same maturity foreign interest rates are measured in three
different ways: (i) the European Central Bank (ECB) bond rates, (ii) the US Federal
Government Security rates and (iii) the weighted average of ECB and US rates (WA)
according to their contribution to Hungarian economy.1 Exchange rates are end of the month
rates, measured by one unit of EUR, USD and their WA value in Hungarian forint. All the
data used in the paper, is publicly available from the National Bank of Hungary, the Federal
Reserve Bank of the US and the European Central Bank.
The time horizon of the analysis is from May, 2001 till December 2010. The
beginning date was chosen, in order to avoid a regime changes in the exchange rate. In
particular, Hungary’s monetary policy went from crawling peg to the floating exchange rate,
which was preceded by the full capital liberalization (Arvai, 2005).
For the following calculations exchange rates are transformed to logarithm and then
taken the first difference in order to create monthly returns, for interest rates no changes are
applied. Table 1 presents descriptive statistics of the interest rates, it shows that the ECB bond
rates have the least variations for all three maturities, and Hungarian bond rates are the most
unstable. Table 2 introduces descriptive statistics for the exchange rates; it gives quite big
standard deviations for all three exchange rates. The high variance in exchange rate implies
that during the sample period, there was high volatility in exchange rate yields. The highest
standard deviation, 9.59 has Ft/USD, which means that during the sample period the EUR is
more stable in relationship with Ft compared to USD.
1 Weighted average of US and ECB rates are calculated according to foreign direct investment by these
countries to Hungary (EU-91%, US-9%)

CE
UeT
DC
olle
ctio
n
9
Overall picture of descriptive statistics shows that the variances of the exchange rates
are much higher than the variance of the different maturity interest rates. The finding might be
explained by the volatility of the forward premium in Hungarian foreign exchange market,
which creates obstacles for the uncovered interest rate parity to hold.
Table 1
Descriptive statistics Government bond rates: Hungary versus European Central Bank, the United States and their weighted
average.
Time horizon: Full Sample: 2001.05-2010.12
Hungary ECB USA WA
1 year rates Mean 8.25 2.67 2.36 2.62
Median 8.18 2.64 2.12 2.72 Max. 12.7 4.6 5.22 4.39
Min. 4.96 0.32 0.23 0.32
Std.Dev. 1.81 1.2 1.59 1.17
5 year rates
Mean 7.86 3.42 3.44 3.43
Median 7.48 3.5 3.43 3.5
Max. 10.78 4.9 5.1 4.91 Min. 5.46 1.62 1.18 1.61
Std.Dev. 1.15 0.78 1.02 0.76
10 year rates Mean 7.47 4.04 4.15 4.05
Median 7.27 4.01 4.18 4.02
Max. 10.45 5.3 5.39 5.32
Min. 5.44 2.68 2.42 2.68 Std.Dev. 0.94 0.58 0.68 0.56
Table 2
Descriptive statistics Log, first differenced exchange rates: Hungary versus USD, EUR, and WA Time horizon: Full Sample: 2001.05-2010.12
Ft/EUR Ft/USD Ft/WA
Mean 0.22 -0.78 0.06
Median -0.29 -1.67 -1
Max. 30.15 41.79 37.14 Min. -21.7 -23.1 -21.9
Std.Dev. 6.65 9.59 7.25

CE
UeT
DC
olle
ctio
n
10
3. Uncovered Interest Rate Parity (UIP)
The Uncovered Interest Rate Parity (UIP) condition rules out the arbitrage opportunity
by equalizing domestic (it ) and foreign interest rate (i*t) spread with exchange rate yield. The
simplest UIP equation under the assumption of the risk neutrality is as follows:
∆𝑠et,t+k=(it,k-i*t,k) (1),
where ∆𝑠et,k defines expected percentage change in the exchange rate, and it, i*t are domestic
(Hungary) and foreign (ECB, US, WA) interest rates respectively, t is spot period and k is the
future period. The equation (1) assumes no-arbitrage opportunity between countries, which
implies that the changes in exchange rate and interest rate spread are in equilibrium and there
is no room left for earning extra money, by investing across countries.
If investors are risk averse, equation (1) does not hold any more. Hence the forward
discount rate (it,k-i*t,k) can be different from the future spot rate (∆𝑠et,t+k,), depending on the
perceived risk of domestic versus foreign assets (Chinn, Meredith, 2005). The inequality
between domestic and foreign interest rate differential and the expected exchange rate yield,
leads the equation (1) taking the following form:
∆set,t+k = (it,k - i*t,k) + ƞt.t+k (2),
where the term ƞt.t+k refer to the risk premium demanded from risk averse investors, in order
to compensate for the risk of the given financial instrument. However expected exchange rate
yields are not observable, hence equation (2) cannot be tested. Engel (1995) suggested to test
the UIP condition together with the rational expectations, where investors efficiently use all
the information available at time t, to predict the market movements at time t+k, and came up
with the equation for the future spot rate:
st,t+k = set,t+k + ζt,t+k (3)

CE
UeT
DC
olle
ctio
n
11
Where the term 𝑠et,t+k refers to the future expected exchange rate under the rational
expectations, and ζt,t+k is a white noise process, uncorrelated with the interest rate differential
and the spot exchange rate at time t.
Combining equations (2) and (3), gives the future realized change in exchange rate as
∆𝑠t,t+k = (it,k - i*t,k) + ƞt.t+k- ζt,t+k (4)
which can be transformed into the uncovered interest rate parity (UIP) equation, under the
assumptions that ƞt.t+k, ζt, t+k terms are orthogonal to the interest rate spread (Chinn, Meredith,
2005), and the risk premium is stable over time2. The equation (5) represents the final UIP
regression,
∆St,t+k =α +β (it,k - i*t,k ) +ɛt,t+k (5)
where ɛt,t+k is white noise process and the null hypothesis of the UIP is β=1. In case β≠1the
null hypothesis fails, this implies that the interest rate differential is a biased estimator of the
future spot exchange rate.
If ∆St,t+k follows the stationary process (I(0)) and the domestic and foreign interest
rates behave like non-stationary I(1) processes, equation (5) implies that the domestic and
foreign interest rates are co-integrated with the co-integration vector (1,-1).
2 However Engel (1987) found significant evidence for time varying risk premium, but it is beyond the
scope of this paper .

CE
UeT
DC
olle
ctio
n
12
4. Empirical Methodology
I investigate the validity of the uncovered interest rates parity in Hungary over the
period of May, 2001- December, 2010 in several ways:
(i) As a precondition for some of the following methods to make sense, Using
Augmented Dickey Fuller (ADF) and KPSS tests I investigate unit-root processes for the
different maturity domestic interest rates (it), foreign interest rates (i*t), forward premium (it-
i*t), exchange rates (St,) and exchange rate yields (∆St,t+k), with the null hypothesis of non-
stationarity and stationarity respectively. Usually financial data follows non-stationary
process, which implies that the time-series contain trend or random walk. Hence in order not
to get spurious results from the following methods it is necessary domestic interest rate,
foreign interest rates, and the exchange rate to be integrated of order one I(1) and forward
premium and the exchange rate yield follow stationary process I(0). Using two tests of the
unit-root gives the paper advantage to double check the reliability of the results, since it is
widely accepted by the econometricians that the power of ADF and KPSS tests is not high
enough.
(ii), in order to visualize the process going on between Hungary and EU, as an
informal check I show on the graph whether the exchange rate changes minus domestic and
foreign interest rate differential (∆St,t+k - it,k - i*t,k) is stable over time. If in Hungary UIP
condition holds, excess return on investment must be stochastic process.
(iii) The second way of checking the UIP condition is through the UIP regression
equation (5), with the null hypothesis β=1. If the null hypothesis holds, domestic and foreign
interest rate differential is an unbiased estimator of the exchange rate yield, hence the interest
rate spread is equalized with the exchange rate yield, and the uncovered interest rate parity
holds.
CE
UeT
DC
olle
ctio
n
13
(iv) I use bivariate Vector Error Correction Model (VECM), which puts together short
and long-run relationships of the domestic and foreign interest rates. VECM measures the
correction of last period’s deviation from equilibrium and co-integrating relationships
prevents error term to become larger and larger in the long-run. The VECM equation, using
one lag for simplicity, looks as follows:
∆i𝑡∆i𝑡
∗ = β1 ∆i𝑡−1
∆i𝑡−1∗ + п
𝑖𝑡−1
i𝑡−1∗ + 𝜀𝑡 (7)
where β1 is 2x2 matrix and presents the short run effect, п is also 2x2 matrix, which equals
zero in case of no-co-integration between interest rates, and п = 𝑎11 𝑎12
𝑎21 𝑎22 x b11 b12 if there
is one co-integration vector, where 𝑎 is adjustment speed after the last period’s disequilibrium
and (b11 b12) is the co-integration vector (Johansen, 1995).

CE
UeT
DC
olle
ctio
n
14
5. Empirical Evidence
5.1 ADF and KPSS tests
First I present the results of unit-root tests described in section 3 part (i).Table 3,4 and
5 show the ADF and KPSS test results for all one, five, and ten year domestic(it) interest rates,
foreign (i*t) interest rates, forward premium (it- i
*t), exchange rates (St,), and the exchange rate
yield (∆St,t+k). Table 3 shows that both the ADF and KPSS tests report unit-root processes for
all three maturity interest rates, thus I can use the results for father investigation.
Table 3
ADF and KPSS tests
Domestic and foreign interest rates
Time horizon: 2001.05-2010.12;
Lag length: 3
ADF statistic LM-Stat
1 Year
Hungary -2.45
(0.13) 0.56**
ECB -1.47
( (0.54) 0.94***
USA -1.15 (0.69)
0.62**
WA -1.4
(0.58) 0.88***
5 year
Hungary -2.73
(0.09) 0.11**
ECB -1.88 (0.33)
1.09***
USA -1.95
(0.3) 0.48**
WA -2.08 (0.25)
0.53**
10 year
Hungary -2.47 (0.12)
0.36*
ECB -2.22
(0.19) 1.26***
USA -2.26 (0.18)
1.36***
WA -2.21
(0.2) 1.27***
*/**/*** denotes rejection of the hypothesis at 10%,5% and 1% respectively
P-Values in parenthesis

CE
UeT
DC
olle
ctio
n
15
Table 4 stands for the domestic (H) and foreign (ECB; USA; WA) interest rate
differentials (it-i*t), ADF and KPSS tests suggest the stationary process in Hungary versus the
ECB and the WA (H-ECB; H-WA) cases for one year government bonds, while accepting
unit-root processes for the rest of the cases. Depending on the results, it is not expected the
UIP condition to hold for five and ten year interest rates, since by the definition of non-
stationarity, the excess return is never predictable. However it is expected the UIP condition
to hold for one year government bond interest rates in relationship with the ECB and the WA.
Table 4
ADF and KPSS tests
Domestic (Hungary) and foreign (ECB, US, WA) interest rate differential
Time horizon: 2001.05-2010.12; Lag length: 3
ADF statistic LM-Stat
1 Year
H-ECB -2.64***
(0.08) 0.18
H-USA -2.11
(0.24) 0.36*
H-WA -2.7* (0.06)
0.19
5 year -2.46
(0.12) 0.53**
H-ECB -2.31
(0.17) 0.51**
H-USA -2.47
(0.12) 0.51**
H-WA
10 year
H-ECB -2.17 (0.22)
1.15***
H-USA -2.17
(0.22) 0.93***
H-WA -2.17 (0.22)
1.14***
*/**/*** denotes rejection of the hypothesis at 10%,5% and 1% respectively
P-Values in parenthesis
Table 5 shows the unit- root tests for exchange rates, exchange rate yields and states
that the KPSS test rejects stationary process for all three (Ft/EUR; Ft/USD; Ft/WA) exchange
rates at one percent level, though ADF test rejects the unit-root processes for Ft/EUR and
Ft/WA at ten and five percents levels respectively. Since both tests show that all three first

CE
UeT
DC
olle
ctio
n
16
differences (∆Ft/EUR; ∆Ft/USD; ∆Ft/WA) follow stationary process, I can use the results for
excess return investigation, the UIP regression equation and the bivariate vector error
correction model, in order to investigate the validity of the UIP condition in Hungary.
Table 5
ADF and KPSS tests
Exchange rates and Exchange rate differetials
Time horizon: 2001.05-2010.12;
Lag length: 3
ADF statistic LM-Stat
Ft/EUR -2.67*
(0.08) 1.28***
Ft/USD -2.42
(0.14) 1.55***
Ft/WA -3**
(0.037) 0.84***
∆Ft/EUR -6.24***
(0) 0.038
∆Ft/USD -5.35***
(0) 0.24
∆Ft/WA -.6.14***
(0) 0.04
*/**/*** denotes rejection of the hypothesis at 10%; 5%; 1%
P-Values in parenthesis
5.2 Informal Check
The first way of testing the validity of the UIP condition is to check whether the
excess return (it,k - i*t,k- ∆St,t+k) in Hungary is stable over time. Since the EU contribution to
Hungarian economy is 90%, and it would be the best estimate to show the process, I take
Hungary versus the European Central Bank interest rates and Ft/EUR exchange rate. The
investigation shows whether the exchange rate yield minus domestic and foreign interest rate
differential follows the stationary process for one, five and ten year interest rates. The
hypothesis says that, if the excess return is stable over time, there is an implication for the
UIP condition to hold. The idea behind is that, since the time-series is stationary process, it
does not contain trend or random walk, hence it is predictable in sense that mean of the time-

CE
UeT
DC
olle
ctio
n
17
series always returns around to its long-term equilibrium and the variance stays constant over
time.
Figure 1
it,k - i*t,k-∆St,t+k: Hungary versus ECB interest rates and Ft/EUR exchange rate
Time horizon: Full Sample: 2001.05-2010.12;
Figure 1 stands for the unit-root processes for one, five, and ten year maturity excess
returns and shows that the only stationary process is presented for one year interest rates,
while five and ten year cases follow the unit-root process. The results imply that the one year
interest rate is a stochastic process without any specific trend, which is the condition for the
UIP to hold. The same in not true for five and ten year interest rates, the figure shows non-
stationary behavior of the time-seris during the sample period, which automatically excludes
the possibility for the UIP to hold.
0
2
4
6
8
10
12
01 02 03 04 05 06 07 08 09 10
EX_1Y EX_5Y EX_10Y

CE
UeT
DC
olle
ctio
n
18
Using ADF and KPSS test statistics, Table 6 supports the figure 1 by showing that,
the only stochastic process is conducted for one year interest rates, however the test statistics
strongly accept the unit-root processes for five and ten year interest rates.
Table 6
ADF and KPSS tests
it,k - i*t,k-∆St,t+k: Hungary versus ECB interest rates and Ft/EUR exchange rate for one, five and ten
year government bonds.
Time horizon: 2001.05-2010.12;
Lag length: 3
ADF statistic KPSS statistic
1 year -2.64*
(0.08) 0.17
5 year -2.44
(0.13) 0.51**
10 year -2.11 (0.24)
1.15***
*** denotes rejection of the hypothesis at 1%;
P-Values in parenthesis
*/**/*** denotes rejection of the hypothesis at 10%; 5%; 1%
P-Values in parenthesis
5.3 UIP Regression Equation
The second way of testing the validity of the UIP condition in Hungary is by
investigating the slope coefficient in the UIP regression equation (5) with the null hypothesis
β=1. The standard error in the regression is calculated by the Newey-West method, which
corrects for autocorrelation in the residual (𝜀𝑡). The autocorrelation is quite common feature
for the financial data, since there is high probability for future interest and exchange rates to
be correlated with the last period’s rates. Bilson (1981) and Longworth (1981) found that the
spot exchange rates it the better estimator of future realized rate, than the future expected rate
is, since the exchange rates behave like random walk.
The Tables 7, 8, 9 show the results of the UIP regression equation for, one, five and
ten year government bond rates respectively. The evidence from Hungary shows the slope
coefficients for full sample are negative in most of the cases, or positive but insignificantly

CE
UeT
DC
olle
ctio
n
19
different from zero. In the case of Hungary versus USA, slope coefficient for ten year
government bond rate performs closest to the null hypothesis (β=1) and equals to 0.42,
however results are statistically not significant. Hence, for the whole sample period there is no
evidence for the UIP to hold in Hungary.
During the second half of the sample, (after the EU accession) statistically significant
results are in relationship with the EU and the WA, but higher than the null hypothesis (β=1).
The implication about the slope coefficient higher than one can be the global financial crisis
in 2007-2009, which made currency to depreciate (Figure 2) due to capital inflow slowdown
in Hungary.
Figure 2
Exchange rates: Ft/EUR; Ft/ESD; Ft/WA
Time horizon: May,2001- December, 2010
The conclusion that can be made from Tables 7, 8 and 9 is that, there is no statistically
significant evidence that suggest the uncovered interest rate parity to hold during the May,
2001- December, 2010 for one, five, and ten year maturity government bond interest rates.
120
160
200
240
280
320
01 02 03 04 05 06 07 08 09 10
Ft/EU Ft/USD FT/WA

CE
UeT
DC
olle
ctio
n
20
The results are in line with Lewis (1984), and state that the interest rate spread is a very poor
predictor of the exchange rate yields.
Table 7
Testing Uncovered Interest Rate Parity
Regression equation: ∆St,t+k = ɑ + β (it,k - i*t,k ) +ɛt,t+k
1 year government bond rates: Hungary versus European Central Bank and the United States Time horizon: Full Sample: 2001.05-2010.12; Sub Sample: 2004.05-2010.12
β Std.error t-stat
Full Sample
H-ECB -0.344 0.33 -1.03
H-USA -0.21 0.35 -0.6
H_WA -0.4 0.36 -1.11
Sub Sample
H-ECB 2.83 0.85 3.33***
H-USA -0.16 0.81 -0.2
H-WA 3.06 0.92 3.3***
* denotes rejection of the hypothesis at the 0.01 level
Table 8
Testing Uncovered Interest Rate Parity
Regression equation: ∆St,t+k = ɑ + β (it,k - i*t,k ) +ɛt,t+k
5 year government bond rates: Hungary versus European Central Bank and the United States
Time horizon: Full Sample: 2001.05-2010.12; Sub Sample: 2004.05-2010.12
β Std.error t-stat
Full Sample
H-ECB -0.45 0.48 -0.93
H-USA 0.01 0.52 0.03 H_WA -0.41 0.53 -0.78
Sub Sample
H-ECB 5.78 1.12 5.14***
H-USA 0.53 1.11 0.48 H-WA 6.058 1.24 4.9***
*** denotes rejection of the hypothesis at the 0.01 level
Table 9
Testing Uncovered Interest Rate Parity
Regression equation: ∆St,t+k = ɑ + β (it,k - i*t,k ) +ɛt,t+k
10 year government bond rates: Hungary versus European Central Bank and the United States
Time horizon: Full Sample: 2001.05-2010.12; Sub Sample: 2004.05-2010.12
β Std.error t-stat
Full Sample
H-ECB -0.03 0.6 -0.05
H-USA 0.42 0.66 0.63
H_WA 0.09 0.66 0.14
Sub Sample
H-ECB 9.64 1.4 6.8***
H-USA 1.77 1.43 1.23 H-WA 10.06 1.56 6.42***
*** denotes rejection of the hypothesis at the 0.01 level
CE
UeT
DC
olle
ctio
n
21
5.4 Vector Error Correction Model
As it was described in section 3 part (iv), when ∆St,t+k is I(0) process and it,k , i*t,k are
I(1) processes, the equation (5) implies that there exists co-integrating relationship between
domestic and foreign interest rates with the co-integration vector (1,-1). Therefore depending
on the UIP regression equation, under (1, -1) co-integration vector between the domestic and
foreign interest rates the UIP condition holds in Hungary.
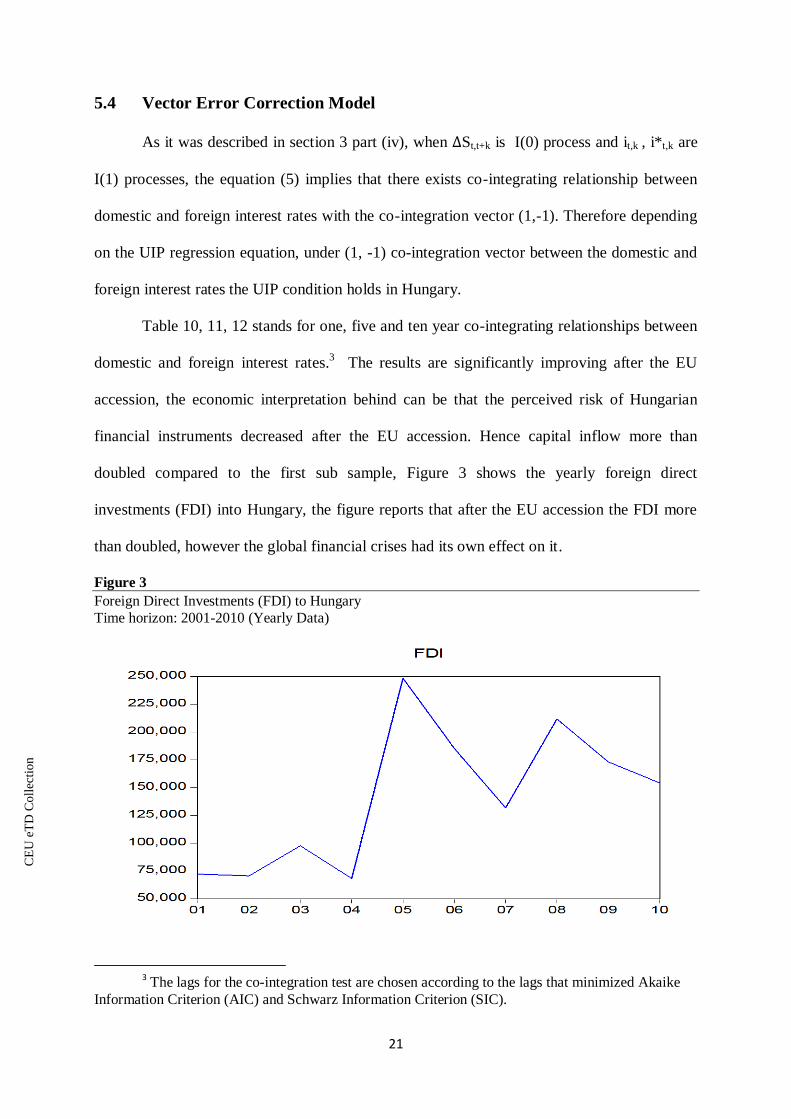
Table 10, 11, 12 stands for one, five and ten year co-integrating relationships between
domestic and foreign interest rates.3 The results are significantly improving after the EU
accession, the economic interpretation behind can be that the perceived risk of Hungarian
financial instruments decreased after the EU accession. Hence capital inflow more than
doubled compared to the first sub sample, Figure 3 shows the yearly foreign direct
investments (FDI) into Hungary, the figure reports that after the EU accession the FDI more
than doubled, however the global financial crises had its own effect on it.
Figure 3
Foreign Direct Investments (FDI) to Hungary
Time horizon: 2001-2010 (Yearly Data)
3 The lags for the co-integration test are chosen according to the lags that minimized Akaike
Information Criterion (AIC) and Schwarz Information Criterion (SIC).

CE
UeT
DC
olle
ctio
n
22
The increasing foreign direct investment supported the decline in interest rates, which
were more in line with the appreciated currency at that time for one year interest rates; even
though the global financial crisis in 2007-2009 forced interest rate increase and the currency
depreciation. Figure 4 shows the development of one, five and ten year Hungarian
government bond interest rates, and shows that the interest rates are very sensitive to capital
inflows, especially for one year interest rates.
Figure 3
One five and ten year Hungarian government bond interest rates
Time horizon: May, 2001- December, 2010
This result contradicts the finding of Bruggemann and Lutkepohl (2005), Chinn and
Meredith (2005) that, the UIP condition holds better in the long-run, because in the long-run
interest rates and exchange rates are driven by the economic fundamentals. However, it is in
line with the finding of Weber (2010) that, in the case of ten year government bonds the UIP
condition does not hold, and interprets the results as an outcome of the Central Bank reactions
on interest rate volatilities in favor of establishing the Euro currency.
4
5
6
7
8
9
10
11
12
13
01 02 03 04 05 06 07 08 09 10
H_1Y H_5Y H_10Y

CE
UeT
DC
olle
ctio
n
23
Table 10
Bivariate Co-integration test 1 year government bonds: Hungary versus European Central Bank and the United States
Time horizon: Full Sample: 2001.05-2010.12; Sub Sample: 2004.05-2010.12
Lag length: 3
P-Value Co-integration Vector
Full Sample
r=0 r=1 Hungary ECB
H-ECB 0.16 0.12 1 -0.78
(0.45)
Hungary USA
H-USA 0.53 0.3 1 -0.12
(0.44)
Hungary WA
H-WA 0.13 0.12 1 -0.8
(0.45)
Sub Sample
r=0 r=1 Hungary ECB
H-ECB 0.006 0.11 1 -1.09 (0.29)
Hungary USA
H-USA 0.36 0.66 1 -0.57
(0.39) Hungary WA
H-WA 0.01 0.1 1 -1.07
(0.31) Std. error in parenthesis
Table 11
Bivariate Co-integration test
5 year government bonds: Hungary versus European Central Bank and the United States
Time horizon: Full Sample: 2001.05-2010.12; Sub Sample: 2004.05-2010.12 Lag length: 3
P-Value Co-integration Vector
Full Sample
r=0 r=1 Hungary ECB
H-ECB 0.16 0.05 1 -0.01
(0.53)
Hungary USA
H-USA 0.23 0.1 1 0.11
(0.4)
Hungary WA

CE
UeT
DC
olle
ctio
n
24
H-WA 0.18 0.06 1 -0.1
(0.55)
Sub Sample
r=0 r=1 Hungary ECB
H-ECB 0.11 0.06 1 -0.66 (0.57)
Hungary USA
H-USA 0.46 0.35 1 0.1
(0.4)
Hungary WA
H-WA 0.14 0.08 1 -0.58
(0.59)
Std. error in parenthesis
Table 12
Bivariate Co-integration test
10 year government bond rates: Hungary versus European Central Bank and the United States
Time horizon: Full Sample: 2001.05-2010.12; Sub Sample: 2004.05-2010.12 Lag length: 3
P-Value Co-integration Vector
Full Sample
r=0 r=1 Hungary ECB
H-ECB 0.22 0.05 1 0.83
(0.74)
Hungary USA
H-USA 0.13 0.03 1 1.02
(0.48)
Hungary WA
H-WA 0.23 0.05 1 0.89
(0.77)
Sub Sample
r=0 r=1 Hungary ECB
H-ECB 0.27 0.03 1 -2.15
(1.12)
Hungary USA
H-USA 0.38 0.08 1 0.97
(0.51)
Hungary WA
H-WA 0.31 0.03 1 -1.2
(1.07)
Std. error in parenthesis

CE
UeT
DC
olle
ctio
n
25
6. Summary of the Results
As it is described in section 5, the results are quite mixed and ambiguous depending on the
methods and the time period used for investigation. In this section I summarize the results for
each method.
As it is described in section 5.1, as a precondition for the following methods to make
sense I tested unit-root processes for domestic interest rates, foreign interest rates, forward
premium, exchange rate, and exchange rate yield. The results show that all three interest rates
are I(1) process, the one year forward premium, Hungary versus the ECB and the WA are I(0)
process, and five and ten year forward premiums follow unit-root process. Therefore it is
expected that the UIP condition only holds for one year government bond interest rates.
The exchange rate investigation follows the theory and reports that the all three exchange
rates are I(1) processes, while exchange rate yields are I(0). The finding supports the
following methods used for testing the UIP condition in Hungary.
The first method investigates the excess returns on Hungarian versus the European Central
Bank interest rates for one, five and ten year government bonds. Both the figure and the unit-
root tests show that the one year excess return follows a stationary process; hence there is an
implication for the UIP condition. The result might be implied by the fact, that the trade
volume of one year government bonds is about three times bigger (National Bank of
Hungary) than that of five and ten year bonds. Hence the perceived risk of one year
government bonds is much lower and the demand is much higher, which eliminates arbitrage
opportunity for one year interest rates in the country.
The second method used for investigation, is by estimating the UIP regression equation
(equation 5), in other words, testing “the Unbiasedness Hypothesis”. “The Unbiasedness
Hypothesis” implies that, if the results are consistent with the hypothesis β=1, domestic and

CE
UeT
DC
olle
ctio
n
26
the foreign interest rate differential is an unbiased estimator of the exchange rate yield. The
results are statistically significant only for sub sample (after the EU accession) in relationship
with the ECB and the WA; however the slope coefficient is more than unity. The implication
behind β>1 can be the global financial crisis in 2007-2009, which made the Hungarian Forint
to depreciate as a result of decline in foreign direct investments in Hungary. However, testing
the UIP regression equation in Hungary states that the forward premium (it-i*t) is a very poor
predictor of the exchange rate yield (∆set+k), hence there is no evidence for the UIP condition
for any interest rates in Hungary.
The third method described in sub section 5.5, estimates the UIP condition with the
help of bivariate Vector Error Correction Model (VECM). Sample is divided into two parts,
whole sample and after the EU accession. The co-integration vectors provided by the VECM
contradict the UIP regression equation, and present that the UIP condition is more likely to
hold during the second half of the sample in relationship with the European Central Bank and
the Weighted Average interest rates.
The economic implication behind the result can be that the market efficiency is getting
better off from the second half of the sample, which can be explained by the loosening control
of capital movements in the country especially with the European Union. Apparently the EU
accession decreased the perceived risk of Hungarian financial instruments; even though the
accession was anticipated well ahead. Also economic situation in Hungary was affected by
the global financial crisis during the sub sample, which forced Forint to depreciate and made
the exchange rate yield more in line with the forward premium especially for one year interest
rates.
The evidence in favor of the UIP condition in Hungary is quite ambiguous and differs
depending on the method and the sample period used for investigation. Testing the excess

CE
UeT
DC
olle
ctio
n
27
returns for whole sample supports the UIP condition in relationship with the EU and the WA
for one year interest rates. The UIP regression equation states no evidence for the UIP
condition to hold and shows that the only significant slope coefficients are higher than unity
explained by the financial crisis in 2007-2009. However the bivariate VECM contradicts the
UIP regression equation, and presents the evidence in favor of the UIP condition, explained
by the decreased perceived risk of Hungarian financial instruments and the effect of the global
financial crisis during the sub sample.
Around ninety percent of foreign direct investments in Hungary, and mostly all kind
of economic relationships are connected with the European Union, therefore currency and
interest rate volatilities highly depend on the EU movements.
Since the Weighted Average consists ninety percent of EU interest and exchange rates
and the ten percent of the US interest and exchange rates, the results for all the cases are in
line with the ECB results.
The advantage of one year government bonds in terms of the UIP condition is that
their trading volume is three times bigger than that of five and ten year bonds (The National
Bank of Hungary). The high demand on government bonds eliminates the opportunity of
getting higher excess returns, thus there stays no room for arbitrage.
CE
UeT
DC
olle
ctio
n
28
Conclusion
Using different methods, I found ambiguous results in favor of the uncovered interest rate
parity condition in Hungary. The results differ according to the methods and the sample
period taken for the estimation. I use monthly data for one, five and ten year government bond
rates of Hungary (domestic), the European Central Bank (ECB), the Federal Reserve Bank of
the US and the Weighted Average (WA) of ECB and US (foreign), according to their
contribution to Hungarian economy (FDI). As an exchange rate I use Hungarian Forint value
of the EUR, the USD and the WA.
First, as a precondition I test unit-root processes in domestic interest rates, foreign interest
rates, forward premium, exchange rate and the exchange rate yield. The results imply that the
UIP condition is expected to hold only for one year government bonds in relationship with the
ECB and the WA. I use three different methods for investigation: (i) First method shows on
the figure the development of the excess returns (∆St,t+k –( it,k - i*t,k)) during the sample period
for different maturity government bonds. The Figure visualizes whether the exchange rates
yield (∆St,t+k), and the forward premium (it-i*t) differential follows stationary process. (ii) The
second method estimates the UIP regression equation (equation 5), and with the help of the
slope coefficient, investigates whether the exchange rate yield and the forward premium are
equalized (β=1). For the UIP regression equation the data are divided into two parts: whole
time period (May, 2001- December, 2010), and the period after the EU accession (May 2004-
December, 2010). (iii) Third method runs the bivariate Vector Error Correction Model
(VECM), and determines the co-integrating relationships between the different maturity
domestic and foreign interest rates for two time periods: whole sample and the sub sample
after the EU accession.

CE
UeT
DC
olle
ctio
n
29
The implications for the UIP condition in Hungary are quite mixed, and contradictory in
some cases. The excess return (i) supports the UIP condition for one year interest rates, in
relationship with the ECB and the WA.
The UIP regression equation (ii) reports the only statistically significant slope coefficient
for sub sample (after EU accession) in relationship with the EU and the WA. This can be
interpreted by Forint depreciation as a result of the global financial crisis during 2007-2009.
however the test does not show any evidence in favor of the UIP condition in Hungary.
The co-integration vectors (iii) imply the UIP condition during the sub sample (after the
EU accession), for one year interest rates in relationship with the EU and the WA. The results
are contradictory with finding of the UIP regression equation, but it can be interpreted as a
result of the decrease in perceived risk of Hungarian financial instruments after the EU
accession. The evidence was also encouraged by the currency depreciation in Hungary during
and after the global financial crisis.
As it is shown in the paper, the uncovered interest rate parity is more likely to hold for one
year interest rates, but because the results are quite ambiguous, the UIP condition in Hungary
remains puzzle. Therefore there is still room left for further investigation.

CE
UeT
DC
olle
ctio
n
30
References
Arvai, Zsofia, 2005, “Capital Account Liberalization, Capital Flow Patterns, and Policy
Responses in the EU's New Member States,” IMF Working Paper No. 05/213.
Asteriou, D. and S. G. Hall (2007). “Applied econometrics: A modern approach”. New York:
Palgrave Macmillan
Bilson,J. (1981), "The Speculative Efficiency Hypothesis, “Journal of Business, Vol.54
pp. 433-54
Brenner, R. J., and Kroner, K. F. (1995), "Arbitrage, Cointegration, and Testing the
Unbiasedness Hypothesis in Financial Markets," Journal of Financial and Quantitative
Analysis, 30, 23-42.
Brüggemann, R., Lütkepohl, H., 2005. “Uncovered interest rate parity and the expectations
hypothesis of the term structure: empirical results for the U.S. and Europe”. SFB 649
Economic Risk Discussion Paper 2005-035.
Chinn, M.D., Meredith, G., 2005. “Testing uncovered interest parity at short and long
horizons during the Post-Breton Woods era”. NBER Working Paper No. 11077.
Chinn, Menzie D. (2006), “The (Partial) Rehabilitation of Interest Rate Parity in the Floating
Rate Era: Longer Horizons, Alternative Expectations, and Emerging Markets," Journal
of International Money and Finance 25, 7-21.
Engel, R., 1996, The forward discount anomaly and the risk premium: A survey of recent
evidence, National Bureau of economic research.
Engle, R. F, D. M. Lilien, and R. P. Robins (1987): "Estimating Time Varying Risk Premia in
the Term Structure: The ARCH-M Model," Econometrica, 55, 391-408.
European Central Bank Bond rates (1, 5 and 10 years) over the period of 1999Jan-2010Dec
http://sdw.ecb.europa.eu/quickview.do?SERIES_KEY=143.FM.M.U2.EUR.4F.BB.R_
U2_10Y.YLDA&periodSortOrder=ASC
Fama, Eugene F. "Forward and Spot Exchange Rates," J. Monet. Econ., Nov. 1984, 14(3), pp.
319-38.
FDI in Hungary during 2001-2010: www.mnb.hu
Flood, Robert B., and Andrew K. Rose (2002) “Uncovered interest parity in crisis”,
International Monetary Fund Staff Papers 49, 252-66
Frankel, J.A., Poonawala, J., 2006. “The forward market in emerging currencies less biased
than in major currencies”. NBER Working Paper No.12496
Froot, K. A., and R. H. Thaler, 1990, "Anomalies: Foreign Exchange," Journal of Economic
Perspectives, 4, 179-192.

CE
UeT
DC
olle
ctio
n
31
Hungarian Government bond rates (1, 5 and 10 years), Exchange rates and foreign direct
investments over the period of 1999Jan-2010Dec-
http://english.mnb.hu/Statisztika/data-and-information/mnben_statisztikai_idosorok
Johansen, S. (1988a): "Statistical Analysis of Co-integration Vectors," Journal of Economic
Dynamics and Control, 12, 231-255.
Lewis, Karen. "Puzzles in International Financial Markets," in Gene Grossman and Ken-Neth
Rogoff, eds. 1995.
Longworth, David, "Testing the Efficiency of the Canadian-U.S. Exchange Market Under the
Assumption of No Risk Premium," Journal of Finance, Vol. 36 (March 1981), pp. 43-
49
.
McCallum, B.T., 1994a. “A reconsideration of the uncovered interest parity relationship”.
Journal of Monetary Economics 33, 105–132.
US Federal Government Securities rates (1, 5 and 10 years) over the perios of 1999Jan-
2010Dechttp://www.federalreserve.gov/econresdata/releases/statisticsdata.htm
Weber, E., “What happened to the transatlantic capital market relations”? Econ. Model.
(2010), doi:10.1016/j. econmod.2010.10.017


